Article

Organic-Inorganic Semiconductor Heterojunction P3HT@Ag2NCN Composite Film as a Recyclable SERS Substrate for Molecule Detection Application

1
Biomaterials R&D Center, Zhuhai Institute of Advanced Technology, Chinese Academy of Sciences, Zhuhai 519003, China
2
Shenzhen Institutes of Advanced Technology, Chinese Academy of Sciences, Shenzhen 518055, China
3
College of Materials Science and Engineering, Donghua University, 2999 North Renmin Road, Shanghai 201620, China
*
Author to whom correspondence should be addressed.
Chemosensors 2022, 10(11), 469; https://doi.org/10.3390/chemosensors10110469
Submission received: 11 October 2022 / Revised: 1 November 2022 / Accepted: 7 November 2022 / Published: 10 November 2022
(This article belongs to the Special Issue Nanocomposites for SERS Sensing)

Abstract

:
Semiconductor composite materials have attracted interest from surface-enhanced Raman scattering (SERS) substrate research. Here, we investigate an organic-inorganic semiconductor heterojunction P3HT@Ag2NCN composite film as a recyclable SERS substrate for molecule detection application. Our study shows that the SERS substrate of the composite P3HT@Ag2NCN composite film has high sensitivity, excellent signal reproducibility, and is reusable. Significant π-stacking of the probe molecules with the thiophene π-cores molecules from P3HT plays an important role in the large SERS enhancement by the charge transfer mechanism. Due to physical interaction between P3HT and Ag2NCN, the organic-inorganic semiconductor heterojunction structure further improves charge transfer efficiency and the SERS property. Our results show that the enhancement factor (EF) of P3HT@Ag2NCN composite films (EF = 6147 ± 300) for the probe molecule methylene blue is more than 7 times that of P3HT substrate (EF = 848 ± 85) and is about 75 times that of Ag2NCN nanorods (EF = 82 ± 8). In addition, the SERS substrates of the P3HT@Ag2NCN composite film also display excellent reusability and signal reproducibility (RSD < 4.8%). Our study opens up a new opportunity for designing an ideal SERS substrate with high sensitivity, selectivity, long-term stability, low cost, and reusability.

1. Introduction

SERS technology has a wide range of applications as a fast [1], lossless [2], and high sensitivity [3] trace detection tool. Due to their localized surface plasmon resonance (LSPR), noble metal nanoparticles display excellent SERS properties [4,5,6,7,8]. Previous theoretical and experimental research has shown the importance of the shape, distance, and size of noble metal nanoparticles for their LSPR effects [9,10,11,12,13]. Previous studies [14,15,16] have shown various methods for the synthesis of metal particles with different shapes of nanostructures used as SERS substrates, including nanorods, nanotriangles, nanocubes, and nanocages. Nanostructures with higher curvature, such as nanoflowers and nanostars, can help to increase the sharpness and roughness of the substrate material. These dense, sharp parts and suitable nano-gaps can increase the number of “hotspots”, enhance the surrounding electric field, and even achieve single-molecule detection. Although they have sensitive and efficient response, their instability in air and cost limit their practical application.
The advantages, e.g., high selectivity, low cost, and high stability, of inorganic semiconductor substrates have attracted interest in the field of SERS substrate research [17,18,19,20,21,22,23,24]. Yang et al. [23] prepared TiO2 nanoparticles with different crystallinities by a sol-hydrothermal method and performed SERS experiments using ciprofloxacin as a probe molecule. However, there is still a big gap in Raman enhanced performance between inorganic semiconductors and noble metal nanoparticles. In recent years, organic semiconductor SERS substrates, due to their easy preparation, structural versatility, high selectivity, and long-term stability, have opened up new fields for the development of SERS substrates [25,26,27,28,29,30]. Yilmaz et al. [25] confirmed that nanoscale organic semiconductors, i.e., diperfluorohexyl tetrathiophene molecules with hydrophobic properties, can be used as SERS substrates, and the enhancement factor for the probe molecule methylene blue can reach 3.4 × 10³. Our previous study showed that poly(3-hexylthiophene) (P3HT) films with an optimized crystal structure can improve the charge transfer of the substrate molecule and the probe molecule via more effective chemisorption of the latter with the former [26]. The SERS substrate of P3HT film has excellent signal reproducibility (RSD < 10%) and can retain good Raman enhancement after one year. However, the Raman enhanced performance of organic semiconductor materials still cannot achieve that of noble metal nanoparticles. The function of a single material cannot fit all the criteria of an ideal SERS substrate, including low cost, high sensitivity, reproducibility, and long-term stability. Some works have stated that composite materials are a good choice [31,32,33,34,35,36,37,38,39,40,41]. The development of noble metal nanoparticles and semiconductor composites can expand the theory and application of SERS technology. Zhao et al. [38] prepared TiO2 nanofiber membranes with a diameter of about 200 nm using electrospinning technology and then surface-modified the fibers with silver nanoparticles by a chemical plating method. The composite SERS substrate showed good SERS activity for the three probe molecules, i.e., 4-mercaptobenzoic acid, rhodamine 6G, and 4-aminothiophenol. Due to the high photocatalytic performance of TiO2, the SERS substrate can be recycled by soaking it in water and irradiating it with ultraviolet light. At present, noble metal nanoparticles have been composited with semiconductor materials and have become a hot topic in SERS research because of their simple recovery process and excellent performance. In noble metal nanoparticles/semiconductor composite materials, noble metals exhibit a strong LSPR effect in the visible light region, which can increase light absorption. At the same time, the Fermi energy level of noble metals is lower than that of semiconductors, which can promote the separation of photogenerated electrons from holes and improve the charge transfer (CT) efficiency. Samir Kumar et al. [35] used grazing angle deposition (GLAD) technology to fabricate a novel Ag nanoparticle-modified TiO2 nanorod array substrate that can be used for photocatalysis as well as surface-enhanced Raman scattering. Stavytska-Barba et al. [36] deposited poly(3-hexylthiophene)/[6,6]-phenyl-C61-butyrate methyl ester (P3HT/PCBM) on triangular silver nanoprisms, achieving excellent SERS signals. Wei et al. [39] showed that a MoS2@TiO2@Au platform can rapidly degrade crystal violet under solar irradiation and enable reproducible and sensitive SERS analyses. Wang et al. [40] reported that a AgNPs/TiO2 NSAs/CP hybrid can renew and be reused five times by UV irradiation due to a photocatalysis induced self-cleaning feature. Ag-NP-decorated ZnO nanoflower arrays were demonstrated to possess a self-cleaning function, enabled by UV irradiation via the photocatalytic degradation of the analyte molecules [41]. However, our understanding of the SERS mechanism of composite materials remains limited. A deeper understanding is required to address many open questions regarding the SERS properties of composite materials.
Here, we investigate the SERS properties of organic-inorganic semiconductor heterojunction P3HT@Ag2NCN composite films. [NCN]2− in Ag2NCN is similar to O2− in metal oxides, but compared with Ag2O, the 2p orbital energy level of O is lower than those of C and N, and the 2p orbitals of [NCN]2− constitute a higher valence band energy level. Additionally, the band gap will be narrower, so Ag2NCN should theoretically have excellent charge transfer (CT) efficiency and photocatalytic properties. Our study shows that a P3HT@Ag2NCN composite film is an ideal SERS substrate, successfully overcoming the shortcomings of the poor stability, low sensitivity, high cost, and non-reusability of traditional SERS substrates. Our results show that there is an obvious physical interaction between Ag2NCN and P3HT. Our previous paper [26] showed that significant π-stacking of the probe molecules with the thiophene π-cores molecules from P3HT plays an important role in SERS enhancement via the charge transfer mechanism. An organic-inorganic semiconductor heterojunction structure further improves charge transfer (CT) efficiency and the SERS property. The enhancement factor of P3HT@Ag2NCN composite films (6147 ± 300) for probe molecule methylene blue was more than seven times that of the P3HT substrate (848 ± 85). In addition, the SERS substrates of the P3HT@Ag2NCN composite film also displayed excellent reusability. The study contributes to the rational design of an ideal SERS substrate with high sensitivity, selectivity, long-term stability, low cost, and reusability.

2. Experimental Section

2.1. Materials

Regioregular poly(3-hexylthiophene-2,5-diyl) (P3HT, Mw = 54~75 kg/mol, Mw/Mn = 2.2) was supplied by Sigma-Aldrich (St. Louis, MO, USA). Reagents silver nitrate, chloroform, cyanamide, n-hexane, toluene, acetonitrile, sulfuric acid (98%), hydrogen peroxide (30%), and ammonia were purchased from Sinopharm Chemical Reagent Co., Ltd. (Shanghai, China). Methylene blue (MB, 98.5%) was purchased from Amresco (Radnor, PA, USA).

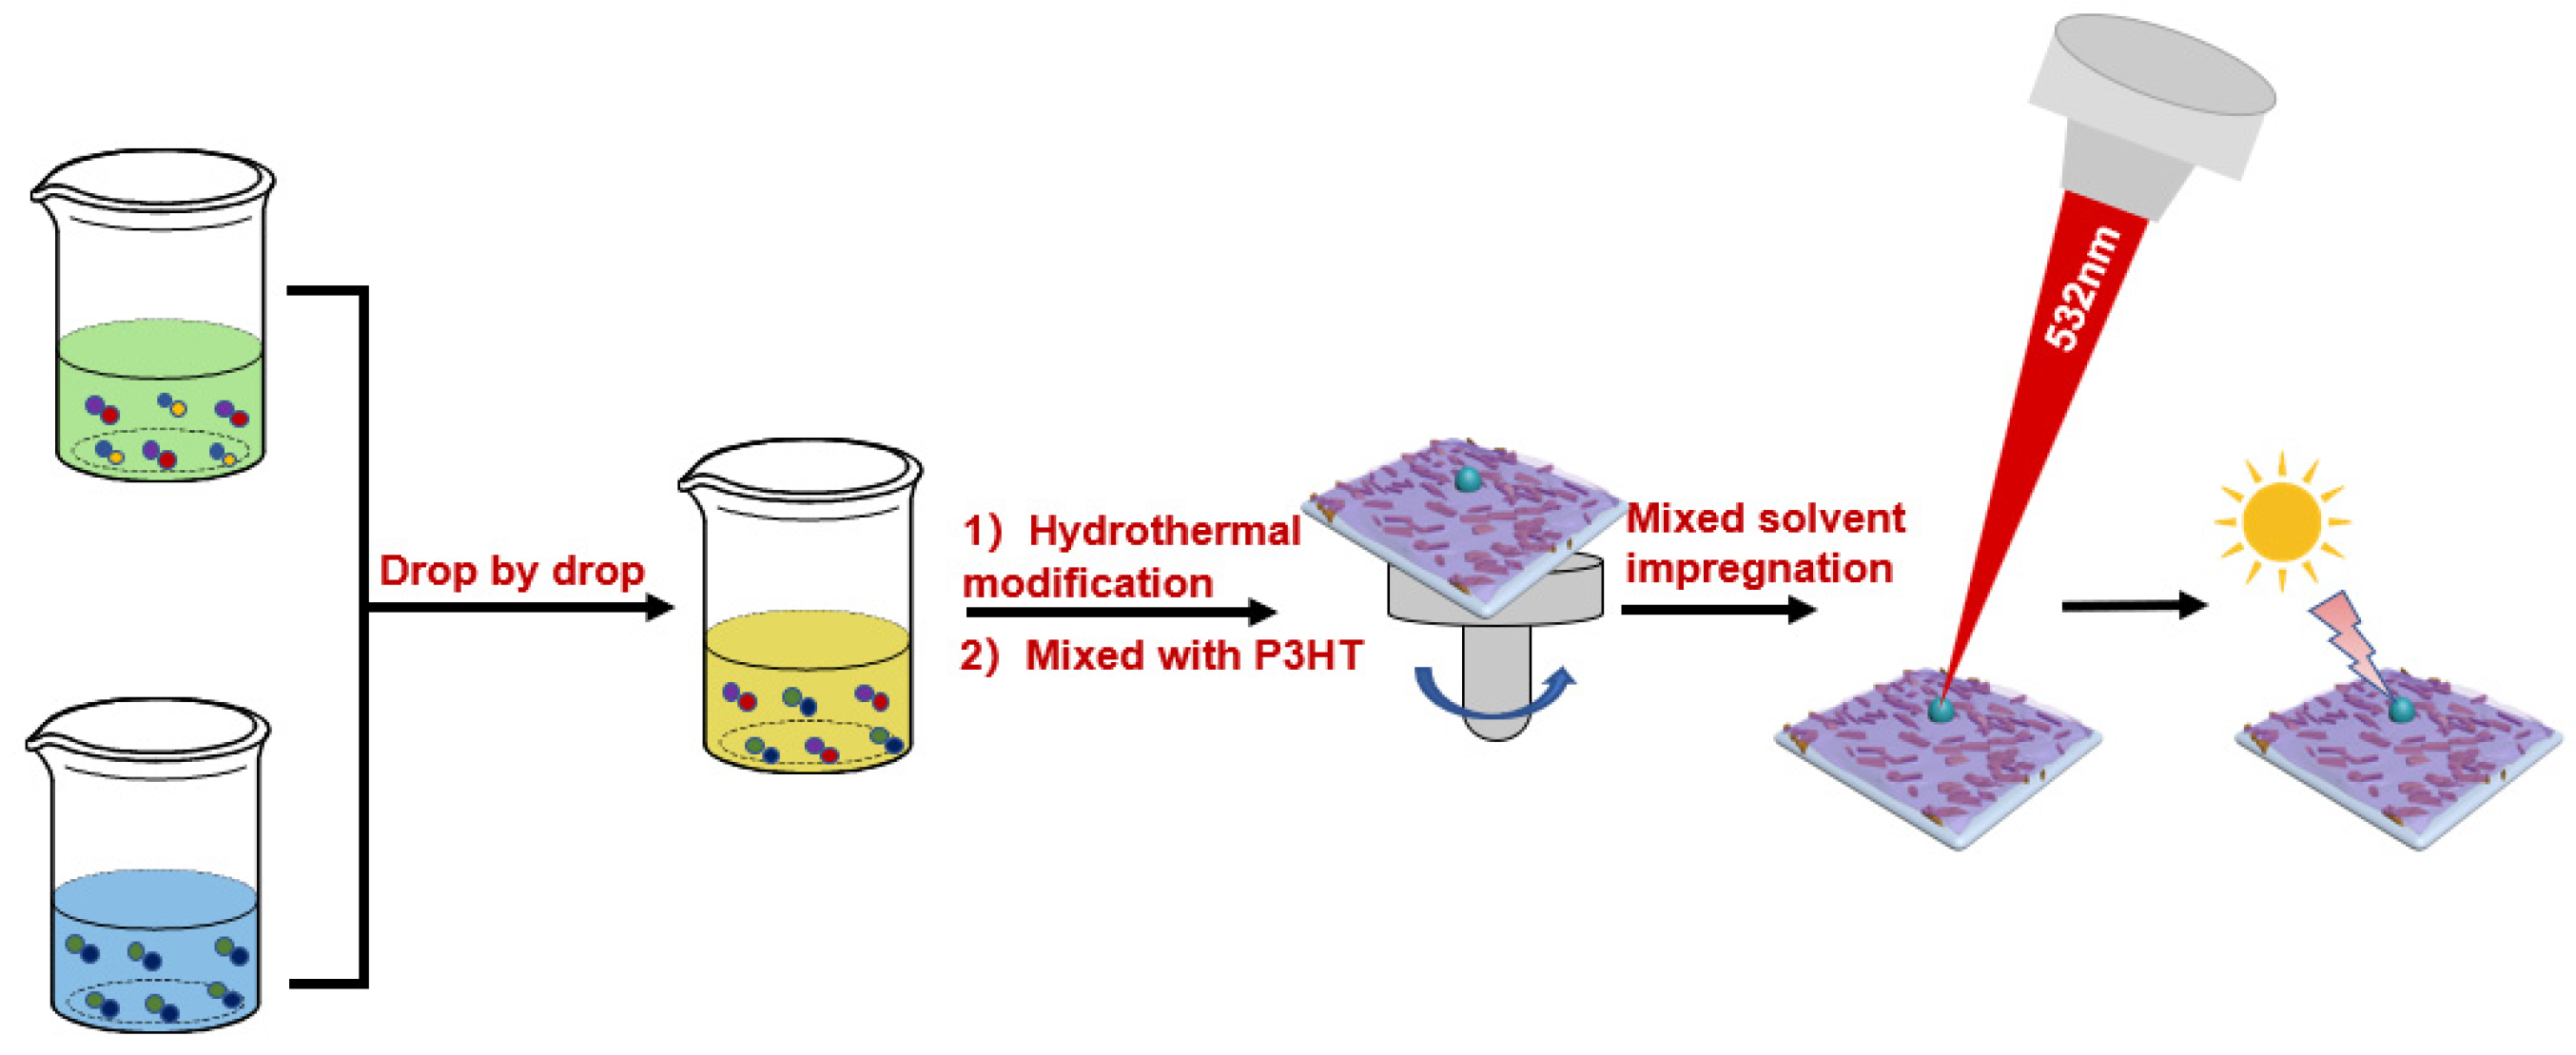
2.2. Preparation of P3HT@Ag2NCN Composite Film

The preparation process of the P3HT@Ag2NCN composite film is shown in Figure 1. Firstly, 5.1 g of silver nitrate was dissolved in 300 mL of ultrapure water, and then 600 mL ammonia water (3 mol/L) was slowly added. Next, 300 mL of an aqueous cyanamide solution (0.9 wt%) was slowly added. After stirring for 0.5 h, filtration was carried out. The yellow powder-silver cyanamide was washed several times with ultrapure water and dried at 60 °C in a vacuum oven. To further optimize the crystal structure of the silver cyanamide, the compound was placed in a hydrothermal kettle for 4 h at 200 °C and then filtered, washed, and dried.
A chloroform solution of P3HT/Ag2NCN with a concentration of 8 mg/mL was prepared. This solution was spin-coated on a glass wafer to fabricate the P3HT@Ag2NCN composite film. The spin speed was 4000 rpm, and the spin time was 60 s. The residual solvent was removed by putting the films in a vacuum oven for 24 h at room temperature. The P3HT@Ag2NCN composite films were immersed in different mixed solvents to regulate their crystal structures, according to a method described in a previous paper [42]. After the P3HT@Ag2NCN composite film had been prepared, 5 μL of dye solution (different concentrations) was placed on the P3HT@Ag2NCN composite film and left to evaporate and dry.

2.3. Raman Spectroscopy

Raman measurements were performed at room temperature with a commercial confocal Raman microscope system (LABRAM HR 800 UV, Horiba Jobin Yvon, Bensheim, Germany) equipped with a Leica microscope (50× objectives). A laser (532 nm) was used as the light source for excitation. A D2 filter was used; the exposure time was 5 s and the accumulation number was 1. The laser power used in the measurement was 50 micro-watts.

2.4. Characterization Techniques

The morphologies of the P3HT@Ag2NCN composite films were observed by field emission scanning electron microscope (SEM, JSM-7500F, Japanese, JEOL, Tokyo, Japan). An Escalab 250Xi instrument was used for X-ray photoelectron spectroscopy (XPS, Thermo Scientific, Waltham, MA, USA). The binding energy scale referenced to the C1s level of the carbon overlayer at 284.8 eV. The UV-Visible absorption spectra were recorded using an ultraviolet-visible spectrophotometer (TU-1901, Beijing PERSEE, Beijing, China) in the wavelength range of 230–850 nm. The infrared spectrum was recorded using an infrared spectrometer (Nicolet iS50,Thermo Scientific, Waltham, MA, USA) in the wavenumber range of 600–4000 nm.

2.5. SERS Enhancement Factor (EF)

The SERS EF was calculated by the formula [43]:
EF = N R e f e r e n c e ×   I c o m p o s i t e   f i l m N c o m p o s i t e   f i l m ×   I R e f e r e n c e
where Icompositefilm and IReference are the SERS intensity and the unenhanced normal signal intensity, respectively, Ncompositefilm is the number of probed molecules in SERS, and NReference is the number of probed molecules in normal Raman measurements.

3. Result and Discussion

Ag2NCN nanorods were prepared by the chemical precipitation method, and their crystal structure was further optimized by the hydrothermal method. Figure 2 shows SEM images of Ag2NCN nanorods at different magnifications before and after optimization. As shown in Figure 2a–c, the untreated Ag2NCN nanorods presented a round rod shape. In contrast, as shown in Figure 2d–f, the nanorods after hydrothermal treatment showed a square column shape; we can see clear edges and corners in Figure 2d–f. This result shows that Ag2NCN nanorods recrystallized in the hydrothermal process at high temperature, which improved their crystallization ability and optimized their crystal structure. To explore the change in the crystal structure of Ag2NCN nanorods before and after treatment, we characterized them using XRD. Figure 3 shows the XRD spectra of silver cyanamide before and after treatment. The crystal plane diffraction peak position of the Ag2NCN nanorods prepared in the experiment was consistent with the standard card (JCPDS No.70–5232 [44]). Among them, the characteristic diffraction peaks of the crystal plane were 2θ = 12.20°, 19.14°, 24.72°, 28.94°, 32.21°, 32.74°, 37.55°, 38.94°, 40.66°, respectively, corresponding to (100), (110), (200), (210), (102), (021), (300), (220), (022) crystal planes of monoclinic silver cyanamide. At (100) crystal plane (12.20°), the full widths at half maximum of the peak before and after treatment were 0.25° and 0.16°, respectively. At (110) crystal plane (19.14°), the full widths at half maximum of the peak before and after treatment were 0.24° and 0.18°, respectively. As shown in Figure 3, all of the XRD diffraction peaks of the Ag2NCN nanorods were sharper, and the full widths at half maximum of the peak became smaller, after hydrothermal treatment, indicating that the crystallinity of Ag2NCN nanorods had been improved by the hydrothermal treatment.
UV-vis DRS was measured to investigate the optical properties of the Ag2NCN nanorods. Figure 4 shows the UV diffuse reflection curve and K-M equation curve of the nanorods before and after treatment. Figure 4a shows that the nanorods had an absorption range from 250–530 nm. This relatively wide light absorption range indicated that more charge carriers can be generated under the excitation of light, reducing the probability of electron-hole recombination and thus improving the efficiency of photocatalytic conversion.
In order to further obtain the band gap width of the Ag2NCN nanorods, we converted their UV diffuse reflectance spectrum into a K-M equation curve, according to the Kubelka Munk function:
(Ahν)1/n = C(hν − Eg)
In the Kubelka Munk function, A is the absorbance, h is the Planck constant, ν is the optical frequency, 1/n is related to the type of semiconductor (generally 2 for a direct transition semiconductor), C is a constant (generally 1), and Eg is the band gap width. As shown in Figure 4b, the band gap width of the untreated Ag2NCN nanorods was about 2.15 eV. After optimization, the band gap width was reduced to 2.02 eV. This showed that the optimization of the crystal structure decreased the band gap width, which enhanced the photocatalytic activity.
We mixed P3HT with Ag2NCN nanorods in chloroform to obtain P3HT@Ag2NCN composite films by a spin coating process. We then characterized the morphology of the nanorods via SEM. We used the amount of Ag2NCN nanorods with a mass fraction of 10% in the P3HT@Ag2NCN composite film. Figure 5a shows an SEM image of the P3HT@Ag2NCN composite film. As shown, the Ag2NCN nanorods were uniformly distributed on the substrate, and the surface and edges of the nanorods became blurred, which may have been due to the P3HT film covering the Ag2NCN particles. Next, we characterized the substrate surface using EDS elemental analysis; see Figure 5b–e. As shown, the surface of the P3HT@Ag2NCN composite film was composed of Ag, C, N, and S. The uniform distribution of S indicated that the P3HT film was evenly distributed on the Ag2NCN. Table 1 shows the mass distribution of each element in the EDS. Among them, the contents of Ag, C, N, and S were 76.56%, 9.45%, 11.15%, and 2.84%, respectively.
We also performed infrared spectroscopic characterization of the P3HT@Ag2NCN composite film; see Figure 6. As shown, the absorption peaks of the composite film were the superposition of the absorption peaks of Ag2NCN and P3HT, and there were no new peaks. In addition, it may clearly be seen that the vibration peaks of the symmetrical and asymmetrical structures belonging to the [NCN]2− at 1963.48 and 632.98 cm−1 in Ag2NCN had been shifted toward a high wave number at 1966.75 and 634.04 cm−1 in the P3HT@Ag2NCN composite film. Additionally, aliphatic C-H telescopic vibrations at 2923 cm−1 and extra-hydrocarbon bending vibrations on the thiophene ring at 821 cm−1 in P3HT were slightly shifted toward a high wave number at 2926 and 823 cm−1. These results indicate the presence of physical interaction between Ag2NCN and P3HT.
To further explore the interaction between P3HT and Ag2NCN in P3HT@Ag2NCN composite films, we characterized the films by XPS; see Figure 7. From Figure 7b–d, we can observe that the binding energy of cyanide silver Ag 3d3/2 and Ag 3d5/2 was shifted from 368.5 eV and 374.5 eV in Ag2NCN to 367.75 eV and 373.70 eV in P3HT@Ag2NCN composite films. Additionally, the binding energy of graphite carbon was reduced from 284.81 eV to 284.67 eV, and that of C-N was reduced from 397.93 eV to 397.54 eV. The slight shift in binding energy indicated physical interaction between P3HT and Ag2NCN.
Next, we measured the SERS performance of the P3HT@Ag2NCN composite substrate. The MB was chosen as probe molecule. Firstly, we assessed the SERS performance of the Ag2NCN nanorods substrate. Figure 8 shows the SERS spectra of the Ag2NCN nanorods before and after treatment. As shown, the original Ag2NCN nanorods achieved effective detection of MB, and the characteristic peak strength at 1621 cm−1 in the case of 10−5 M remained clearly visible. After hydrothermal treatment, the SERS ability of Ag2NCN nanorods was improved; this manifested in a significant increase in strength. Therefore, the optimization of the crystal structure of Ag2NCN nanorods greatly improved their SERS performance, and the detection limit of MB reached 10−5 M.
In order to explore the SERS performance of the P3HT@Ag2NCN composite substrate, we used composite films with different mass fractions of Ag2NCN nanorods as the SERS substrate and MB as the probe molecule. Figure 9 shows the SERS spectra of MB (10−4 M) on the composite films with different mass fractions of Ag2NCN nanorods. As shown, the characteristic peak signal of the composite substrate with 5% addition was relatively weak. In the case of the composite film with 5% Ag2NCN nanorods, the probe molecules were not adsorbed on the position of Ag2NCN nanorods. With a 10% addition, the intensity of the characteristic peak at 1621 cm−1 was relatively high. When the addition amount was more than 10%, the signal intensity at the characteristic peak at 1621 cm−1 was almost the same. Therefore, in the subsequent experiments, we used a 10% mass fraction of Ag2NCN nanorods.
Figure 10a shows the SERS spectra of MB with different concentrations on the composite films. No Raman enhancement was seen on the glass wafer. The obvious Raman peak at 1622 cm−1, which resulted from the C-C ring stretching of MB, was observed on the composite films at an excitation wavelength of 532 nm (see Figure 5a). In the case of the P3HT@Ag2NCN composite substrate, the Raman peak at 1622 cm−1 was seen at 10−4 M and remained until 10−8 M. The detection limit of the P3HT@Ag2NCN composite substrate was 10−8 M, and the enhancement factor was about 6147. Our previous paper [26] reported that the enhancement factor of the pure P3HT film is only 848 and the detection limit is 10−6 M. The SERS performance of Ag2NCN nanorods was also found to be weak and its enhancement factor was only 82. Clearly, the result indicates that the SERS performance of the P3HT@Ag2NCN composite substrate was far higher than that of thin pure P3HT films and Ag2NCN nanorods. Additionally, Figure 10b,c showed an MB (10−5 M) SERS spectra of 10 random points on the composite substrate. As shown in Figure 10b,c, the relative standard deviation (RSD) of these SERS intensities was only 4.8%. Therefore, the composite substrate had a high degree of uniformity. The result indicates that the composite substrate not only had an excellent SERS property, but also a high degree of uniformity. Our previous paper [26] showed that significant π-stacking of the probe molecules with the thiophene π-cores molecules from P3HT plays an important role in SERS enhancement by the charge transfer mechanism. More effective chemisorption of the MB molecules with proper molecular orientations could facilitate the charge transfer of substrate and MB molecules. Our results show that there was an obvious physical interaction between Ag2NCN and P3HT. The proposed organic-inorganic semiconductor heterojunction structure further improves charge transfer (CT) efficiency and the SERS property.
In addition, we mixed Ag2NCN nanorods as a photocatalytic material with P3HT to make a composite film in order to achieve the reusability of the composite substrate based on its photocatalytic properties. We also evaluated the potential photocatalytic properties of the Ag2NCN nanorods via the degradation of MB under visible light irradiation. We employed light illumination (λ > 420 nm) to drive the degradation of MB at room temperature. The reaction was monitored using UV-vis spectroscopy. Figure 11a presents the UV-vis spectra over time. As shown, the characteristic absorption peak intensities of MB significantly decreased with increasing reaction time. Figure 11b shows the kinetics of the peak photocatalytic performance of the Ag2NCN nanorods. The photocatalytic efficiency of the Ag2NCN nanorods was 92.8%. We used light illumination (λ > 420 nm) to illuminate the composite substrate of the SERS experiment for 8 h in order to perform SERS testing again and observed a change in the characteristic peak. Figure 12a shows the SERS spectra of the composite film during the illumination cycle. We observed that the composite substrate after the SERS experiment disappeared after illumination, indicating that the Ag2NCN nanorods had achieved catalytic degradation of MB during illumination. Then, after the same position had been added to the MB solution, its characteristic peak appeared to be stable, indicating that the composite substrate can be reused. After four SERS cycles using the complex substrate shown in Figure 12b, stable SERS activity remained. The results show that the SERS substrates of the P3HT@Ag2NCN composite film had high sensitivity, good uniformity, and excellent reusability.

4. Conclusions

In summary, an organic-inorganic semiconductor P3HT@Ag2NCN composite film fabricated by the spin-coating process displayed good SERS properties and was shown to be reusable. The SERS substrate not only had a high sensitivity (the enhancer factor was 6147 ± 300), but also had excellent signal reproducibility (RSD = 4.8%). The enhancement factor of P3HT@Ag2NCN composite films (6147 ± 300) for MB was more than 7 times that of the P3HT substrate (848 ± 85) and about 75 times that of Ag2NCN nanorods (82 ± 8). Significant π-stacking of the probe molecules with the thiophene π-cores molecules from P3HT played an important role in the large SERS enhancement by the charge transfer mechanism. There was physical interaction between P3HT and Ag2NCN nanorods. Thus, our organic-inorganic semiconductor P3HT@Ag2NCN heterojunction structure further improved the charge transfer efficiency and the SERS property. In addition, stable SERS activity remained after four illumination cycles, demonstrating excellent reusability. The approach described in this study provides great potential to develop an ideal SERS substrate with high sensitivity, selectivity, long-term stability, low cost, and reusability.

Author Contributions

Conceptualization, L.X.; methodology, T.W.; formal analysis, L.X., T.W., X.L. and Z.C.; investigation, T.W. and X.L.; data curation, T.W. and X.L.; writing—original draft preparation, L.X. and Z.C.; writing—review and editing, L.X. and Z.C. All authors have read and agreed to the published version of the manuscript.

Funding

This work was financially supported by the Marine Biomaterials Research Joint Lab of ZIAT and Dangan Town, the Zhuhai Science and Technology Department Project (ZH22036207200025PWC, ZH22017003200028PWC, ZH22017001200078PWC), Zhuhai Innovation and Entrepreneurship Team Project (ZH22055905200017PWC).

Institutional Review Board Statement

Not applicable.

Informed Consent Statement

Not applicable.

Conflicts of Interest

The authors declare no conflict of interest.

References

  1. Li, D.; Yao, D.; Li, C.; Luo, Y.H.; Liang, A.H.; Wen, G.Q.; Jiang, Z.L. Nanosol SERS Quantitative Analytical Method: A Review. TrAC-Trends Anal. Chem. 2020, 127, 115885. [Google Scholar] [CrossRef]
  2. Feng, E.; Tian, Y. Surface-Enhanced Raman Scattering of Self-Assembled Superstructures. Chem. Res. Chin. Univ. 2021, 37, 989–1007. [Google Scholar] [CrossRef]
  3. Zhou, X.; Hu, Z.; Yang, D.; Yang, D.T.; Xie, S.X.; Jiang, Z.J.; Niessner, R.; Haisch, C.; Zhou, H.B.; Sun, P.H. Bacteria Detection: From Powerful Sers to Its Advanced Compatible Techniques. Adv. Sci. 2020, 7, 2001739. [Google Scholar] [CrossRef]
  4. Zhao, X.; Campbell, S.; Wallace, G.Q.; Claing, A.; Bazuin, C.G.; Masson, J.F. Branched Au Nanoparticles on Nanofibers for Surface-Enhanced Raman Scattering Sensing of Intracellular pH and Extracellular pH Gradients. ACS Sens. 2020, 5, 2155–2167. [Google Scholar] [CrossRef]
  5. Chen, X.; Lin, H.; Xu, T.; Lai, K.; Han, X.; Lin, M. Cellulose Nanofibers Coated with Silver Nanoparticles as A Flexible Nanocomposite for Measurement of Flusilazole Residues in Oolong Tea by Surface-Enhanced Raman Spectroscopy. Food Chem. 2020, 315, 126276. [Google Scholar] [CrossRef]
  6. Zhang, H.H.; Xu, L.; Xu, Y.; Huang, G.; Zhao, X.Y.; Lai, Y.Q.; Shi, T.F. Enhanced Self-Organized Dewetting of Ultrathin Polymer Blend Film for Large-Area Fabrication of SERS Substrate. Sci. Rep. 2016, 6, 38337. [Google Scholar] [CrossRef] [PubMed] [Green Version]
  7. Tong, L.; Zhu, T.; Liu, Z. Approaching the Electromagnetic Mechanism of Surface-Enhanced Raman Scattering: From Self-Assembled Arrays to Individual Gold Nanoparticles. Chem. Soc. Rev. 2011, 40, 1296–1304. [Google Scholar] [CrossRef]
  8. Wu, D.Y.; Liu, X.M.; Duan, S.; Xu, X.; Ren, B.; Lin, S.H.; Tian, Z.Q. Chemical Enhancement Effects in SERS Spectra: A Quantum Chemical Study of Pyridine Interacting with Copper, Silver, Gold and Platinum Metals. J. Phys. Chem. C 2008, 112, 4195–4204. [Google Scholar] [CrossRef]
  9. Dawson, P.; Alexander, K.B.; Thompson, J.R.; Haas, J.W.; Ferrell, T.L. Influence of Metal Grain-Size on Surface-Enhanced Raman-Scattering. Phys. Rev. B 1991, 44, 6372–6381. [Google Scholar] [CrossRef] [PubMed]
  10. Zhu, C.; Meng, G.; Zheng, P.; Huang, Q.; Li, Z.B.; Hu, X.Y.; Wang, X.J.; Huang, Z.L.; Li, F.D.; Wu, N.Q. A Hierarchically Ordered Array of Silver-Nanorod Bundles for Surface-Enhanced Raman Scattering Detection of Phenolic Pollutants. Adv. Mater. 2016, 28, 4871–4876. [Google Scholar] [CrossRef] [PubMed]
  11. Xiang, H.P.; Wang, Z.L.; Xu, L.; Zhang, X.; Lu, G. Quantum Plasmonics in Nanorods: A Time-Dependent Orbital-Free Density Functional Theory Study with Thousands of Atoms. J. Phys. Chem. C 2020, 124, 945–951. [Google Scholar] [CrossRef]
  12. Xiang, H.P.; Zu, J.X.; Jiang, H.W.; Xu, L.; Lu, G.; Zhang, X. Understanding Quantum Plasmonic Enhancement in Nanorod Dimers from Time-Dependent Orbital-Free Density Functional Theory. J. Phys. Chem. C 2022, 126, 5046–5054. [Google Scholar] [CrossRef]
  13. Jin, L.; She, G.; Wang, X.; Yuan, R.; Dai, Y.Q.; Lu, Y.H.; Wang, P. Enhancing the Sers Performance of Semiconductor Nanostructures through a Facile Surface Engineering Strategy. Appl. Surf. Sci. 2014, 320, 591–595. [Google Scholar] [CrossRef]
  14. Li, K.; Wang, Y.; Jiang, K.; Ren, Y.; Dai, Y.; Lu, Y.; Wang, P. Free-Standing Ag Triangle Arrays a Configurable Vertical Gap for Surface Enhanced Raman Spectroscopy. Nanotechnology 2017, 28, 385401. [Google Scholar] [CrossRef]
  15. Jen, Y.J.; Lin, M.J.; Cheang, H.L.; Chan, T.L. Obliquely Deposited Titanium Nitride Nanorod Arrays as Surface-Enhanced Raman Scattering Substrates. Sensors 2019, 19, 4765. [Google Scholar] [CrossRef] [Green Version]
  16. Wen, S.P.; Miao, X.R.; Fan, G.C.; Xu, T.T.; Jiang, L.P.; Wu, P.; Cai, C.; Zhu, J.J. Aptamer-Conjugated Au Nanocage/SiO2 Core-Shell Bifunctional Nanoprobes with High Stability and Biocompatibility for Cellular Sers Imaging and near-Infrared Photothermal Therapy. ACS Sens. 2019, 4, 301–308. [Google Scholar] [CrossRef]
  17. Glass, D.; Cortes, E.; Ben-Jaber, S.; Brick, T.; Peveler, J.; Blackman, C.; Howle, C.; Quesada-Cabrera, R.; Parkin, I.; Maier, S. Dynamics of Photo-Induced Surface Oxygen Vacancies in Metal-Oxide Semiconductors Studied under Ambient Conditions. Adv. Sci. 2019, 6, 1901841. [Google Scholar] [CrossRef] [Green Version]
  18. Jiang, X.; Song, K.; Li, X.; Yang, M.; Han, X.X.; Yang, L.B.; Zhao, B. Double Metal Co-Doping of TiO2 Nanoparticles for Improvement of Their Sers Activity and Ultrasensitive Detection of Enrofloxacin: Regulation Strategy of Energy Levels. Chemistryselect 2017, 2, 3099–3105. [Google Scholar] [CrossRef]
  19. Quan, Y.; Su, R.; Yang, S.; Chen, L.; Wei, M.B.; Liu, H.L.; Yang, H.J.; Gao, M.; Li, B.Z. In-Situ Surface-Enhanced Raman Scattering Based on MTi20 Nanoflowers: Monitoring and Degradation of Contaminants. J. Hazard. Mater. 2021, 412, 125209. [Google Scholar] [CrossRef]
  20. Guo, L.; Zhang, X.; Li, P.; Han, R.; Liu, Y.W.; Han, X.X.; Zhao, B. Surface-Enhanced Raman Scattering (SERS) as a Probe for Detection of Charge-Transfer between TiO2 and Cds Nanoparticles. New J. Chem. 2019, 43, 230–237. [Google Scholar] [CrossRef]
  21. Yang, B.; Jin, S.; Guo, S.; Park, Y.; Chen, L.; Zhao, B.; Jung, Y.M. Recent Development of SERS Technology: Semiconductor-Based Study. ACS Omega 2019, 4, 20101–20108. [Google Scholar] [CrossRef] [PubMed]
  22. Balcytis, A.; Ryu, M.; Seniutinas, G.; Juodkazyte, J.; Cowie, B.; Stoddart, P.; Zamengo, M.; Morikawac, J.; Juodkazis, S. Black-CuO: Surface-Enhanced Raman Scattering and Infrared Properties. Nanoscale 2015, 7, 18299–18304. [Google Scholar] [CrossRef] [PubMed]
  23. Yang, L.; Qin, X.; Jiang, X.; Gong, M.; Yin, D.; Zhang, Y.J.; Zhao, B. Sers Investigation of Ciprofloxacin Drug Molecules on TiO2 Nanoparticles. Phys. Chem. Chem. Phys. 2015, 17, 17809–17815. [Google Scholar] [CrossRef] [PubMed]
  24. Han, X.X.; Ji, W.; Zhao, B.; Ozaki, Y. Semiconductor-Enhanced Raman Scattering: Active Nanomaterials and Applications. Nanoscale 2017, 9, 4847–4861. [Google Scholar] [CrossRef]
  25. Yilmaz, M.; Babur, E.; Ozdemir, M.; Gieseking, R.; Dede, Y.; Tamer, U.; Schatz, G.; Facchetti, A.; Usta, H.; Demirel, G. Nanostructured Organic Semiconductor Films for Molecular Detection with Surface-Enhanced Raman Spectroscopy. Nat. Mater. 2017, 16, 918–924. [Google Scholar] [CrossRef]
  26. Wang, T.; Lu, Y.; Xu, L.; Chen, Z.J. π-Conjugated poly(3-hexylthiophene- 2,5-diyl) thin film as a SERS substrate for molecule detection application. J. Mater. Sci. 2022, 57, 16965–16973. [Google Scholar] [CrossRef]
  27. Demirel, G.; Usta, H.; Yilmaz, M.; Celik, M.; Alidagibe, H.; Buyukserind, F. Surface-Enhanced Raman Spectroscopy (SERS): An Adventure from Plasmonic Metals to Organic Semiconductors as Sers Platforms. J. Mater. Chem. C 2018, 6, 5314–5335. [Google Scholar] [CrossRef]
  28. Ganesh, S.; Venkatakrishnan, K.; Tan, B. Quantum scale organic semiconductors for SERS detection of DNA methylation and gene expression. Nat. Commun. 2020, 11, 1135. [Google Scholar] [CrossRef] [Green Version]
  29. Demirel, G.; Gieseking, R.; Ozdemir, R.; Kahmann, S.; Loi, M.; Schatz, G.; Facchetti, A.; Usta, H. Molecular engineering of organic semiconductors enables noble metalcomparable SERS enhancement and sensitivity. Nat. Commun. 2019, 10, 5502. [Google Scholar] [CrossRef] [Green Version]
  30. Razzell-Hollis, J.; Thiburce, Q.; Tsoi, W.; Kim, J. Interfacial Chemical Composition and Molecular Order in Organic Photovoltaic Blend Thin Films Probed by Surface-Enhanced Raman Spectroscopy. ACS Appl. Mater. Interfaces 2016, 8, 31469–31481. [Google Scholar] [CrossRef]
  31. Shi, C.; Qin, L.; Wu, S. Highly Sensitive Sers Detection and Photocatalytic Degradation of 4-Ami- Nothiophenol by a Cost-Effective Cobalt Metal-Organic Framework-Based Sandwich-Like Sheet. Chem. Eng. J. 2021, 422, 129970. [Google Scholar] [CrossRef]
  32. Singh, J.; Manna, A.K.; Soni, R.K. Bifunctional Au-TiO2 Thin Films with Enhanced Photocatalytic Activity and Sers Based Multiplexed Detection of Organic Pollutant. J. Mater. Sci.-Mater. Electron. 2019, 30, 16478–16493. [Google Scholar] [CrossRef]
  33. Liu, L.; Yang, H.; Ren, X.; Tang, J.; Li, Y.F.; Zhang, X.Q.; Cheng, Z.H. Au-Zno Hybrid Nanoparticles Exhibiting Strong Charge-Transfer-Induced Sers for Recyclable Sers-Active Substrates. Nanoscale 2015, 7, 5147–5151. [Google Scholar] [CrossRef]
  34. Wu, J.Y.; Hsieh, C.H.; Feria, D.N.; Shen, J.L. PAA/ZnO Raspberry-Shaped Composite Microspheres Decorated with Ag Nanoparticles as Cleanable SERS Substrates. ACS Omega 2020, 5, 29795–29800. [Google Scholar] [CrossRef] [PubMed]
  35. Kumar, S.; Lodhi, D.K.; Singh, J.P. Highly Sensitive Multifunctional Recyclable Ag-TiO2 Nanorod SERS Substrates for Photocatalytic Degradation and Detection of Dye Molecules. RSC Adv. 2016, 6, 45120–45126. [Google Scholar] [CrossRef]
  36. Stavytska, M.S.; Salvador, M.; Kulkarni, A.; Ginger, D.S.; Kelley, A.M. Plasmonic Enhancement of Raman Scattering from the Organic Solar Cell Material P3HT/PCBM by Triangular Silver Nanoprisms. J. Phys. Chem. C 2011, 115, 20788–20794. [Google Scholar] [CrossRef]
  37. Yang, B.; Wang, Y.; Guo, S.; Jin, S.; Park, E.; Chen, L.; Jung, Y.M. Charge Transfer Study for Semiconductor and Semiconductor/Metal Composites Based on Surface-Enhanced Raman Scattering. Bull. Korean Chem. Soc. 2021, 42, 1411–1418. [Google Scholar] [CrossRef]
  38. Zhao, Y.; Sun, L.; Xi, M.; Feng, Q.; Jiang, C.Y.; Fong, H. Electrospun TiO2 Nanofelt Surface-Decorated with Ag Nanoparticles as Sensitive and UV-Cleanable Substrate for Surface Enhanced Raman Scattering. ACS Appl. Mater. Interfaces 2014, 6, 5759–5767. [Google Scholar] [CrossRef]
  39. Wei, Q.Y.; Dong, Q.R.; Sun, D.W.; Pu, H.B. Synthesis of recyclable SERS platform based on MoS2@TiO2@Au heterojunction for photodegradation and identification of fungicides. Spectrochim. Acta Part A Mol. Biomol. Spectrosc. 2023, 285, 121895. [Google Scholar] [CrossRef]
  40. Wang, Y.; Li, M.S.; Wang, D.G.; Han, C.P.; Li, J.J.; Wu, C.Y.; Xu, K. Fabrication of highly uniform Ag nanoparticle-TiO2 nanosheets array hybrid as reusable SERS substrates. Colloid Interface Sci. Commun. 2020, 39, 100324. [Google Scholar] [CrossRef]
  41. Tao, Q.; Li, S.; Ma, C.Y.; Liu, K.; Zhang, Q.Y. A highly sensitive and recyclable SERS substrate based on Ag-nanoparticle-decorated ZnO nanoflowers in ordered arrays. Dalton Trans. 2015, 44, 3447–3453. [Google Scholar] [CrossRef] [PubMed]
  42. Xu, L.; Zhang, H.H.; Lu, Y.Y.; An, L.J.; Shi, T.F. The effects of solvent polarity on the crystallization behavior of thin π-conjugated polymer film in solvent mixtures investigated by grazing incident X-ray diffraction. Polymer 2020, 190, 122259. [Google Scholar] [CrossRef]
  43. Sui, C.; Wang, K.G.; Wang, S.; Ren, J.Y.; Bai, X.H.; Bai, J.T. SERS activity with tenfold detection limit optimization on a type of nanoporous aao-based complex multilayer substrate. Nanoscale 2016, 8, 5920–5927. [Google Scholar] [CrossRef] [PubMed]
  44. Fu, Z.Q.; Wang, Y.S.C.; Li, Z.Y.; Song, T.; Long, B.; Ali, A.; Deng, G. Controllable Synthesis of Porous Silver Cyanamide Nanocrystals with Tunable Morphologies for Selective Photocatalytic CO2 Reduction into CH4. J. Colloid Interface Sci. 2021, 593, 152–161. [Google Scholar] [CrossRef]
Figure 1. P3HT@Ag2NCN preparation of composite substrate and schematic of the SERS experiment.
Chemosensors 10 00469 g001
Figure 2. SEM images of untreated Ag2NCN nanorods (ac) and treated Ag2NCN nanorods (df) at different magnifications.
Chemosensors 10 00469 g002
Figure 3. XRD spectra of Ag2NCN before and after treatment.
Chemosensors 10 00469 g003
Figure 4. (a) UV diffuse reflectance and (b) K-M equation curve of Ag2NCN before and after treatment.
Chemosensors 10 00469 g004
Figure 5. (a) SEM morphology of P3HT@Ag2NCN composite film; (be) EDS elemental analysis of P3HT@Ag2NCN composite film.
Chemosensors 10 00469 g005
Figure 6. Infrared spectra of P3HT, Ag2NCN, and P3HT@Ag2NCN composite films.
Chemosensors 10 00469 g006
Figure 7. (a) XPS full spectrum and element spectrum of P3HT@Ag2NCN composite films; high-resolution of Ag3d (b), C1s (c), and N1s (d), respectively.
Chemosensors 10 00469 g007
Figure 8. SERS spectra of the (a) pristine (b) treated Ag2NCN on MB.
Chemosensors 10 00469 g008
Figure 9. SERS spectra of MB (10−4 M) on composite films with different mass fractions of Ag2NCN nanorods.
Chemosensors 10 00469 g009
Figure 10. (a) SERS spectra of different concentrations of MB on the composite substrate, (b) MB (10−5 M) SERS spectra of 10 random points on the composite substrate. (c) Raman intensity (at 1621 cm−1) of MB (10−5 M) acquired from 18 different spots in (b).
Chemosensors 10 00469 g010
Figure 11. (a) Absorbance changes of Ag2NCN nanorods for MB photocatalytic degradation; (b) the photocatalytic kinetics of the Ag2NCN nanorods.
Chemosensors 10 00469 g011
Figure 12. (a) SERS spectra of the composite film under one illumination cycle, (b) the Raman intensity of the characteristic peak of the composite substrate under four illumination cycles.
Chemosensors 10 00469 g012
Table 1. Mass distribution of elements in EDS.
ElementWt%Wt% Sigma
C9.450.27
N11.150.41
Ag76.560.61
S2.840.26
Total100.00
Publisher’s Note: MDPI stays neutral with regard to jurisdictional claims in published maps and institutional affiliations.

