1. Introduction
The growth of manufacturing has brought economic and social prosperity. Shop scheduling, as a key part of manufacturing, plays an important role in economic development. Hybrid flow shop (HFS) is a common manufacturing environment [
1] that combines the features of process shop and parallel machine scheduling and is widely used in container handling [
2], electronics manufacturing, chemical production, and steel production [
3,
4,
5], in addition to applications in internet service architecture [
6], civil engineering [
7], and production planting [
8]. The hybrid flow shop scheduling problem (HFSP) refers to multiple jobs to be processed in multiple stages with one or more machines in each stage, and a specific optimization objective is achieved by determining the order in which the jobs are processed and the allocation of machines to each job in each stage [
1]. It is worth noting that there are two other cases of HFSP in real life [
9,
10]: (1) the processing time of a job is often not fixed but fluctuates within a limited range due to worker proficiency, newness of the machine. (2) The same machine processing different jobs requires a certain setup of the machine before processing, and due to the differences between jobs, the setup time required by the machine varies from job to job. Therefore, it is more meaningful and practical to study HFSP with setup time and fuzzy job processing time.
While the world is experiencing unprecedented economic and social prosperity, environmental pollution and energy scarcity are becoming a serious problem that seriously affects the future development of humanity. In particular, the manufacturing industry takes up most of the world’s energy and produces a large amount of pollutant emissions [
11]. Therefore, in order to solve the energy and environmental problems, green shop scheduling, as a key aspect of manufacturing, has become a hot spot for research [
12]. The purpose of green shop scheduling is to reduce energy consumption, reduce environmental pressure, and achieve sustainable development without losing economic benefits. Therefore, the widely used hybrid flow green shop scheduling problem (HFGSP) has a high research value.
However, HFGSPs that consider fuzzy job processing time are not common at present. Fu et al. [
13] developed a hybrid multi-objective optimization algorithm to solve HFSP with fuzzy processing time but did not consider the energy problem. Wang et al. [
14] investigated the HFGSP of job processing time variation caused by the dynamic reconfiguration process of the device to minimize the energy consumption of makespan and the whole device and proposed an improved multi-objective whale optimization algorithm to solve it.
As HFSP has a wide range of application scenarios, the uncertain job processing time meets the actual production needs and the energy saving is in line with the future direction of manufacturing. In this paper, we study the fuzzy hybrid flow green shop scheduling problem (FHFGSP) which meets the above three scenarios and is less studied currently. FHFGSP considers fuzzy job processing time and machine setup time with the objective of minimizing both makespan (MS) and total energy consumption (TEC). Uncertain completion time is denoted by triangular fuzzy numbers (TFN) and TEC is divided into three parts: machine working time, machine setup time, and machine idle time. At present, there are not many HFGSPs that consider both fuzzy processing time and work sequence-related setup time, but FHFGSP is more in line with actual production scenarios and has higher research value.
Artificial bee colony (ABC) [
15] is one of the swarm intelligence algorithms, which is divided into employed bees, onlooker bees, and scout bees according to the foraging behavior of the swarm, with good global exploration and local development. ABC has been shown to be superior or close to other classical swarm intelligence algorithms [
16,
17]. ABC is widely used to solve shop scheduling problems [
18]. To solve FHFGSP, this paper proposed a sorting-based discrete artificial bee colony algorithm (SDABC). Individuals in the population are ranked according to non-dominated solutions and similarity to the ideal solution and adopt different search and follow strategies according to the location to achieve full exploration of the solution space and discover better solutions. It is worth mentioning that SDABC can be used not only to solve FHFGSP problems such as turning shop [
19]. It can also be used to solve the expansion of FHFGSP described in the first paragraph.
The main contributions of this paper are as follows:
- (1)
The FHFGSP with processing time fuzzy is investigated. The completion time is represented by TFN, and the energy consumption in the scheduling process is considered in three parts, which is more in line with the actual production environment.
- (2)
In the employed bee phase, the population was ranked based on the number of dominant solutions and the similarity of ideal solutions, and different degrees of exploration were taken for individuals according to the results of the ranking, with the best individuals being more fully explored.
- (3)
In the onlooker bee phase, a selection strategy is adopted so that individuals in the top ranking have a higher probability of being selected, and a mutation strategy is adopted to avoid falling into a local optimum.
The paper is organized as follows:
Section 2 gives the relevant works,
Section 3 describes what the FHFGSP is, gives a symbolic representation and builds a mathematical model of the FHFGSP.
Section 4 details the SDABC for solving the FHFGSP. Experimental validation is presented in
Section 5 and the last section contains conclusions and outlook.
2. Related Works
ABC has been successfully applied to solve shop scheduling problems due to its advantages such as few control parameters and ease of implementation [
20]. As there is no research related to ABC for solving FHFGSP, this section reviews the work related to the use of ABC for solving shop scheduling problems.
Li et al. [
18] proposed a novel hybrid ABC and tabu search algorithm (TABC) to solve the HFSP finite buffers, employing a TS-based adaptive neighborhood strategy that gives the TABC algorithm the ability to learn and generate neighborhood solutions in different promising regions as a means to minimize makespan. Yue et al. [
21] investigated the batching and hybrid model scheduling problem in a flexible parallel production line, considering the sequence-dependent setup time between hybrid model products with the aim of minimizing the manufacturing cycle time of the line while balancing the workload between lines and maximizing the net profit. In addition, a new material availability constraint is introduced to the problem. A novel Pareto guided ABC is designed to address the current problem. Gong et al. [
22] considered the impact and potential of human factors on improving productivity and reducing production costs in real production systems and proposed a hybrid ABC to solve flexible job shop scheduling problems (FJSP) with worker flexibility. Zadeh et al. [
23] proposed a heuristic model based on an ABC for the dynamic FJSP. Lei et al. [
24] studied the distributed unrelated parallel machine scheduling problem with preventive maintenance (DUPMSP) and proposed an ABC with division to minimize MS. Xie et al. [
25] proposed an improved ABC considering machining structure evaluation to solve the flexible integrated scheduling problem of networked equipment, which is an extension of job shop scheduling. Xuan et al. [
20] proposed an improved DABC with the introduction of a genetic algorithm to solve FJSP for uncorrelated parallel machines with progressively deteriorating jobs and timing dependencies.
As flow shops are very common in practical production activities, the HFSP is of high research value. Wang et al. [
19] proposed a new decoding method that simultaneously considers spindle speed optimization and scheduling scheme optimization and acts on the distribution estimation algorithm to simultaneously reduce energy consumption and makspan in the turning shop. Li et al. [
26] proposed an improved ABC to solve the distributed flow shop problem (DFSP) with the objective of minimizing MS. Li et al. [
27] proposed a hybrid ABC to solve the parallel batch DFSP with deteriorating jobs. In the proposed algorithms, two types of problem-specific heuristics are proposed, namely batch allocation and right-shift heuristics, which can significantly shorten makespan. Gong et al. [
28] proposed a hybrid multi-objective DABC for solving the blocked batch flow process shop scheduling problem with two conflicting criteria of minimizing MS and lead time. With the objective of minimizing the total process time, Pan et al. [
29] solved the distributed arrangement flow job scheduling problem based on a high-performance framework of DABC. Li et al. [
30] proposed an improved ABC to solve a multi-objective optimization model with the objectives of minimizing MS and processing cost for the hybrid flow shop process planning and production scheduling independently of each other. Peng et al. [
31] investigated the problem of flow shop rescheduling in the actual steelmaking process, considering interruptions caused by machine failures and controllable processing times in the final stages, and proposed an improved ABC to solve the problem.
However, in actual production, the processing time of jobs is often uncertain and there is very little research on ABC solutions to fuzzy HFSP. Zhong et al. [
32] proposed a new artificial swarm algorithm, the improved artificial swarm algorithm, for the multi-objective fuzzy FJSP. The objectives are to minimize the maximum fuzzy MS, maximize the weighted consistency index and minimize the maximum fuzzy machine workload.
Most of the research on the use of ABC to solve shop scheduling problems is in the area of improving economic efficiency. Very little research has been done on saving energy and reducing pollution emissions. Li et al. [
33] designed an improved ABC to solve a multi-objective low-carbon job shop scheduling problem with variable machining speed constraints. Zhang et al. [
34] studied HFGSP with variable machine processing speed to minimize MS and TEC and proposed a multi-objective DABC (MDABC) to solve HFGSP. However, in HFGSP, the processing time of the job is set to an exact value, which is not fully compatible with the actual production environment. In real life, the processing time of the job often deviates due to the operator’s business ability, machine aging, etc. Moreover, the neighborhood search adopted by MDABC in the employed bee phase and the binary race strategy adopted in the onlooker bee phase make the algorithm suffer from the problem that it cannot fully explore in the solution space, the convergence of the algorithm is not high, and it is easy to fall into local optimum.
For this reason, this paper studies the FHFGSP with uncertain job processing time and proposes SDABC to solve FHFGSP. In SDABC, the dominant individuals guide the poor individuals to update in the employed bee phase, which improves the convergence speed of the population, and the proposed ranking-based selection strategy and mutation strategy can prevent individuals from falling into local optimum in the onlooker bee phase. FHFGSP is consistent with the actual production environment and production requirements, but it is not common in previous studies.
3. FHFGSP
This section first details the problem definition of FHFGSP, then the rules of TFN operations are explained, and finally the symbolic representation of FHFGSP is given and the mathematical model of FHFGSP is developed.
3.1. Description of the Problem
FHFGSP combines the features of fuzzy scheduling and HFSP. In FHFGSP,
n jobs will be processed in
m (
m ≥ 2) stages in the same order. Each stage
j has at least one machine
Mj,k (
k ≥ 1) and at least one stage has multiple machines [
1,
35,
36]. The processing time
Ti,j,v of job
i on machine
Mj,k is uncertain and is given by the triple [
37] (
,
,
) where
≤
≤
.
denotes the optimal processing time,
denotes the most probable processing time, and
denotes the worst processing time.
The constraints for FHFGSP are formulated as follows:
- (1)
Jobs are not allowed to be interrupted and preempted when there is a job being processed on the machine, and the machine is not allowed to stop.
- (2)
At the beginning, all jobs and machines are available.
- (3)
Only one job can be processed by any one machine at any one time and any job is only allowed to be processed by one machine at any one time.
- (4)
Machines at the same stage process jobs at the same speed with the same power.
- (5)
Machines are allowed to idle.
- (6)
Machines can only process jobs at a selected speed. This cannot be changed during the processing.
The objective to be optimized by FHFGSP is to minimize MS and TEC. In this paper, the TEC is divided into three parts: when the machine is idle, when the machine is in the setup phase, and when the machine is processing jobs. There are three ways to reduce MS: (1) reduce machine idle time, which is influenced by the job sequence. (2) Reduce machine setup time, which also reduces TEC, which is also influenced by the job sequence. (3) Reducing the time of the job being processed, which means increasing the processing speed of the job. However, the energy consumption of the machine when processing a job is proportional to the processing speed of the job [
38], and reducing the job processing time increases the TEC. Since the two objectives to be optimized are in conflict with each other, this paper solves the FHFGSP by adjusting the job sequence and the speed of the machine when processing the job.
3.2. TFN Concepts and Operations
The concept of fuzzy sets was introduced by Zadeh [
39] and the basic idea is to fuzzily the absolute affiliation in classical sets. It can be used to solve real-life uncertainty problems [
40]. This subsection gives the rules for the operation of the TFN to facilitate the solution of the GFHSP.
For any two TFNs A = (a1, a2, a3) and B = (b1, b2, b3) the rules for each operation are as follows:
Multiplication operations
The TFN comparison operation is divided into three steps and has three judgement criteria.
Step 1: Get and by (3). If > (<) , then A > (<) B.
Step 2: If = , then compare a2 and b2. If a2 > (<) b2, then A > (<) B.
Step 3: If = and a2 = b2, then compare the difference between a3 and a1. If a3 − a1 > (<) b3 − b1, then A < (>) B.
3.3. Mathematical Models
After understanding the basic concepts of FHFGSP and TFN, mathematical modelling of FHFGSP from the perspective of optimization objectives is needed to facilitate a better understanding of the problem to solve it. The interpretation of the relevant symbols appearing in the FHFGSP is shown in
Table 1.
Subject to:
where (4) gives the objective of the FHFGSP to minimize both MS and TEC (5)–(10) give the associated constraints. (5) guarantees that each job i can be assigned to a specific machine k for processing at speed v at each stage j. (6)–(9) guarantees that no interruptions and preemptions by jobs are allowed during the processing and setup phases. (10) indicates that the machine starts processing as soon as setup is complete. (11) indicates that MS is determined by the end time of the last job to be processed in the final stage. (12) indicates that the TEC consists of three components, PE indicates the energy consumption of the machine while processing the job, SE indicates the energy consumption of the machine during the setup time, IE indicates the energy consumption of the machine during the idle time. (13) denotes the actual power of job i when it is processed at speed v in stage j. (14)–(16) are the specific information of PE, SE, and IE, respectively, all energy consumption is obtained by multiplying power by time.
4. SDABC of FHFGSP
This section presents the proposed SDABC algorithm for solving FHFGSP. The basic framework of the ABC algorithm is first presented, and then the encoding and decoding scheme and the energy saving procedure are described, followed by the details of SDABC, and finally a summary.
4.1. The Framework of ABC
In ABC, during the initialization phase, a set of food source locations are randomly selected by bees and their nectar amount is determined, then these bees enter the colony and share nectar information. Each search cycle consists of three steps. In the first phase, after information sharing, each employed bee searches for information in the vicinity of the food source location and abandons the old food source to choose a new food source if a better one is found. In the second phase, the onlooker bee selects a food source to follow based on the nectar distribution information sent by the employed bee, the better the food source the more likely it is to be followed. If the current food source is not updated for a long time, the employed bee will abandon the current food source and become a scout bee. The scout bee randomly selects a new food source to replace the abandoned food source. The overall framework of the basic ABC framework is shown in Algorithm 1.
| Algorithm 1 Framework of the basic ABC framework |
Input: population P;
Output: results;
1: Initialize population P;
2: while requirements are met do
3: Employed bees to explore around food sources;
4: Onlooker bees select good individuals to follow and explore around the food source;
5: if triali > threshold limit then
6: Employed bees transformed into scout bees looking for new food sources;
7: end if
8: end while
9: return results. |
In this paper, the linear weighted sum method is used as the decomposition method. For a multi-objective optimization problem with m objectives, a weight vector
λ = (
λ1,
λ2, …,
λm)
T is added, where
i represents the sum of the weight values of the
i-th objective. As shown in (17).
where
fi(
xi) is the objective value for the
i-th objective. Since this paper is a two-objective problem,
λ = (
λ1,
λ2,)
T the values of
λ1 are taken in {0/
H, 1/
H, …,
i/
H, …,
H/
H}, where
H =
N − 1 and
λ2 = 1 −
λ1.
4.2. Coding Scheme
This subsection gives the encoding and decoding scheme of FHFGSP. The objective of FHFGSP is the minimum MS and TEC. To achieve these two optimization objectives, it is necessary to determine the sequence of jobs in each stage, the machine allocation for each stage of the job, and the speed at which each stage of the job is processed on the machine. Due to the characteristics of FHFGSP, each job needs to go through the same processing stages, so we only need to determine the sequence of jobs into the first stage, and the sequence of jobs in other stages can be determined automatically. However, since the processing speed of each job in each stage is independent of the preceding and following stages and the preceding and following jobs, the processing speed of each job in each stage is independent of the preceding and following jobs. Therefore, the speed of each job in each stage should be determined separately.
Therefore, the solution is coded in two parts. The first part is the sequence of jobs into the first stage. The second part is the velocity selection matrix. In this paper, the two parts of the solution are represented as follows:
where
πn denotes the
n-dimensional job sequence vector,
πi is the sequence number of the
i-th job entering the machine,
Vm×n represents the speed matrix of the jobs, and
vi,j is the machine processing speed level of the
i-th job at stage
j.
The second part represents the solution to the three-stage scheduling problem for three jobs as <
π3,
V3×3>. As shown below, the solution to the three-stage scheduling problem for three jobs is denoted as <
π3,
V3×3>.
π3 indicates that the order in which jobs enter the first stage of scheduling is job1, job3, and job2.
V3×3 indicates that in the three stages, job1 is processed at levels 1, 2, and 3, while job2 is processed at levels 2, 1, and 1, and job3 is processed at levels 2, 1, and 3, respectively.
After the coding scheme is determined, it needs to be decoded into an actual scheduling scheme to make sense. The detailed decoding scheme is as follows. In the first stage, machines are available at the moment 0. According to the order of jobs in πn, the jobs are placed on the machine that can be executed earliest and the jobs are processed according to the corresponding speed in the speed matrix, after which the available time of the machine is updated before processing the next job. The following steps are performed for each job in turn in the other stages:
Step 1: Process the job according to its completion time in the previous stage, according to the first-come, first-served principle, i.e., the one that was completed earlier in the previous stage and arrives at this stage first is processed first.
Step 2: Based on the speed in the speed matrix, select the parallel machine that can process the job as early as possible.
Step 3: Update the available time of the machines. Assuming that machine k is available at the moment 0, it takes 3 times to process job i and 1 time to set up, then the available time of the machine is 0 + 3 + 1 = 4 times.
4.3. Initialization and Energy Saving Procedures
After determining the encoding, it is necessary to initialize the populations and external populations. In this paper, the population is initialized in a random way, and for each individual, the job sequence and velocity matrix are generated randomly.
After the population initialization is completed, the dominance relationship between individuals needs to be calculated and the non-dominated solutions are populated with external population.
Although the two optimization objectives of the FHFGSP conflict with each other, it is possible to use a suitable strategy to improve the other objective while controlling one optimization objective constant. To obtain high-quality solutions, individuals use an energy-saving procedure after initialization with the aim of further improving the quality of the population. The basic idea of the energy-saving procedure is to achieve a reduction of PE in TEC by reducing the processing speed of the job while controlling a constant MS.
To achieve constant MS, the energy-saving procedure uses the idea of backtracking. Starting from the last job in the last stage, the processing speed of the job is minimized without affecting the completion time of other jobs. The detailed steps are shown in Algorithm 2, where the symbols that appear are given in
Table 1.
| Algorithm 2 Energy saving procedure |
Input: sequence of assignments in order of completion, π’;
speed selection matrix, V;
integer related to the number of parallel machines, k;
Output: new speed selection matrix, V*;
1: i’ = the job processed on machine k after i;
2: i* = the job processed on machine k before i
3: for j = m to 1 do
4: for l = n to 1 do
5: i← Index of the l-th job in π’;
6: for v* = 1 to vi,j do
7: if pti,j,v* <= bi’,j - sti*,i,j-sti,i’,j- ei*,j then
8: vi,j ← v*;
9: bi,j = ei,j- pti,j,v*;
10: break;
11: end if
12: end for
13: end for
14: end for
15: return V*. |
4.4. Employed Bees
During the employed bee phase, each individual tries to search around the food source to obtain a better food source. The food source is the solution to the problem.
In order to allow the employed bee to fully explore around the solution, a local search strategy based on ranking is proposed, with the central idea that high-quality solutions are used to guide bad solutions to update themselves.
First, there is a requirement to identify high quality individuals in population. A new way of determining high-quality individuals is proposed. The quality of each individual is related to two factors: the number of dominant solutions and the similarity to the ideal solution. (21) gives a high-quality assessment function for each individual, where
ni denotes the number of solutions in population that are dominated by the current individual
i,
d+, and
d- denote the Euclidean distances to the ideal and negative ideal solutions, respectively. (22) gives the formula for the Euclidean distance, where
xi denotes the
i-th subproblem of the current solution and
x*i denotes the
i-th subproblem of the ideal solution. Since this paper is about finding a minimum of two objectives, the ideal solution is the lower boundary of the search space and the negative ideal solution is the upper boundary of the search space.
The high-quality individuals then guide the poor individuals to self-renewal when the employed bees search around solutions. The high-quality individuals guided the poor individuals to different degrees, and (23) gives the degree to which each individual
i guided the poor individuals. It is worth noting that the high-quality individuals only guide the poorer individuals in their neighborhood. The Euclidean distance of each individual
i in population from other individuals was calculated and the nearest
T individuals were selected as neighbors of
i.
In addition, in order to prevent individuals in the population from leading differential updates that affect other individuals that have already been updated and destroy the structure of individuals, individuals in population are sorted in a non-ascending order according to their quality, and individuals that have already been updated do not participate in updates in the same population.
It is also worth noting that five update strategies are used in this paper, depending on the problem to be solved. These strategies are insertion and exchange of working sequences, mutation of velocity matrices, and insertion mutation and cross mutation of working sequences and velocity matrices. The employed bees obtain possible solutions based on these update strategies.
The employed bees search around the solution starting from the first update strategy. If the currently selected update strategy does not yield a solution with high fitness, then the next employed bee searches based on the next update strategy until it finds a high-quality solution. When all five update strategies have been searched, the search starts from the first one again. The flow of the employed bee phase is shown in Algorithm 3, where Quality() means calculating the quality of each individual according to (21), Level() means determining the degree to which an individual leads the difference solution, GetNew() means updating individuals according to the strategy qi with an initial value of 1 for qi, and GetBad() means obtaining the difference solution that has a high similarity to the current individual and has not been updated.
4.5. Onlooker Bees
In the onlooker bee phase, the onlooker bee will select good food sources for further search based on the information conveyed by the employed bee, with the aim of obtaining high-quality solutions and accelerating the convergence of the algorithm. In this paper, a sorting-based selection strategy is proposed to improve the search efficiency of the onlooker bee and speed up the convergence of the algorithm. First, the individuals in population are ranked according to (21), and those with small values are in the front. The high-quality solutions are placed in front of the bad solutions. Then, the onlooker bee selects an individual in population to follow according to (24), in which (24),
i represents the
i-th individual to follow and
N denotes the population size. Therefore, the individual with the top ranking has a higher probability of being selected.
| Algorithm 3 Employed bee phase |
Input: population P;
Output: new population, P’;
1: P’ = P;
2: for i = 1 to N do
3: si = Quality(Xi);
4: end for
5: Sort(P’, s);
6: for i = 1 to N do
7: li = Level(Xi);
8: X’i = GetNew(Xi,qi);
9: for z = 0 to li do
10: if z = 0 then
11: if X’i < Xi then
12: Xi = X’i;
13: qi = 1;
14: else
15: qi = qi + 1;
16: end if
17: if qi > 5 then
18: qi= 1;
19: end if
20: else
21: Xb=GetBad(Xi);
22: if X’i < Xb then
23: Xb = X’i;
24: break;
25: else
26: qb = qb + 1;
27: end if
28: end if
29: end for
30: end for
31: return P*. |
After selecting the individual
Xindex according to the selection method proposed in this paper, the onlooker bees randomly select the neighboring individual
Ti of the current individual for two-point crossover [
41] to generate a new individual. The two-point crossover is divided into two parts: the sequence of operations and the velocity matrix, and the specific operation is as follows: two points in the range are randomly selected, the part between two points in
Xindex is left untouched, and the rest is filled by
Ti. For the job sequence, the remaining positions in
Xindex are filled by the jobs in
Ti that are different from the remaining jobs in
Xindex in turn. For the velocity matrix the remaining positions in
Xindex are filled by the corresponding positions in
Ti.
Regarding the newly generated individuals, the algorithm will decide whether to replace the original individuals according to the greedy selection algorithm. In particular, in order to prevent the algorithm from falling into local optimum, this paper introduces mutation in the onlooker bee phase, and the probability of mutation of individuals in the population is 1/N. This avoids the algorithm from falling into local optimum to some extent. The whole onlooker bee detailed process is shown in Algorithm 4.
| Algorithm 4 Onlooker bee phase |
Input: population, P;
Output: new population, P’;
1: P’ = P;
2: for j = 1 to N do
3: sj = Quality(Xj);
4: end for
5: Sort(P’, si);
6: for j = 1 to N do
7: Xindex = Select(P’)
8: Ti = GetNeighborhood(Xindex);
9: Xchild = TPX(Xindex,Ti);
10: if 0.1 < Random() then
11: Xchild =Mutation(Xchild);
12: end if
13: if Xchild < Xindex then
14: Xindex =Xchild;
15: end if
16: if Xchild) < Ti then
17: Ti = Xchild;
18: end if
19: end for
20: return P’. |
In Algorithm 4, Select() indicates that the onlooker bee selects a food source to follow according to (23), GetNeighbourhood() indicates a random selection from the neighbors of the food source, TPX() indicates the two-point crossover, and Mutation() represents mutation of an individual X, including the job sequence and speed selection matrix.
4.6. Scouting Bees
If a solution is not updated for a long time, the solution will be abandoned and the employed bee will then be transformed into a scout bee, choosing a new solution at random in the solution space. As random search is uncontrollable, this random strategy does not have a positive impact on the algorithm, therefore, this paper uses a neighborhood-based solution swapping strategy to improve the efficiency of the scout bee phase of the algorithm [
34]. This is because the solutions of neighboring sub-problems should be similar.
The scout bee searches in the following way: for a solution that has not improved after
L cycles, the scout bee first finds a more suitable solution among its neighboring individuals. Then they exchange them with each other. If no better one is found, one individual is randomly chosen to exchange with each other. The basic procedure is described in Algorithm 5, where
L(
Xi) denotes the number of cycles
Xi has gone through,
T denotes the number of neighboring individuals,
Xi,j denotes the
j-th neighboring individual of the
i-th solution.
| Algorithm 5 Scout bee phase |
Input: population, P;
Output: new population, P’;
1: for i = 1 to N do
2: if L(Xi) > L then
3: for j = 1 to T do
4: if Xi,j < Xi then
5: Xi,j Xi;
6: break;
7: end if
8: end for
9: if j > T then
10: r = Rand(1, T);
11: Xi,r Xi;
12: end if
13: end if
14: end for
15: return P’. |
4.7. The Whole Process of the Algorithm
This section outlines the entire algorithmic process of SDABC. It can be roughly divided into four steps.
Step 1: The population is initialized randomly and is energy-efficient to improve the quality of the solution.
Step 2: Sort the population in the manner described in
Section 4.4 and perform the algorithmic operations described in
Section 4.5,
Section 4.6 and
Section 4.7 in sequence, while updating the domain relationships of individuals in population and the external populations after each subsection is completed.
Step 3: Repeat Step 2 until the end conditions are met.
Step 4: Perform another energy saving procedure on the external population.
The algorithm flow of SDABC can be shown in
Figure 1.
5. Experiment
In this section, the proposed SDABC algorithm and strategy will be evaluated through experiments. Firstly, the parameter settings of FHFGSP and the performance indicators of the evaluation algorithm are introduced. Then the proposed strategy is compared with other common strategies in experiments. Finally, SDABC is compared with other algorithms in experiments.
The algorithm proposed in this paper is coded in C++ and performed in Codeblocks 16.01. All experiments were run on a PC with an Intel(R) Core (TM) i3-8100U CPU, 3.60 GHz, and 8 GB RAM. Maximum CPU usage time t = 100 was used as a stopping criterion.
5.1. Test Data
In order to fully evaluate the performance of the algorithm from different levels, the performance of SDABC needs to be tested by selecting different problem instances. The parameters controlling the problem instances are
n,
m, and
st. In this paper, to extensively test the ability of SDABC to solve HFSP of different sizes, five different levels of
n, four different levels of
m and four different levels of
st were designed [
34]. This results in 80 problem combinations of different levels. Once the
n, m, and
st of the problem instances have been determined, it is also necessary to set them separately for the job and the workshop environment. For job
i, the processing speed
v and the standard processing time
p need to be set, and for the shop environment, the number of parallel machines per stage
k needs to be set, by means of the previous problem description. It is also necessary to set the energy consumption per unit time of the machines in the processing phase, the setup phase and the idle phase. To avoid chance in the algorithm results, five instances were generated for each problem combination. In summary, the factors and their levels of FHFGSP in generating test data are summarized in
Table 2.
5.2. Performance Metrics
Three popular metrics for evaluating multi-objective optimization problems (MOPs) [
34,
42,
43], namely the number of non-dominant solutions, set coverage, and inverse generation distance, were adapted to evaluate the performance of SDABC. The mean and standard deviation of each metric at each level were obtained from 400 instance problems of the FHFGSP over 30 independent iterations.
- (1)
Number of non-dominated solutions (N-metric). This metric is the number of non-dominant solutions produced by the algorithm, with higher values indicating better performance the closer the PF is.
- (2)
Inverse Generational Distance (
IGD-metric). This metric evaluates the convergence and distribution performance of the algorithm.
where
d(
v, A) is the minimum Euclidean distance between
v and the point in
A. The smaller the value, the better the comprehensive performance of the algorithm including convergence and distribution performance. Since the real PF* cannot be solved, all non-dominated solutions obtained jointly by the algorithms of each comparison are used as PF* in this paper.
- (3)
Set coverage (
C-metric). This metric measures the dominance relationship between the two solution sets
A and
B.
where
C(
A,
B) represents the percentage of ideal solutions in
B that are identical or dominant to those in
A. The higher the value, the higher the performance.
In order to eliminate the effect of different metrics, a very simple max-min method [
44] is used in this paper to normalize the obtained MS and TEC as follows.
5.3. Effect of Search Strategy
To evaluate the performance of the search strategy, SDABC with a search strategy was compared with DABC without a search strategy. All content factors of the algorithm were the same except for the difference in the employed bee phase search strategy. The evaluation results of the three metrics for the two strategies are shown in
Table A1,
Table A2 and
Table A3 (Tables in
Appendix A), where the better values are shown in bold and the last row is the average of the 20 problem dimensions.
For the
N-metric, it can be seen from
Table A1 that SDABC has a higher average (AVG) for 85% of the questions and a lower standard deviation (SD) for 75% of the questions. In summary: no problems were found in DABC where both the AVG and SD were better than in SDABC, so SDABC led to better results. For the FHFGSP, for which it is difficult to find the exact solution, a higher
N-metric can plot the PF more accurately and also help managers to get more options. Therefore, SDABC is more advantageous in this respect.
This is because in the search phase, the employed bee is able to obtain more non-dominated solutions by searching around the individual to different degrees depending on the number of dominant solutions and the similarity of the ideal solutions.
For the
C-metric, it can be seen from
Table A2 that, with the exception for 20 × 5 and 60 × 3, SDABC resulted in a better AVG on 90% of the questions and obtained a lower SD on 79% of the questions. Overall SDABC achieved a lower AVG and SD than DABC. To better show the difference between the
C-metric obtained by SDABC and DABC, a boxplot of the two is plotted in
Figure 2, and it can be seen that SDABC is able to obtain more concentrated and dense values and the median was significantly higher for SDABC than DABC. For the values of C (SDABC, DABC) away from the whole, which is the
C-metric obtained for question 100 × 5, a comparison of
Table A2 shows that lower values were obtained with DABC for the same question.
This indicates that the quality of the solutions obtained by SDABC is higher than that of DABC. This is because in the employed bee phase, the employed bee searches around the individual to different degrees based on the similarity between the current solution and the ideal solution, and by being guided by the ideal solution, the employed bee is able to obtain a high-quality solution.
For the
IGD-metric, it can be seen from
Table A3 that SDABC obtains a lower mean value than DABC, except for 20 × 5, 60 × 8, and 80 × 10. For 75% of the questions, SDABC obtained a lower SD. Taken together, SDABC obtained a lower AVG and SD. In order to show the difference more graphically, a boxplot of the two is plotted in
Figure 3. It can be seen that SDABC is able to obtain a much more concentrated lower IGD and a much lower median value than DABC.
This indicates that the solutions obtained by SDABC are better than DABC in terms of diversity and convergence. This is due to the design of five different directions in the search phase, which improves the diversity of solutions obtained. The employed bee improved the convergence by searching around individuals based on the number of dominant solutions and the similarity of ideal solutions.
5.4. Effect of Selection Strategy
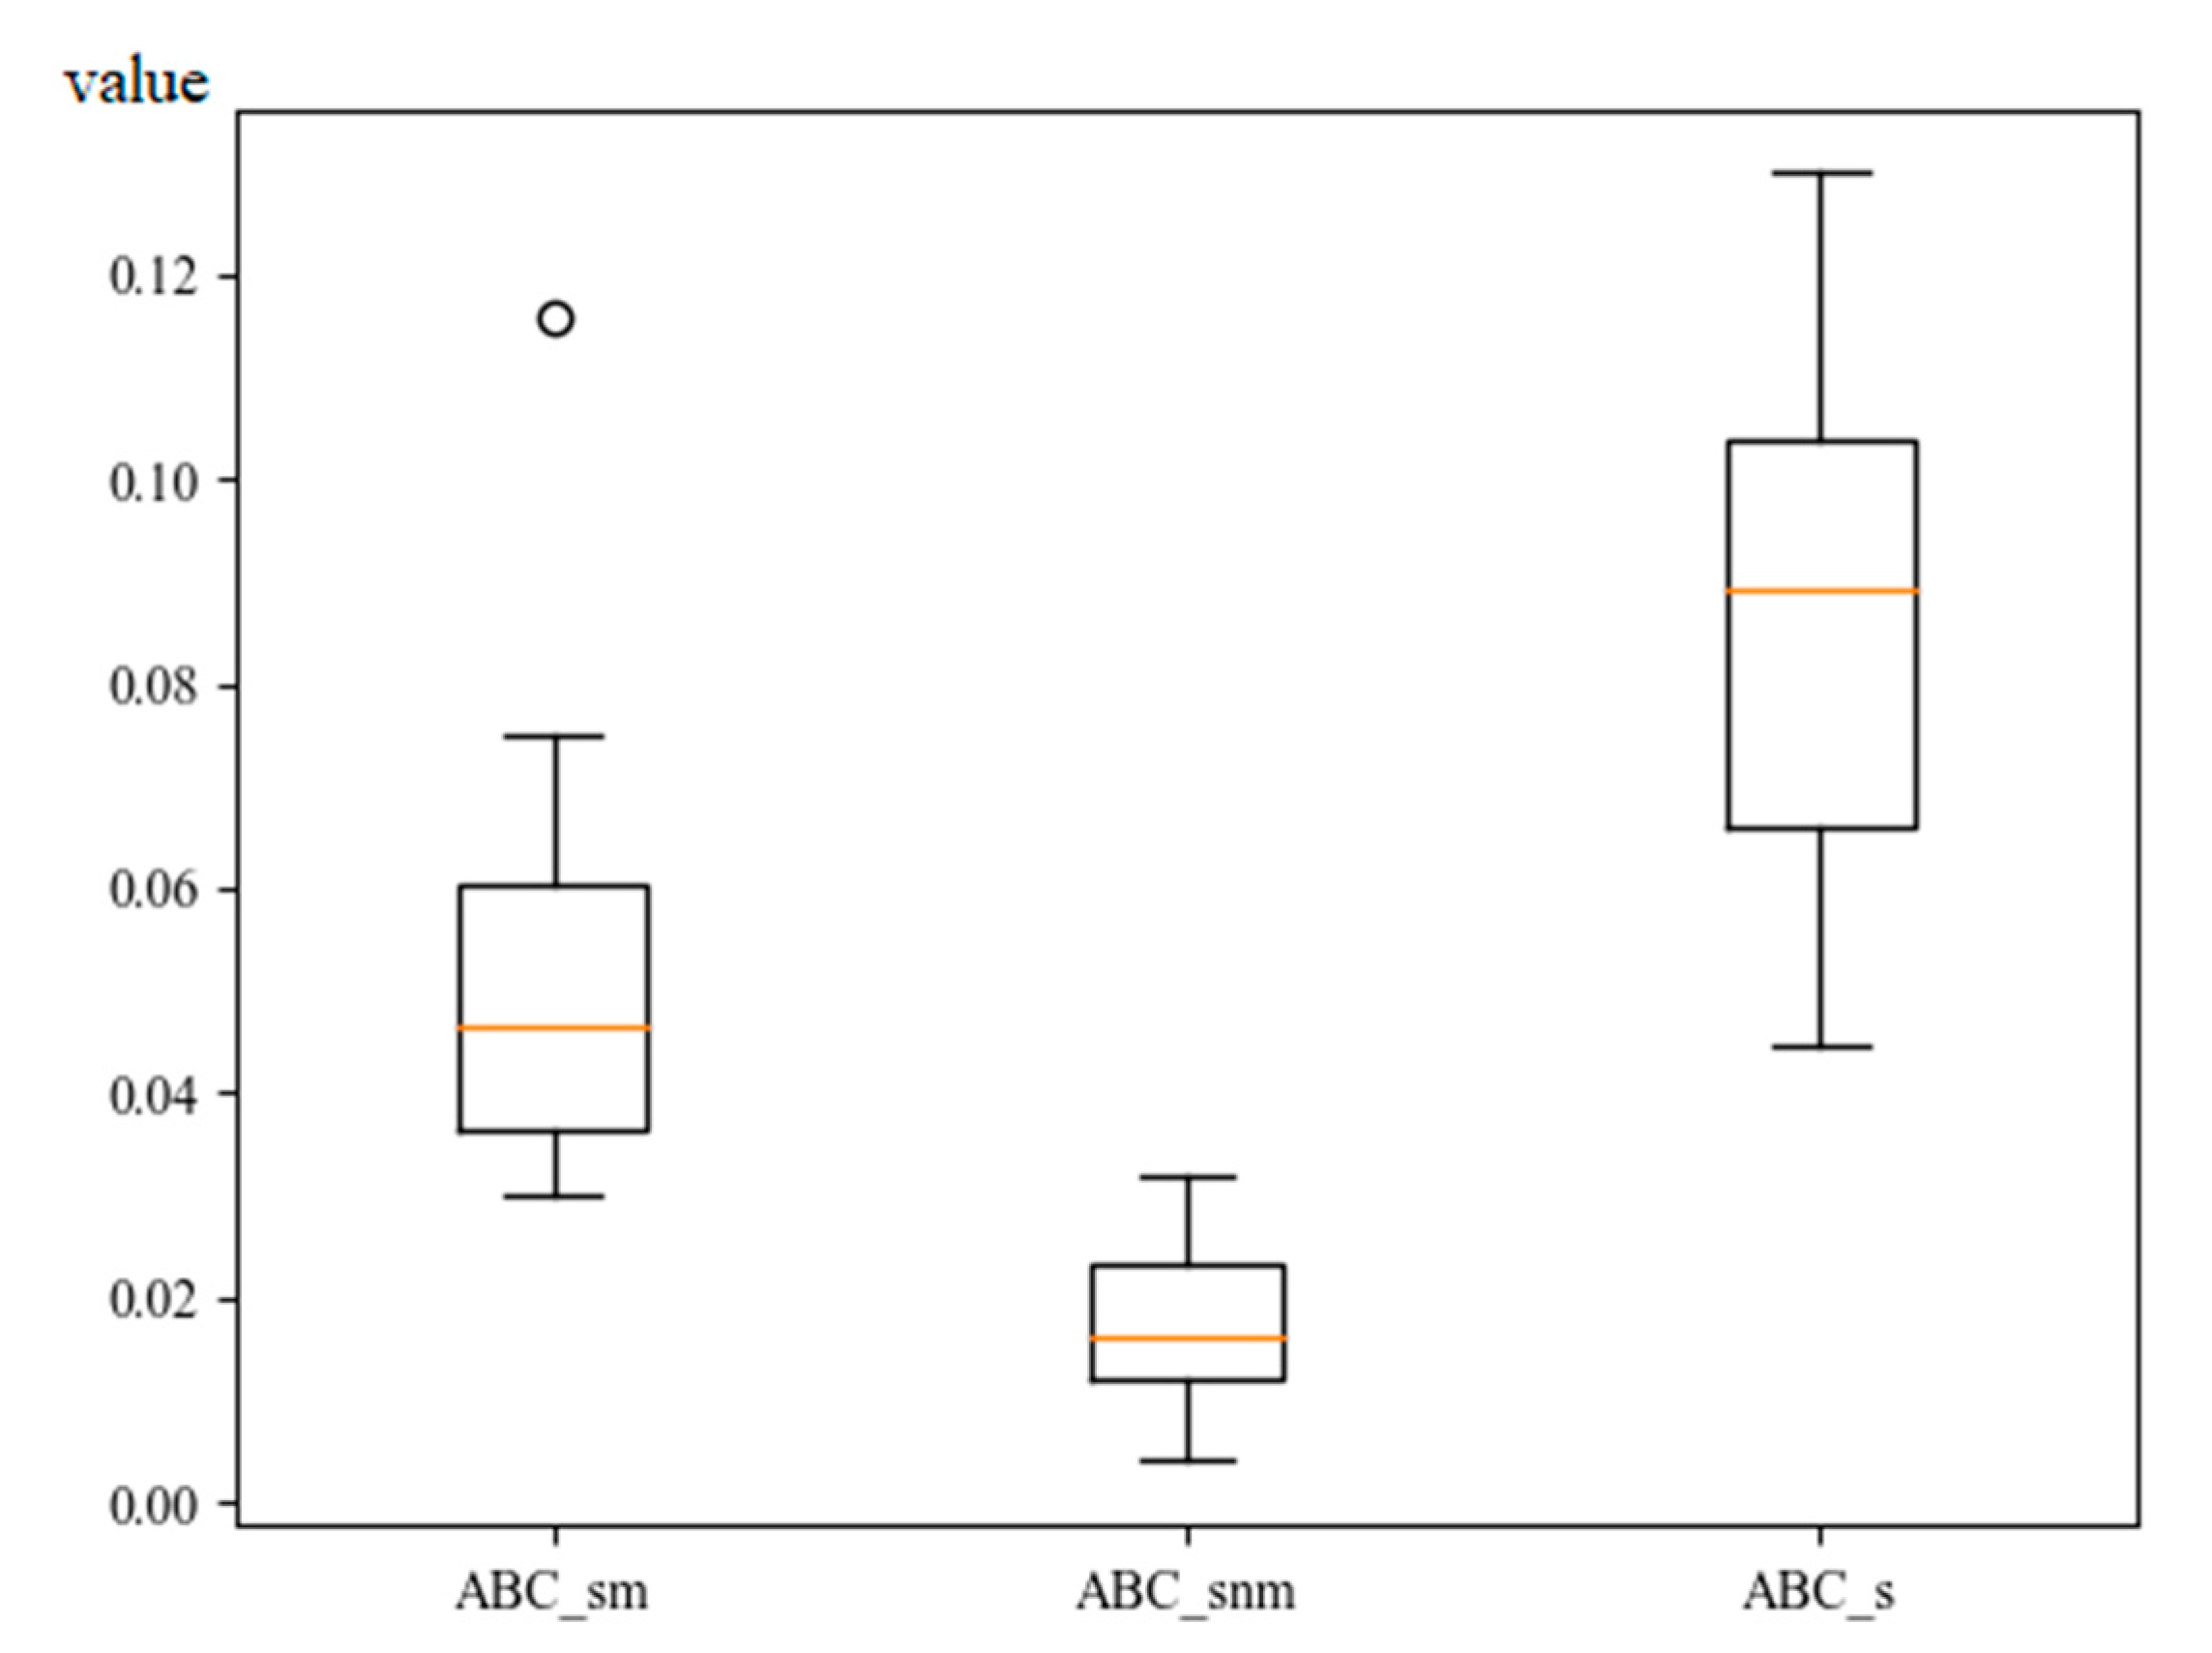
Three different selection strategies were compared, in order to evaluate the performance of the newly proposed selection strategy. The three strategies are as follows: the selection strategy proposed in this paper (denoted by ABC_snm), the selection strategy in which individuals in population are selected according to similarity with mutation (denoted by ABC_sm), and the selection strategy in which individuals in population are selected according to similarity without mutation (denoted by ABC_s). The evaluation results of the three metrics for the three strategies are shown in
Table A4,
Table A5 and
Table A6, where the better values are shown in bold and the last row is the average of the 20 problem dimensions.
For the
N-metric, it can be seen from
Table A4 that ABC_snm obtained significantly better mean values than ABC_s. Compared to ABC_sm, ABC_snm achieved better results in 80% of the questions. For SD, ABC_s obtained a lower SD value due to the fact that the size of SD is positively related to AVG, and ABC_s has a significantly smaller AVG value, so the resulting SD is also smaller. However, on balance ABC_snm was able to obtain more non-dominated solutions, giving the manager more options to choose from.
This indicates that it is more advantageous to select individuals in the onlooker bee phase based on the number of solutions dominated by them and their similarity to the ideal solution than to select only on the basis of similarity. A comparison of the three can reveal that ABC_snm was able to obtain a greater number of non-dominated solutions.
For
C-metric, it can be seen from
Table A5 that ABC_snm obtains significantly better AVG and SD than ABC_s and ABC_sm. In each problem, ABC_snm achieves better results. Of course, overall, ABC_snm also obtains better AVG and SD than the other two strategies.
Figure 4 plots the boxplots of the
C-metric obtained by the three strategies, and it can be seen that ABC_snm is able to obtain more concentrated values and obtains a much higher median than the other two strategies, and the minimum value obtained for ABC_snm is also higher than the maximum values of ABC_s and ABC_sn.
This indicates that in this paper the proposed strategy is able to give obtain high-quality non-dominated solutions. This is due to the fact that the adopted selection strategy can speed up the convergence of the algorithm and the adopted mutation strategy can prevent the algorithm from falling into local optimum.
For
IGD-metric, it can be seen from
Table A6 that in each problem, ABC_snm obtained significantly lower AVG than ABC_s and ABC_sm. In total, 85% of the problems in ABC_snm had smaller SDs than the other two algorithms. As a whole, both the AVG and SD of ABC_snm are smaller than the other two strategies.
Figure 5 plots the boxplot of the
IGD-metric obtained by the three algorithms, and it can be seen that ABC_snm is able to obtain more concentrated values, and the median obtained is much lower than the other two strategies.
This indicates that in this paper the proposed strategy has better diversity and convergence. This is because there is some probability that some low-quality individuals are also selected, which improves the diversity of the algorithm to some extent, and the proposed mutation strategy also has some contribution to the diversity. In addition, the adopted selection strategy can speed up the convergence of the algorithm.
5.5. Evaluation of SDABC
In this subsection, SDABC is compared with IMDABC, MDABC, and NSGAII. All algorithms use the same CPU time as a stopping criterion and all use the same parameter settings, and the results are shown in
Table A7,
Table A8,
Table A9,
Table A10,
Table A11,
Table A12 and
Table A13, respectively. The last row of the table represents the average of the 20 problems. The best parts are marked in bold.
Table A7 shows the
N-metrics obtained by the four algorithms, and it can be seen that the average values obtained in SDABC are higher than the three remaining algorithms. The values obtained by SDABC are significantly higher than IMDABC and NSGAII in each problem. In addition, although some values of MDABC are higher than SDABC, the difference is not significant, and SDABC achieves higher values in 70% of the problems. To sum up, SDABC is able to obtain more non-dominated solutions compared to other algorithms.
This is because the search strategy proposed by the SDABC in the employed bee phase proposed in this paper is able to search in both depth and breadth directions, enhancing the diversity of individuals and contributing to obtaining a greater number of solutions.
Table A8,
Table A9 and
Table A10 show the
C-metric obtained by the four algorithms, and it can be seen that the AVG and SD obtained by SDABC are significantly higher than IMDABC, MDABC and NSGAII in each of the problems except for the 100 × 10 problem in
Table A10 where the SD is slightly higher.
Figure 6 shows a boxplot of the
C-metric obtained by SDABC versus the other three algorithms. The outliers in (a) are the
C-metric obtained for problem 100 × 5. In
Table A8, both C-metrics for 100 × 5 are lower than the overall value, but SDABC’s is better than IMDABC’s. In (b) it can be seen that SDABC is significantly higher than NSGAII overall. Two independent values of C (SDABC, MDABC) in (c) are for problems 100 × 3 and 100 × 5. While these two values deviate from the overall, SDABC has a higher quality AVG and SD for the same problem dimension. Additionally, the median of SDABC is significantly higher than the other three algorithms. Therefore, SDABC obtains solutions of significantly higher quality than IMDABC, MDABC and NSGAII.
This is because SDABC follows the individual in the population in both the employed and onlooker bee phases. The evolution of SDABC continued in accordance with the dominance of individuals in population and the similarity to the ideal solution. At the same time, it is possible to find high-quality solutions faster.
Table A11,
Table A12 and
Table A13 show the
IGD-metric obtained by the four algorithms, and it can be seen that in each problem SDABC obtains significantly lower AVG and SD than IMDABC, MDABC, and NSGAII.
Figure 7 plots the boxplot of the
IGD-metrics obtained by the four algorithms.
Figure 7a shows that the overall and median SDABC is much lower than IMDABC.
Figure 7b demonstrates that SDABC has a better concentration than MDABC.
Figure 7c indicates that SDABC has a better overall and median quality than NSGAII. With
Figure 7, we can see that the SDABC distribution is more concentrated under the condition of obtaining a lower
IGD.
This indicates that SDABC performs better than IMDABC, MDABC, and NSGAII in terms of convergence and diversity. This is because SDABC takes five different search directions in the employed bee phase and also explores them to different degrees depending on the ranking, both of which can become a more adequate search for individuals in the solution space and increase the diversity of the population. In addition, in the onlooker bee phase, every individual in population has the potential to be tracked. It also contributes to the diversity of the algorithm due to the introduction of the variation strategy. In terms of convergence, both the employed bee and the onlooker bee phases operate based on ranking, which speeds up the convergence of the population based on the similarity and dominance with the ideal solution.
6. Conclusions
In this paper, we studied the FHFGSP with fuzzy processing time that minimizes makespan and total energy consumption. To solve FHFGSP, a discrete artificial bee colony algorithm based on similarity and non-dominated solution ordering was proposed. After extensive numerical experiments, it can be demonstrated that the proposed strategy and algorithm outperforms other algorithms in terms of performance.
In the employed bee phase, individuals fully explore around the dominant solution; in the onlooker bee phase, individuals at the front of the sequence have a greater chance of being followed; in addition, a mutation strategy was proposed to prevent the population from falling into a local optimum. The algorithm produced solutions of high-quality in terms of quantity, quality, convergence, and distribution.
In future, our aim is to study more flexible HFGSPs, such as the proficiency of shop workers, and to consider other green metrics, such as noise and carbon emissions. We will verify the effectiveness of the algorithm by comparing it with more optimization algorithms based on mimicking animal behavior, which will have a positive impact on the role of such algorithms in relation to the green shop scheduling problem. In addition, as smart manufacturing continues to evolve and people start to use information physical systems and industrial Internet of Things to obtain data in real time during manufacturing processes, it is also interesting to study how to process real-time state data for decision making and optimization of green shop scheduling.
Author Contributions
Conceptualization, M.L. and G.-G.W.; methodology, M.L.; software, M.L.; validation, M.L., G.-G.W. and H.Y.; formal analysis, M.L.; investigation, G.-G.W.; resources, H.Y.; data curation, H.Y.; writing—original draft preparation, M.L.; writing—review and editing, M.L., G.-G.W. and H.Y.; visualization, M.L., G.-G.W.; supervision, G.-G.W.; project administration, H.Y. All authors have read and agreed to the published version of the manuscript.
Funding
National Natural Science Foundation of China (No. U19A2061), National Key R&D Program of China (No. 2019YFC1710700), Science and Technology Development Project of Jilin Province (No. 20190301024NY and No. 20200301047RQ).
Institutional Review Board Statement
Not applicable.
Data Availability Statement
Not applicable.
Conflicts of Interest
The authors declare no conflict of interest.
Appendix A
Table A1.
N-metric for search strategy.
Table A1.
N-metric for search strategy.
| Problem | DABC | SDABC |
|---|
| AVG | SD | AVG | SD |
|---|
| 20 × 3 | 86 | 62 | 92 | 59 |
| 20 × 5 | 65 | 36 | 67 | 40 |
| 20 × 8 | 45 | 16 | 49 | 16 |
| 20 × 10 | 40 | 16 | 44 | 15 |
| 40 × 3 | 106 | 72 | 110 | 71 |
| 40 × 5 | 54 | 30 | 59 | 32 |
| 40 × 8 | 34 | 16 | 34 | 15 |
| 40 × 10 | 25 | 11 | 23 | 9 |
| 60 × 3 | 79 | 58 | 76 | 52 |
| 60 × 5 | 50 | 21 | 54 | 25 |
| 60 × 8 | 32 | 12 | 33 | 11 |
| 60 × 10 | 26 | 10 | 28 | 9 |
| 80 × 3 | 61 | 53 | 65 | 55 |
| 80 × 5 | 32 | 20 | 42 | 29 |
| 80 × 8 | 30 | 11 | 28 | 10 |
| 80 × 10 | 22 | 9 | 22 | 8 |
| 100 × 3 | 58 | 46 | 63 | 53 |
| 100 × 5 | 38 | 25 | 36 | 24 |
| 100 × 8 | 25 | 13 | 25 | 12 |
| 100 × 10 | 22 | 9 | 23 | 10 |
| Mean | 47 | 27 | 49 | 28 |
Table A2.
C-metric for search strategy.
Table A2.
C-metric for search strategy.
| Problem | C(DABC,SDABC) | C(SDABC,DABC) |
|---|
| AVG | SD | AVG | SD |
|---|
| 20 × 3 | 0.93880 | 0.04258 | 0.93900 | 0.06198 |
| 20 × 5 | 0.95766 | 0.04046 | 0.92896 | 0.04124 |
| 20 × 8 | 0.88912 | 0.07329 | 0.96045 | 0.03546 |
| 20 × 10 | 0.88997 | 0.08919 | 0.90871 | 0.07201 |
| 40 × 3 | 0.93179 | 0.05220 | 0.94715 | 0.05798 |
| 40 × 5 | 0.88794 | 0.06988 | 0.93452 | 0.05402 |
| 40 × 8 | 0.86480 | 0.10236 | 0.90333 | 0.07605 |
| 40 × 10 | 0.86490 | 0.10413 | 0.88452 | 0.06131 |
| 60 × 3 | 0.92796 | 0.05899 | 0.90222 | 0.07063 |
| 60 × 5 | 0.86644 | 0.14676 | 0.89354 | 0.10818 |
| 60 × 8 | 0.92089 | 0.06839 | 0.92381 | 0.05100 |
| 60 × 10 | 0.90767 | 0.05409 | 0.93009 | 0.04827 |
| 80 × 3 | 0.86559 | 0.14008 | 0.89635 | 0.07251 |
| 80 × 5 | 0.79823 | 0.22431 | 0.86336 | 0.15612 |
| 80 × 8 | 0.87951 | 0.09336 | 0.93812 | 0.06277 |
| 80 × 10 | 0.92683 | 0.07375 | 0.93418 | 0.04575 |
| 100 × 3 | 0.84100 | 0.16037 | 0.87990 | 0.13044 |
| 100 × 5 | 0.78436 | 0.18936 | 0.78886 | 0.19950 |
| 100 × 8 | 0.88830 | 0.08372 | 0.92509 | 0.07065 |
| 100 × 10 | 0.92985 | 0.05288 | 0.93574 | 0.06011 |
| Mean | 0.88808 | 0.09601 | 0.91090 | 0.07680 |
Table A3.
IGD-metric for search strategy.
Table A3.
IGD-metric for search strategy.
| Problem | DABC | SDABC |
|---|
| AVG | SD | AVG | SD |
|---|
| 20 × 3 | 0.02663 | 0.02198 | 0.01794 | 0.03307 |
| 20 × 5 | 0.01793 | 0.02496 | 0.02749 | 0.01907 |
| 20 × 8 | 0.03927 | 0.02212 | 0.01332 | 0.01327 |
| 20 × 10 | 0.03363 | 0.02926 | 0.02788 | 0.02733 |
| 40 × 3 | 0.02985 | 0.03042 | 0.01365 | 0.01382 |
| 40 × 5 | 0.05140 | 0.04928 | 0.02094 | 0.02754 |
| 40 × 8 | 0.05918 | 0.05344 | 0.02634 | 0.01598 |
| 40 × 10 | 0.05839 | 0.04808 | 0.03257 | 0.02078 |
| 60 × 3 | 0.03715 | 0.02399 | 0.02437 | 0.02303 |
| 60 × 5 | 0.05341 | 0.04582 | 0.03521 | 0.03348 |
| 60 × 8 | 0.02940 | 0.03220 | 0.03209 | 0.02915 |
| 60 × 10 | 0.04229 | 0.04451 | 0.02626 | 0.02061 |
| 80 × 3 | 0.04921 | 0.04863 | 0.02606 | 0.02082 |
| 80 × 5 | 0.07811 | 0.07623 | 0.04645 | 0.05436 |
| 80 × 8 | 0.04589 | 0.03531 | 0.03138 | 0.04547 |
| 80 × 10 | 0.03663 | 0.04203 | 0.04585 | 0.05587 |
| 100 × 3 | 0.05310 | 0.06431 | 0.05235 | 0.06774 |
| 100 × 5 | 0.06235 | 0.03463 | 0.04102 | 0.03457 |
| 100 × 8 | 0.05340 | 0.05929 | 0.03441 | 0.03360 |
| 100 × 10 | 0.04582 | 0.04686 | 0.04199 | 0.06017 |
| Mean | 0.04515 | 0.04167 | 0.03088 | 0.03249 |
Table A4.
N-metric for selection strategy.
Table A4.
N-metric for selection strategy.
| Problem | ABC_sm | ABC_snm | ABC_s |
|---|
| AVG | SD | AVG | SD | AVG | SD |
|---|
| 20 × 3 | 81 | 55 | 92 | 59 | 47 | 33 |
| 20 × 5 | 61 | 34 | 67 | 40 | 50 | 31 |
| 20 × 8 | 40 | 13 | 49 | 16 | 42 | 18 |
| 20 × 10 | 36 | 14 | 44 | 15 | 37 | 17 |
| 40 × 3 | 102 | 64 | 110 | 71 | 51 | 35 |
| 40 × 5 | 55 | 29 | 59 | 32 | 42 | 26 |
| 40 × 8 | 34 | 14 | 34 | 15 | 32 | 19 |
| 40 × 10 | 27 | 12 | 23 | 9 | 26 | 12 |
| 60 × 3 | 75 | 53 | 76 | 52 | 35 | 28 |
| 60 × 5 | 53 | 24 | 54 | 25 | 31 | 19 |
| 60 × 8 | 32 | 10 | 33 | 11 | 26 | 7 |
| 60 × 10 | 27 | 10 | 28 | 9 | 21 | 10 |
| 80 × 3 | 57 | 46 | 65 | 55 | 23 | 21 |
| 80 × 5 | 29 | 18 | 42 | 29 | 18 | 12 |
| 80 × 8 | 30 | 11 | 28 | 10 | 20 | 7 |
| 80 × 10 | 22 | 8 | 22 | 8 | 16 | 6 |
| 100 × 3 | 60 | 48 | 63 | 53 | 19 | 12 |
| 100 × 5 | 39 | 27 | 36 | 24 | 19 | 12 |
| 100 × 8 | 25 | 13 | 26 | 12 | 13 | 6 |
| 100 × 10 | 26 | 11 | 23 | 10 | 13 | 4 |
| Mean | 46 | 26 | 49 | 28 | 29 | 17 |
Table A5.
C-metric for selection strategy.
Table A5.
C-metric for selection strategy.
| Problem | C(ABC_sm,ABC_snm) | C(ABC_snm,ABC_sm) | C(ABC_s,ABC_snm) | C(ABC_snm,ABC_s) |
|---|
| AVG | SD | AVG | SD | AVG | SD | AVG | SD |
|---|
| 20 × 3 | 0.85934 | 0.08758 | 0.98144 | 0.01982 | 0.73993 | 0.17995 | 0.97764 | 0.02051 |
| 20 × 5 | 0.89810 | 0.05966 | 0.96951 | 0.03490 | 0.78039 | 0.16583 | 0.98023 | 0.02181 |
| 20 × 8 | 0.86900 | 0.11023 | 0.96419 | 0.03952 | 0.82839 | 0.10178 | 0.97108 | 0.03337 |
| 20 × 10 | 0.82771 | 0.13341 | 0.97760 | 0.02258 | 0.78766 | 0.12764 | 0.98465 | 0.01848 |
| 40 × 3 | 0.91836 | 0.04773 | 0.97068 | 0.02106 | 0.73526 | 0.16708 | 0.97883 | 0.02344 |
| 40 × 5 | 0.89508 | 0.08619 | 0.95619 | 0.04185 | 0.79438 | 0.16022 | 0.97169 | 0.03042 |
| 40 × 8 | 0.89812 | 0.06417 | 0.96804 | 0.02755 | 0.85335 | 0.12335 | 0.96984 | 0.03199 |
| 40 × 10 | 0.87944 | 0.06824 | 0.96875 | 0.02753 | 0.83444 | 0.11672 | 0.95150 | 0.05400 |
| 60 × 3 | 0.90653 | 0.06056 | 0.95775 | 0.04265 | 0.73289 | 0.17950 | 0.95740 | 0.10376 |
| 60 × 5 | 0.87867 | 0.09270 | 0.95395 | 0.05534 | 0.71341 | 0.16273 | 0.94364 | 0.06230 |
| 60 × 8 | 0.82253 | 0.09272 | 0.98044 | 0.03144 | 0.78647 | 0.13140 | 0.95530 | 0.04929 |
| 60 × 10 | 0.89406 | 0.06943 | 0.95311 | 0.04333 | 0.82031 | 0.14776 | 0.95453 | 0.06291 |
| 80 × 3 | 0.84510 | 0.10849 | 0.97731 | 0.02936 | 0.77974 | 0.21686 | 0.96227 | 0.05675 |
| 80 × 5 | 0.68997 | 0.20446 | 0.98967 | 0.02097 | 0.73794 | 0.21694 | 0.95857 | 0.05943 |
| 80 × 8 | 0.80327 | 0.13293 | 0.96337 | 0.05757 | 0.77936 | 0.10541 | 0.94491 | 0.06676 |
| 80 × 10 | 0.88756 | 0.08520 | 0.93426 | 0.09061 | 0.79879 | 0.15662 | 0.96216 | 0.04526 |
| 100 × 3 | 0.88165 | 0.12186 | 0.95392 | 0.03888 | 0.77351 | 0.19366 | 0.95870 | 0.04537 |
| 100 × 5 | 0.87378 | 0.10167 | 0.94669 | 0.05262 | 0.68042 | 0.21482 | 0.92094 | 0.08275 |
| 100 × 8 | 0.81979 | 0.11728 | 0.92500 | 0.08941 | 0.64569 | 0.19238 | 0.94140 | 0.09557 |
| 100 × 10 | 0.85256 | 0.09924 | 0.91935 | 0.14346 | 0.72247 | 0.17505 | 0.93433 | 0.11018 |
| Mean | 0.86003 | 0.09719 | 0.96056 | 0.04652 | 0.76624 | 0.16179 | 0.95898 | 0.05372 |
Table A6.
IGD-metric for selection strategy.
Table A6.
IGD-metric for selection strategy.
| Problem | ABC_sm | ABC_snm | ABC_s |
|---|
| AVG | SD | AVG | SD | AVG | SD |
|---|
| 20 × 3 | 0.04042 | 0.03405 | 0.00845 | 0.01556 | 0.08057 | 0.03846 |
| 20 × 5 | 0.03659 | 0.02632 | 0.01319 | 0.01536 | 0.06153 | 0.03196 |
| 20 × 8 | 0.03577 | 0.02567 | 0.01321 | 0.01561 | 0.04449 | 0.02785 |
| 20 × 10 | 0.04829 | 0.03799 | 0.00998 | 0.01414 | 0.05901 | 0.03691 |
| 40 × 3 | 0.03020 | 0.02552 | 0.01083 | 0.01343 | 0.08398 | 0.03540 |
| 40 × 5 | 0.03330 | 0.03128 | 0.02825 | 0.04225 | 0.06741 | 0.05066 |
| 40 × 8 | 0.04468 | 0.03790 | 0.02478 | 0.03358 | 0.04649 | 0.02746 |
| 40 × 10 | 0.03573 | 0.02457 | 0.01409 | 0.01484 | 0.04507 | 0.02870 |
| 60 × 3 | 0.02988 | 0.02740 | 0.01928 | 0.02141 | 0.10136 | 0.04475 |
| 60 × 5 | 0.04250 | 0.03227 | 0.02603 | 0.05360 | 0.09486 | 0.06072 |
| 60 × 8 | 0.07492 | 0.05767 | 0.01267 | 0.02564 | 0.07959 | 0.04397 |
| 60 × 10 | 0.04170 | 0.03099 | 0.02281 | 0.02704 | 0.06926 | 0.04548 |
| 80 × 3 | 0.06017 | 0.05241 | 0.01338 | 0.02040 | 0.09440 | 0.07314 |
| 80 × 5 | 0.11588 | 0.06826 | 0.00406 | 0.00849 | 0.11549 | 0.06856 |
| 80 × 8 | 0.07187 | 0.05380 | 0.00723 | 0.00979 | 0.09838 | 0.09451 |
| 80 × 10 | 0.05573 | 0.05833 | 0.02134 | 0.02361 | 0.10140 | 0.09607 |
| 100 × 3 | 0.06039 | 0.06521 | 0.01807 | 0.01793 | 0.11416 | 0.07280 |
| 100 × 5 | 0.05374 | 0.05680 | 0.01827 | 0.01903 | 0.11104 | 0.08333 |
| 100 × 8 | 0.05678 | 0.05496 | 0.03197 | 0.05249 | 0.12985 | 0.08506 |
| 100 × 10 | 0.06252 | 0.04959 | 0.03104 | 0.05631 | 0.12392 | 0.08962 |
| Mean | 0.05155 | 0.04255 | 0.01745 | 0.02502 | 0.08611 | 0.05677 |
Table A7.
N-metrics for the four algorithms.
Table A7.
N-metrics for the four algorithms.
| Problem | MDABC | SDABC | IMDABC | NSGAII |
|---|
| AVG | SD | AVG | SD | AVG | SD | AVG | SD |
|---|
| 20 × 3 | 81 | 55 | 92 | 59 | 47 | 33 | 4 | 1 |
| 20 × 5 | 6 | 34 | 73 | 39 | 50 | 31 | 4 | 1 |
| 20 × 8 | 40 | 13 | 49 | 16 | 42 | 18 | 4 | 1 |
| 20 × 10 | 36 | 14 | 44 | 15 | 37 | 17 | 3 | 1 |
| 40 × 3 | 102 | 64 | 110 | 71 | 51 | 35 | 4 | 1 |
| 40 × 5 | 55 | 29 | 59 | 32 | 42 | 26 | 4 | 1 |
| 40 × 8 | 34 | 14 | 33 | 15 | 32 | 19 | 4 | 1 |
| 40 × 10 | 27 | 12 | 23 | 9 | 26 | 12 | 3 | 1 |
| 60 × 3 | 75 | 53 | 76 | 52 | 35 | 28 | 4 | 1 |
| 60 × 5 | 53 | 24 | 54 | 25 | 31 | 19 | 4 | 1 |
| 60 × 8 | 32 | 10 | 33 | 11 | 26 | 7 | 4 | 1 |
| 60 × 10 | 27 | 10 | 28 | 9 | 21 | 10 | 4 | 1 |
| 80 × 3 | 57 | 46 | 65 | 55 | 23 | 21 | 4 | 1 |
| 80 × 5 | 29 | 18 | 42 | 29 | 18 | 12 | 4 | 1 |
| 80 × 8 | 30 | 11 | 28 | 10 | 20 | 7 | 4 | 1 |
| 80 × 10 | 22 | 8 | 21 | 8 | 16 | 6 | 4 | 1 |
| 100 × 3 | 60 | 48 | 63 | 53 | 19 | 12 | 4 | 1 |
| 100 × 5 | 39 | 27 | 36 | 24 | 19 | 12 | 4 | 1 |
| 100 × 8 | 26 | 13 | 21 | 11 | 13 | 6 | 4 | 1 |
| 100 × 10 | 26 | 11 | 19 | 7 | 13 | 4 | 4 | 1 |
| Mean | 4 | 26 | 49 | 28 | 29 | 17 | | 1 |
Table A8.
C-metric for SDABC and IMDABC.
Table A8.
C-metric for SDABC and IMDABC.
| Problem | C(IMDABC, SDABC) | C(SDABC, IMDABC) |
|---|
| AVG | SD | AVG | SD |
|---|
| 20 × 3 | 0.71958 | 0.17690 | 0.97863 | 0.02441 |
| 20 × 5 | 0.81245 | 0.17156 | 0.96822 | 0.04305 |
| 20 × 8 | 0.69710 | 0.16276 | 0.98021 | 0.02158 |
| 20 × 10 | 0.67717 | 0.19304 | 0.95016 | 0.06298 |
| 40 × 3 | 0.67268 | 0.19374 | 0.96970 | 0.04154 |
| 40 × 5 | 0.71662 | 0.20731 | 0.96423 | 0.03848 |
| 40 × 8 | 0.71277 | 0.18846 | 0.88374 | 0.09222 |
| 40 × 10 | 0.65302 | 0.23329 | 0.87723 | 0.09688 |
| 60 × 3 | 0.68624 | 0.21262 | 0.93698 | 0.09011 |
| 60 × 5 | 0.58662 | 0.22109 | 0.86391 | 0.18674 |
| 60 × 8 | 0.75941 | 0.15186 | 0.94086 | 0.04614 |
| 60 × 10 | 0.74989 | 0.22071 | 0.91005 | 0.08697 |
| 80 × 3 | 0.69941 | 0.26287 | 0.90214 | 0.12340 |
| 80 × 5 | 0.60641 | 0.27873 | 0.85887 | 0.17892 |
| 80 × 8 | 0.72325 | 0.19220 | 0.93444 | 0.13380 |
| 80 × 10 | 0.79106 | 0.13459 | 0.95489 | 0.05211 |
| 100 × 3 | 0.61688 | 0.26191 | 0.83928 | 0.25371 |
| 100 × 5 | 0.52884 | 0.27615 | 0.66027 | 0.32685 |
| 100 × 8 | 0.60399 | 0.22069 | 0.93966 | 0.10319 |
| 100 × 10 | 0.70389 | 0.14102 | 0.93097 | 0.10896 |
| Mean | 0.68586 | 0.20508 | 0.91222 | 0.10560 |
Table A9.
C-metric for SDABC and NSGAII.
Table A9.
C-metric for SDABC and NSGAII.
| Problem | C(NSGAII, SDABC) | C(SDABC, NSGAII) |
|---|
| AVG | SD | AVG | SD |
|---|
| 20 × 3 | 0.47604 | 0.19696 | 0.99894 | 0.00364 |
| 20 × 5 | 0.43420 | 0.21366 | 0.99839 | 0.00606 |
| 20 × 8 | 0.51249 | 0.18648 | 0.99817 | 0.00693 |
| 20 × 10 | 0.62232 | 0.28094 | 0.97241 | 0.04692 |
| 40 × 3 | 0.30179 | 0.20107 | 0.99637 | 0.01581 |
| 40 × 5 | 0.40568 | 0.24291 | 0.98909 | 0.03957 |
| 40 × 8 | 0.46779 | 0.23882 | 0.99658 | 0.01490 |
| 40 × 10 | 0.44047 | 0.25663 | 0.99565 | 0.01653 |
| 60 × 3 | 0.30520 | 0.23747 | 0.99847 | 0.00666 |
| 60 × 5 | 0.35629 | 0.20641 | 0.99647 | 0.01527 |
| 60 × 8 | 0.37387 | 0.25821 | 0.98637 | 0.05803 |
| 60 × 10 | 0.50566 | 0.27560 | 0.98842 | 0.03011 |
| 80 × 3 | 0.23740 | 0.18040 | 0.98565 | 0.04320 |
| 80 × 5 | 0.30696 | 0.23777 | 0.99592 | 0.00717 |
| 80 × 8 | 0.31161 | 0.27681 | 0.98151 | 0.03140 |
| 80 × 10 | 0.34208 | 0.30953 | 0.90678 | 0.16100 |
| 100 × 3 | 0.27811 | 0.21478 | 0.98198 | 0.06273 |
| 100 × 5 | 0.41473 | 0.25368 | 0.99075 | 0.02246 |
| 100 × 8 | 0.53949 | 0.31026 | 0.97923 | 0.05386 |
| 100 × 10 | 0.47040 | 0.32454 | 0.96777 | 0.08233 |
| Mean | 0.40513 | 0.24514 | 0.98525 | 0.03623 |
Table A10.
C-metric for SDABC and MDABC.
Table A10.
C-metric for SDABC and MDABC.
| Problem | C(MDABC, SDABC) | C(SDABC, MDABC) |
|---|
| AVG | SD | AVG | SD |
|---|
| 20 × 3 | 0.85678 | 0.11097 | 0.97497 | 0.02959 |
| 20 × 5 | 0.92044 | 0.05882 | 0.96118 | 0.04077 |
| 20 × 8 | 0.83238 | 0.09010 | 0.97593 | 0.03354 |
| 20 × 10 | 0.82119 | 0.12392 | 0.95335 | 0.05121 |
| 40 × 3 | 0.90210 | 0.06388 | 0.96763 | 0.03469 |
| 40 × 5 | 0.86154 | 0.10690 | 0.95649 | 0.04270 |
| 40 × 8 | 0.81330 | 0.11659 | 0.90450 | 0.09811 |
| 40 × 10 | 0.77790 | 0.12432 | 0.92043 | 0.05911 |
| 60 × 3 | 0.90741 | 0.06411 | 0.93831 | 0.05046 |
| 60 × 5 | 0.81425 | 0.13803 | 0.92594 | 0.07804 |
| 60 × 8 | 0.79762 | 0.10058 | 0.96047 | 0.04091 |
| 60 × 10 | 0.86893 | 0.07453 | 0.95030 | 0.04694 |
| 80 × 3 | 0.78871 | 0.19319 | 0.94319 | 0.05262 |
| 80 × 5 | 0.58628 | 0.21435 | 0.95776 | 0.10780 |
| 80 × 8 | 0.74688 | 0.13289 | 0.97491 | 0.03945 |
| 80 × 10 | 0.86783 | 0.10606 | 0.93900 | 0.10327 |
| 100 × 3 | 0.79428 | 0.16286 | 0.88190 | 0.11669 |
| 100 × 5 | 0.75590 | 0.17291 | 0.82682 | 0.15634 |
| 100 × 8 | 0.79468 | 0.14633 | 0.93958 | 0.10413 |
| 100 × 10 | 0.84412 | 0.10980 | 0.93745 | 0.13495 |
| Mean | 0.81763 | 0.12056 | 0.93951 | 0.07107 |
Table A11.
IGD-metric for SDABC and IMDABC.
Table A11.
IGD-metric for SDABC and IMDABC.
| Problem | IMDABC | SDABC |
|---|
| AVG | SD | AVG | SD |
|---|
| 20 × 3 | 0.09976 | 0.03581 | 0.00663 | 0.01234 |
| 20 × 5 | 0.05147 | 0.03417 | 0.00869 | 0.01174 |
| 20 × 8 | 0.07184 | 0.03675 | 0.01113 | 0.01998 |
| 20 × 10 | 0.07962 | 0.03873 | 0.01176 | 0.01615 |
| 40 × 3 | 0.11765 | 0.04426 | 0.00600 | 0.00950 |
| 40 × 5 | 0.10199 | 0.05379 | 0.00720 | 0.00759 |
| 40 × 8 | 0.07725 | 0.05090 | 0.02156 | 0.01843 |
| 40 × 10 | 0.08825 | 0.05355 | 0.02981 | 0.02419 |
| 60 × 3 | 0.12603 | 0.06153 | 0.00790 | 0.00855 |
| 60 × 5 | 0.12552 | 0.05599 | 0.01545 | 0.01365 |
| 60 × 8 | 0.07575 | 0.04625 | 0.01527 | 0.01209 |
| 60 × 10 | 0.08662 | 0.06164 | 0.02675 | 0.04270 |
| 80 × 3 | 0.12157 | 0.10182 | 0.00800 | 0.01224 |
| 80 × 5 | 0.15439 | 0.09136 | 0.01543 | 0.02934 |
| 80 × 8 | 0.11297 | 0.08460 | 0.00951 | 0.01343 |
| 80 × 10 | 0.09190 | 0.06572 | 0.01140 | 0.01092 |
| 100 × 3 | 0.15286 | 0.08546 | 0.01482 | 0.02365 |
| 100 × 5 | 0.15846 | 0.09721 | 0.02767 | 0.03839 |
| 100 × 8 | 0.14235 | 0.09122 | 0.01025 | 0.01173 |
| 100 × 10 | 0.11993 | 0.09412 | 0.00646 | 0.00858 |
| Mean | 0.10781 | 0.06424 | 0.01358 | 0.01726 |
Table A12.
IGD-metric for SDABC and MDABC.
Table A12.
IGD-metric for SDABC and MDABC.
| Problem | MDABC | SDABC |
|---|
| AVG | SD | AVG | SD |
|---|
| 20 × 3 | 0.04353 | 0.03879 | 0.00829 | 0.01226 |
| 20 × 5 | 0.02825 | 0.02566 | 0.01355 | 0.01575 |
| 20 × 8 | 0.05191 | 0.02136 | 0.00551 | 0.00716 |
| 20 × 10 | 0.05523 | 0.03113 | 0.01197 | 0.01563 |
| 40 × 3 | 0.03621 | 0.02506 | 0.01228 | 0.01483 |
| 40 × 5 | 0.04554 | 0.03478 | 0.02105 | 0.02939 |
| 40 × 8 | 0.06442 | 0.05616 | 0.03238 | 0.04255 |
| 40 × 10 | 0.06916 | 0.04299 | 0.02161 | 0.02047 |
| 60 × 3 | 0.04003 | 0.02879 | 0.02216 | 0.02420 |
| 60 × 5 | 0.04527 | 0.02730 | 0.02194 | 0.02262 |
| 60 × 8 | 0.06443 | 0.04546 | 0.01398 | 0.02034 |
| 60 × 10 | 0.04712 | 0.03247 | 0.01629 | 0.01596 |
| 80 × 3 | 0.07120 | 0.06431 | 0.02195 | 0.03317 |
| 80 × 5 | 0.13071 | 0.06473 | 0.00966 | 0.01330 |
| 80 × 8 | 0.08625 | 0.04796 | 0.00926 | 0.01318 |
| 80 × 10 | 0.05353 | 0.03556 | 0.02344 | 0.02623 |
| 100 × 3 | 0.06290 | 0.05063 | 0.02225 | 0.02473 |
| 100 × 5 | 0.06074 | 0.03328 | 0.02962 | 0.02276 |
| 100 × 8 | 0.06374 | 0.05757 | 0.02619 | 0.04760 |
| 100 × 10 | 0.06049 | 0.04981 | 0.02627 | 0.04505 |
| Mean | 0.05903 | 0.04069 | 0.01848 | 0.02336 |
Table A13.
IGD-metric for SDABC and NSGAII.
Table A13.
IGD-metric for SDABC and NSGAII.
| Problem | NSGAII | SDABC |
|---|
| AVG | SD | AVG | SD |
|---|
| 20 × 3 | 0.11426 | 0.05009 | 0.00008 | 0.00028 |
| 20 × 5 | 0.12345 | 0.03838 | 0.00003 | 0.00013 |
| 20 × 8 | 0.12013 | 0.04920 | 0.00024 | 0.00098 |
| 20 × 10 | 0.07980 | 0.04905 | 0.01939 | 0.03984 |
| 40 × 3 | 0.18873 | 0.09539 | 0.00145 | 0.00633 |
| 40 × 5 | 0.14942 | 0.08224 | 0.00299 | 0.00774 |
| 40 × 8 | 0.15783 | 0.08214 | 0.00319 | 0.01391 |
| 40 × 10 | 0.16789 | 0.09567 | 0.00303 | 0.00927 |
| 60 × 3 | 0.19377 | 0.08821 | 0.00019 | 0.00082 |
| 60 × 5 | 0.20634 | 0.10966 | 0.00194 | 0.00843 |
| 60 × 8 | 0.23376 | 0.13245 | 0.00425 | 0.00973 |
| 60 × 10 | 0.19724 | 0.10722 | 0.00435 | 0.00995 |
| 80 × 3 | 0.21405 | 0.10015 | 0.00240 | 0.00795 |
| 80 × 5 | 0.22440 | 0.11524 | 0.00139 | 0.00267 |
| 80 × 8 | 0.25470 | 0.16455 | 0.01070 | 0.01762 |
| 80 × 10 | 0.20225 | 0.16029 | 0.03841 | 0.05594 |
| 100 × 3 | 0.22540 | 0.12751 | 0.00505 | 0.01453 |
| 100 × 5 | 0.19644 | 0.10497 | 0.00318 | 0.00710 |
| 100 × 8 | 0.19358 | 0.16121 | 0.01789 | 0.02596 |
| 100 × 10 | 0.26764 | 0.19026 | 0.01394 | 0.03123 |
| Mean | 0.18555 | 0.10519 | 0.00670 | 0.01352 |
References
- Ruiz, R.; Vázquez-Rodríguez, J.A. The hybrid flow shop scheduling problem. Eur. J. Oper. Res. 2010, 205, 1–18. [Google Scholar] [CrossRef] [Green Version]
- Qin, T.; Du, Y.; Chen, J.H.; Sha, M. Combining mixed integer programming and constraint programming to solve the integrated scheduling problem of container handling operations of a single vessel. Eur. J. Oper. Res. 2020, 285, 884–901. [Google Scholar] [CrossRef]
- Pan, Q.; Wang, L.; Mao, K.; Zhao, J.; Zhang, M. An effective artificial bee colony algorithm for a real-world hybrid flowshop problem in steelmaking process. IEEE Trans. Autom. Sci. Eng. 2013, 10, 307–322. [Google Scholar] [CrossRef]
- Li, J.Q.; Pan, Q.K.; Mao, K. A hybrid fruit fly optimization algorithm for the realistic hybrid flowshop rescheduling problem in steelmaking systems. IEEE Trans. Autom. Sci. Eng. 2016, 13, 932–949. [Google Scholar] [CrossRef]
- Lin, Y.K.; Huang, D.H. Reliability analysis for a hybrid flow shop with due date consideration. Reliab. Eng. Syst. Saf. 2020, 199, 105905. [Google Scholar] [CrossRef]
- Lin, P.; Shen, L.; Zhao, Z.; Huang, G.Q. Graduation manufacturing system: Synchronization with IoT-enabled smart tickets. J. Intell. Manuf. 2019, 30, 2885–2900. [Google Scholar] [CrossRef]
- Ali, D.; Frimpong, S. Artificial intelligence models for predicting the performance of hydro pneumatic suspension struts in large capacity dump trucks. Int. J. Ind. Ergon. 2018, 67, 283–295. [Google Scholar] [CrossRef]
- Worasan, K.; Sethanan, K.; Pitakaso, R.; Moonsri, K.; Nitisiri, K. Hybrid particle swarm optimization and neighborhood strategy search for scheduling machines and equipment and routing of tractors in sugarcane field preparation. Comput. Electron. Agric. 2020, 178, 105733. [Google Scholar] [CrossRef]
- Fortemps, P. Jobshop scheduling with imprecise durations: A fuzzy approach. IEEE Trans. Fuzzy Syst. 1997, 5, 557–569. [Google Scholar] [CrossRef] [Green Version]
- Lei, D.; Gao, L.; Zheng, Y. A Novel Teaching-Learning-Based Optimization Algorithm for Energy-Efficient Scheduling in Hybrid Flow Shop. IEEE Trans. Eng. Manag. 2018, 65, 330–340. [Google Scholar] [CrossRef]
- Zhang, Z.; Tang, R.; Peng, T.; Tao, L.; Jia, S. A method for minimizing the energy consumption of machining system: Integration of process planning and scheduling. J. Clean. Prod. 2016, 137, 1647–1662. [Google Scholar] [CrossRef]
- Wang, L.; Wang, J.; Wu, C. Advances in green shop scheduling and optimization. Control Decis. 2018, 33, 385–391. [Google Scholar]
- Fu, Y.; Zhou, M.; Guo, X.; Qi, L. Scheduling Dual-Objective Stochastic Hybrid Flow Shop With Deteriorating Jobs via Bi-Population Evolutionary Algorithm. IEEE Trans. Syst. Man Cybern. Syst. 2020, 50, 5037–5048. [Google Scholar] [CrossRef]
- Yankai, W.; Shilong, W.; Dong, L.; Chunfeng, S.; Bo, Y. An improved multi-objective whale optimization algorithm for the hybrid flow shop scheduling problem considering device dynamic reconfiguration processes. Expert Syst. Appl. 2021, 174, 114793. [Google Scholar] [CrossRef]
- Gao, H.; Shi, Y.; Pun, C.; Kwong, S. An improved artificial bee colony algorithm with its application. IEEE Trans. Ind. Inf. 2019, 15, 1853–1865. [Google Scholar] [CrossRef]
- Gao, W.; Liu, S.; Huang, L. A novel artificial bee colony algorithm based on modified search equation and orthogonal learning. IEEE Trans. Cybern. 2013, 43, 1011–1024. [Google Scholar] [CrossRef] [PubMed]
- Karaboga, D.; Akay, B. A comparative study of Artificial Bee Colony algorithm. Appl. Math. Comput. 2009, 214, 108–132. [Google Scholar] [CrossRef]
- Li, J.; Pan, Q. Solving the large-scale hybrid flow shop scheduling problem with limited buffers by a hybrid artificial bee colony algorithm. Inf. Sci. 2015, 316, 487–502. [Google Scholar] [CrossRef]
- Wang, F.; Rao, Y.; Zhang, C.; Tang, Q.; Zhang, L. Estimation of distribution algorithm for energy-efficient scheduling in turning processes. Sustainability 2016, 8, 762. [Google Scholar] [CrossRef] [Green Version]
- Xuan, H.; Zhag, H.; Li, B. An Improved Discrete Artificial Bee Colony Algorithm for Flexible Flowshop Scheduling with Step Deteriorating Jobs and Sequence-Dependent Setup Times. Math. Probl. Eng. 2019, 2019, 1–13. [Google Scholar] [CrossRef] [Green Version]
- Yue, L.; Guan, Z.; Zhang, L.; Ullah, S.; Cui, Y. Multi objective lotsizing and scheduling with material constraints in flexible parallel lines using a Pareto based guided artificial bee colony algorithm. Comput. Ind. Eng. 2019, 128, 659–680. [Google Scholar] [CrossRef]
- Gong, G.; Chiong, R.; Deng, Q.; Gong, X. A hybrid artificial bee colony algorithm for flexible job shop scheduling with worker flexibility. Int. J. Prod. Res. 2020, 58, 4406–4420. [Google Scholar] [CrossRef]
- Zadeh, M.S.; Katebi, Y.; Doniavi, A. A heuristic model for dynamic flexible job shop scheduling problem considering variable processing times. Int. J. Prod. Res. 2019, 57, 3020–3035. [Google Scholar] [CrossRef]
- Lei, D.; Liu, M. An artificial bee colony with division for distributed unrelated parallel machine scheduling with preventive maintenance. Comput. Ind. Eng. 2020, 141, 106320. [Google Scholar] [CrossRef]
- Xie, Z.; Yang, D.; Ma, M.; Yu, X. An Improved Artificial Bee Colony Algorithm for the Flexible Integrated Scheduling Problem Using Networked Devices Collaboration. Int. J. Coop. Inf. Syst. 2020, 29, 2040003. [Google Scholar] [CrossRef]
- Li, J.; Bai, S.; Duan, P.; Sang, H.; Han, Y.; Zheng, Z. An improved artificial bee colony algorithm for addressing distributed flow shop with distance coefficient in a prefabricated system. Int. J. Prod. Res. 2019, 57, 6922–6942. [Google Scholar] [CrossRef]
- Li, J.; Song, M.; Wang, L.; Duan, P.; Han, Y.; Sang, H.; Pan, Q. Hybrid Artificial Bee Colony Algorithm for a Parallel Batching Distributed Flow-Shop Problem With Deteriorating Jobs. IEEE Trans. Cybern. 2020, 50, 2425–2439. [Google Scholar] [CrossRef]
- Gong, D.; Han, Y.; Sun, J. A novel hybrid multi-objective artificial bee colony algorithm for blocking lot-streaming flow shop scheduling problems. Knowl. -Based Syst. 2018, 148, 115–130. [Google Scholar] [CrossRef]
- Pan, Q.; Gao, L.; Wang, L.; Liang, J.; Li, X. Effective heuristics and metaheuristics to minimize total flowtime for the distributed permutation flowshop problem. Expert Syst. Appl. 2019, 124, 309–324. [Google Scholar] [CrossRef]
- Li, X.; Tang, H.; Yang, Z.; Wu, R.; Luo, Y. Integrated Optimization Approach of Hybrid Flow-Shop Scheduling Based on Process Set. IEEE Access 2020, 8, 223782–223796. [Google Scholar] [CrossRef]
- Peng, K.; Pan, Q.; Gao, L.; Zhang, B.; Pang, X. An Improved Artificial Bee Colony algorithm for real-world hybrid flowshop rescheduling in Steelmaking-refining-Continuous Casting process. Comput. Ind. Eng. 2018, 122, 235–250. [Google Scholar] [CrossRef]
- Zhong, Y.; Yang, F.; Liu, F. Solving multi-objective fuzzy flexible job shop scheduling problem using MABC algorithm. J. Intell. Fuzzy Syst. 2019, 36, 1455–1473. [Google Scholar] [CrossRef]
- Li, Y.; Huang, W.; Wu, R.; Guo, K. An improved artificial bee colony algorithm for solving multi-objective low-carbon flexible job shop scheduling problem. Appl. Soft Comput. 2020, 95, 106544. [Google Scholar] [CrossRef]
- Zhang, B.; Pan, Q.; Gao, L.; Li, X.; Meng, L.; Peng, K. A multiobjective evolutionary algorithm based on decomposition for hybrid flowshop green scheduling problem. Comput. Ind. Eng. 2019, 136, 325–344. [Google Scholar] [CrossRef]
- Linn, R.; Zhang, W. Hybrid flow shop scheduling: A survey. Comput. Ind. Eng. 1999, 37, 57–61. [Google Scholar] [CrossRef]
- Ribas, I.; Leisten, R.; Framinan, J.M. Review and classification of hybrid flow shop scheduling problems from a production system and a solutions procedure perspective. Comput. Oper. Res. 2010, 37, 1439–1454. [Google Scholar] [CrossRef]
- Chang, D.Y. Applications of the extent analysis method on fuzzy AHP. Eur. J. Oper. Res. 1996, 95, 649–655. [Google Scholar] [CrossRef]
- Fang, K.; Uhan, N.; Zhao, F.; Sutherland, J.W. A new approach to scheduling in manufacturing for power consumption and carbon footprint reduction. J. Manuf. Syst. 2011, 30, 234–240. [Google Scholar] [CrossRef]
- Zadeh, L.A. Fuzzy logic. Computer 1988, 21, 83–93. [Google Scholar] [CrossRef]
- Gao, D.; Wang, G.; Pedrycz, W. Solving fuzzy job-shop scheduling problem using DE algorithm improved by a selection mechanism. IEEE Trans. Fuzzy Syst. 2020, 28, 3265–3275. [Google Scholar] [CrossRef]
- Ozturk, C.; Hancer, E.; Karaboga, D. A novel binary artificial bee colony algorithm based on genetic operators. Inf. Sci. 2015, 297, 154–170. [Google Scholar] [CrossRef]
- Fathollahi-Fard, A.M.; Hajiaghaei-Keshteli, M.; Mirjalili, S. Multi-objective stochastic closed-loop supply chain network design with social considerations. Appl. Soft Comput. 2018, 71, 505–525. [Google Scholar] [CrossRef]
- Riquelme, N.; Lücken, C.V.; Baran, B. Performance metrics in multi-objective optimization. In Proceedings of the 2015 Latin American Computing Conference (CLEI 2015), Arequipa, Peru, 19 October 2015; pp. 1–11. [Google Scholar]
- Zhang, Q.; Li, H. MOEA/D: A multiobjective evolutionary algorithm based on decomposition. IEEE Trans. Evol. Comput. 2007, 11, 712–731. [Google Scholar] [CrossRef]
| Publisher’s Note: MDPI stays neutral with regard to jurisdictional claims in published maps and institutional affiliations. |
© 2021 by the authors. Licensee MDPI, Basel, Switzerland. This article is an open access article distributed under the terms and conditions of the Creative Commons Attribution (CC BY) license (https://creativecommons.org/licenses/by/4.0/).


