Article

Sustainability of Information Security Investment in Online Social Networks: An Evolutionary Game-Theoretic Approach

1
School of Management Science and Engineering, Nanjing University of Information Science and Technology, Nanjing 210044, China
2
China Institute of Manufacturing Development, Nanjing University of Information Science and Technology, Nanjing 210044, China
*
Author to whom correspondence should be addressed.
Mathematics 2018, 6(10), 177; https://doi.org/10.3390/math6100177
Submission received: 27 August 2018 / Revised: 14 September 2018 / Accepted: 25 September 2018 / Published: 26 September 2018

Abstract

:
With the rapid development of information technologies, security violations in online social networks (OSN) have emerged as a critical issue. Traditional technical and organizational approaches do not consider economic factors, which are increasingly important to sustain information security investment. In this paper, we develop an evolutionary game model to study the sustainability of information security investment in OSN, and propose a quantitative approach to analyze and optimize security investment. Additionally, we examine a contract with an incentive mechanism to eliminate free riding, which helps sustain the security investment. Numerical examples are provided for illustration and simulation purposes, leading to several countermeasures and suggestions. Our analytical results show that the optimal strategy of information security investment not only is correlated with profit growth coefficients and investment costs, but is also influenced significantly by the profits from free riding. If the profit growth coefficients are prohibitively small, both OSN service providers and online platforms will not choose to sustain investment based on small profits. As profit growth coefficients increase, there is a higher probability that game players will invest. Another major finding is that the (Invest, Invest) profile is much less sensitive to the change of profit growth coefficients and the convergent speed of this scenario is faster than the other profiles. The government agency can use the proposed model to determine a proper incentive or penalty to help both parties reach the optimal strategies and thus improve OSN security.

1. Introduction

As information and communication technologies (ICT) have advanced, online social networks (OSN), such as Facebook, Twitter, and Instagram, have dramatically influenced our daily life. OSN services provide an online platform where users can build social networks or social relationships with other members with similar personal interests, activities, backgrounds, or real-life connections [1,2]. OSN can bring many benefits to users by helping them interact with friends and instantly share resources.
However, OSN services may be a double-edged sword, where benefits also come with security threats [3]. Well-organized attacks access OSN systems using technical exploits and social engineering. In USA, the annual CSI (Crime Scene Investigation)/FBI (Federal Bureau of Investigation) surveys and Computer Emergency Response Team (CERT) statistics show that security breaches have been one of the most significant challenges to OSN. For example, iCloud was attacked by black-hat hackers in 2014; the attack incurred a large data loss that included user identities, emails, and telephone numbers of several million families and firms. SafeNet Corporation reported that during the first half of 2016, 92% of companies and organizations experienced data breaches and that 3,046,456 data records were lost or stolen every day [4].
Considering the impact and severity of security threats, information security investment is envisioned to help OSN service providers and online platforms stay updated and informed about recent incidents, vulnerabilities, and malware signatures. This allows them to develop proactive defenses [5,6,7]. Securing OSN is nearly impossible without investing in security technologies and regulations, such as encryption algorithms, biometric authentication, firewalls, and security guidelines [8,9]. However, OSN service providers and online platforms still hesitate to sustain their security investment for different reasons:
  • Information security investment may not provide competitive advantages and extra profits in the market;
  • insufficient budget is viewed as the main challenge for sustaining security investment [10]; and
  • the investment process might create a channel that allows other entities to receive a free ride on security expenditures.
Therefore, we can conclude that financial factors significantly influence the strategic choice to invest in OSN security. Long-term profit is a primary motive for sustaining an effective security investment, and maximizing profit is considered the most common objective of business. However, without an unlimited budget, no firms and organizations can be completely secure. As such, it is important to determine the optimal strategy for keeping that information security investment sustainable [11].
Game theory provides a quantitative decision framework, which can balance between the profits from and the costs of information security investment [12]. Game theory assumes each player is rational, and he/she will choose the optimal strategic choice for profits maximization, which is considered to be the most important goal. This will lead the concept of Nash equilibrium in a game, which is defined as the trade-off between profit and cost. Nash equilibrium is a solution concept of a non-cooperative game involving two or more players in which each player is assumed to know the equilibrium strategies of the other players, and no player has anything to gain by changing only their own strategy [13,14].
In recent years, many game theoretic approaches have been implemented worldwide to address security problems. These approaches can be organized into six main categories: Information security investment, trust and privacy, network security, malicious programs, penetration testing, and digital forensics [15]. Existing research on game theoretic approaches to information security investment have several limitations:
  • Current studies primarily consider the interactions of players under a competitive scenario [5]; however, decision makers for OSN security investment may be cooperative, selfish, or free riding;
  • information security investment studies based on the Bayesian game [6], Stackelberg game [16,17,18], and differential game [5] assume that game players are rational, and the players believe that the other side is also rational throughout the game. However, this assumption is often unrealistic. Instead, players are assumed to have bounded rationality and to be working under incomplete information. The long-term profit of each stage is different and higher profit strategies tend to displace lower profit strategies over time; and
  • previous scholars have not researched the sustainability of security investment. It is important to analyze an incentive mechanism to help sustain security investment in OSN.
Evolutionary game theory, differing from classical game theories, supposes that game players (entities) are bounded rational, which implies that players cannot find an optimal strategy from the beginning, and they would attempt to improve their choices through trial and error [19]. Another motivation of opting for evolutionary games to model the strategic choice of sustaining information security investment comes from the nature of solutions that often arrive from an evolutionary process. Especially, the bounded rational players or organizations would continuously evolve in real time until each player adopts to an evolutionarily stable strategy (ESS) [20]. ESS is a strategy that, if adopted by a population in a given environment, is impenetrable, meaning that it cannot be invaded by any alternative strategy that is initially rare. An ESS is an equilibrium refinement of the Nash equilibrium. It is a Nash equilibrium that is “evolutionarily” stable: Once it is fixed in a population, natural selection alone is sufficient to prevent alternative (mutant) strategies from invading successfully [21,22,23].
In this paper, we analyze the sustainability of security investment in OSN using an evolutionary game model with a focus on the profit from security investment. We derive the evolutionarily stable strategies (ESSs) of OSN service providers and online platforms. The study also proposes an incentive mechanism to extend the basic model and to help sustain security investment. Finally, we provide numerical examples to illustrate and validate the mathematical model, and propose policies to improve the development of security investment in OSN.
The rest of this paper is organized as follows. In Section 2, we review studies that are of relevance. Section 3 describes the notations, assumptions, and basic evolutionary game model, and illustrates the ESSs under different conditions. Section 4 considers an extended model under a contract with an incentive mechanism. Section 5 verifies and analyzes the theoretical results obtained from the numerical examples. Section 6 discusses the relationship between the simulation results and strategic choice of security investment. Section 7 summarizes our research and provides guidelines for future directions.

2. Literature Review

There has been substantial progress in the study of information security investment that will improve the level of OSN service. However, challenges and barriers remain - most notably on budget, sustainability, and implementation levels. In general, to remain or become sustainable, all firms strive to maximize their profit. Therefore, one of the most important research directions in IT service and management is to assess the trade-off between the profit from and cost of security investment.
As stated in the introduction, game theoretic approaches provide a quantitative decision framework for modeling, analyzing, and predicting the behaviors of different players. In pioneering research, the vulnerability of the information system and the potential risk of information disclosure are discussed. Then, game theoretic approaches are used to determine the optimal security investment level. As a result, one study [24] explained that insufficient incentive is a driver for information security failures. In another study [25], a game theoretic approach is applied to address security investment issues, in which the level of profits depends on the interaction between players’ strategic choices. This study [25] points out that the profits a firm makes from security investment depend on the extent of hacking. In contrast, the hacker’s profits depend on the probability of him or her being caught. Cavusoglu et al. [6] proposed another game-theoretic approach to investigate different aspects of security investment. Additionally, the potential advantages of using game-theoretic approaches to security investment as opposed to decision-theoretic approaches are discussed. Based on the concepts of ROA (Return on Attack) and ROI (Return on Investment), Du et al. [26] used an attack-defense game tree to analyze attack behaviors and the defender’s corresponding strategies.
With increasing interdependence, each firm free rides by investing less, and suffers lower profit, while the attacker enjoys higher profit. Therefore, information sharing and cooperation among firms can increase the level of information security; this is consistent with previous findings [27]. In another study [28], the intrusion detection system (IDS) of OSN is defined as a non-cooperative game, which is used to answer two questions: What are the expected behaviors of rational attackers? What is the optimal strategy for the defenders? The expected behaviors of attackers, the minimum defending resources, and the optimal responding of the defenders are discussed based on a Nash equilibrium analysis. Fielder el al. [11] proposed a game theoretic framework to model the interaction between small and medium-sized enterprises (SMEs) and attackers, and to investigate the allocation of security investment budgets. By emphasizing the importance of security information sharing, Gal-Or et al. [29] established a game theoretic model consisting of two competitive firms. This research investigated the benefits if the firms created an information-sharing alliance, and showed that information sharing among allied firms had sufficiently large positive implications on firm requirements. The increased security information sharing can bring two benefits for the firms: A “direct benefit” and a “strategic benefit”. Considering two similar firms, Liu et al. [30] investigated the relationship between information sharing and information security investment. This research found that firms’ strategic choices vary with the features of stored information, either complementary or substitutable, and the investment strategy chosen by the firms might be sub-optimal.
Considering attacker behavior and leakage costs, Gao et al. [7] discussed the relationship between security investment and information sharing. Their findings showed that firms should devote significant attention to their relationship with other firms when strategically choosing security investment. By using differential game theoretic approaches, Mookerjee et al. [31] investigated dynamic strategies for security investment and information sharing for two competing firms. This research examined how security investment rates and information sharing rates are affected by several parameters in a non-cooperative scenario. Other similar studies have also been conducted [32,33].
The literature review above demonstrates that most game theoretic research assumes there is a single scenario, with an offender-defender interaction. An offender attempts to breach system security to disclose or cause damage to user data. A defender responds appropriately to enhance the level of security protection. However, players’ interactions (e.g., OSN service providers and online platforms) may take on opposite characteristics; they may be cooperative, selfish, or free riding. Moreover, long-term progress requires a sustained security investment in OSN. Therefore, it is difficult to achieve an optimal investment strategy in a single game scenario where there is incomplete information and bounded rationality. Security investment studies based on other games, such as Bayesian, Stackelberg, and differential games, cannot solve this problem. In addition, perfect rationality may not be practical in this scenario. Furthermore, without appropriate incentive and punishment mechanisms, each player may try to gain a free ride on the security expenditures of others. Most articles do not investigate methods for promoting sustainable of information security investment from a governmental perspective.
To distinguish this study from existing research, we propose a parametric evolutionary game model to explore the sustainability of information security investment in OSN. The model analyzes the ESSs of OSN service providers and online platforms by describing the interactions and relationship between game players. This study fills a gap in the literature by investigating the optimal strategies to sustain the security investment. It also examines the effects of profits, investment costs, and governmental incentive on security investment sustainability.

3. Basic Evolutionary Game Model and Equilibrium Analysis

3.1. Information Security Investment Scenario in OSN

To understand the profitability and cost of security investment in the OSN scenario, we consider OSN service providers and online platforms as the “game players” representing security investors. OSN service providers are technological providers (e.g., Microsoft, Cisco, and Oracle) that provide support to secure information systems, databases, and software for OSN. Whether or not they sustain the security investment depends on the trade-off between profits and costs. Online platforms provide a social networking service on which users build social networks or social relations with other persons. The security state of online platforms is positively related to the level of security management of online platforms, which also must make a moderate investment. Therefore, the strategic choice of OSN service providers and online platforms influence each other, and the cooperative interactions can be viewed as a dynamic game process.
To formulate this scenario, we built a two-echelon security investment chain, consisting of OSN service providers (denoted by S ) and online platforms (denoted by P ), both of which have two strategies: “Invest” and “Not Invest”. Therefore, there are four possible combinations of the two strategies: (Not Invest, Not Invest), (Not Invest, Invest), (Invest, Not Invest), and (Invest, Invest). However, it is difficult to optimize security investment based on classical game theory because of incomplete information, complicated scenarios, and the bounded rationality of players.
Considering the decision problems of OSN security investment, this paper applies evolutionary game theory (EGT) to model such situations. We investigate the optimal strategies of security investment in an OSN context not only based on cost-benefit analysis, but also from an evolutionary perspective. The motivation of using evolutionary game theory can be concluded as follows:
  • Equilibrium solution refinement. The evolutionary game approaches provide a refined solution that ensures the stability of a strategy adopted by a population, where no small subgroup of deviants could successfully invade the whole population. Such a strategy is known as an evolutionary stable strategy (ESS) [20,34];
  • Bounded rationality. In traditional game theory, the game players are assumed as rational and the players believe that the other side is also rational throughout the game. However, this assumption is often unrealistic. This situation is avoided in evolutionary game, where players adopt dynamic strategies that lead them to sustain in the population without caring about instant profits maximization [20]; and
  • Game dynamics. Since players in evolutionary game interact with each other for multiple rounds by adopting different strategies, the state of their interaction varies over time according to the replication games. Thus, the evolutionary game provides a natural way to introduce dynamics, where success strategies are imitated by others and propagate over interaction rounds.

3.2. Model Assumptions and Notations

We explore the heterogeneity of information security investment as a supply chain according to the relationship between OSN service providers and online platforms, which can help us select parameters for the model [35]. Moreover, like other research works that have used the game theoretical approach, we propose several assumptions to facilitate the model formulation and solution:
(1)
There are two types of players in the game: The OSN service providers and online platforms. Both experience bounded rationality. The members of these two groups make strategic decisions independently, based on their own perception of the payoffs. Over the course of the game, they can dynamically adjust their strategies;
(2)
Each player has two strategic choices: “Invest” and “Not Invest”. Security investment by OSN service providers includes technological research, software upgrades, and hardware improvements. Online platforms investment includes equipment purchases, development of security rules, and staff training;
(3)
We assume clients who have good security consciousness are willing to pay more for the value-added service that ensures high-level security protection. Moreover, it is assumed that the reputation of OSN service providers and online platforms would not decline if they choose the strategy, “not invest”;
(4)
There is no collusion involved in the strategic choice of OSN service providers and online platforms;
(5)
If only one set of the players chooses “Invest”, the other may free ride on the investment and share the extra benefits; and
(6)
To avoid free riding and help sustain the security investment in OSN, a contract with an incentive mechanism should be developed.
Based on the above assumptions, a payoff matrix illustrating the evolutionary game process of information security investment in OSN can be constructed, as shown in Table 1. The four cells in Table 1 delineate the payoff; the first entry shows the payoff for the OSN service providers, and the second entry is the payoff for the online platforms.
As depicted in Table 2, the key notations in the payoff matrix are explained as follows.

3.3. Model Solutions

In the initial stage of the evolutionary game, we define x ( 0 x 1 ) as the population of OSN service providers making the strategic choice of “Invest”. In contrast, 1 x represents the population making the strategic choice of “Not Invest”. Similarly, y ( 0 y 1 ) represents the population of online platforms making the strategic choice of “Invest”, and 1 y represents the population making the strategic choice of “Not Invest”.
Based on the assumptions in Section 3.2, we assume that μ 1 , 1 represents the expected payoff of OSN service providers that make the strategic choice of “Invest”, μ 1 , 2 represents the expected payoff of OSN service providers that make the strategic choice of “Not Invest”, and μ 1 represents the average expected payoff of OSN service providers. Therefore:
μ 1 , 1 = y ( a 1 E S C S ) + ( 1 y ) ( a 0 E S C S )
μ 1 , 2 = y ξ S + ( 1 y ) E S
Thus, the average expected payoff of OSN service providers can be written as follows:
μ 1 = x μ 1 , 1 + ( 1 x ) μ 1 , 2
It is assumed that μ 2 , 1 represents the expected payoff of online platforms that make the strategic choice of “Invest”, μ 2 , 2 represents the expected payoff of online platforms that make the strategic choice of “Not Invest”, and μ 2 represents the average expected payoff of online platforms. Therefore:
μ 2 , 1 = x ( b 1 E P C H ) + ( 1 x ) ( b 0 E p C p )  
μ 2 , 2 = x ξ P + ( 1 x ) E P  
μ 2 = y μ 2 , 1 + ( 1 y ) μ 2 , 2  
According to the Malthusian dynamic equation [36], the replicator equation of population x for OSN service providers is:
G ( x ) = d x d t = x ( μ 1 , 1 μ 1 ) = x ( 1 x ) { ( a 0 1 ) E S C S [ ξ S ( α 1 α 0 + 1 ) E S ] y }  
The replicator equation of population y for online platforms is:
G ( y ) = d y d t = y ( μ 2 , 1 μ 2 ) = y ( 1 y ) { ( b 0 1 ) E P C P [ ξ P ( b 1 b 0 + 1 ) E P ] x }  
When the replicator equation equals 0, an equilibrium point of the evolutionary game has been reached, and will no longer evolve. This results in five equilibrium points—that correspond to the equilibria of the dynamic system: (0, 0), (0, 1), (1, 0), (1, 1), ( A , B ) . Note that ( A , B ) is a mixed equilibrium point where A = ( b 0 1 ) E P C P ξ P ( b 1 b 0 + 1 ) E P , B = ( a 0 1 ) E S C S ξ S ( a 1 a 0 + 1 ) E S .

3.4. Stable Analysis of Equilibrium Points

The stability of equilibrium points can be analyzed using a Jacobian matrix [37]. The Jacobian matrix can be defined as follows:
J = [ G ( x ) x G ( x ) y G ( y ) x G ( y ) y ] = [ a 11   a 12 a 21   a 22 ]  
The stability of equilibrium points can be examined using the following conditions [38]:
  • t r J = a 11 + a 22 < 0
  • det J = [ a 11 a 12 a 21 a 22 ] = a 11 a 22 a 12 a 21 > 0
We can compute the values of the equilibrium points and classify them into different types that are shown in Table 3. Note that ( A , B ) is not satisfied under the above condition because a 11 + a 22 = 0 . Other equilibrium points will be ESSs, whereas the values of related parameters are satisfied under different conditions. The propositions are analyzed as follows:
Proposition 1.
When 0 < a 0 < C S E S + 1 , a 0 < a 1 < ξ S + C S E S and 0 < b 0 < C P E p + 1 , b 0 < b 1 < ξ P + C P E P , (0, 0) is an evolutionarily stable point. OSN service providers and online platforms will make the strategic choice of “Not Invest”.
Proof. 
We define E S I as the expected profits of OSN service providers if only they make the strategic choice of “Invest”, and E P I as the expected profits of online platforms if only they make the strategic choice of “Invest”. Therefore:
E S I = a 0 E S C S < ( 1 + C S E S ) E S C S = E S  
E P I = b 0 E P C P < ( 1 + C p E P ) E p C p = E P
In this scenario, we find that the expected profits from security investment is lower than the profits if they make the strategic choice of “Not Invest”. Both players have no incentive to sustain the security investment due to the little profits.
Proposition 1 also presents the business implications from the perspective of evolutionary analysis. We assume there are several OSN service providers and online platforms in an OSN context. OSN service providers, s i , may choose “Invest” at first because of information asymmetry and bounded rationality. Then, s i finds s j (another OSN service provider) chooses “Not Invest” and can get higher profits. Therefore, s i will adjust and improve its choices by imitating the strategy of s j for profit maximization. We can conclude that the strategy of s j will impact on the strategic decision of s i . Moreover, the investment strategies of online platforms also have impacts on the strategic decision of OSN service providers. The interaction with each other will result in the evolution of the strategic choice.
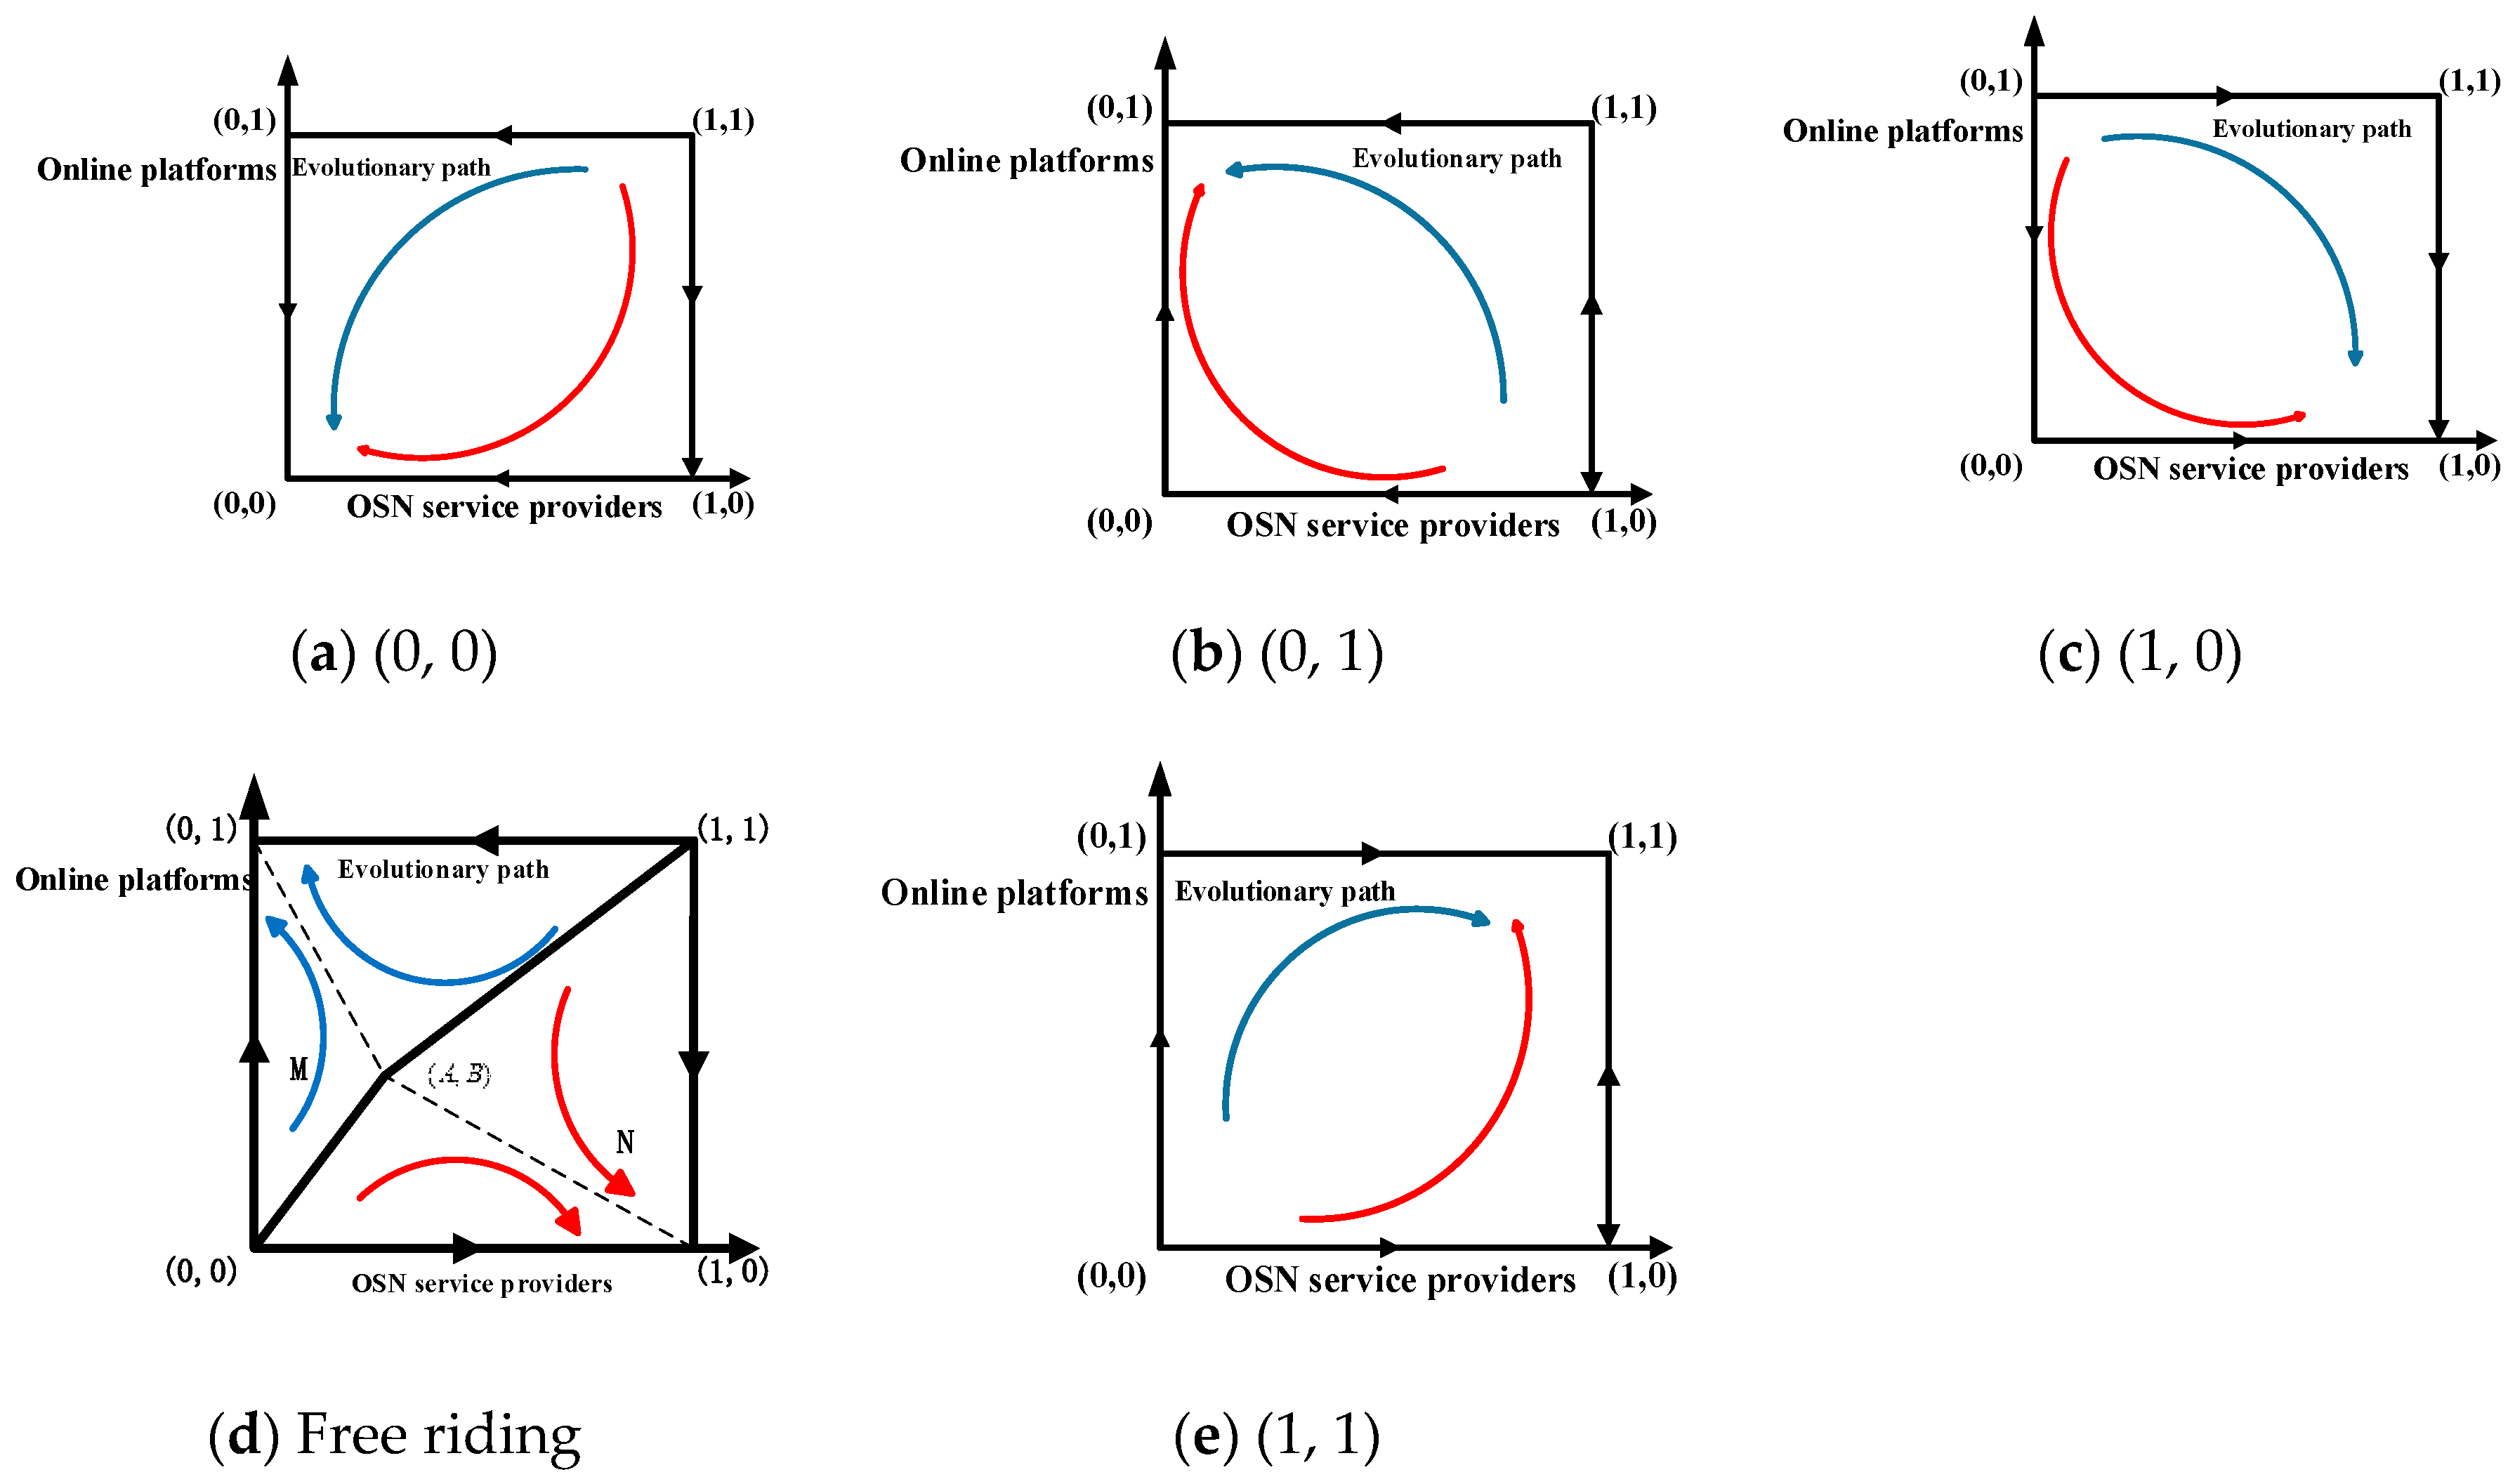
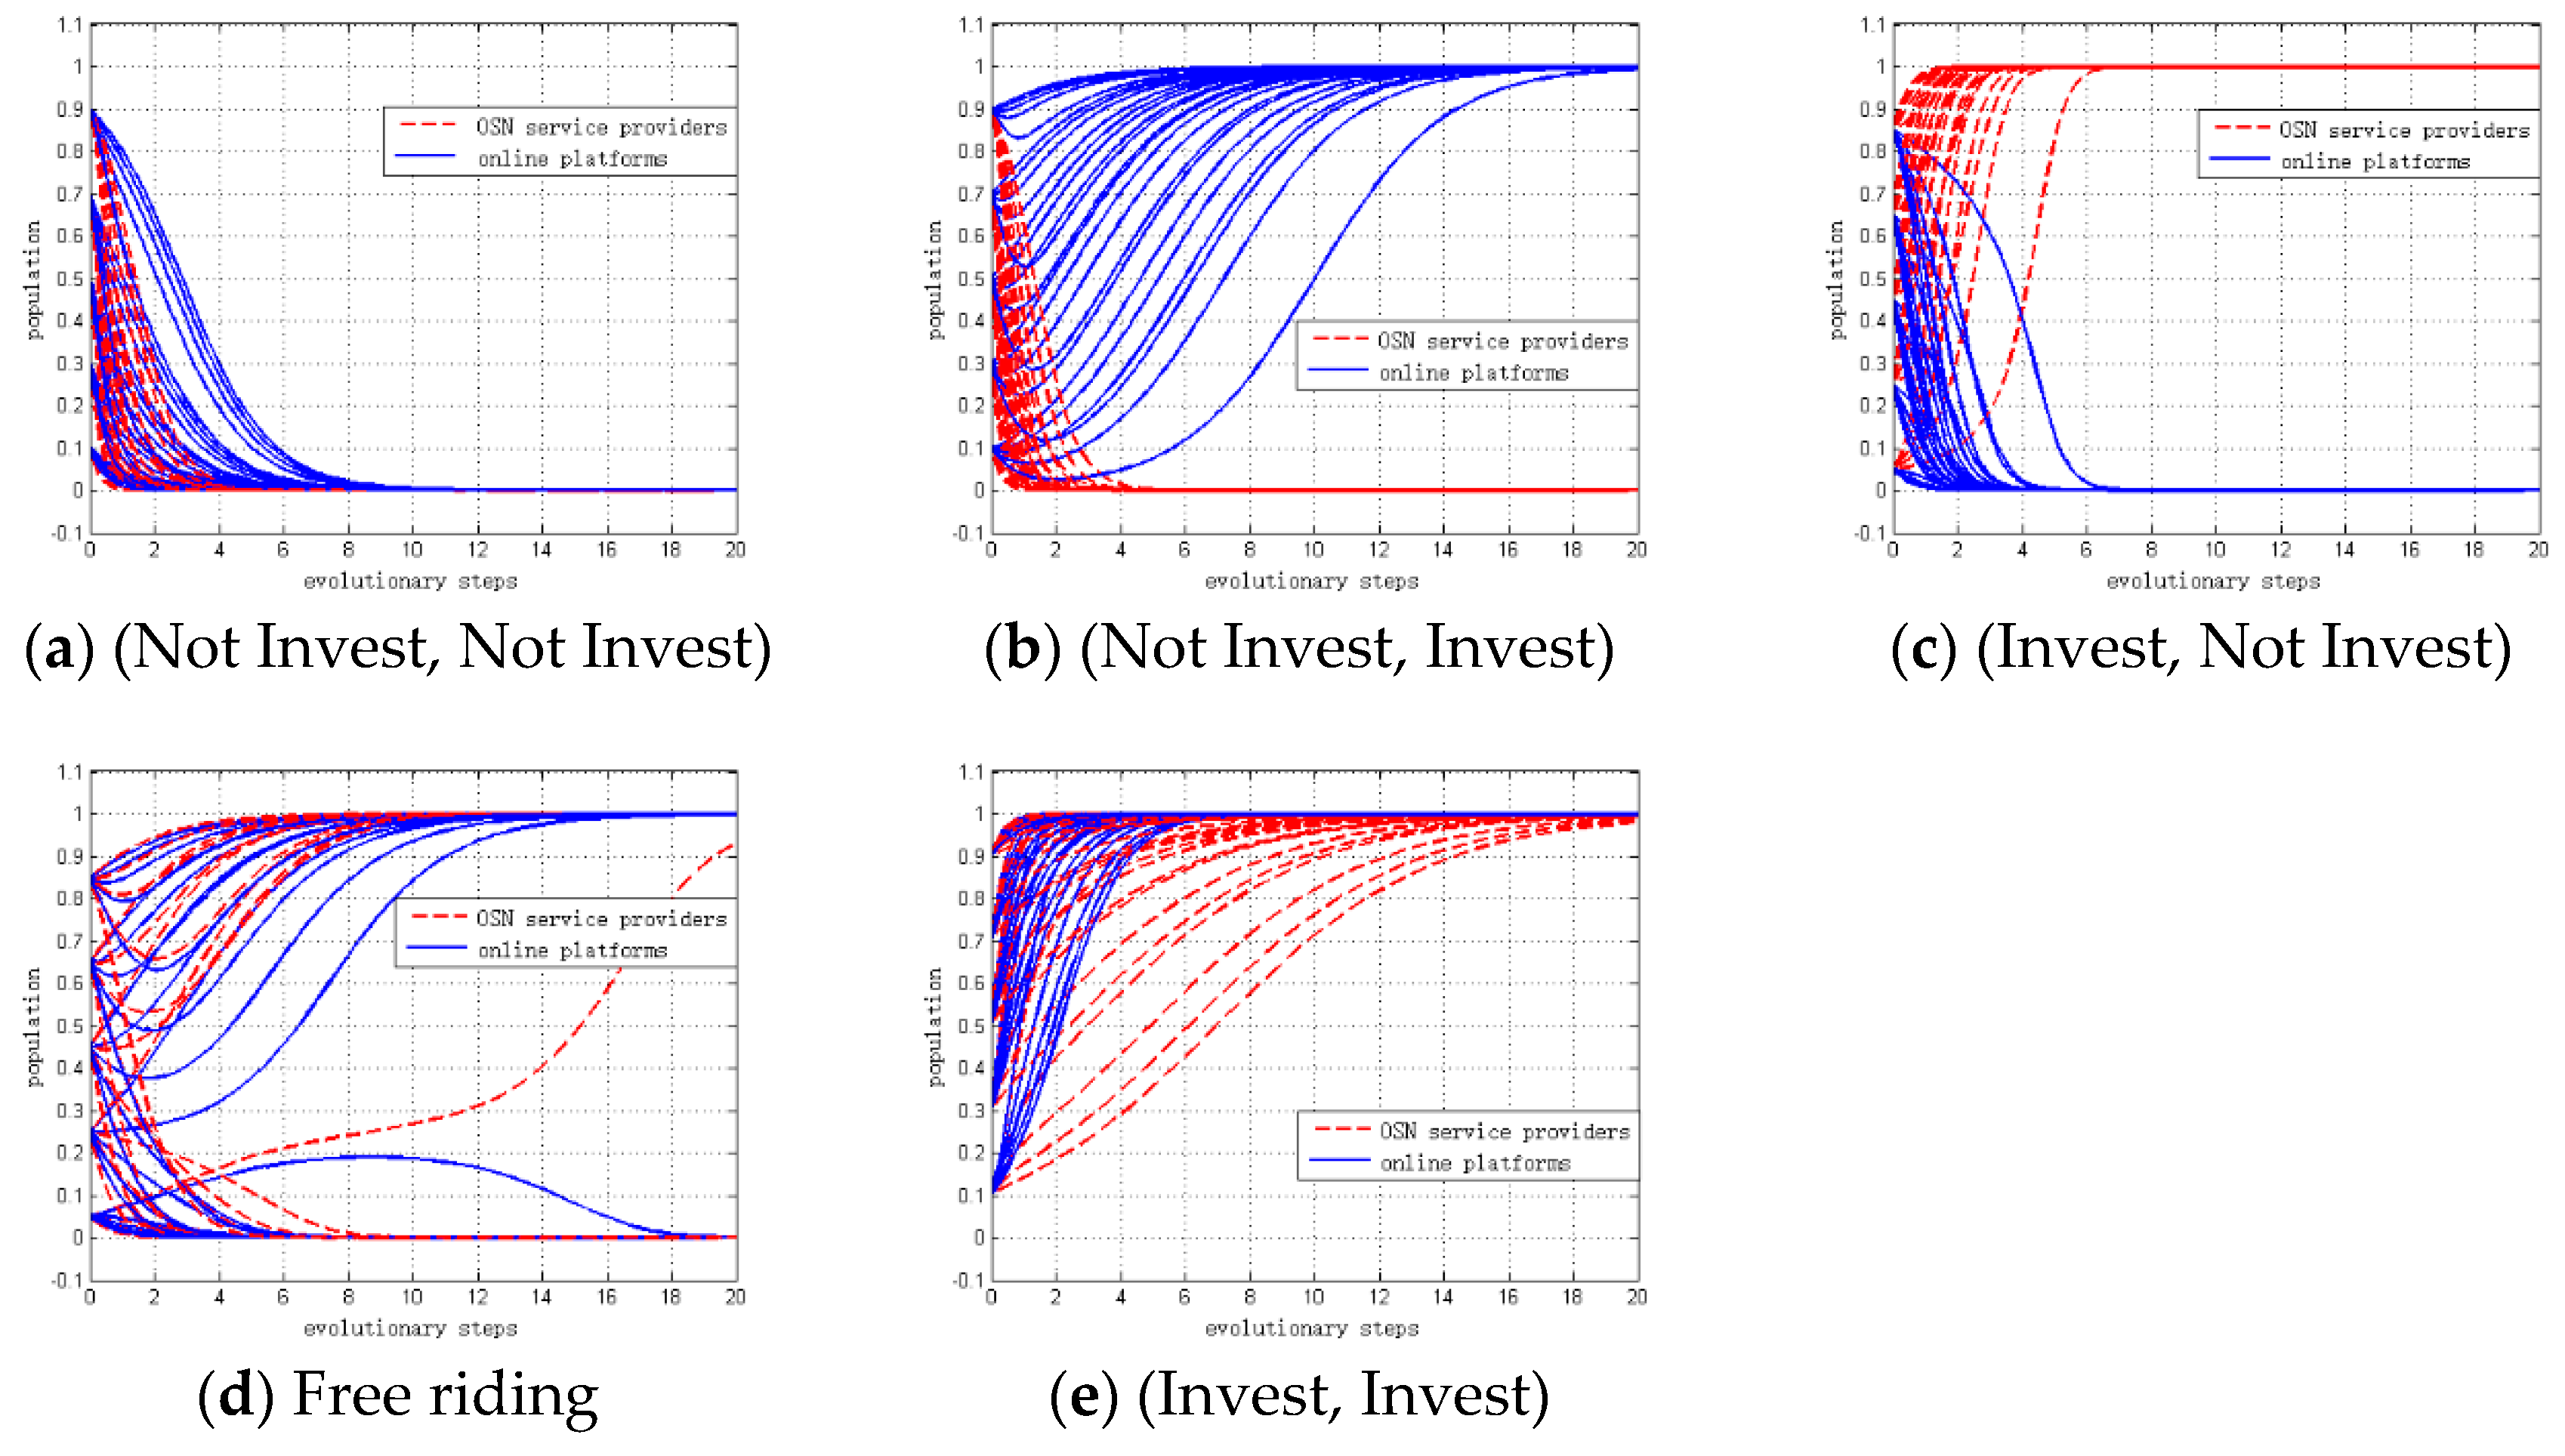
Panel (a) in Figure 1 displays the evolution of the dynamic model when the profit growth coefficients are small. We can find that the evolutionary model will eventually converge at (0, 0) no matter what strategies are initially taken by OSN service providers and online platforms. Therefore, (0, 0) is the evolutionarily stable point; (0, 1) and (1, 0) are saddle points; and (1, 1) is the unstable point. The ESS profile is (Not Invest, Not Invest).
Proposition 2.
When 0 < a 0 < C S E S + 1 , a 0 < a 1 < ξ S + C S E S and C P E p + 1 < b 0 < b 1 < ξ P + C P E P , (0, 1) is the evolutionarily stable point. OSN service providers will make the strategic choice of “Not Invest”, and online platforms will make the strategic choice of “Invest”.
Proof. 
If the profit growth coefficients are satisfied under the above conditions:
E S I = a 0 E S C S < ( 1 + C S E S ) E S C S = E S  
E P I = b 0 E P C P > ( 1 + C p E P ) E p C p = E P
We define E S B as the expected profits of OSN service providers, if both players make the strategic choice of “Invest”. The term, E P B , is the expected profits of online platforms if both players make the strategic choice of “Invest”. We find that:
E S B = a 1 E S C S < ξ S + C S E S E S C S = ξ S  
E P B = b 1 E P C P < ξ P + C P E P E p C p = ξ P  
From the perspective of evolutionary analysis, we assume online platforms, p i , may choose “Not Invest” at first because of investment costs. Then, p i finds p j (another online platform) chooses “Invest” and can get higher profits. Therefore, h i will improve its choices by imitating the strategy of h j . Moreover, the investment strategies of OSN service providers have no significant impacts on the strategic decision of hospitals because online platforms cannot free ride on the other side of game players.
Panel (b) in Figure 1 depicts the dynamic evolution model. As shown, the model will eventually converge at (0, 1) no matter what strategies are initially taken by OSN service providers and online platforms. Therefore, (0, 1) is the evolutionarily stable point; (0, 0) and (1, 0) are saddle points; and (1, 1) is the unstable point. The ESS profile is (Not Invest, Invest).
Proposition 3.
When C S E S + 1 < a 0 < a 1 < ξ S + C S E S and 0 < b 0 < C P E p + 1 , b 0 < b 1 < ξ P + C P E P , (1, 0) is an evolutionarily stable point. OSN service providers will make the strategic choice of “Invest”, and online platforms will make the strategic choice of “Not Invest”.
Proof. 
If the profit growth coefficients are satisfied under the above conditions:
E S I = a 0 E S C S > ( 1 + C S E S ) E S C S = E S  
E P I = b 0 E P C P < ( 1 + C p E P ) E p C p = E P  
E S B = a 1 E S C S < ξ S + C S E S E S C S = ξ S  
E P B = b 1 E P C P < ξ P + C P E P E p C p = ξ P
From the perspective of evolutionary analysis, OSN service provider, s i , may choose “Not Invest” at first because of bounded rationality. Then, s i finds s j chooses “Invest” and can get higher profits. Therefore, s i will adjust its strategic choice by imitating the strategy of s j . Similarly, the investment strategies of online platforms have no significant impacts on the strategic decision of OSN service providers because OSN service providers cannot free ride on the other side of game players.
Panel (c) in Figure 1 illustrates the evolution of the dynamic model. The figure shows it will eventually converge at (1, 0) no matter what strategies are initially taken by OSN service providers and online platforms. Therefore, (1, 0) is the evolutionarily stable point; (0, 0) and (0, 1) are saddle points; and (1, 1) is the unstable point. The ESS profile is (Invest, Not Invest).
Proposition 4.
When C S E S + 1 < a 0 < a 1 < ξ S + C S E S and C P E p + 1 < b 0 < b 1 < ξ P + C P E P , (0, 1) and (1, 0) are evolutionarily stable points. Both OSN service providers and online platforms have two strategic choices: “Not Invest” and “Invest”.
Proof. 
If the profit growth coefficients are satisfied under the above conditions:
E S I = a 0 E S C S > ( 1 + C S E S ) E S C S = E S  
E P I = b 0 E P C P > ( 1 + C p E P ) E p C p = E P  
E S B = a 1 E S C S < ξ S + C S E S E S C S = ξ S  
E P B = b 1 E P C P < ξ P + C P E P E p C p = ξ P
From the perspective of evolutionary analysis, OSN service provider, s i , and online platforms, p i , may choose “Invest” at first because of higher profits from security investment. Then, s i finds that it can get higher profits if it can free ride off p i . For example, if p i chooses “Invest”, there will be more users to use OSN APPs. Therefore, s i can get extra profits from a larger market, and without any investment costs. However, it is not the end of the evolution process. p i will also choose “Not Invest” and will want to free ride off s i . Therefore, s i and p i will always adjust their strategy by imitation for profit maximization.
Panel (d) in Figure 1 depicts the evolution of the dynamic model. As shown, the model will eventually converge at (0, 1) or (1, 0). Therefore, (1, 0) and (0, 1) are the evolutionary stable points; ( A , B ) is the saddle point; and (1, 1) and (0, 0) are the unstable points. The ESS profiles are (Not Invest, Invest) and (Invest, Not Invest).
Proposition 5.
When ξ S + C S E S < a 0 < a 1 and ξ P + C P E P < b 0 < b 1 , (1, 1) is an evolutionarily stable point. OSN providers and online platforms will choose (Invest, Invest).
Proof. 
If the profit growth coefficients are satisfied under the above conditions:
E S B = a 1 E S C S > ξ S + C S E S E S C S = ξ S  
E P B = b 1 E P C P > ξ P + C P E P E p C p = ξ P
From the perspective of evolutionary analysis, s i or p i may choose “Not Invest” at first. Then, they will find that “Invest” can bring higher profits sooner or later. Therefore, both OSN service providers and online platforms will adjust its strategic choice by imitating others.
Panel (e) in Figure 1 shows the evolution of the dynamic model. As shown, it will eventually converge at (1, 1) regardless of strategies initially taken by OSN service providers and online platforms. Therefore, (1, 1) is the evolutionarily stable point; (0, 1) and (1, 0) are saddle points; and (0, 0) is the unstable point. The ESS profile is (Invest, Invest).

4. Extended Model under a Contract with an Incentive Mechanism

According to the analysis of the evolutionary model, there are four potential ESS profiles when the parameters are satisfied under different conditions. Considering the following scenarios:
If the profit growth coefficients are prohibitively small, the profit from information security investment is so little that both players are unwilling to make the strategic choice of “Invest”.
As the profit growth coefficients increase, when they satisfy C S E S + 1 < a 0 < a 1 < ξ S + C S E S and C P E p + 1 < b 0 < b 1 < ξ P + C P E P , the profits are higher than the investment costs, but less than the profits from free riding.
In the scenarios above, neither OSN service providers nor online platforms will sustain security investment to maximize profits. To help sustain the security investment from OSN, (Invest, Invest) should be the unique and optimal ESS profile. Therefore, we should develop a contract with an incentive mechanism when the profit growth coefficients have not increased to a critical level. The incentive is expressed as a compensation for the player who makes the strategic choice of “Invest”, and as a penalty to the other player making the strategic choice of “Not Invest”. We define the subsidy (fine) parameter as K. Using evolutionary game theory, the extended model can be constructed. Table 4 shows the payoff matrix.
According to the payoff matrix, the replication dynamic system can be defined as:
{ d x d t = x ( 1 x ) { ( a 0 1 ) E S C S [ ξ S ( a 1 a 0 + 1 ) E S ] y + K } d y d t = y ( 1 y ) { ( b 0 1 ) E P C P [ ξ P ( b 1 b 0 + 1 ) E P ] x + K }  
Similarly, we can get five equilibrium points: (0, 0), (0, 1), (1, 0), (1, 1), and ( A , B ) . The term ( A , B ) is a mixed equilibrium point where A = ( b 0 1 ) E P C P + K ξ P ( b 1 b 0 + 1 ) E P , B = ( a 0 1 ) E S C S + K ξ S ( a 1 a 0 + 1 ) E S .
The values of equilibrium points under the stable condition are shown in Table 5. ( A , B ) is not satisfied because a 11 + a 22 = 0 .
As mentioned above, the incentive mechanism is developed to help to sustain the security investment for OSN service providers. The point (1, 1) should be uniquely evolutionarily stable, and (Invest, Invest) is the unique ESS profile for OSN service providers and online platforms. Therefore, the parameters should satisfy the condition:
( a 1 E S C S ξ S + K ) < 0 ( b 1 E P C P ξ P + K ) < 0
Thus, we can conclude that K should satisfy under the following condition:
K > max { ξ S [ ( a 1 + 1 ) E S C S ] , ξ P [ ( b 1 + 1 ) E P C P ] }  
If K satisfies the above condition, the optimal ESS profile is (Invest, Invest). Therefore, governments should develop a contract with an incentive mechanism to prevent free riding and sustain security investment in OSN.

5. Illustration and Simulation

5.1. Numerical Example

Our game equilibriums provide a detailed description of the game model and its properties. In this section, we describe the numerical results from our game analysis, and use MATLAB (2014a, MathWorks, Natick, MA, USA) to simulate and support the game-theoretic analysis. The variables used to calculate the evolutionary stable strategies were E S , E P , ξ S , ξ P , C S , C P , a 0 , a 1 , b 0 , and b 1 . We assigned fixed values to several variables; other variables increased or decreased relative to the assigned variables. Please note that the values we used in the simulation are just for illustration. In reality, the values of these parameters are determined by the profit growth coefficients, investment cost, and profit from free riding.
For the numerical simulation, we establish the parameters as: E S = $600, E P = $500, ξ S = $1000, ξ P = $800, C S = $300, and C P = $200. Variables include: a 0 , a 1 , b 0 , and b 1 . Thus, we can calculate the following:
C S E S + 1 = 1.5 ,   C P E P = 1.4 ,   ξ S + C S E S = 2.17 ,   ξ P + C P E P = 2  
Based on the critical points above, the government can then perform numerical simulation to estimate the incentive or penalty to help reach the ESS of (Invest, Invest). Table 6 shows some examples of a 0 , a 1 , b 0 , b 1 , and their corresponding ESSs.

5.2. Simulation of Basic Evolutionary Model

We set the replication dynamic equation of population x , y for OSN service providers and online platforms at 10%, 30%, 50%, 70%, and 90%. Figure 2 shows the simulation results under different values of a 0 , a 1 , b 0 , and b 1 . As depicted in panel (a) of Figure 2, the profit growth coefficients are relatively small; that is, the security investment will not bring the expected profits to OSN service providers and online platforms. Therefore, the population x , y for game players will converge to zero. The ESS profile is (Not Invest, Not Invest). The analysis of panel (b), (c), and (e) in Figure 2 is similar to this scenario. The ESS profiles are (Not invest, Invest), (Invest, Not invest), and (Invest, Invest), respectively.
As depicted in panel (d) of Figure 2, the population x , y will not converge to a fixed value, instead they are settled at either (0, 1) or (1, 0) depending on the initial state of the system and values of the related variables. Additionally, the result shows some of the game players will always want to obtain extra profits by free riding off other players under this scenario. The outcomes are consistent with the theoretical analyses of Proposition 1 to Proposition 5. Moreover, the figures also show that the convergent speed for panels (a) and (c) are faster than panels (b), (d), and (e).

5.3. Sensitivity Analysis of Stable Points

To examine whether the ESS results are robust to the change of profit growth coefficients ( a 0 , a 1 , b 0 , and b 1 ) or not, we conducted the sensitivity analysis below.

5.3.1. Sensitivity Analysis of (0, 0)

To explore the sensitivity analysis of (0, 0), we let the values of a 0 , a 1 , b 0 , and b 1 vary within a fixed range, as shown in Table 7. The initial population x, y is expressed as: x = 0.4 , y = 0.6 . Panel (a) in Figure 3 summarizes the results of the sensitivity analysis for profile (0, 0). As shown, the lines spread over a much wider area than panel (d), which means this scenario is more sensitive to the change of profit growth coefficients. In addition, we observe that it takes fewer steps for smaller profit growth coefficients to reach ESS, which means the convergent speed for smaller profit growth coefficient is faster. In other words, it also implies the lower the profits from security investment, the larger the probability of making the strategic choice of “Not Invest” becomes.

5.3.2. Sensitivity Analysis of (0, 1)

To explore the sensitivity analysis of (0, 1), we let the values of a 0 , a 1 , b 0 , and b 1 vary within a fixed range, as shown in Table 8.
Panel (b) in Figure 3 summarizes the results of the sensitivity analysis of (0, 1). As shown, this scenario is also sensitive to the change of profit growth coefficients, especially for the variation of b 0 and b 1 values. Meanwhile, it takes fewer steps for larger b 0 and b 1 values to reach the ESS, which means the convergent speed is faster and implies that when the profit growth coefficients of online platforms increase, the probability of making the strategic choice of “Invest” becomes larger.

5.3.3. Sensitivity Analysis of (1, 0)

To explore the sensitivity analysis of (1, 0), we set the values of a 0 , a 1 , b 0 , and b 1 to vary within a fixed range, as shown in Table 9. The initial population x , y is expressed as: x = 0.2 , y = 0.8 .
Panel (c) in Figure 3 summarizes the results of the sensitivity analysis of (1, 0). As shown, this scenario is also quite sensitive to the change of profit growth coefficients especially for the variation of b 0 and b 1 values. Meanwhile, as can be seen, it takes fewer steps for larger a 0 and a 1 to reach the ESS, which means the convergent speed is faster and that when the profit growth coefficients of OSN service providers increases, the probability of making the strategic choice of “Invest” becomes larger.

5.3.4. Sensitivity Analysis of (1, 1)

To explore the sensitivity analysis of (1, 1), we set the values of a 0 , a 1 , b 0 , and b 1 to vary within a fixed range, as shown in Table 10. The initial population x, y is expressed as: x = 0.2 , y = 0.8 .
Panel (d) in Figure 3 summarizes the results of the sensitivity analysis of (1, 1). As shown, the lines spread over a much narrow area than in the other three scenarios, which means this scenario is less sensitive to the change of profit growth coefficients. The results show the speed of convergence is faster overall as it takes fewer steps to reach the ESS. As the profit growth coefficients increase to a critical level, the profit from security investment is larger than the investment cost and profit from riding; as a result, OSN service providers and online platforms will make the strategic choice of “Invest”.
In summary, the subtle variance of profit growth coefficients has a more significant effect on the evolutionary trend and convergent speed in the scenarios of (0, 0) and (1, 0) than in the case of (0, 1). Overall, the subtle variance of profit growth coefficients does not significantly influence the evolutionary trend and convergent speed in the case of (1, 1).

5.4. Simulation of Extended Evolutionary Model

Assuming C S E S + 1 < a 0 < a 1 < ξ S + C S E S and C P E p + 1 < b 0 < b 1 < ξ P + C P E P , free riding may occur. Therefore, when the profit growth coefficients are set to a0 = 1.6, a 1 = 1.8, b 0 = 1.5, and b 1 = 1.7, and the other variables remain fixed, it would be advisable to develop a contract with an incentive mechanism to eliminate free riding and sustain the security investment.
The incentive mechanism administered by a third-party could make the ESS profile for both players be (Invest, Invest). According to the analysis in Section 4, the variable, K , should be satisfied by Equation (12). Thus, we can obtain the result that K > max (2.2, 1.5). We set K = 2.5 and the initial population x , y ranged from 10% to 90%. When an incentive mechanism is included, neither OSN service providers nor online platforms can earn extra benefits from free riding. Therefore, the optimal ESS profile is (Invest, Invest). The simulation result is shown in Figure 4.

6. Discussion and Recommendations

To provide useful insights for investors sustaining their security investment in OSN, we obtained data from two famous service providers in China, iFLYTEK and Lenovo, to verify results. To build this evolutionary game theoretic model, we also interacted with Tencent, China to help us understand the current state of security investment in OSN. Based on the model analysis and simulation results, we conclude that the profit growth coefficients, investment cost, profits from free riding, and governmental incentives all play important roles in security investment sustainability.
Figure 5 shows the ESS profiles under different intervals of the profit growth coefficients. Based on the analysis above, the profit growth coefficients ( a 0 , a 1 , b 0 , and b 1 ) are the fundamental driving force for sustaining security investment in OSN, and play a significant role at the initial stage of the evolutionary process. Moreover, if the profit growth coefficients are prohibitively small, both OSN service providers and online platforms will make the strategic choice of “Not Invest” because little profit is expected. As the profit growth coefficients increase, the profit from security is higher than the cost ( C S and C P ). One set of players will make the strategic choice of “Invest”. However, the other will not invest as they can gain a higher profit from free riding ( ξ S and ξ P ). Only when the profit growth coefficients of both players increase to a critical level ( ξ S + C S E S and ξ P + C P E P ), can (Invest, Invest) become the beneficial ESS profile.
The model analysis and simulation results can offer three recommendations for policy makers to help sustain the security investment in OSN.
Policy advice 1. Increasing minimum profit growth coefficients. Based on Proposition 1, OSN service providers and online platforms will make the strategic choice of “Not Invest” due to the relatively small profit gained from investing in security. Therefore, increasing the minimum profit growth coefficients would help investors obtain larger profit when they choose “Invest” in security protection. The policy makers can create these conditions by implementing the following measures:
  • Support innovation of security protection technology. Any technological innovations related to OSN security that can increase profit and reduce cost should be encouraged and motivated through Governmental Science and Technology Plans or industrial development funds. Governments should prioritize financial support or encourage security protection R&D (Research and Development) using policy incentives and financial subsidies;
  • Develop or enhance security awareness. Proper security education programs should be developed or strengthened. This would broaden consciousness about security issues. Additionally, public lectures on security should be held so domain experts can systematically teach appropriate attitudes towards and actions about security protection; and
  • Provide two differentiated types of OSN services to online platforms. The basic service should be offered for free or at a low price to users. The value-added service, which offers improved levels of data security and privacy, would be provided at a higher price. With improved security awareness, users may be willing to pay more for better security protection. Through these two-type mechanisms, OSN service providers and online platforms could appropriately balance the profit and cost of security investment.
Policy advice 2. Reducing the cost of security investment. Based on the previous analysis, the probability of making the strategic choice of “Invest” is negatively correlated to the investment cost. When the investment cost is too high, the players tend to choose not to invest. Reducing the investment cost can eliminate investors’ speculation mentality and sustain the investment in OSN. This requires the government to promote and clarify security-related corporate responsibilities to OSN service providers and online platforms. Additionally, the cooperation among regulatory authorities should be strengthened.
Policy advice 3. Intensifying penalties and offering incentives. Based on Proposition 1 to Proposition 5, one important reason for the strategic choice to “Not Invest” (and free riding instead) is that the entities do not have to pay much for their misdemeanors. The model analysis shows that the probability of making the strategic choice of “Invest” is negatively correlated to the profit from free riding. Therefore, an effective incentive mechanism, which levies larger subsidies and fines to OSN service providers and online platforms, should be developed. The government should reward and support those agents who persist in implementing security investment, and guide OSN service providers and online platforms to transform their investment attitude in a way that enhance security awareness. Because of the importance of the incentive mechanism, the power of social organizations should be used to supplement government regulations. This could include relaxing approval conditions to give legality and authority to related entities, and supporting different security investment activities organized by the associations through financial subsidies and social donations.

7. Conclusions

This paper started with a systematic review of OSN security threats and possible solutions, which lays the foundation for selecting focusing areas and proper protection techniques for security investment. We then applied a quantity-setting duopoly evolutionary game model to investigate when OSN service providers and online platforms choose an optimal strategy to sustain information security investment. We examined the conditions under which the chosen strategy is an ESS profile. Additionally, we verified the theoretical results using a numerical simulation. The government agency can also use the proposed model to simulate and determine a proper incentive or penalty to avoid free riding and help both parties reach the best strategies and thus improve OSN security.
The study generated the following results, using both theoretical analysis and numerical simulation:
  • The strategic choice to sustain the security investment in OSN is correlated with the profit growth coefficients, investment costs, and profits from free riding;
  • as the profit growth coefficients increase, the ESS profile will change in the following order: (Not Invest, Not Invest), (Not invest, Invest), (Invest, Not invest), (Invest, Invest);
  • if the profit from free riding increases, the probability of security investment will decrease, which can result in a low efficiency of the sustainability of security investment; and
  • when using an incentive mechanism administered by a third-party, (Invest, Invest) becomes the optimal ESS profile, helping to sustain the security investment in OSN.
In summary, our results show that the profit growth coefficients, investment costs, and profits from free riding have important effects on the investment behavior in a game process. As noted in Section 4, a contract with an incentive mechanism should be developed to motivate OSN service providers and online platforms to make the strategic choice of “Invest” and ensure an optimal ESS profile. Another major finding from the sensitivity analyses is that the (Invest, Invest) profile is much less sensitive to the change of profit growth coefficients and the convergent speed of this scenario is also faster than the other profiles.
Like most game theoretical studies, our study has limitations to address in the future. First, one could use an evolutionary game model to select a strategy choice based on a nonlinear demand function. It would be interesting to compare those results with ours, though it would be very complicated to analyze. Second, a scenario involving an increased demand for user security protection could be considered as this would influence the evolutionary path of the strategies. Finally, future work could study how other factors (e.g., the price of value-added service, the reputation of investors) influence the evolution of the strategic choice.

Author Contributions

Conceptualization, G.Z. and H.L.; Formal analysis, G.Z. and M.F.; Methodology, G.Z. and H.L.

Funding

This work is funded by the National Natural Science Foundation of China (NSFC) under Grants No. 71503133, and the National Social Science Foundation of China under Grants No. 16ZDA054. The supports are gratefully acknowledged.

Conflicts of Interest

The authors declare no conflicts of interest.

References

  1. Shen, H.; Wang, G. Can Dynamic Knowledge-Sharing Activities Be Mirrored from the Static Online Social Network in Yahoo! Answers and How to Improve Its Quality of Service? IEEE Trans. Syst. Man Cybern. Syst. 2017, 47, 3363–3376. [Google Scholar] [CrossRef]
  2. Cezar, A.; Cavusoglu, H.; Raghunathan, S. Outsourcing Information Security: Contracting Issues and Security Implications. Manag. Sci. 2014, 60, 638–657. [Google Scholar] [CrossRef] [Green Version]
  3. Zhang, K.; Liang, X.; Shen, X.; Lu, R. Exploiting multimedia services in mobile social networks from security and privacy perspectives. IEEE Commun. Mag. 2014, 52, 58–65. [Google Scholar] [CrossRef]
  4. Hsu, J.S.-C.; Shih, S.-P.; Hung, Y.W.; Lowry, P.B. The Role of Extra-Role Behaviors and Social Controls in Information Security Policy Effectiveness. Inf. Syst. Res. 2015, 26, 282–300. [Google Scholar] [CrossRef]
  5. Hausken, K. Returns to information security investment: The effect of alternative information security breach functions on optimal investment and sensitivity to vulnerability. Inf. Syst. Front. 2006, 8, 338–349. [Google Scholar] [CrossRef]
  6. Cavusoglu, H.; Raghunathan, S.; Yue, W.T. Decision-Theoretic and Game-Theoretic Approaches to IT Security Investment. J. Manag. Inf. Syst. 2008, 25, 281–304. [Google Scholar] [CrossRef]
  7. Gao, X.; Zhong, W.; Mei, S. A game-theoretic analysis of information sharing and security investment for complementary firms. J. Oper. Res. Soc. 2014, 65, 1682–1691. [Google Scholar] [CrossRef]
  8. Al Ameen, M.; Liu, J.; Kwak, K. Security and Privacy Issues in Wireless Sensor Networks for Healthcare Applications. J. Med. Syst. 2012, 36, 93–101. [Google Scholar] [CrossRef] [PubMed]
  9. Li, Q.; Sandhu, R.; Zhang, X.; Xu, M. Mandatory Content Access Control for Privacy Protection in Information Centric Networks. IEEE Trans. Dependable Secure Comput. 2017, 14, 494–506. [Google Scholar] [CrossRef]
  10. Meland, P.H.; Tondel, I.A.; Solhaug, B. Mitigating Risk with Cyberinsurance. IEEE Secur. Priv. 2015, 13, 38–43. [Google Scholar] [CrossRef]
  11. Fielder, A.; Panaousis, E.; Malacaria, P.; Hankin, C.; Smeraldi, F. Decision support approaches for cyber security investment. Decis. Support Syst. 2016, 86, 13–23. [Google Scholar] [CrossRef]
  12. Han, C.Y.; Lunday, B.J.; Robbins, M.J. A Game Theoretic Model for the Optimal Location of Integrated Air Defense System Missile Batteries. INFORMS J. Comput. 2016, 28, 405–416. [Google Scholar] [CrossRef]
  13. Salant, S.W.; Switzer, S.; Reynolds, R.J. Losses from Horizontal Merger: The Effects of an Exogenous Change in Industry Structure on Cournot-Nash Equilibrium. Q. J. Econ. 1983, 98, 185–199. [Google Scholar] [CrossRef]
  14. Myerson, R.B. Refinements of the Nash equilibrium concept. Int. J. Game Theory 1978, 7, 73–80. [Google Scholar] [CrossRef]
  15. Chen, Y.; Ramamurthy, K.; Wen, K.-W. Organizations’ Information Security Policy Compliance: Stick or Carrot Approach? J. Manag. Inf. Syst. 2012, 29, 157–188. [Google Scholar] [CrossRef]
  16. Zhuang, J. Impacts of Subsidized Security on Stability and Total Social Costs of Equilibrium Solutions in an N-Player Game with Errors. Eng. Econ. 2010, 55, 131–149. [Google Scholar] [CrossRef]
  17. Olsder, G.J. Eigenvalues of dynamic max-min systems. Discret. Event Dyn. Syst. 1991, 1, 177–207. [Google Scholar] [CrossRef]
  18. OLSDER, G.J. Differential Game-Theoretic Thoughts on Option Pricing and Transaction Costs. Int. Game Theory Rev. 2000, 02, 209–228. [Google Scholar] [CrossRef]
  19. Deng, X.; Han, D.; Dezert, J.; Deng, Y.; Shyr, Y. Evidence Combination from an Evolutionary Game Theory Perspective. IEEE Trans. Cybern. 2016, 46, 2070–2082. [Google Scholar] [CrossRef] [PubMed]
  20. Gokhale, C.S.; Traulsen, A. Evolutionary Multiplayer Games. Dyn. Games Appl. 2014, 4, 468–488. [Google Scholar] [CrossRef] [Green Version]
  21. Taylor, P.D.; Jonker, L.B. Evolutionary stable strategies and game dynamics. Math. Biosci. 1978, 40, 145–156. [Google Scholar] [CrossRef]
  22. Maynard Smith, J. The theory of games and the evolution of animal conflicts. J. Theor. Biol. 1974, 47, 209–221. [Google Scholar] [CrossRef]
  23. Smith, J.M.; Price, G.R. The Logic of Animal Conflict. Nature 1973, 246, 15–18. [Google Scholar] [CrossRef]
  24. Gordon, L.A.; Loeb, M.P. The economics of information security investment. ACM Trans. Inf. Syst. Secur. 2002, 5, 438–457. [Google Scholar] [CrossRef]
  25. Cavusoglu, H.; Mishra, B.; Raghunathan, S. A model for evaluating IT security investments. Commun. ACM 2004, 47, 87–92. [Google Scholar] [CrossRef]
  26. Du, S.; Li, X.; Du, J.; Zhu, H. An attack-and-defence game for security assessment in vehicular ad hoc networks. Peer-to-Peer Netw. Appl. 2014, 7, 215–228. [Google Scholar] [CrossRef]
  27. Gordon, L.A.; Loeb, M.P.; Lucyshyn, W. Sharing information on computer systems security: An economic analysis. J. Account. Public Policy 2003, 22, 461–485. [Google Scholar] [CrossRef] [Green Version]
  28. Chen, L.; Leneutre, J. A Game Theoretical Framework on Intrusion Detection in Heterogeneous Networks. IEEE Trans. Inf. Forensics Secur. 2009, 4, 165–178. [Google Scholar] [CrossRef]
  29. Gal-Or, E.; Ghose, A. The Economic Incentives for Sharing Security Information. Inf. Syst. Res. 2005, 16, 186–208. [Google Scholar] [CrossRef] [Green Version]
  30. Liu, D.; Ji, Y.; Mookerjee, V. Knowledge sharing and investment decisions in information security. Decis. Support Syst. 2011, 52, 95–107. [Google Scholar] [CrossRef]
  31. Mookerjee, V.; Mookerjee, R.; Bensoussan, A.; Yue, W.T. When Hackers Talk: Managing Information Security Under Variable Attack Rates and Knowledge Dissemination. Inf. Syst. Res. 2011, 22, 606–623. [Google Scholar] [CrossRef]
  32. Cavusoglu, H.; Kwark, Y.; Mai, B.; Raghunathan, S. Passenger Profiling and Screening for Aviation Security in the Presence of Strategic Attackers. Decis. Anal. 2013, 10, 63–81. [Google Scholar] [CrossRef]
  33. Chai, S.; Kim, M.; Rao, H.R. Firms’ information security investment decisions: Stock market evidence of investors’ behavior. Decis. Support Syst. 2011, 50, 651–661. [Google Scholar] [CrossRef]
  34. Smith, J.M. Evolution and the Theory of Games; Cambridge University Press: Cambridge, UK, 1982; pp. 41–45. [Google Scholar]
  35. Zhang, H.; Xu, Z.; Zhou, D.; Cao, J. Waste cooking oil-to-energy under incomplete information: Identifying policy options through an evolutionary game. Appl. Energy 2017, 185, 547–555. [Google Scholar] [CrossRef]
  36. Friedman, D. On economic applications of evolutionary game theory. J. Evol. Econ. 1998, 8, 15–43. [Google Scholar] [CrossRef] [Green Version]
  37. Zhao, R.; Neighbour, G.; Han, J.; McGuire, M.; Deutz, P. Using game theory to describe strategy selection for environmental risk and carbon emissions reduction in the green supply chain. J. Loss Prev. Process Ind. 2012, 25, 927–936. [Google Scholar] [CrossRef]
  38. Tian, Y.; Govindan, K.; Zhu, Q. A system dynamics model based on evolutionary game theory for green supply chain management diffusion among Chinese manufacturers. J. Clean. Prod. 2014, 80, 96–105. [Google Scholar] [CrossRef]
Figure 1. Evolution of the dynamic model.
Mathematics 06 00177 g001
Figure 2. Simulation results of the basic evolutionary model.
Mathematics 06 00177 g002
Figure 3. Simulation results of sensitivity analysis.
Mathematics 06 00177 g003
Figure 4. Simulation under an incentive mechanism.
Mathematics 06 00177 g004
Figure 5. ESS profiles under different intervals of the profit growth coefficients.
Mathematics 06 00177 g005
Table 1. Payoff matrix.
OSN Service ProvidersOnline Platforms
Invest (I)Not Invest (NI)
Invest (I) a 1 E S C S , b 1 E P C P a 0 E S C S , ξ P
Not Invest (NI) ξ S , b 0 E P C P E S , E P
Table 2. Key notations of the evolutionary game model.
NotationsConnotations
E S Profits of OSN service providers if both players make the strategic choice of “Not Invest”, E S > 0
E P Profits of online platforms if both players make the strategic choice of “Not Invest”, E P > 0
C S Costs of security investment for OSN service providers, C S > 0
C P Costs of security investment for online platforms, C P > 0
ξ S Profits of OSN service providers from free riding, ξ S > E S > 0
ξ P Profits of online platforms from free riding, ξ P > E P > 0
a 0 Profit growth coefficient of OSN service providers if only they make the strategic choice of “Invest”, a 0 > 1
a 1 Profit growth coefficient of OSN service providers if both players make the strategic choice of “Invest”, a 1 > a 0 > 1
b 0 Profit growth coefficient of online platforms if only they make the strategic choice of “Invest”, b 0 > 1
b 1 Profit growth coefficient of online platforms if both players make the strategic choice of “Invest”, b 1 > b 0 > 1
Table 3. Values of equilibrium points.
Equilibrium Points a 11 a 12 a 21 a 22
(0, 0) ( a 0 1 ) E S C S 00 ( b 0 1 ) E P C P
(0, 1) a 1 E S C S ξ S 00 [ ( b 0 1 ) E P C P ]
(1, 0) [ ( a 0 1 ) E S C S ] 00 b 1 E P C P ξ P
(1, 1) ( a 1 E S C S ξ S ) 00 ( b 1 E P C P ξ P )
(A, B)0 a 12 ( A , B ) a 21 ( A , B ) 0
Table 4. Payoff Matrix under an incentive mechanism.
OSN Service ProvidersOnline Platforms
Invest (I)Not Invest (NI)
Invest (I) a 1 E S C S + K , b 1 E P C P + K a 0 E S C S + K , ξ P K
Not Invest (NI) ξ S K , b 0 E P C P + K E S K , E P K
Table 5. Values of equilibrium points with an incentive mechanism.
Equilibrium Points a 11 a 12 a 21 a 22
(0, 0) ( a 0 1 ) E S C S + K 00 ( b 0 1 ) E P C P + K
(0, 1) a 1 E S C S ξ S + K 00 [ ( b 0 1 ) E P C P + K ]
(1, 0) [ ( a 0 1 ) E S C S + K ] 00 b 1 E P C P ξ P + K
(1, 1) ( a 1 E S C S ξ S + K ) 00 ( b 1 E P C P ξ P + K )
( A , B ) 0 a 12 ( A , B ) a 21 ( A , B ) 0
Table 6. Different Values of a 0 , a 1 , b 0 , and b 1 .
a 0 a 1 b 0 b 1 ESS Profile
1.251.451.251.45(Not Invest, Not Invest)
1.251.451.51.7(Not invest, Invest)
1.61.81.251.45(Invest, Not invest)
1.61.81.51.7Free riding
2.22.42.12.3(Invest, Invest)
Table 7. Different Values of a 0 , a 1 , b 0 , and b 1 for sensitivity analysis of (0, 0).
Index a 0 a 1 b 0 b 1
11.11.31.11.3
21.151.351.151.35
31.21.41.21.4
41.251.451.251.45
51.31.51.31.5
Table 8. Different Values of a 0 , a 1 , b 0 , and b 1 for sensitivity analysis of (0, 1).
Index a 0 a 1 b 0 b 1
11.11.31.451.65
21.151.351.51.7
31.21.41.551.75
41.251.451.61.8
51.31.51.31.85
Table 9. Different Values of a 0 , a 1 , b 0 , and b 1 for sensitivity analysis of (1, 0).
Index a 0 a 1 b 0 b 1
11.551.751.11.3
21.61.81.151.35
31.651.851.21.4
41.71.91.251.45
51.751.951.31.5
Table 10. Different Values of a 0 , a 1 , b 0 , and b 1 for sensitivity analysis of (1, 0).
Index a 0 a 1 b 0 b 1
12.22.42.12.3
22.252.452.152.35
32.32.52.22.4
42.352.552.252.45
52.42.62.32.5

