

An EOQ Model for Temperature-Sensitive Deteriorating Items in Cold Chain Operations

1
Intelligent Maritime Research Center, National Taiwan Ocean University, Keelung City 20224, Taiwan
2
Department of Transportation Science, National Taiwan Ocean University, Keelung City 20224, Taiwan
3
Department of Industrial Engineering and Management, National Taipei University of Technology, Taipei 10608, Taiwan
*
Author to whom correspondence should be addressed.
Mathematics 2024, 12(5), 775; https://doi.org/10.3390/math12050775
Submission received: 21 December 2023
/
Revised: 16 February 2024
/
Accepted: 29 February 2024
/
Published: 5 March 2024
(This article belongs to the Special Issue Mathematical Approaches Applied in Operations Research, Logistics, and Inventory)
Abstract
:To improve the inventory management of cold chain logistics, we propose an economic order quantity (EOQ) inventory model for temperature-sensitive deteriorating products. Considering that the products are temperature-sensitive, the deterioration rate of the proposed model is a function of the temperature. In addition, the transportation cost, which is a function of the quantity ordered, is considered in this study. This article aims to find the optimal value of the total profit, selling price, and the length of the ordering cycle. Numerical examples are provided; the sensitivity analysis shows that the total profit is much more sensitive to transportation costs, compared with ordering and holding costs.
Keywords:
deteriorating inventory model; deterioration; EOQ; temperature sensitive; optimal; transportation costMSC:
90B051. Introduction
The fierce competition among corporations in the global market has driven decision makers to pay more attention to maneuvering their supply chain with inventory policies strategically [1]. The classical economic order quantity (EOQ) model, proposed by Ford W. Harris [2], has been developed extensively, with the general assumption that the perishability of the products is negligible. This assumption holds true for durable goods such as steel and toys for their extremely slow deterioration in quality.
However, the degree of perishability of products can be crucial to finding an effective and efficient inventory policy. Deterioration can be defined as decay, degradation, or spoilage during storage such as exposure to light, oxygen, moisture, air quality, microorganisms, and temperature. Products such as pharmaceuticals and chemical compounds usually lose value with a longer time from production to consumption. Ghare and Schrader [3] were the first researchers to consider deteriorating items in the inventory model. They established an exponentially deteriorating inventory model and divided the deterioration characteristics into direct spoilage, physical depletion, and deterioration. Nakhai and Jafari [4] developed a deteriorating inventory model for medicinal drugs, where the demand rate was inventory level-dependent, and the deterioration rate was a function of the ordering cycle. Extended versions of inventory models have been developed according to the characteristics of perishable products and the factors that cause them to deteriorate, with a similar assumption of a constant deterioration rate [5,6,7,8,9,10,11].
Deterioration lowers customers’ intention to purchase, forcing sellers to reduce the selling price before the shelf time is up. To balance the losses in sales and the losses in excessive inventory, the objective of defining optimal inventory policies shifts from cost minimization to profit maximization. Hwang and Shinn [12] were the first to consider nonlinear, price-dependent demand in an inventory problem with a constant deterioration rate. Mukhopadhyay et al. [13] built a deteriorating inventory model with a price-dependent demand rate and time-proportional deterioration rate to consider the dynamic deterioration rate. Wang et al. [14] provided a deteriorating inventory model in a multi-echelon supply chain setting, where the demand rate is constant and the deterioration rate is time-sensitive. Other financial performance aspects, such as trade credit or delayed payment, can have an impact on inventory management [15,16,17,18,19,20,21]. Tiwari et al. [19] proposed an integrated inventory model under two-level partial trade credit for deterioration products, where demand is a function of price and the deterioration rate is time-varying. Gupta et al. [20] developed a deteriorating inventory model with permissible delay in payments, where demand is a constant value and the deterioration rate is time-dependent. Their model allows for partial backlogging under a two-warehouse environment. Mahata et al. [21] proposed an EOQ model for deteriorating items under two-level trade credit, where the deterioration rate is a non-decreasing function of time and the demand rate is a function of the customer’s trade credit period offered.
Among the most challenging products in inventory management are temperature-sensitive ones, such as vaccines, which requires cold chain logistics to keep the temperature under tight control [22,23,24,25]. Dye [22] developed an inventory model with options for preservation technology investment, where the deterioration rate is a function of the retailer’s capital investment. Shah et al. [23] presented an inventory system for non-instantaneously deteriorating products with a time-dependent deterioration rate while assuming the demand rate to be a function of the selling price and frequency of advertisement. Mishra et al. [24] proposed a deteriorating inventory model with preservation technology investment. They assumed the deterioration rate to be a function of preservation technology investment and demand to be price- and stock-related.
The inventory problem studied here concerns perishable chilled food, such as yogurt, which has a steep, time-proportional decay and whose freshness is very sensitive to the storage temperature [26]. For the food industry, not only the product is perishable with a temperature-sensitive deterioration rate [27], but also the demand is price-sensitive [28,29,30]. From the retailer’s perspective, the decision of optimal pricing to maximize profitability should be integrated with the inventory policy. Yang and Tseng [30] proposed a deteriorating inventory model for chilled food with a price-dependent demand rate and time-proportional deterioration rate.
Most researchers assume that the transportation cost is negligible. However, transportation costs could be significant in cold chain logistics. Zhang and Liu [31] studied the cost of cold chain logistics in the purchasing storage–sale of fresh agricultural products. Their simulation results showed that the transportation cost accounts for almost one-third of the total cost, more than the storage cost. When the purchase quantity increased, the total costs of cold chain logistics increased significantly, even with the reduced traffic volume.
This research aims to fill this gap by proposing an EOQ model for temperature-sensitive deteriorating items, assuming that the demand is nonlinear and price-dependent and considering transportation costs in cold chain logistics. The rest of this paper is structured as follows: The model formulations are proposed in Section 2. The numerical experiment and results are illustrated in Section 3. The sensitivity analysis of the critical parameters is performed in Section 4. Finally, conclusions are presented in Section 5.
2. Model Formulation
2.1. Notations and Assumptions
In this research, a deteriorating inventory model with a price-dependent demand rate that also includes transportation cost, in addition to the holding cost and ordering cost, is proposed. To develop a continuous-review deterministic inventory model with dynamic deterioration, the notations used for this model are listed in Table 1.
Further, the following assumptions are made on the models:
- (1)
- The deterioration rate () is a function of the temperature (), where and . The deterioration rate () increases as the temperature (t) increases [30].
- (2)
- Shortage and backordering are not allowed in this model.
- (3)
- The lead time is negligible.
- (4)
- The time horizon is infinite.
- (5)
- Deteriorated products are not replaceable or repairable.
- (6)
- The demand rate (), depending on the selling price of the product, equals , where is a scale parameter and is a price-elasticity coefficient [13].
2.2. Model Development
The inventory model is depicted graphically in Figure 1, where the solid-line curve indicates the inventory level vs. decay and the dashed-line curve indicates the inventory level vs. the demand rate (D(p)). Figure 2 shows the inventory profile of the retailer, where k is the length of each cycle. According to Cohen’s [32] research, depletion co-occurs with demand and decay. Let be the inventory level at time k , which the differential function can represent as
When , we have
The solution to Equation (1) can be derived as
where is the initial inventory level when there is decay and the demand rate is assumed to be positive, having a negative derivative () in its entire domain.
Let be the loss in stock due to decay in the time interval [0, k]. Consequently, , which is the difference in inventory levels with and without decay at the end of the cycle, can be stated as (see Appendix A)
Then, we can obtain the quantity ordered () in each cycle as
Based on the assumptions in Section 2.1, the total cost for the retailer per cycle is
Hence, the total cost for the retailer per unit of time is
By using a truncated Taylor series expansion and assuming that , we have
For small values of , Equation (7) can be rewritten as
The derivative of the total cost function can be expressed as
We solve to obtain the optimal cycle length.
The retailer’s total profit can be expressed as
The derivative of the total cost function is
And let ; this yields the optimal price as
where equals , α is a scale parameter, and β is a price-elasticity coefficient.
We can consider the effects of alteration in product perishability and pricing on the order decision and examine the optimal ordered quantity of the system. From Equations (5), (11), and (14), we can obtain the optimal order quantity, the optimal total cost, and the optimal total profit as follows:
3. Numerical Example and Results
A numerical example illustrates the proposed model, and the optimal total profit, selling price, cycle time, and ordered quantity are solved using MATLAB R2020b. The parameters are in appropriate units and mainly adapted from Mukhopadhyay et al. [13] and Chen and Sarker [33], as shown in Table 2.
The initial set of temperature t is 0 °C, 7 °C, 16 °C, and 25 °C. For temperature t = 0 °C, the p* and K* value are calculated from Equations (14) and (11). The optimal profit function at t = 0 °C concerning inventory cycle time K when the price is fixed at the value of p* is shown in Figure 3. The optimal profit peaks when cycle time K is between 0.1 and 0.2 and then drops gradually when the cycle time is longer than 0.2. Figure 4 shows the optimal profit function at t = 0 °C concerning the selling price (p) when the cycle time is fixed at the value of K*. It shows that the optimal selling price is between 75 and 80.
Once the values of p* and K* are obtained, the optimal ordered quantity (), the optimal total cost (), and the optimal total profit () at t = 0 °C can then be obtained by substituting p* and K* into Equations (15)–(17). The same steps are repeated for temperatures t = 7 °C, 16 °C, and 25 °C; the results are summarized in Table 3. From the results in Table 3, we can observe that as the storage temperature (t) increased, the deterioration rate (θ) increased, while the optimal selling price (p) decreased. It means that increasing the storage temperature (t) leads to more severe deterioration and makes the products lose value, forcing the manufacturer and retailer to lower the product prices.
We can also notice that when the storage temperature (t) increased, the optimal cycle time (K*) and the optimal quantity ordered () decreased; the graph is shown in Figure 5. In other words, the higher storage temperature leads to a decrease in quantity ordered and an increase in order frequency in the system. Figure 6 reveals the joint concavity concerning the decision variables K and p, leading to the assurance of not only the global but also the unique solution of the problem; the proof of the concavity of the total profit function is given in Appendix B.
4. Sensitivity Analysis
In this section, the sensitivity analysis of the critical parameters is performed. Since the obtained total profit at t = 0 °C is higher than that at other storage temperatures, we use storage temperature t = 0 °C as an example to perform the sensitivity analysis. The sensitivity analysis is performed by changing a single parameter to −20%, −10%, +10%, and +20% from the original values. The percentage of total profit difference (PTPD) is defined as , where for p* = 76.364 and K* = 0.0305 at t = 0 °C.
Table 4 and Table 5 summarize the detailed sensitivity results for critical parameters and of the demand curve. The shape parameter (β) is much more sensitive than the scale parameter (α), with opposite effects on the total profit. The PTPD increases by 20.46% when α increases by 20%, but the real profit decreases by 84.52% when β increases by 20%. On the other hand, the total gain decreases by 20.46% when α decreases by 20%, but it increases by 638.01% when β decreases by 20%.
A similar sensitivity effect on the optimal selling price can be observed with the change in the shape parameter (β) and scale parameter (α). When α increases by 20%, the optimal price is 76.472, but it decreases to 66.37 when β increases by 20%. On the other hand, the optimal price decreases to 76.218 when α decreases by 20%, but it increases to 97.085 when β decreases by 20%.
However, the effect of the changes in the shape parameter (β) and the scale parameter (α) on the optimal cycle time is reversed. The cycle time decreases to 0.0279 when α increases by 20%, but it increases to 0.0624 when β increases by 20%. On the other hand, the cycle time increases to 0.034 when α decreases by 20%, but it decreases to 0.0145 when β decreases by 20%.
Table 6, Table 7, Table 8 and Table 9 show the sensitivity results for ordering cost (S), purchase cost (c), inventory holding cost (h), and transportation cost (f), respectively. The most sensitive cost parameter with respect to the total profit is the purchase cost (c). The PTPD decreases by 19.21% when c increases by 20%. When c decreases by 20%, the PTPD increases by 29.34%. Second to the purchase cost (c), the transportation cost (f) is much more sensitive to the total profit than the ordering cost (S) and the inventory holding cost (h). The PTPD decreases by 1.44% when f increases by 20%. When f decreases by 20%, the PTPD increases by 1.47%.
Other than the purchase cost (c), the selling prices also increase as the transportation cost (f) increases, but to a minimal degree The purchase cost (c) is also the most sensitive parameter with respect to the optimal selling price. The selling price increases to 90.583 when c increases by 20% and decreases to 62.104 when c decreases by 20%. The selling price increases to 77.254 when f increases by 20% and decreases to 75.474 when f decreases by 20%. Both purchase cost (c) and ordering cost (S) are sensitive to the optimal cycle time. The cycle time increases to 0.0338 and 0.0333 when c and S decrease by 20%, respectively. The cycle time decreases to 0.0269 and 0.0273 when c and S increase by 20%.
Figure 7 summarizes the detailed results of the sensitivity to total profit changes for all parameter changes other than the change in the shape parameter (β) of the demand curve. This is due to the reason that the shape parameter (β) is the most sensitive parameter and increases the total profit by six times when it decreases by 20%. On the other hand, the scale parameter (α) of the demand curve is positively correlated to the total profit. By looking at the demand equation , the scale parameter (α) can be recognized as the size of the market. When α increases, the total profit increases. The increase in α is beneficial to the model as it helps increase the total gain for the system. All cost parameters are negatively correlated to the total profit. Among ordering cost (S), holding cost (h), and transportation cost (f), the total profit of the model is much more sensitive to changes in the value of the transportation cost (f).
The sensitivity results for all parameter changes with respect to the optimal price are shown in Figure 8. Similar to the sensitivity to the total profit, both parameters of the demand curve are highly sensitive to the selling price. For cost parameters, the changes in price are very minor, while the transportation cost seems to have a slightly greater positive impact.
Regarding the optimal cycle time, Figure 9 depicts the sensitivity results for all parameter changes. Again, the shape parameter (β) is the most sensitive among all parameters. The impact of changes in the purchasing cost and the ordering cost are similar, while the changes in the holding costs and the transportation cost are almost negligible.
5. Conclusions
This research develops an EOQ model with nonlinear, price-dependent demand and temperature-dependent deterioration rates, focusing on temperature-sensitive items. As discussed in Section 1, many scholars have studied perishable products, but only some have considered the deterioration rate’s temperature dependence, and none have considered the transportation cost in the model. The model proposed here is developed and solved analytically. Then, a numerical example with hypothetical parameters is used for illustration purposes, as well as for the sensitivity analysis of demand and cost parameters.
An EOQ model is proposed for temperature-sensitive deteriorating items, assuming that the demand is nonlinear and price-dependent and has a non-negligible transportation cost. This research demonstrates that this model’s total profit is concave. As the storage temperature (t) increased, the deterioration rate (θ) increased, while the optimal selling price (p), the optimal cycle time (K), and the optimal ordered quantity decreased. That is to say, the increase in storage temperature leads to more severe deterioration, and lower temperatures could achieve higher profit. However, the level of changes in the selling price is rather limited, even negligible. This observation is quite different from the results obtained by Yang and Tseng [30]. The chilled product studied was pork sandwiches, and poor-quality sandwiches could cause fatal illness [30]. This study assumes that chilled products like yogurt would lose value due to deterioration in storage but would still be sellable for a much longer period. It implies that the selling price would be more sensitive for chilled products with a shorter shelf life.
The sensitivity analysis shows that the transportation cost is more sensitive than the ordering cost and the holding cost to the total profit. A managerial insight could be that for firms who try to improve their performance in total profit, they might want to focus more on lowering transportation costs than on experimenting with different selling prices. This paper can be extended in several ways, such as for multi-items or by allowing for shortage or backordering. It is also appropriate to consider fuzzy techniques in deciding the best storage temperature depending on environmental factors or choices of storage devices. For real-world implications, this study can be further improved with practical data on chilled products to simulate temperature’s real impact on inventory policies.
Author Contributions
Conceptualization, M.-F.Y. and P.-F.T.; methodology, M.-F.Y.; software, M.-R.T.; validation, M.-F.Y., P.-F.T. and M.-R.T.; formal analysis, P.-F.T.; investigation, M.-F.Y.; resources, M.-R.T.; data curation, Y.-F.Y.; writing—original draft preparation, M.-F.Y.; writing—review and editing, P.-F.T.; visualization, P.-F.T.; supervision, M.-F.Y.; project administration, Y.-F.Y.; funding acquisition, M.-F.Y. and P.-F.T. All authors have read and agreed to the published version of the manuscript.
Funding
This research received no external funding.
Data Availability Statement
The authors confirm that the data supporting the findings of this study are available within the article.
Conflicts of Interest
The authors declare no conflict of interest.
Appendix A
According to Equation (3), the initial inventory level is
Let be the instantaneous inventory level at any time k () without decay; we have
The loss in stock due to deterioration at the end is equal to ; then,
According to (A2) and (A4), we have
Appendix B
To examine the total profit of the system () has a unique point of maximization; we apply the Hessian matrix to show the concavity condition of the total profit function as follows:
A Hessian matrix is applied and is given by
, with minor determinant as , , , and .
References
- Lau, R.S.M.; Xie, J.; Zhao, X. Effects of inventory policy on supply chain performance: A simulation study of critical decision parameters. Comput. Ind. Eng. 2008, 55, 620–633. [Google Scholar] [CrossRef]
- Harris, F.W. How Many Parts to Make at Once. Fact. Mag. Manag. 1913, 10, 135–136, 152, Erratum in Oper. Res. 1990, 38, 947–950. [Google Scholar] [CrossRef]
- Ghare, P.M.; Schrader, G.F. A model for an exponentially decaying inventory. J. Ind. Eng. 1963, 14, 238–241. [Google Scholar]
- Nakhai, I.; Jafari, S. New inventory model for perishable valuable materials such as special diseases’ drugs. In Proceedings of the IEEE International Conference on Management of Innovation & Technology, Singapore, 2–5 June 2010; pp. 600–605. [Google Scholar] [CrossRef]
- Aggarwal, S.P.; Jaggi, C.K. Ordering policies of deteriorating items under permissible delay in payments. J. Oper. Res. Soc. 1995, 46, 658–662. [Google Scholar] [CrossRef]
- Khanra, S.; Chaudhuri, K.S. A note on an order-level inventory model for a deteriorating item with time-dependent quadratic demand. Comput. Oper. Res. 2003, 30, 1901–1916. [Google Scholar] [CrossRef]
- Lin, C.; Lin, Y. A cooperative inventory policy with deteriorating items for a two-echelon model. Eur. J. Oper. Res. 2007, 178, 92–111. [Google Scholar] [CrossRef]
- Jha, J.K.; Shanker, K. A single-vendor single-buyer production-inventory model with controllable lead time and service level constraint for decaying items. Int. J. Prod. Res. 2009, 47, 6875–6898. [Google Scholar] [CrossRef]
- Ameli, M.; Mirzazadeh, A.; Akbarpour, S.M. Entropic economic order quantity model for items with imperfect quality considering constant rate of deterioration under fuzzy inflationary conditions. Int. J. Ind. Eng. Prod. Res. 2013, 24, 91–99. [Google Scholar] [CrossRef]
- Mokhtari, H.; Salmasnia, A.; Asadkhani, J. A new production-inventory planning model for joint growing and deteriorating items. Int. J. Supply Oper. Manag. 2020, 7, 1–16. [Google Scholar] [CrossRef]
- Sundararajan, R.; Palanivel, M.; Uthayakumar, R. An inventory system of non-instantaneous deteriorating items with backlogging and time discounting. Int. J. Syst. Sci. Oper. Logist. 2020, 7, 233–247. [Google Scholar] [CrossRef]
- Hwang, H.; Shinn, S.W. Retailer’s pricing and lot sizing policy for exponentially deteriorating products under the condition of permissible delay in payments. Comput. Oper. Res. 1997, 24, 539–547. [Google Scholar] [CrossRef]
- Mukhopadhyay, S.; Mukherjee, R.N.; Chaudhuri, K.S. Joint pricing and ordering policy for a deteriorating inventory. Comput. Ind. Eng. 2004, 47, 339–349. [Google Scholar] [CrossRef]
- Wang, K.J.; Lin, Y.S.; Jonas, C.P. Optimizing inventory policy for products with time-sensitive deteriorating rates in a multi-echelon supply chain. Int. J. Prod. Econ. 2011, 130, 66–76. [Google Scholar] [CrossRef]
- Pervin, M.; Roy, S.K.; Weber, G.W. An integrated inventory model with variable holding cost under two levels of trade-credit policy. Numer. Algebra Control Optim. 2018, 8, 169. [Google Scholar] [CrossRef]
- Daryanto, Y.; Wee, H.M.; Astanti, R.D. Three-echelon supply chain model considering carbon emission and item deterioration. Transp. Res. Part E Logist. Transp. Rev. 2019, 122, 368–383. [Google Scholar] [CrossRef]
- Duan, Y.; Liu, J. Optimal dynamic pricing for perishable foods with quality and quantity deteriorating simultaneously under reference price effects. Int. J. Syst. Sci. Oper. Logist. 2019, 6, 346–355. [Google Scholar] [CrossRef]
- Sundararajan, R.; Vaithyasubramanian, S.; Rajinikannan, M. Price determination of a non-instantaneous deteriorating EOQ model with shortage and inflation under delay in payment. Int. J. Syst. Sci. Oper. Logist. 2021, 9, 384–404. [Google Scholar] [CrossRef]
- Tsao, Y.C. Two-phase pricing and inventory management for deteriorating and fashion goods under trade credit. Math. Methods Oper. Res. 2010, 72, 107–127. [Google Scholar] [CrossRef]
- Tiwari, S.; Cárdenas-Barrón, L.E.; Goh, M.; Shaikh, A.A. Joint pricing and inventory model for deteriorating items with expiration dates and partial backlogging under two-level partial trade credits in supply chain. Int. J. Prod. Econ. 2018, 200, 16–36. [Google Scholar] [CrossRef]
- Gupta, M.; Tiwari, S.; Jaggi, C.K. Retailer’s ordering policies for time-varying deteriorating items with partial backlogging and permissible delay in payments in a two-warehouse environment. Ann. Oper. Res. 2020, 295, 139–161. [Google Scholar] [CrossRef]
- Mahata, P.; Mahata, G.C.; De, S.K. An economic order quantity model under two-level partial trade credit for time varying deteriorating items. Int. J. Syst. Sci. Oper. Logist. 2020, 7, 1–17. [Google Scholar] [CrossRef]
- Dye, C.Y. The effect of preservation technology investment on a non-instantaneous deteriorating inventory model. Omega 2013, 41, 872–880. [Google Scholar] [CrossRef]
- Shah, N.H.; Soni, H.N.; Patel, K.A. Optimizing inventory and marketing policy for non-instantaneous deteriorating items with generalized type deterioration and holding cost rates. Omega 2013, 41, 421–430. [Google Scholar] [CrossRef]
- Mishra, U.; Cárdenas-Barrón, L.E.; Tiwari, S.; Shaikh, A.A.; Treviño-Garza, G. An inventory model under price and stock dependent demand for controllable deterioration rate with shortages and preservation technology investment. Ann. Oper. Res. 2017, 254, 165–190. [Google Scholar] [CrossRef]
- Salvador, A.; Fiszman, S.M. Textural and sensory characteristics of whole and skimmed flavored set-type yogurt during long storage. J. Dairy Sci. 2004, 87, 4033–4041. [Google Scholar] [CrossRef] [PubMed]
- Iao, L.C.; Hsiao, H.I.; Yang, M.F. Temperature monitoring for quality prediction and inventory control in cold chain: A case of 18 °C ready-to-eat food in Taiwan. Natl. Taiwan Ocean. Univ. Res. Syst. 2013. [Google Scholar] [CrossRef]
- Hsiao, H.-I.; Tu, M.; Yang, M.-F.; Tseng, W.-C. Deteriorating inventory model for ready-to-eat food under fuzzy environment. Int. J. Logist. Res. Appl. 2017, 20, 560–580. [Google Scholar] [CrossRef]
- Ndraha, N.; Hsiao, H.-I.; Vlajic, J.; Yang, M.-F.; Lin, H.-T.V. Time-temperature abuse in the food cold chain: Review of issues, challenges, and recommendations. Food Control 2018, 89, 12–21. [Google Scholar] [CrossRef]
- Yang, M.-F.; Tseng, W.-C. Deteriorating inventory model for chilled food. Math. Probl. Eng. 2015, 2015, 816876. [Google Scholar] [CrossRef]
- Zhang, M.; Liu, C.S. Cost simulation and optimization of fresh cold chain logistics enterprises based on SD. IOP Conf. Ser. Mater. Sci. Eng. 2018, 392, 062121. [Google Scholar] [CrossRef]
- Cohen, M.A. Joint pricing and ordering policy for exponentially decaying inventory with known demand. Nav. Res. Logist. Q. 1977, 24, 257–268. [Google Scholar] [CrossRef]
- Chen, Z.; Sarker, B.R. Integrated production-inventory and pricing decisions for a single-manufacturer multi-retailer system of deteriorating items under JIT delivery policy. Int. J. Adv. Manuf. Technol. 2017, 89, 2099–2117. [Google Scholar] [CrossRef]
Figure 1.
Graphical representation of the inventory model.
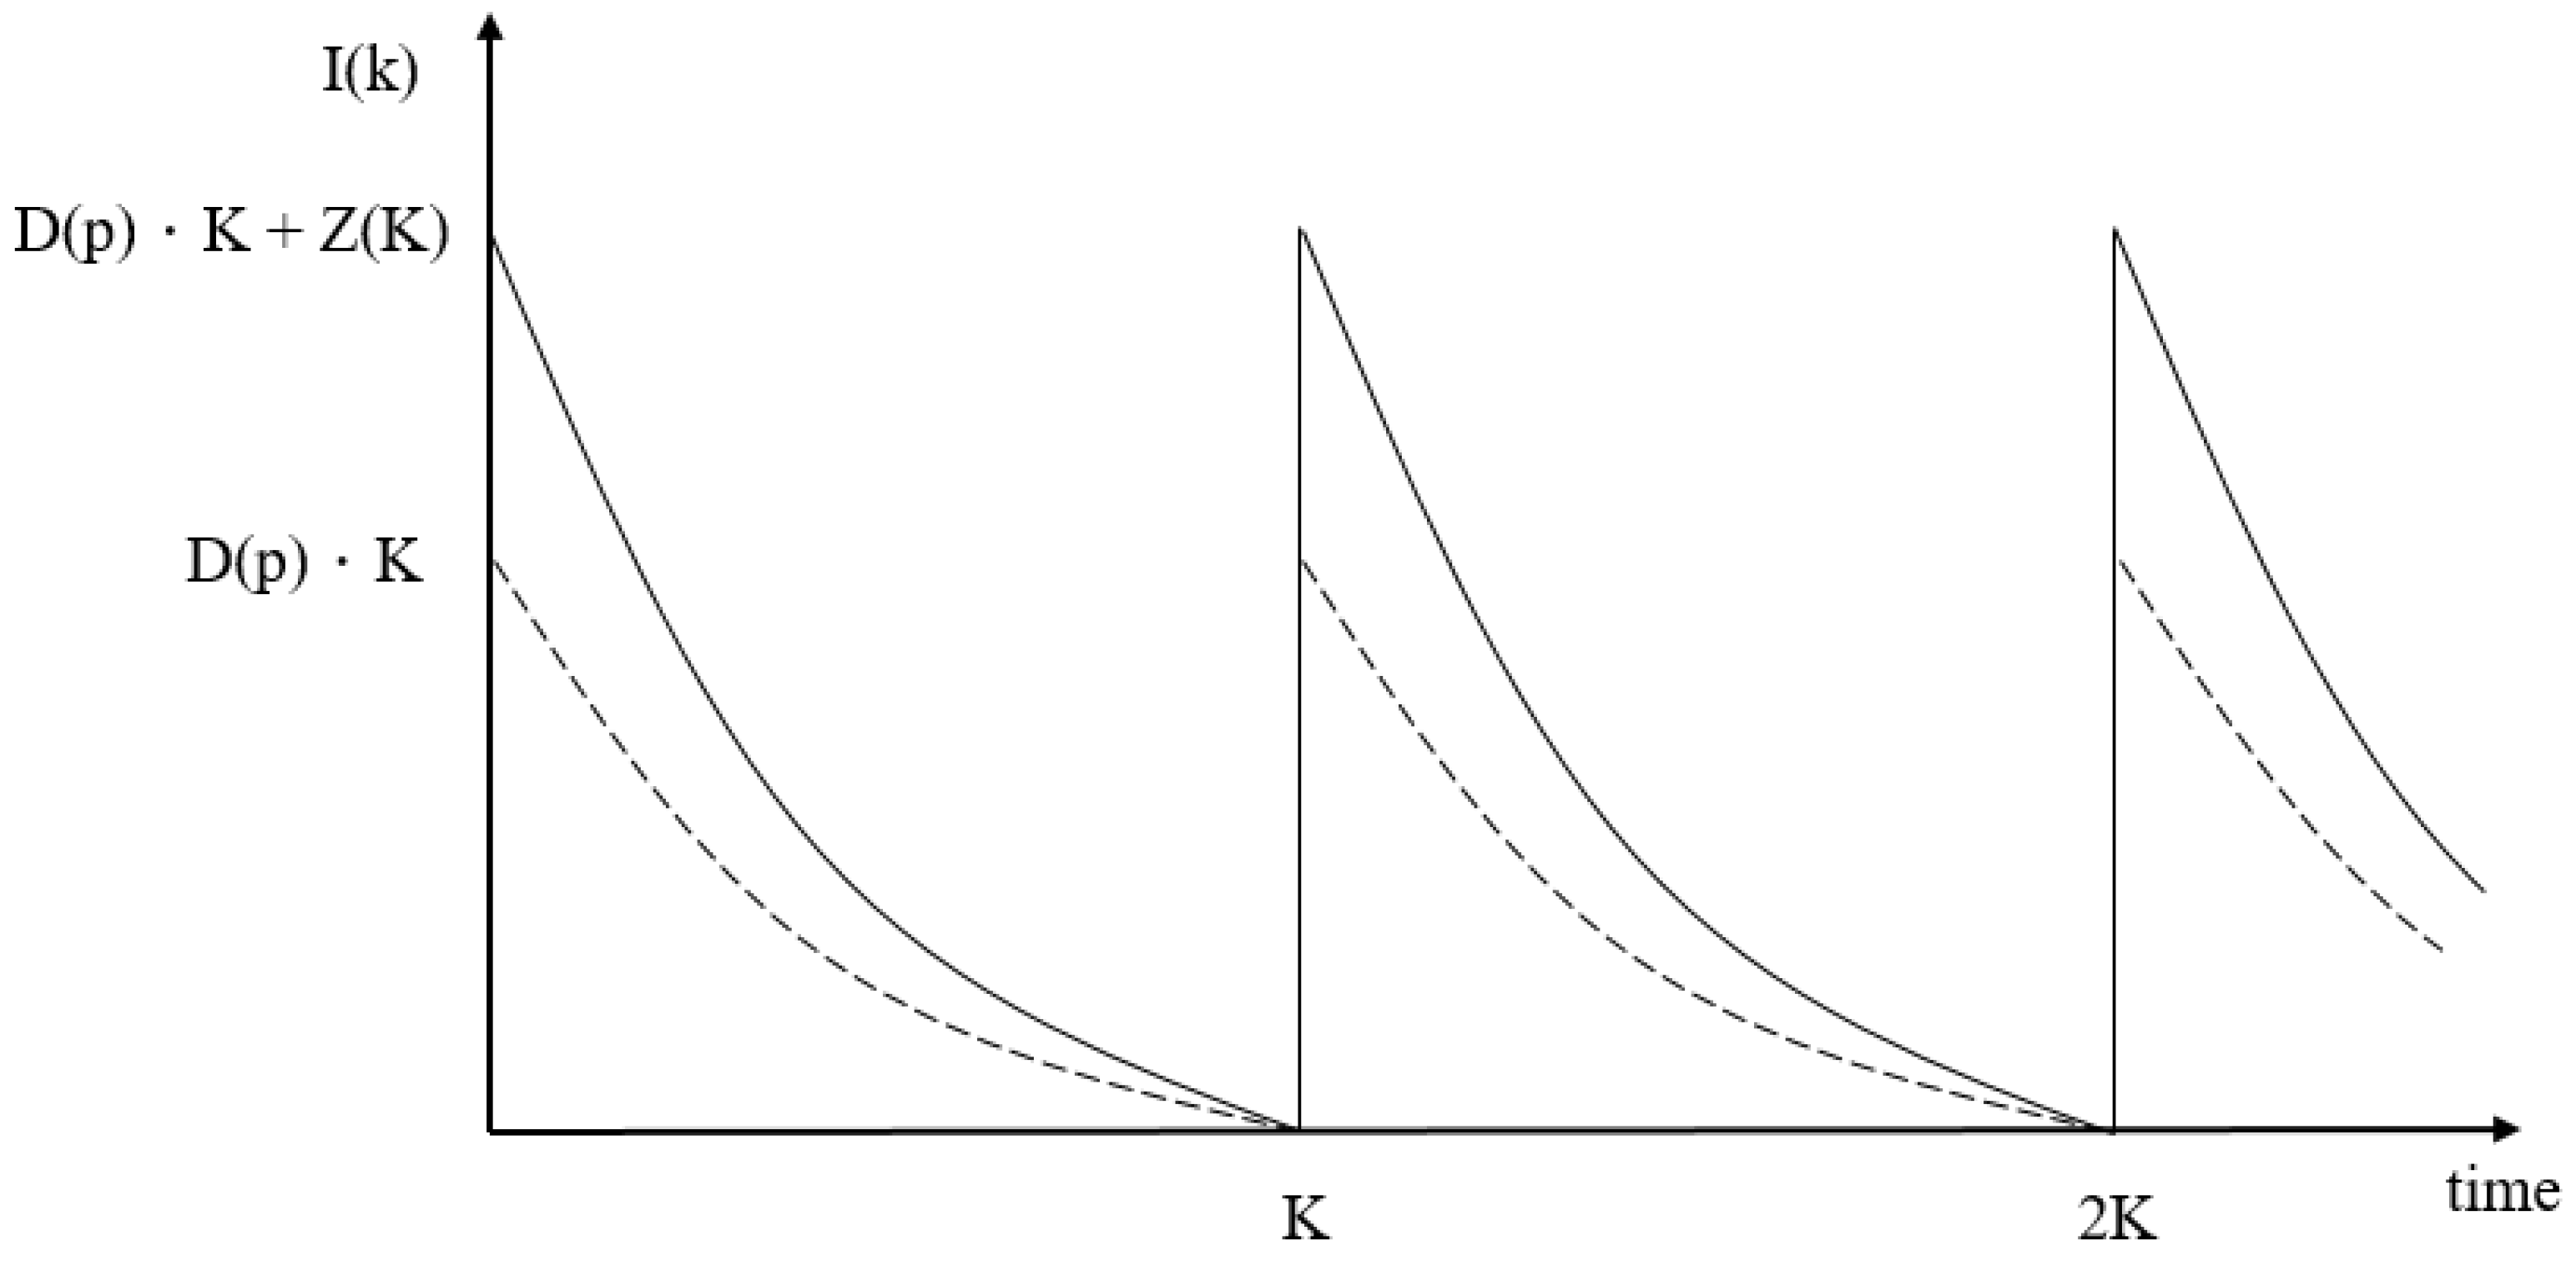
Figure 2.
The inventory profile of the retailer.
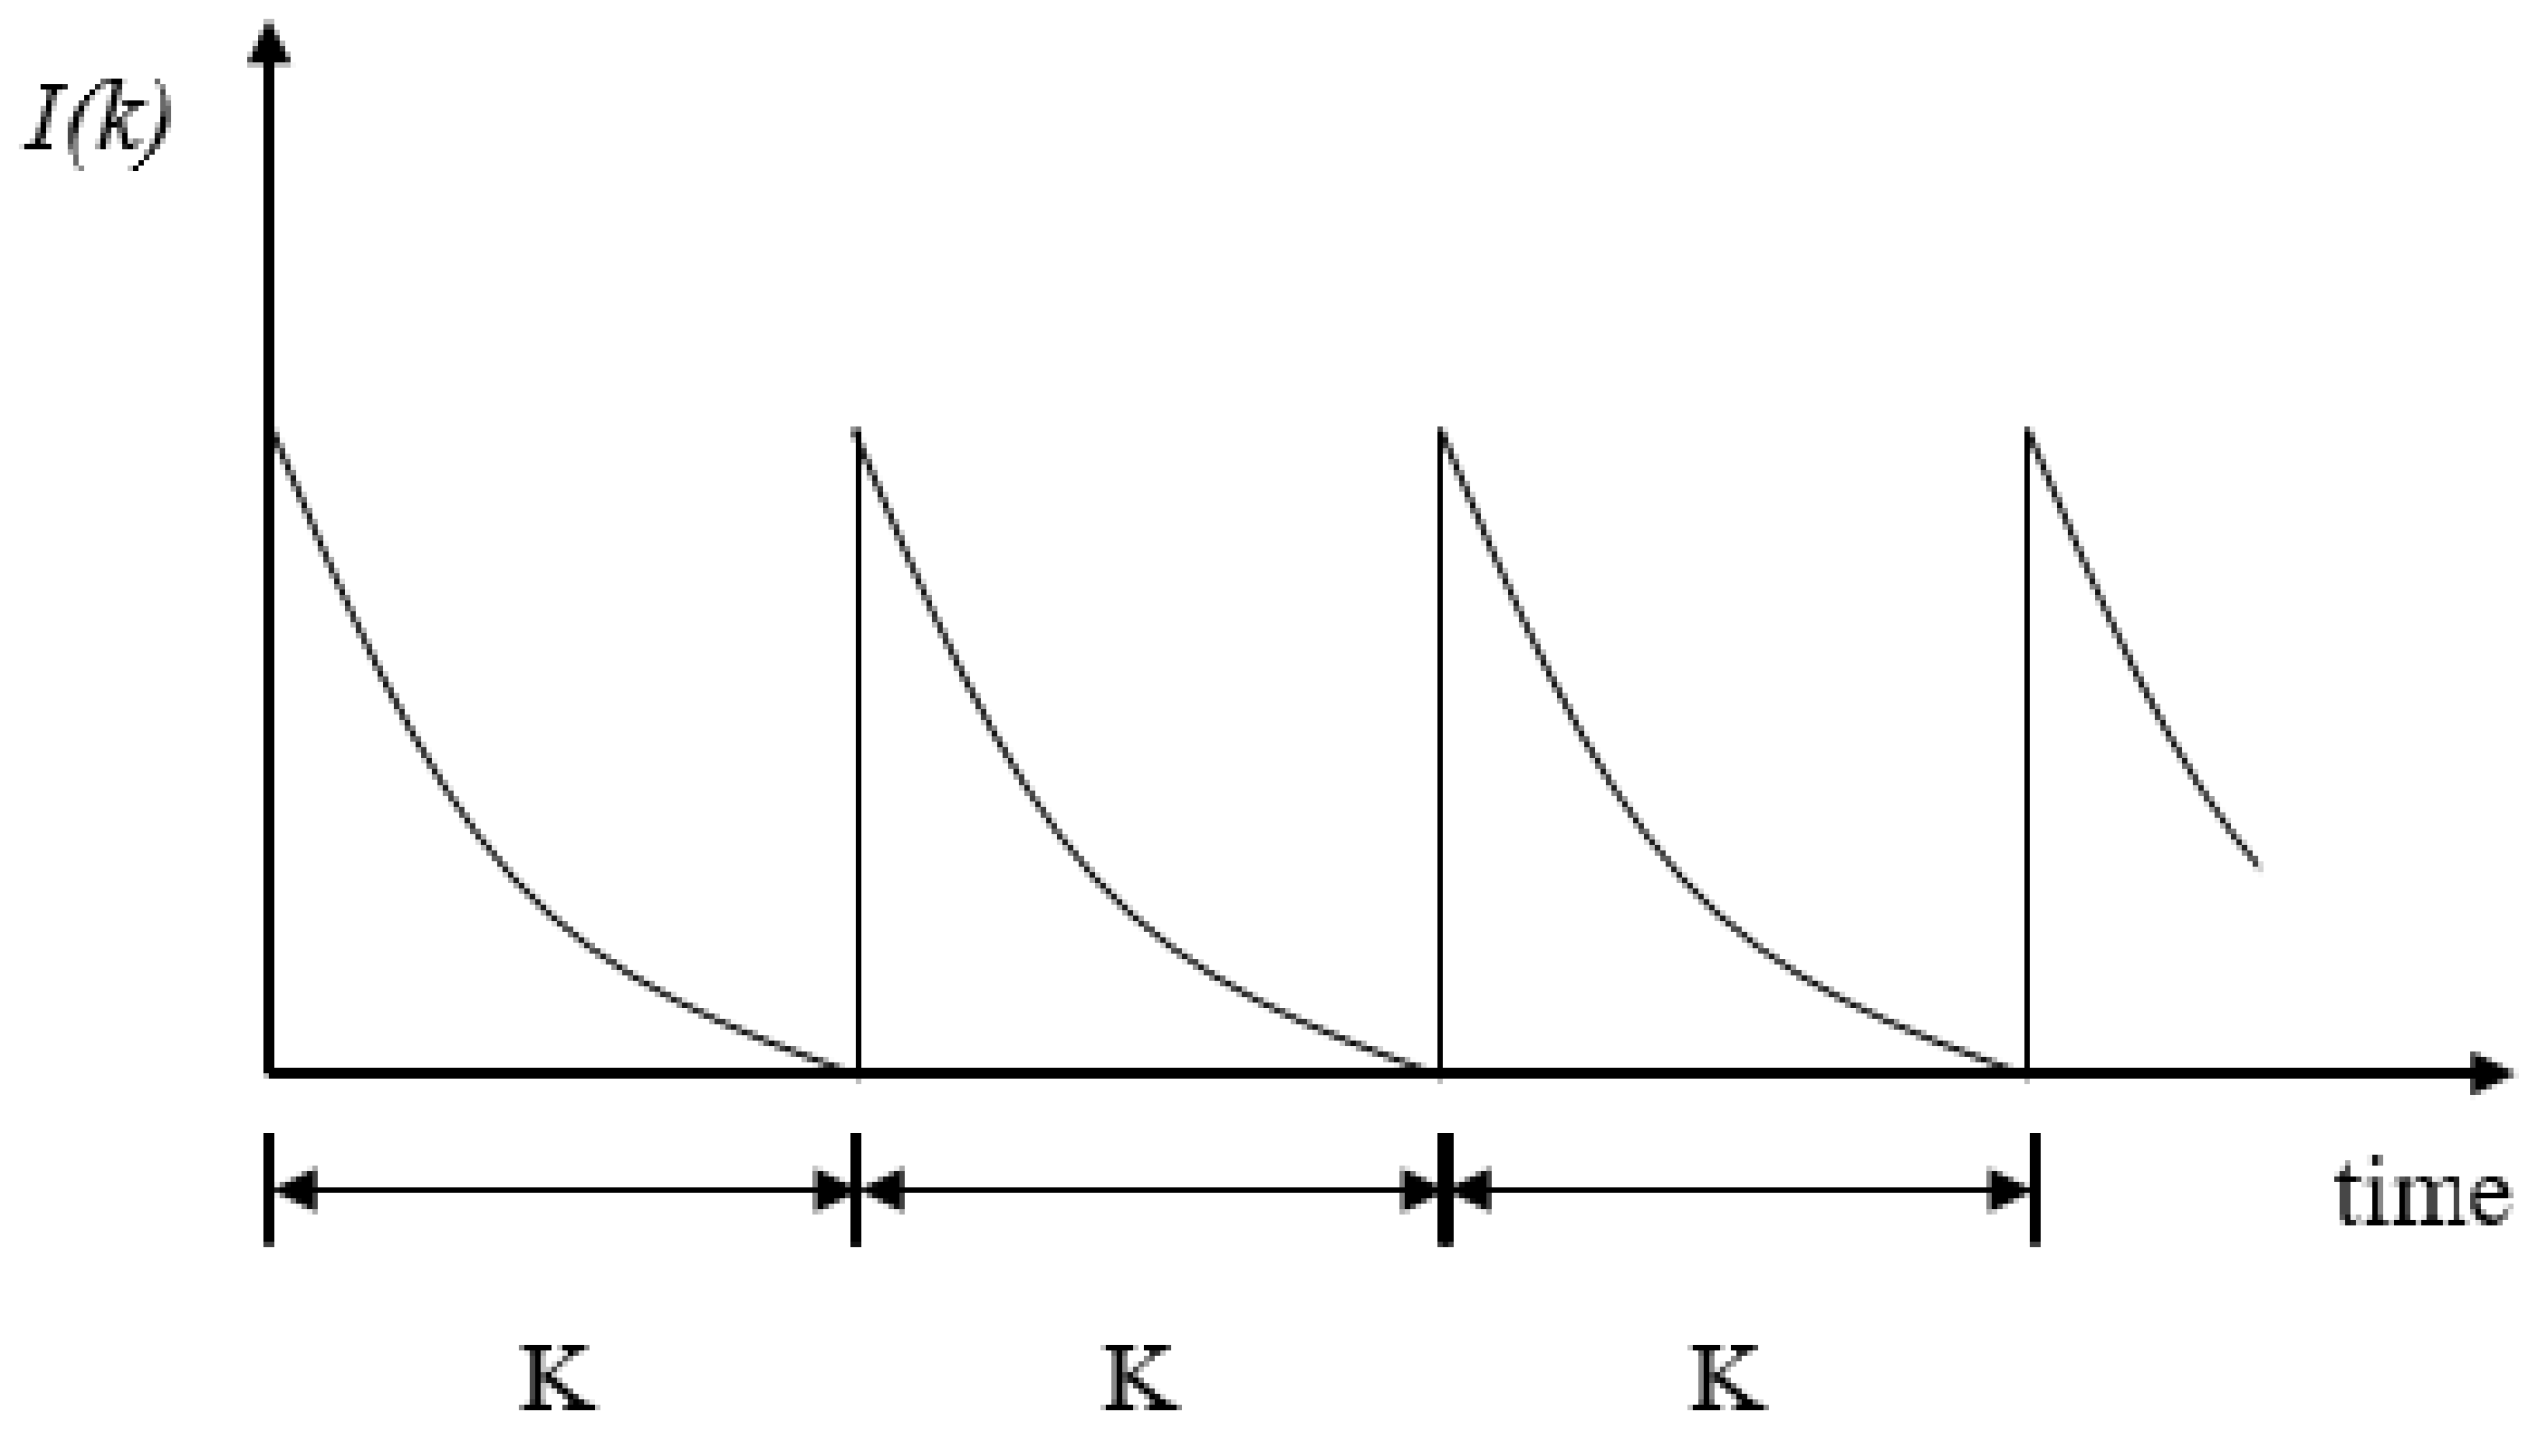
Figure 3.
The graph of at t = 0 °C when .

Figure 4.
The graph of at t = 0 °C when .

Figure 5.
The optimal cycle time (K*) and the optimal quantity ordered () under different storage temperatures (t).
Figure 5.
The optimal cycle time (K*) and the optimal quantity ordered () under different storage temperatures (t).

Figure 6.
Concavity of total profit function.
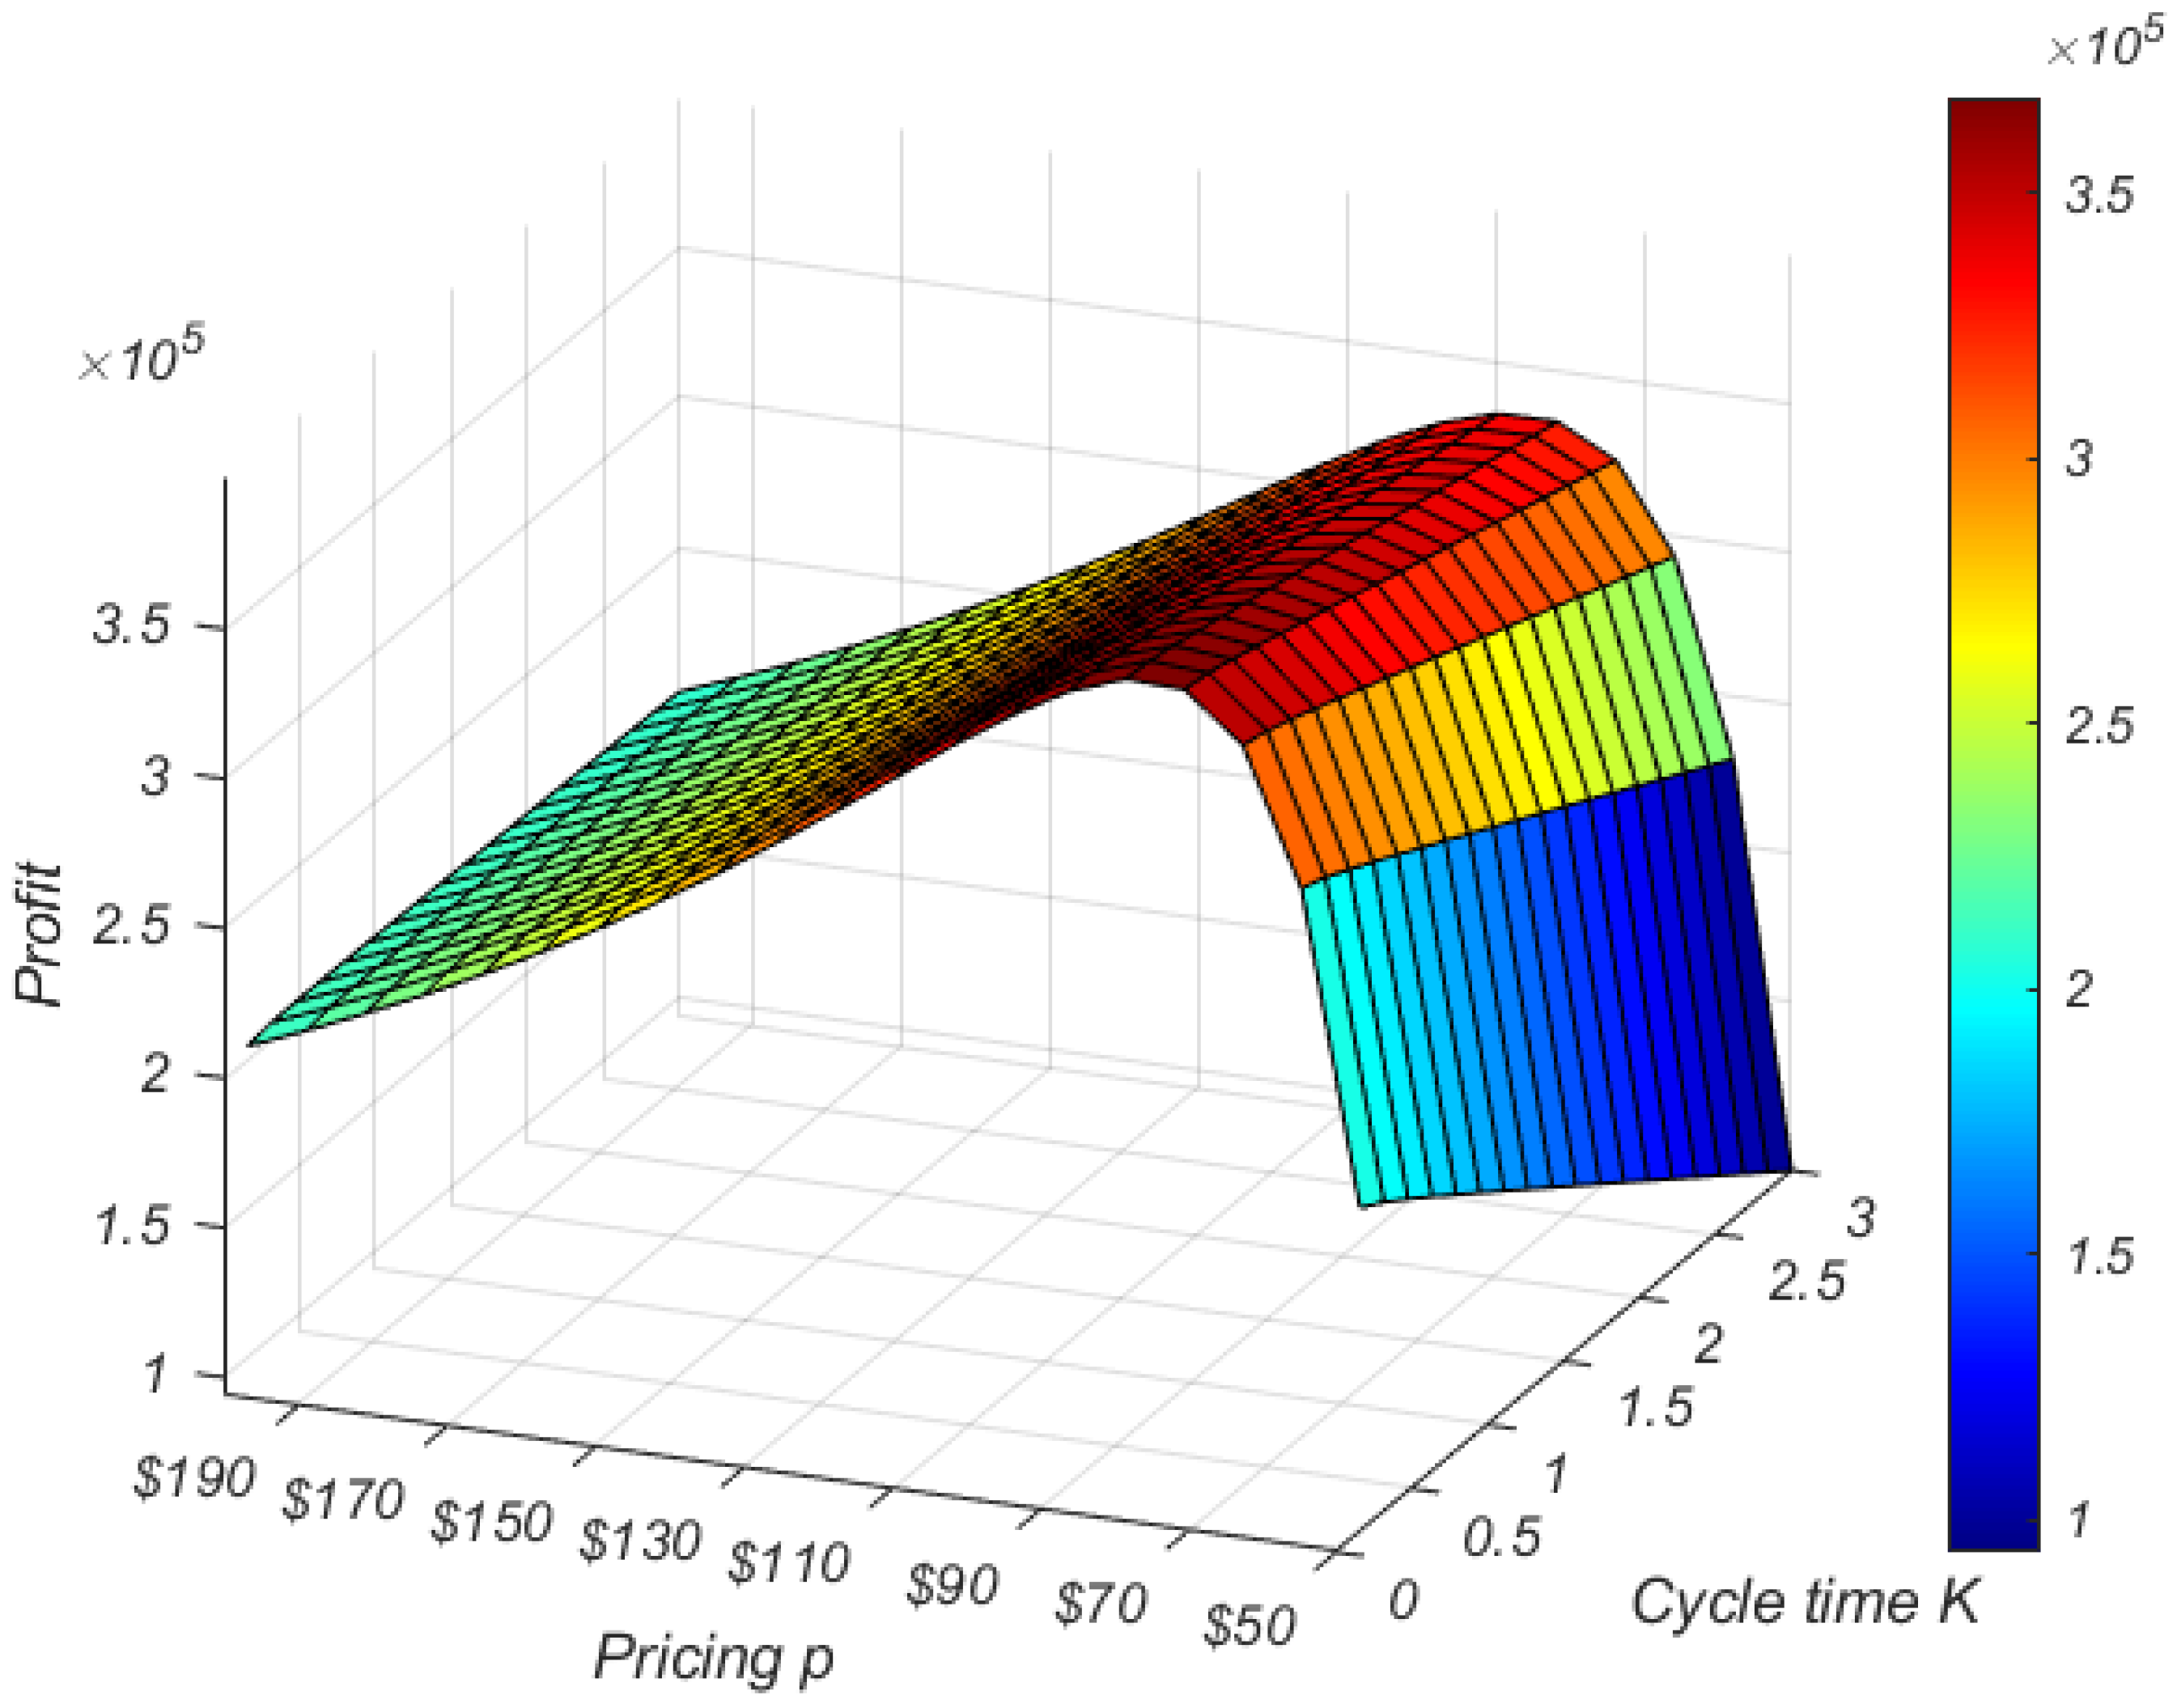
Figure 7.
Sensitivity analysis in total profit for all parameters except β.
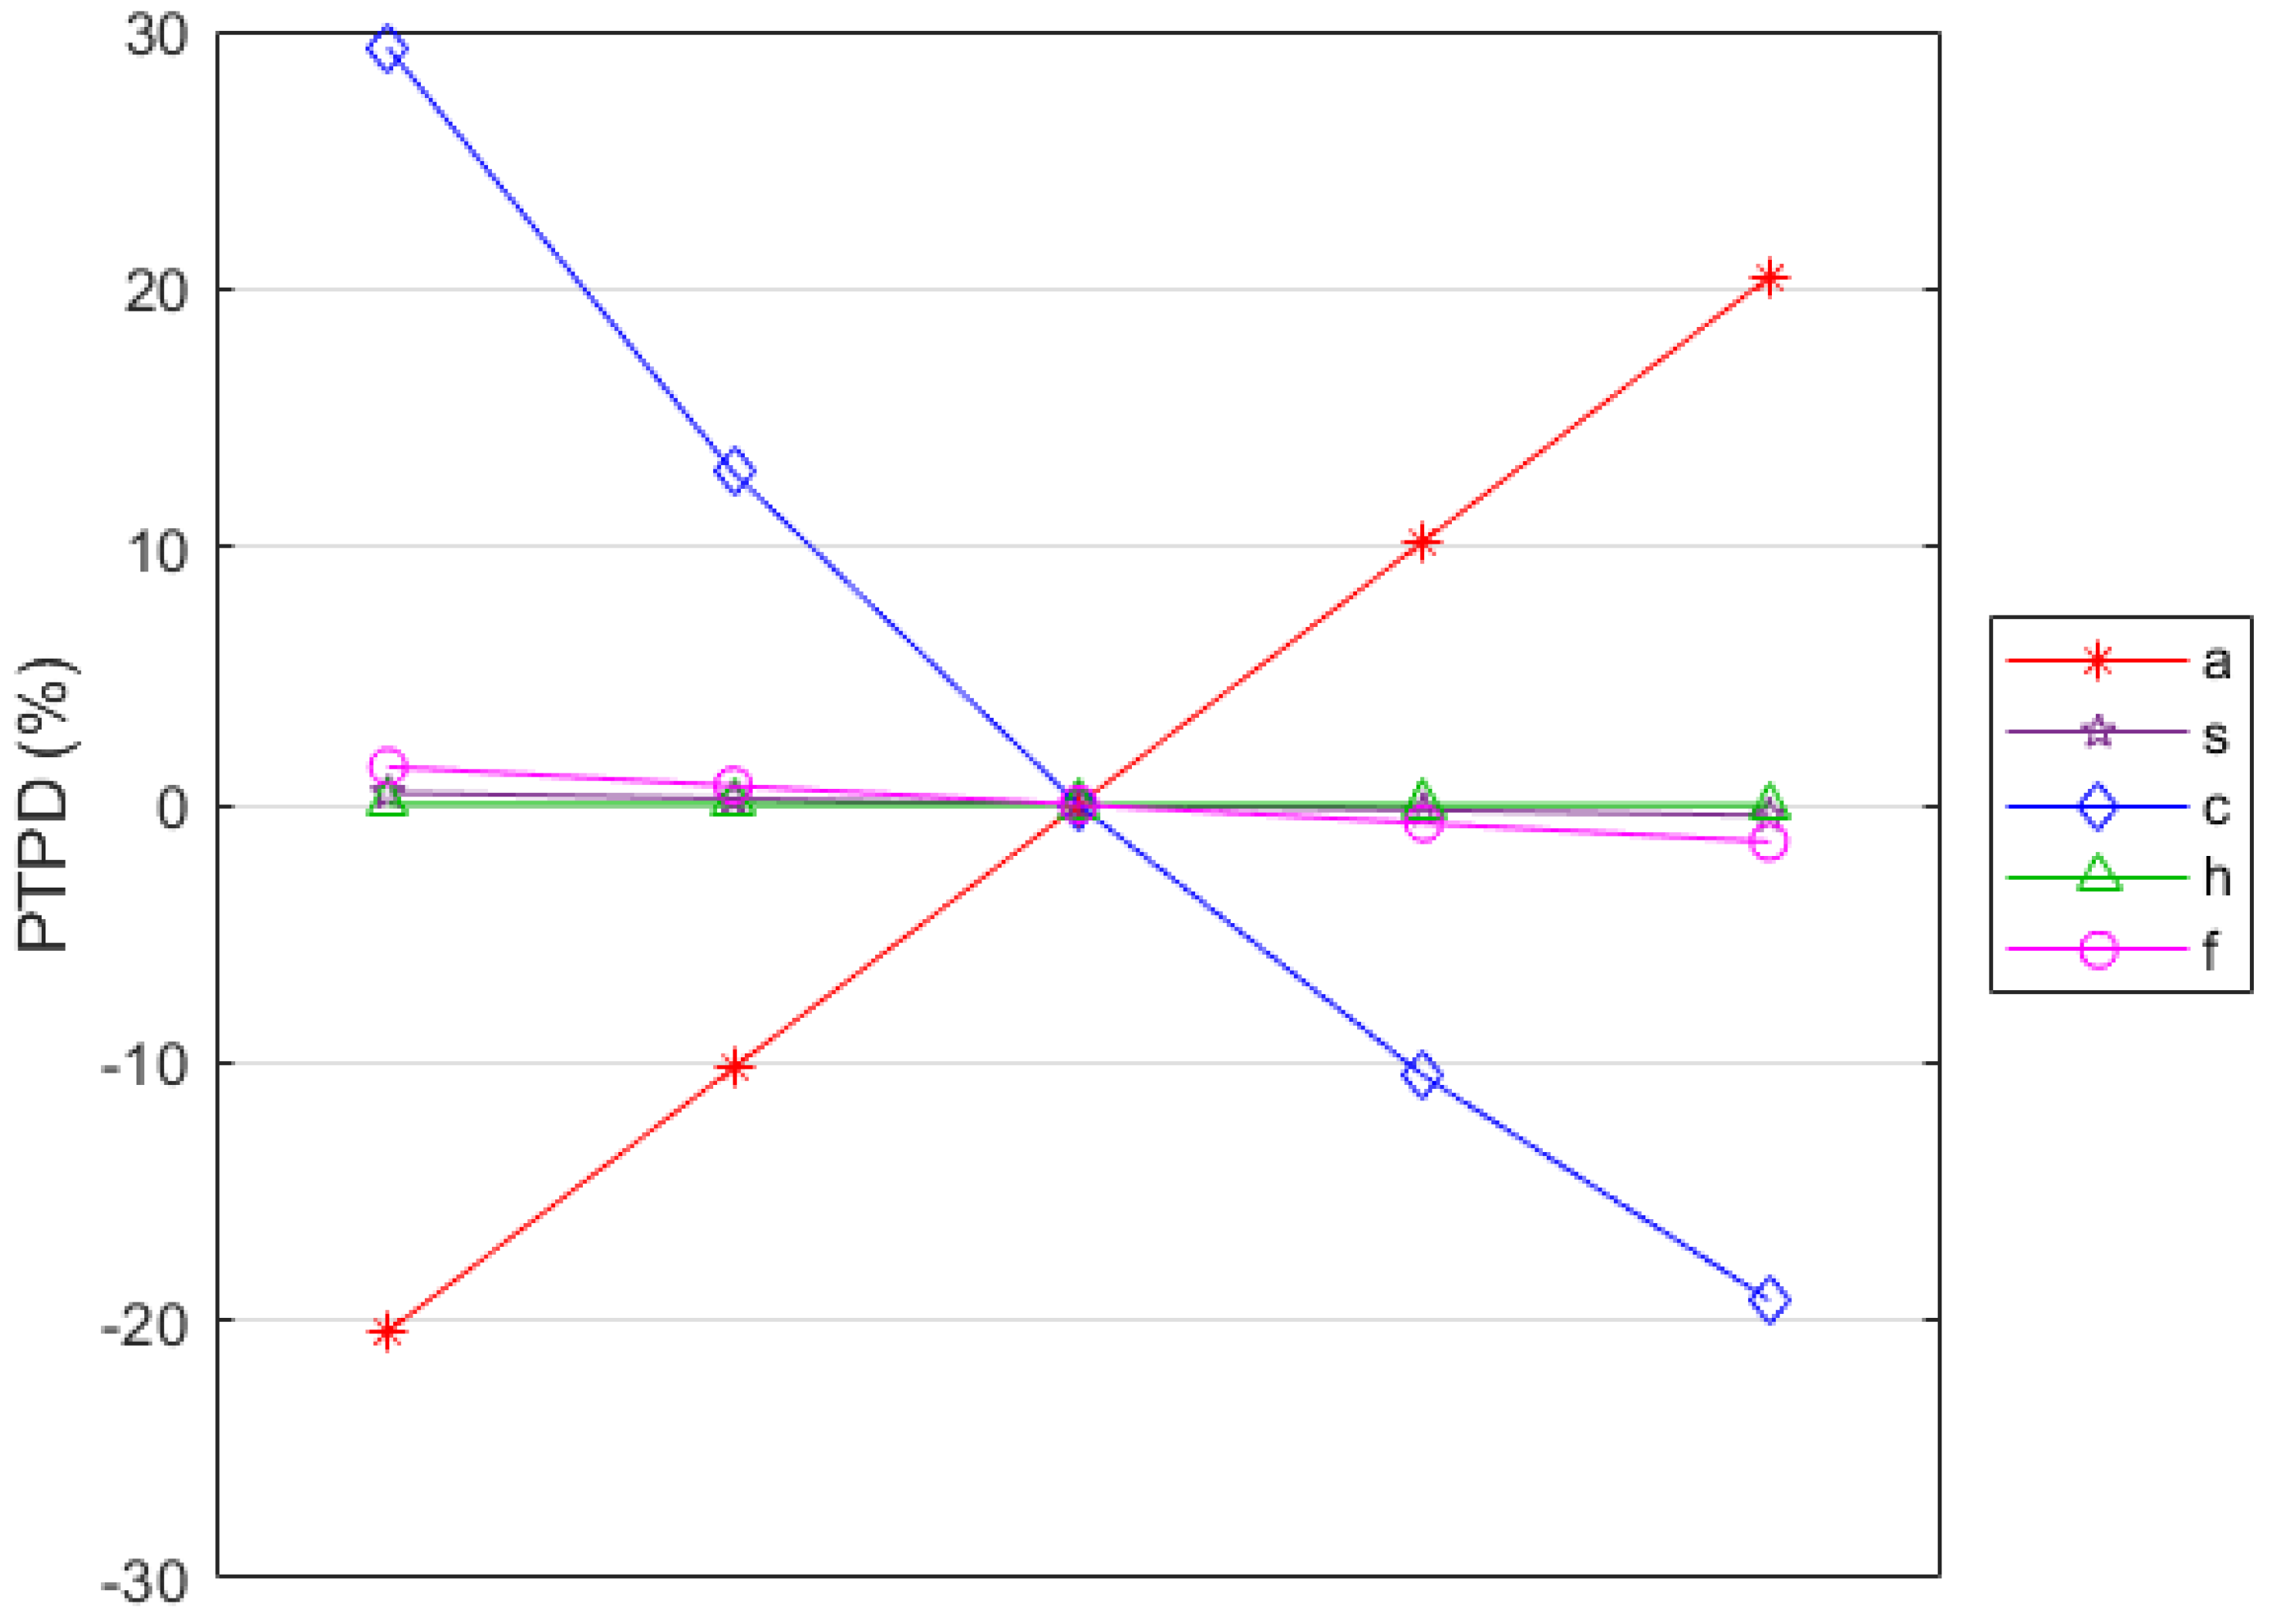
Figure 8.
Sensitivity analysis of optimal selling price for all parameters.

Figure 9.
Sensitivity analysis of optimal cycle time for all parameters.


Table 1.
Notations.
| Notation | Description |
|---|---|
| Length of each cycle (decision variable) | |
| Selling price per unit item (decision variable) | |
| Ordering cost for the retailer per cycle | |
| Purchase cost for the retailer per unit item | |
| Inventory holding cost for the retailer per unit item | |
| Deterioration rate; equal to | |
| Storage temperature of products | |
| Demand rate, which is function of price and equals | |
| Scale parameter of demand curve () | |
| Shape parameter of demand curve () | |
| Transportation cost per unit | |
| Retailer’s total cost | |
| Retailer’s total profit |
Table 2.
Parameter settings.
| Parameters | Values |
|---|---|
| 450 | |
| 40 | |
| 1.5 | |
| 160,000,000 | |
| 2.21 | |
| 2.5 |
Table 3.
Optimal p, K, TC, and TP at the temperatures of 0 °C, 7 °C, 16 °C, and 25 °C.
| t | ||||||
|---|---|---|---|---|---|---|
| 0 °C | 0.03 | 0.0305 | 76.364 | 484,400 | 358,600 | 336.591 |
| 7 °C | 0.054 | 0.0303 | 76.343 | 484,940 | 358,340 | 334.875 |
| 16 °C | 0.115 | 0.0298 | 76.292 | 486,280 | 357,680 | 330.631 |
| 25 °C | 0.245 | 0.0289 | 76.186 | 489,060 | 356,320 | 322.151 |
Table 4.
Sensitivity analysis when α changes.
| 128,000,000 (−20%) | 144,000,000 (−10%) | 160,000,000 | 176,000,000 (+10%) | 192,000,000 (+20%) | |
| 76.218 | 76.297 | 76.364 | 76.422 | 76.472 | |
| 0.034 | 0.0321 | 0.0305 | 0.0291 | 0.0279 | |
| 390,580 | 437,530 | 484,400 | 531,180 | 577,900 | |
| 285,380 | 321,970 | 358,600 | 395,260 | 431,960 | |
| 301.7093 | 319.6358 | 336.5909 | 352.7161 | 368.1271 | |
| PTPD | −20.42% | −10.21% | – | 10.22% | 20.46% |
Table 5.
Sensitivity analysis when changes.
| 1.758 (−20%) | 1.989 (−10%) | 2.21 | 2.431 (+10%) | 2.6252 (+20%) | |
| 97.085 | 84.522 | 76.364 | 70.483 | 66.37 | |
| 0.0145 | 0.0209 | 0.0305 | 0.0446 | 0.0624 | |
| 2,117,700 | 1,021,700 | 484,400 | 229,080 | 119,510 | |
| 2,646,500 | 965,990 | 358,600 | 133,590 | 55,496 | |
| 709.492 | 491.2023 | 336.5909 | 229.8477 | 164.5818 | |
| PTPD | 638.01% | 169.38% | – | −62.75% | −84.52% |
Table 6.
Sensitivity analysis when S changes.
| 360 (−20%) | 405 (−10%) | 450 | 495 (+10%) | 540 (+20%) | |
| 76.495 | 76.427 | 76.364 | 76.304 | 76.246 | |
| 0.0273 | 0.0289 | 0.0305 | 0.0319 | 0.0333 | |
| 480,990 | 482,750 | 484,400 | 485,970 | 487,490 | |
| 360,260 | 359,410 | 358,600 | 357,830 | 357,090 | |
| 300.4722 | 319.02 | 336.5909 | 353.334 | 369.3633 | |
| PTPD | 0.46% | 0.23% | – | −0.21% | −0.42% |
Table 7.
Sensitivity analysis when changes.
| 32 (−20%) | 36 (−10%) | 40 | 44 (+10%) | 48 (+20%) | |
| 62.104 | 69.239 | 76.364 | 83.478 | 90.563 | |
| 0.0269 | 0.0287 | 0.0305 | 0.0322 | 0.0338 | |
| 618,720 | 543,920 | 484,400 | 436,010 | 395,940 | |
| 463,830 | 405,150 | 358,600 | 320,860 | 289,700 | |
| 468.4895 | 393.7079 | 336.5909 | 291.8674 | 256.0454 | |
| PTPD | 29.34% | 12.98% | – | −10.52% | −19.21% |
Table 8.
Sensitivity analysis when h changes.
| 1.2 (−20%) | 1.35 (−10%) | 1.5 | 1.65 (+10%) | 1.8 (+20%) | |
| 76.37 | 76.367 | 76.364 | 76.361 | 76.358 | |
| 0.0305 | 0.0305 | 0.0305 | 0.0304 | 0.0304 | |
| 484,240 | 484,320 | 484,400 | 484,480 | 484,550 | |
| 358,680 | 358,640 | 358,600 | 358,560 | 358,520 | |
| 337.1386 | 336.8644 | 336.5909 | 336.3182 | 336.0461 | |
| PTPD | 0.02% | 0.01% | – | −0.01% | −0.02% |
Table 9.
Sensitivity analysis when changes.
| 2 (−20%) | 2.25 (−10%) | 2.5 | 2.75 (+10%) | 3 (+20%) | |
| 75.474 | 75.919 | 76.364 | 76.809 | 77.254 | |
| 0.0303 | 0.0304 | 0.0305 | 0.0306 | 0.0307 | |
| 491,160 | 487,760 | 484,400 | 481,080 | 477,800 | |
| 363,880 | 361,220 | 358,600 | 356,010 | 353,450 | |
| 342.9671 | 339.7548 | 336.5909 | 333.4746 | 330.4049 | |
| PTPD | 1.47% | 0.73% | – | −0.72% | −1.44% |
Disclaimer/Publisher’s Note: The statements, opinions and data contained in all publications are solely those of the individual author(s) and contributor(s) and not of MDPI and/or the editor(s). MDPI and/or the editor(s) disclaim responsibility for any injury to people or property resulting from any ideas, methods, instructions or products referred to in the content. |
© 2024 by the authors. Licensee MDPI, Basel, Switzerland. This article is an open access article distributed under the terms and conditions of the Creative Commons Attribution (CC BY) license (https://creativecommons.org/licenses/by/4.0/).
Share and Cite
MDPI and ACS Style
Yang, M.-F.; Tsai, P.-F.; Tu, M.-R.; Yuan, Y.-F. An EOQ Model for Temperature-Sensitive Deteriorating Items in Cold Chain Operations. Mathematics 2024, 12, 775. https://doi.org/10.3390/math12050775
AMA Style
Yang M-F, Tsai P-F, Tu M-R, Yuan Y-F. An EOQ Model for Temperature-Sensitive Deteriorating Items in Cold Chain Operations. Mathematics. 2024; 12(5):775. https://doi.org/10.3390/math12050775
Chicago/Turabian StyleYang, Ming-Fang, Pei-Fang Tsai, Meng-Ru Tu, and Yu-Fang Yuan. 2024. "An EOQ Model for Temperature-Sensitive Deteriorating Items in Cold Chain Operations" Mathematics 12, no. 5: 775. https://doi.org/10.3390/math12050775
Note that from the first issue of 2016, this journal uses article numbers instead of page numbers. See further details here.