
Research on Location Selection Model of 5G Micro Base Station Based on Smart Street Lighting System


1
College of Electronics and Information Engineering, Tongji University, Shanghai 201804, China
2
Frontiers Science Center for Intelligent Autonomous Systems, Tongji University, Shanghai 201804, China
*
Authors to whom correspondence should be addressed.
Mathematics 2022, 10(15), 2627; https://doi.org/10.3390/math10152627
Submission received: 11 June 2022
/
Revised: 22 July 2022
/
Accepted: 24 July 2022
/
Published: 27 July 2022
(This article belongs to the Special Issue AI Algorithm Design and Application)
Abstract
:In order to promote the development and construction of smart cities, the massive equipment requirements of sensing terminals increased the pressure on urban site resource allocation. The light pole is suitable for carrying various urban functional equipment to form a smart street lighting system, which can provide rich site resources for the large-scale construction of urban functional facilities such as 5G micro base stations. However, the selection and combination of equipment mounted in the smart street lighting system only focus on the functional superposition at the physical level, without considering the relevance of each subsystem in practical application scenarios. Therefore, this study proposed a 5G micro base station location model based on a smart street lighting system. The correlation and cooperativity between 5G micro base stations and mounted devices were fully considered, and a universal system-level location selection index was developed to realize rational utilization of urban space site resources and intelligent linkage between subsystems. The results showed that the model is significantly effective for functional areas with different road network characteristics and provides practical, robust, effective, and accurate help for similar location selection problems.
Keywords:
smart street lighting system; 5G micro base station; location selection; multi-system fusionMSC:
68T201. Introduction
The 5G network is the fifth-generation technology standard for broadband cellular networks. It is meant to deliver higher multi-Gbps peak data speeds [1] and has the advantages of high data flow and transmission rate, as shown in Figure 1. Fifth-generation network with ultra-reliable and low-latency communication (URLLC) has markedly promoted the construction process of the urban Internet of Things [2,3]. It has opened new application cases such as automatic driving [4] and remote surgery [5]. On the other hand, the 5G network has the limitations of poor signal penetration and small coverage radius [6,7], and the deployment of 5G networks in most cities has not been completed yet. Therefore, it has become the trend of smart city construction and development to accelerate the large-scale deployment of 5G base stations and take overall consideration of the site requirements of 5G base stations [8,9]. The 5G micro base station has the characteristics of small size and simple layout, which can be combined with the macro base station to achieve urban dense network coverage and effectively solve the blind spots and weaknesses of 5G network signals [10]. The coverage of 5G micro base stations is only 100 m, 1/3 of that of macro base stations [11]. For high traffic density and peak rate communications, many 5G micro base stations are required to complete denser network coverage, intensifying the demand for urban site resources. As a homogeneous urban infrastructure, light poles have the characteristics of high density, large number, and wide distribution [12]. The average pole distance is 30 m, which can be used as the access point of 5G micro base station equipment and solve the location selection difficulties caused by the increase in the number of 5G micro base stations.
In addition, in the construction and operation of smart cities, collecting essential data on urban infrastructure through intelligent information sensing terminals with dense distribution and rich functions can promote intelligent decision-making and rapid response of the urban brain. However, the demand for massive equipment for sensing terminals increases the pressure on location resource allocation [13,14]. As an indispensable public carrier for urban lighting, light poles can also provide rich site resources for deploying dense sensor networks and infrastructure construction [15,16]. Therefore, building a smart street lighting system with a variety of sensor devices can alleviate the shortage of site resources and facilitate the development of intelligent cities [17,18]. In the blueprints of many cities, modular, standardized, and diversified smart street lighting systems have become a significant link to promote the intelligent interconnection of cities [19].
Currently, the device selection in the smart street lighting system is purely based on the function superposition of the physical level [20]. Infrastructures such as base stations, light poles, and cameras are all defined as independent system equipment without considering the practical application of each subsystem. To meet the needs for large-scale construction of 5G micro base stations in smart cities and to realize the synergistic effect between the equipment installed in smart street lighting, this study focused on the location selection of 5G micro base stations and proposed a location selection model of 5G micro base station based on smart street lighting system by sorting out the correlation between the subsystems. Based on the two objectives of rational utilization of site resources and synergistic effect of mounted equipment, a universal location selection index at the system level was formulated. A location selection objective function based on the principles of priority coverage demand, low economic cost, and high system integration was established to realize the intelligent linkage between the 5G micro base stations and mounted equipment and save equipment operation and maintenance costs. The results significantly improve the intelligence level and service efficiency of smart street lighting systems and can promote the development of smart city network construction with smart lighting as a node.
Our main contributions are as follows:
- We proposed a smart street lighting system equipped with various urban functions, which can provide a variety of supports for smart city big data applications through information perception and data interaction;
- A location selection model of a 5G micro base station based on a smart street lighting system was proposed to realize the intelligent interconnection between 5G micro base stations and mounted equipment. The location selection index measures the coordination degree between the equipment;
- Simulation experiments and comparative analysis of our method were carried out on multiple representative functional areas, and experimental results demonstrate the robustness and effectiveness of the proposed method.
2. Smart Street Lighting System
With the popularity of intelligent connectivity, light poles not only have lighting functions but also can connect to IoT sensors using existing electrical infrastructure and wireless technologies. It helps to create an ecosystem of intelligent city applications to help city operations and maintenance while building a robust network architecture to develop intelligent cities [21,22]. A light pole as a platform can carry urban functions such as transportation, security, energy, and wireless communication. Figure 2 shows the proposed light pole platform. In the case of meeting basic lighting needs, it relies on LED lights and intelligent control platforms and integrates various functional devices such as cameras, sensors, electronic displays, and USB charging piles. Through information sensing and data interaction technology, we built subsystem modules such as intelligent lighting, intelligent transportation, intelligent security, intelligent monitoring, and intelligent energy, an essential source of IoT information collection. It can provide a variety of support for smart city big data applications and improve the city and municipal services.
Smart street lighting system integrates various subsystem functional devices such as 5G micro base stations, security cameras, and traffic cameras. In particular, the 5G micro base station, as wireless communication subsystem equipment, is mounted in smart light poles to solve the pressure for large-scale construction demand on urban site resources. In addition, it can effectively deal with many problems such as significant investment and resource waste in the traditional base station construction model [23,24].
Due to the numerous and complex subsystems of smart light poles, selecting functional devices only from the perspective of function aggravates the confusion of light poles. On the premise of ensuring coverage requirements and construction economy in the location selection process of the 5G micro base station, the correlation between the 5G micro base station and the installed equipment was considered. For example, remote monitoring of micro base stations and ancillary equipment by the installed sensor devices such as cameras can reduce costs and increase efficiency in the daily operation and maintenance of base stations. It maximizes the synergy between functional devices to achieve intelligent interconnection, reducing deployment operation and maintenance costs and beautifying the city’s image.
3. The Purpose of the Investigations
3.1. Smart Street Lighting
Currently, the smart street lighting industry is in a phase of rapid development. The United States, Germany, and other places have implemented pilot projects and small-scale deployments to construct smart streetlights, with the main objectives of saving energy, enhancing urban security, sensing urban information, and meeting charging needs. Delft University of Technology (TU Delft) equipped ordinary LED streetlight poles on campus with motion sensors and wireless communication systems to transform them into smart streetlights [25]. In 2014, Ubitricity company completed the first retrofit of smart streetlights with charging posts and other equipment to meet charging needs [26]. In the same year, San Diego became the first US city to widely use GE’s networked LED lighting fixtures, deploying 4000 smart streetlights [27]. In 2017, the city of Patras used Flash-Net-based smart controllers and LED lighting systems to build smart street lights [28]. In addition, as of 2020, Los Angeles retrofitted about 200,000 smart streetlights, involving nearly 7200 km of roadways, with data collection and intelligent analysis through the installation of cameras and other sensing devices on light poles [29].
However, unlike the general street lighting control systems with mature system design standards, there are no standards to guide the siting planning and system construction of smart street lighting because it involves multiple fields such as transportation, energy, and security. This study was based on the 5G micro-base station location selection model for smart street lighting, which not only provides help for the siting of smart streetlights but also provides a theoretical basis and support for introducing related standards.
3.2. 5G Micro Base Station
From the perspective of supply requirements, 5G micro-base stations required significantly higher power supply capacity and stability than 4G. If some 5G micro-base stations were mounted on street light poles, the separate deployment of power supply systems could be reduced, as the street light system can provide an uninterrupted power supply. From the perspective of construction cost, the total cost of ownership (TCO) of 5G micro base stations mainly comes from the construction of base stations and ancillary equipment, site rental, operation, and maintenance costs. The micro base stations are mounted on smart streetlights through proper site selection, which can help save much cost and avoid waste of land resources caused by rebuilding new poles. From the perspective of construction speed, the small coverage radius of 5G micro base stations leads to an exponential increase in demand compared to 4G base stations. The separate establishment of new poles consumes a certain amount of time. Therefore, to accelerate the construction of 5G, street light resources can meet the basic needs of operators for 5G and shorten the construction cycle. From the perspective of system synergy, the application of 5G micro base stations in multiple scenarios can be realized through the synergy between different devices. For example, 5G micro base stations can provide high transmission rate road information for autonomous vehicle driving by cooperating with various road sensors carried by smart streetlights. The synergy effect between systems can be better utilized to reflect the intelligence of smart cities.
4. Location Selection Model of 5G Micro Base Station
In this section, to begin with, we introduced some basic assumptions and the location selection principle. Then we presented the details of the proposed location selection index and the location selection model.
4.1. Basic Assumption and Location Selection Principle
4.1.1. Basic Assumption
The location selection model takes the 5G micro base station as the target location selection device and aims to fully consider the coordination and integration between multiple devices to obtain the optimal number and location of the 5G micro base station, based on the following assumptions:
- There are road networks and light poles in the location selection area;
- All discrete points in the road network are optional points for the target device location;
- The coverage radius provided by the default operator can meet the capacity and service quality requirements within the coverage area.
4.1.2. Location Selection Principle
The deployment of 5G base stations meets the network service requirements of intelligent city construction, and the objective function was constructed according to the following location selection principles.
The priority principle of coverage requirement: The coverage requirement proposed by the operator is the minimum to ensure that the base station can provide standard services for users and is the most fundamental goal of building a base station, which serves as the priority of the location selection principle.
Principle of lowest economic cost: On the premise of meeting the coverage requirements, it is usually expected to build the least number of base stations, improve the utilization rate of base stations, and save construction and operation, as well as maintenance costs to the maximum extent.
Principle of highest coordination: Mounting as many devices as possible on the same light pole can reduce construction costs and land resource occupation. The high degree of coordination between the mounted devices benefits the synergy effect between subsystems and reduces the cost of equipment deployment operation and maintenance. The high degree of uniformity can reduce the production cost of smart street lighting system functional devices and beautify the city’s image. On the premise of meeting coverage requirements and economic costs, the degree of coordination is a crucial consideration for location selection.
4.2. Location Selection Model Construction
In order to realize the intelligent interconnection between the devices in smart light poles, this paper proposed a general location selection model from three aspects: coverage, economic cost, and collaborative ability; that is, on the premise of meeting the basic network coverage rate and economic cost requirements, the collaborative ability between the target device and each mounted device are fully considered. Firstly, the location selection index was proposed to measure the system coordination degree and then construct the 5G micro-base station site selection model based on the objective function. Noting that the location selection index and model can be solved for the problem with multiple types of target devices mounted on smart street lighting as input, this paper used 5G micro-base stations as an example for the location selection study.
4.2.1. Notations and Definitions
For clarity, we briefly introduced some terminologies used in our paper, as shown in Table 1.
4.2.2. Location Selection Index
In order to meet the optimal location selection principle, three location selection indexes, including the combined ratio, the coupling ratio, and the unification ratio, were proposed to measure the degree of cooperation between the equipment according to the correlation between the equipment mounted on the light poles in the actual project. The combined ratio is the basis for evaluating the location selection index, and only when the equipment is mounted on the same light pole can the coupling and unification ability analysis be carried out.
- (1)
- Combined ratio
In the site selection, to meet the basic coverage requirements of the target equipment, such as the strict coverage regulations of operators for 5G micro base stations, some of the devices may not be able to be carried on street light poles, and new poles need to be built separately. From the perspective of system integration, it is hoped that more and more street light poles can carry target equipment, which can save costs, reduce the number of individually built poles, and contribute to improving the city’s image. Therefore, the combined ratio index is proposed to measure the integration degree of the mounted equipment at the physical level. The “combined” is defined as the equipment that can be installed on the street light pole without the need to build a new pole, provided that the primary site selection requirements are met. The calculation formula is as follows:
where is the number of target devices that can be combined; is the number of target devices.
- (2)
- Coupling ratio
Based on equipment combination, the coupling relationship between target and installed equipment is considered to achieve the synergistic effect among subsystems. The coupling relationship is defined as whether two devices mounted on the same light pole can generate higher-value capabilities than when the devices work independently, thus improving service efficiency and reducing service costs. For example, 5G micro base stations and various sensors are coupled devices, and the former can meet the high transmission rate demand of sensors for communication well. Traffic cameras can determine the high-risk behaviors of vehicles and display them on the LED display to provide warnings for following vehicles. The light pole carrying the device with a coupling relationship with the target device was defined as the coupling pole, and its proportion in the light pole was a signification factor in measuring the coupling capability. The coupling rate depends on whether the coupling effect can be generated between the mounted devices and is calculated as follows:
where is the number of light poles carrying the target equipment, the number of which is the same as . is the maximum number of light poles with coupling equipment, in theory, that is, among all the light poles in the site selection area, the number of light poles carrying the equipment with the coupling relationship with the target equipment. and are the number of coupling devices of ith and jth light poles, respectively.
- (3)
- Unification ratio
Due to the different infrastructure attributes installed in the smart street lighting system, such as coverage radius and interface specifications, from the perspective of the top-level design, the different equipment installed in the actual project increases production costs and affects the aesthetics of the city. Therefore, the unification ratio of equipment is also an essential factor in location selection. The unification ratio describes the consistency of the type and quantity of equipment carried by each street light pole in the actual project. It is measured by the standard deviation of the number of different equipment types carried by each pole, and the smaller the standard deviation, the higher the degree of uniformity. The unification ratio is defined as the ratio of the degree of equipment unity before and after the pole location selection. The calculation formula is as follows:
where and are the number of equipment types before and after the location selection, respectively, and are the numbers of the fth and kth equipment types before and after the location selection, respectively, and are the average values of different equipment types before and after location selection. and are the collections of smart light pole terminals before and after location selection.
4.2.3. Objective Function
The objective function of location selection is constructed from the three aspects of coverage, economic cost, and coordination, which are used for iterative optimization of the model to obtain the optimal location selection scheme. In practical, apart from the combined ratio, coupling ratio, and unification ratio of location selection indexes to measure the coordinate equipment capacity, the coverage area of light poles has a significate impact on location selection difficulty. The site selection becomes more complex as the coverage area decreases. The coefficient of location selection difficulty is defined as the ratio of the area covered by the site to the area covered by light poles, as shown in Equation (4). Based on the location selection index of system fusion degree and the coefficient of difficulty, the objective function of the location selection model was constructed. The coefficient of difficulty is as follows:
where represents the area of the location selection, represents the coverage area of the light pole. In this study, the coverage radius of the light pole is the same as that of the target device—the 5G micro base station.
Combining capacity : The difference in road network density in the functional area leads to the difference in light pole density, which affects the difficulty of location selection. The higher the density of the light pole per unit area, the lower the difficulty coefficient and the requirement for the combining capacity. That is, the difficulty coefficient is positively correlated with the combining capacity. The formula for calculating combining capacity is as follows:
Coupling capacity : Not all light poles are equipped with coupling equipment in practical engineering. The higher the proportion of coupling poles in all light poles, the easier the coupling operation and the required coupling capacity is relatively reduced. The proportion of coupling poles is negatively correlated with coupling capacity. In addition, the uniformity of coupling poles distribution is, the easier the location selection is. That is, the uniformity of coupling poles is negatively correlated with coupling capacity. The uniformity of coupling poles is the ratio of the distances of all the coupling poles and the distance of the coupling poles when they are evenly distributed. The calculation formula of coupling capacity is as follows:
where , Q represents the set of coupling poles in the location selection area, represents the total number of light poles, represents the total distance when the coupling poles are evenly distributed, and is the distance between the pth and qth coupling poles.
Unification capability : The denser the light poles in the location selection area, the easier the system is to be unified; that is, the density of light poles is positively correlated with unification capability. The formula for the unity capability is as follows:
The finally obtained subsystem coordination capability F is composed of combining capability, coupling capability, unification capability, and location selection difficulty, which can be used as the objective function of the location selection model to measure the coordination capability objectively. The subsystem coordination capability F is shown as follows:
where a, b, and c represent the weights of the combining capability, the coupling capability, and the unification capability, respectively, and the weights are obtained based on the actual objective location selection cost, as shown below:
where , , and are the costs reduced by a 1% improvement of the combining capacity, coupling capacity, and unification capacity, respectively. In addition, the objective index of the subsystem coordination degree is constructed to measure the degree of coordination of the system without considering the difficulty of site selection caused by the distribution of light poles, as shown below:
4.2.4. Model Solution
The model’s input is the map information of the location selection area (light pole coordinates and mounted equipment), the coverage radius, and coverage constraints of the 5G micro base station. Then based on the objective function, a discrete binary particle swarm optimization algorithm is constructed to output the 5G micro-base station location selection scheme with the optimal number N and location . Furthermore, evaluate the performance of the location selection scheme through the analysis of different location selection indexes.
In order to reduce the complexity of large-scale location selection and the impact of regional differences on the location selection scheme, the map is firstly pre-processed in blocks, as shown in Figure 3. The black box area in Figure 3 represents the selected area, which is a closed area surrounded by adjacent intersections. The location selection scheme is based on the area’s candidate points. The red box represents the affected area, which is the closed area that expands the coverage radius of a base station outward from the area to be selected. The coverage rate γ is defined as the percentage of the coverage area of 5G micro-base stations in the target area and is calculated based on the base stations established in the area.
In the iterative process of the binary particle swarm optimization algorithm, the particle near the optimal position is prone to mutation, which is not conducive to later convergence. Changing the particle update method can effectively alleviate the mutation rate [30]. In this study, the particle position update formula and the absolute probability of position change are shown in Equations (11) and (12).
where represents the particle flight speed. In addition, the selection, crossover, and mutation genetic operators are used to generate a new generation of particle swarms. A discrete binary particle swarm optimization algorithm was constructed to solve the location model. The particles in the population were sorted according to the fitness value. Then all the particles were divided into elite individuals (top 50%) and ordinary individuals (bottom 50%), with each individual representing a particle. The new generation of populations was all generated by elite individuals, half of which was generated by elite individuals through the speed and position update of the particle swarm algorithm. The new individuals generated are regarded as enhanced elites. The other half are enhanced elites as parent nodes, through selection, crossover, and mutation operations are generated. The specific generation method is as follows:
- Selection: randomly select four individuals from the enhanced elite for fitness value comparison, and the top two with the highest fitness value are selected as the parent nodes;
- Crossover: preset crossover probability , randomly select a crossover point among all binary bits and generate two new individuals by single-point crossover. Before each crossover, a random number is generated in [0, 1]. If < , then perform the crossover operation;
- Mutation: preset mutation probability , randomly select a mutation bit, generate a new individual utilizing basic bit mutation and a random number in [0, 1] before each mutation, and perform mutation operation if < ;
- The overall process of location selection is shown in Algorithm 1.
| Algorithm 1 The location selection model algorithm (Overall location selection process). |
| Input: Map information, the coverage radius r, and coverage requirement γ. Output: The optimal number N and location corresponding to the global extreme value. |
| Start: Step1: Partition processing; Step2: Calculate the constraints on the number of base stations; Step3: Initialize population position and velocity ; Step4: Iterative optimization: Calculate the fitness of each particle through objective function ; Update individual extremum and global extremum; Screening for elite individuals; Generate a new generation: Update particle flight speed through update formula ; Selection, crossover, mutation; Determine whether the conditions are met. |
5. Simulation and Analysis
Three representative functional areas in intelligent city construction were selected from Shanghai, China: commercial, residential, and industrial. The density of light poles varied from high to low with different road network information, which can cover most functional areas in urban construction. Moreover, there were many light poles in the commercial area, which is difficult for location selection. Due to different functional equipment requirements, the residential and industrial areas were also challenged to achieve synergistic location selection. Three representative functional areas were modeled in simulation experiments based on different coverage requirements to verify the feasibility and robustness of the location selection model. Therefore, on the premise of meeting the basic coverage rate, the difficulty of location selection and the degree of coordination of different location selection schemes can be obtained to provide detailed criteria for the practical project.
The distribution information of light poles in the three functional areas is shown in Table 2. Each coupling pole was defined to contain a coupling device. The selection cases were all from Google Maps, and the basic data of road network information were obtained through online measurement.
First, the three functional areas were numbered. Since the site location was based on the discrete points of the streetlights, carrying the 5G micro-base station only on the light poles may not meet the basic coverage requirement. We added an alternative point for a single independent pole of the 5G micro-base station between every two light poles. Light poles in the functional area were equipped with security surveillance cameras, traffic cameras, USB charging piles, and first-aid equipment at the corresponding positions according to the actual engineering needs. They were the representative equipment in smart security, smart transportation, smart energy, and smart management subsystems. Light poles are the basic equipment of the smart street lighting system. Security surveillance and traffic cameras can be coupled with 5G micro base stations to achieve lossless transmission of monitoring information and operation and maintenance of 5G micro base station equipment. The USB charging pile and first-aid equipment are fixed and have no coupling effect with the 5G micro base station.
5.1. Simulation Experiment
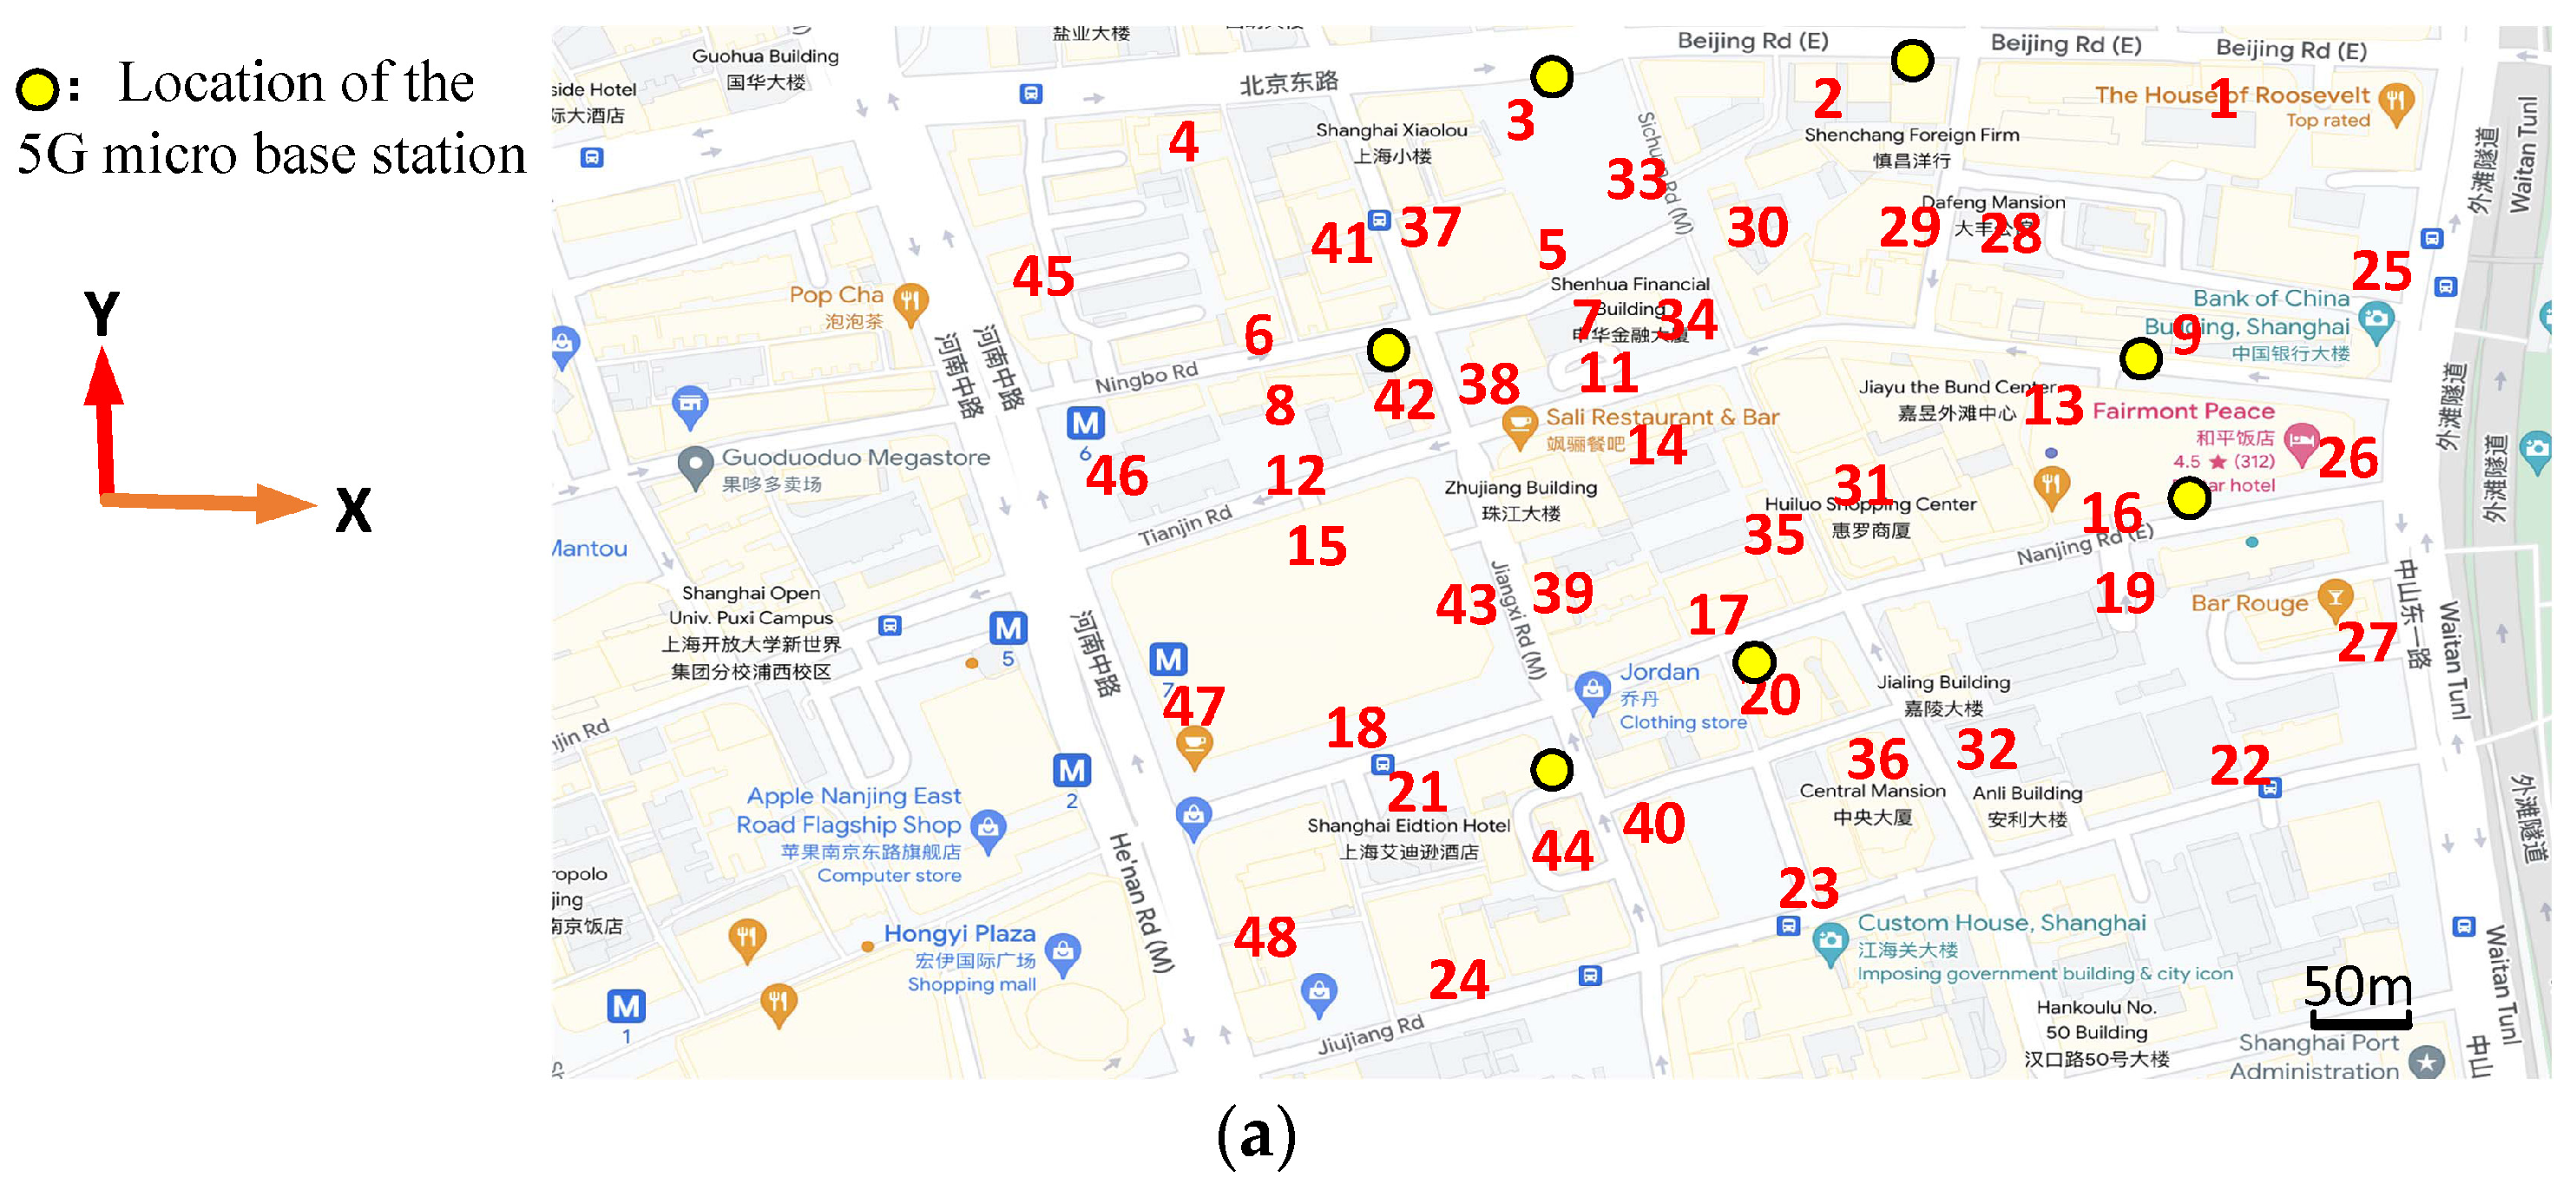
Our method was implemented using the MATLAB toolbox on a GeForce RTX 3090 Ti. According to previous regulations, the base station construction coverage rate should not be less than 90% [31,32]. In the process of model solving, the coverage radius of the 5G micro base station is defined as r = 150 m, and the coverage requirement is defined as γ = 90%. The final visualization result of location selection is shown in Figure 4, where the red serial number represents the road section number. The average distance of light poles is 25–30 m for each road section, and the yellow point represents the location of the 5G micro base station.
The analysis of the location selection results of the three functional areas is shown in Table 3. The results are above 90% and meet the basic coverage requirements. The minimum number of 5G micro base stations in the commercial area with the smallest area can be built to meet the basic coverage requirements. With the increase in location selection area, the number of base station construction also increases under the same coverage requirements. In addition, under the coverage requirement of 90%, the combined ratio of the three functional areas has reached 100%, indicating that there is no need to build a single independent pole for the 5G micro base station, reducing the engineering cost.
The difficulty coefficient of location selection affects the system coordination degree of location selection results. The commercial area has a high density of light poles, excellent infrastructure, and the lowest difficulty in location selection. The 5G micro base station is easy to produce coupling effect with the carrying equipment and achieves a 100% coupling ratio and 97.51% of the highest subsystem coordination degree. However, due to the variety of equipment mounted on the light pole, the unification ratio drops to 70.43%, which reduces the aesthetics of the city and increases the production cost of equipment. In residential areas, the density of light poles is lower than that of commercial areas, so the location selection is more complex, resulting in a lower degree of subsystem coordination. In the industrial area, it has the characteristics of a wide area and few light poles, which increases the difficulty of location selection. Due to the insufficient infrastructure carried by light poles, the ratio of coupling poles decreases, which is not conducive to reducing the synergistic effect between subsystems. The final optimal location selection scheme only achieves a 62.5% coupling rate and 82% subsystem coordination degree. In conclusion, the subsystem coordination degree of the three functional areas is greater than 80%, indicating that the location selection model of this study considers the construction cost and relevance of location selection schemes. On the premise of meeting the coverage requirements, the synergistic effect between smart light pole subsystems can be played, thereby reducing construction costs, improving service efficiency, and providing an effective location selection scheme for the intelligent construction of smart light poles in smart cities.
5.2. Comparative Analysis
A comparative analysis was performed to further verify the robustness of the location selection model and the impact of coverage constraints on the location selection results to meet the needs of base station coverage in different areas. On the premise of the coverage radius r = 150 m, location selection of three functional areas was solved based on the constraint conditions that coverage requirement is 90%, 95%, and 99%, respectively. The results are shown in Table 4, Table 5 and Table 6.
To meet the basic coverage requirement, the number of 5G micro base stations constructed increases with the increase in coverage. Except for commercial areas with complete infrastructure, the combined ratio of residential and industrial areas decreased with the increase in coverage rate. It indicates that with the increase in the coverage rate, the number of base stations requiring a single independent pole increased, which increases the cost of base station construction.
The commercial area has complete facilities and a high density of light poles, and the location selection results can achieve a high degree of subsystem coordination, greater than 89%. Therefore, the construction of the 5G micro base stations can prioritize high coverage requirements (99%). Under the premise of operating a 5G network demand, the cooperative effect between devices can be fully utilized to improve service efficiency and cost savings.
The density of light poles and the degree of infrastructure construction in residential areas are slightly lower than in commercial areas. When the basic coverage requirement reaches 99%, the combined ratio is reduced from 100% to 94.44%, requiring a single independent pole to increase the cost of 5G micro base stations. In addition, the coupling ratio (88.24%) and the degree of subsystem coordination (88.19%) decreased, and the intelligent linkage between devices was not fully realized. In order to reduce the construction and operation as well as maintenance costs of 5G micro base stations, full play is given to the synergistic effect between subsystems and beautify the city image; the location selection result is optimal when the coverage requirement is 95%. On the premise of no single independent pole, the demand for a 5G network of residential users achieves a high degree of system coordination (93.44%).
The infrastructure construction of the industrial area is relatively backward. The area has a large area and few light poles, which makes location selection difficult. As the demand for network coverage increases, the number of single independent poles increases, and the coordination degree of carrying equipment is also reduced, which leads to an increase in base station construction cost and resource utilization cost. When the basic coverage requirement is 90%, the combined ratio is 100%, and the coupling ratio and subsystem coordination are the highest. Considering the construction cost of the industrial area and the base station coverage requirement comprehensively, the network coverage requirement of 90% is the optimal 5G micro-base station location selection scheme.
6. Conclusions
Given the large-scale demand for 5G micro-base stations and equipment siting problems in intelligent city construction, this study proposes a 5G micro-base station siting model based on a smart streetlight system from the perspective of rational utilization of urban site resources. The model fully considers the correlation between the installed equipment and formulates the general location selection index at the system level to solve the complex problem of location selection caused by the increase in the number of base stations and the confusion of equipment installation, thus saving the construction and operation costs and improving the intellectual level of smart city construction. In the future, in addition to 5G micro base stations, the smart street lighting system will continue to explore cross-field in-depth cooperation to carry more intelligent terminal devices to adapt to richer application scenarios and provide more intelligent application services. Research can provide reasonable, robust, effective, and precise assistance for smart street lighting devices and similar location selection problems.
Author Contributions
Data curation, W.L. and Q.L.; Investigation, H.C.; Writing—original draft, H.L.; Writing—review & editing, X.L. and H.X. All authors have equally contributed to this work. All authors have read and agreed to the published version of the manuscript.
Funding
This work was supported by the Shanghai Science and Technology Planning Project (20DZ2205900), Shanghai Municipal Commission of Science and Technology Project (19511132101). Shanghai Municipal Science and Technology Major Project (2021SHZDZX0100), and the Fundamental Research Funds for the Central Universities.
Institutional Review Board Statement
Not applicable.
Informed Consent Statement
Not applicable.
Data Availability Statement
Not applicable.
Conflicts of Interest
The authors declare no conflict of interest.
References
- Garcia, M.H.C.; Molina-Galan, A.; Boban, M.; Gozalvez, J.; Coll-Perales, B.; Sahin, T.; Kousaridas, A. A Tutorial on 5G NR V2X Communications. IEEE Commun. Surv. Tutor. 2021, 23, 1972–2026. [Google Scholar] [CrossRef]
- Chettri, L.; Bera, R. A Comprehensive Survey on Internet of Things (IoT) Toward 5G Wireless Systems. IEEE Internet Things J. 2020, 7, 16–32. [Google Scholar] [CrossRef]
- Zhao, X.; Askari, H.; Chen, J. Nanogenerators for Smart Cities in the Era of 5G and Internet of Things. Joule 2021, 5, 1391–1431. [Google Scholar] [CrossRef]
- Liu, Z.; Zhang, W.; Yang, C.; Chi, J. Design and Test of Autopilot Support Network of Intelligent Vehicle Based on IDcode. In Advances in Guidance, Navigation and Control; Yan, L., Duan, H., Yu, X., Eds.; Lecture Notes in Electrical Engineering; Springer: Singapore, 2022; Volume 644, pp. 149–158. ISBN 9789811581540. [Google Scholar]
- Jain, J.; Jain, A.; Srivastava, S.K.; Verma, C.; Raboaca, M.S.; Illés, Z. Improved Security of E-Healthcare Images Using Hybridized Robust Zero-Watermarking and Hyper-Chaotic System along with RSA. Mathematics 2022, 10, 1071. [Google Scholar] [CrossRef]
- Almagrabi, A.O.; Ali, R.; Alghazzawi, D.; AlBarakati, A.; Khurshaid, T. A Poisson Process-Based Random Access Channel for 5G and Beyond Networks. Mathematics 2021, 9, 508. [Google Scholar] [CrossRef]
- Kamboh, U.R.; Ullah, U.; Khalid, S.; Raza, U.; Chakraborty, C.; Al-Turjman, F. Path Loss Modelling at 60 GHz MmWave Based on Cognitive 3D Ray Tracing Algorithm in 5G. Peer-to-Peer Netw. Appl. 2021, 14, 3181–3197. [Google Scholar] [CrossRef]
- Rao, S.K.; Prasad, R. Impact of 5G Technologies on Smart City Implementation. Wirel. Pers. Commun. 2018, 100, 161–176. [Google Scholar] [CrossRef]
- Gohar, A.; Nencioni, G. The Role of 5G Technologies in a Smart City: The Case for Intelligent Transportation System. Sustainability 2021, 13, 5188. [Google Scholar] [CrossRef]
- Wang, C.-H.; Lee, C.-J.; Wu, X. A Coverage-Based Location Approach and Performance Evaluation for the Deployment of 5G Base Stations. IEEE Access 2020, 8, 123320–123333. [Google Scholar] [CrossRef]
- Ni, Y.; Liang, J.; Shi, X.; Ban, D. Research on Key Technology in 5G Mobile Communication Network. In Proceedings of the 2019 International Conference on Intelligent Transportation, Big Data & Smart City (ICITBS), Changsha, China, 12–13 January 2019; pp. 199–201. [Google Scholar]
- Elejoste, P.; Angulo, I.; Perallos, A.; Chertudi, A.; Zuazola, I.; Moreno, A.; Azpilicueta, L.; Astrain, J.; Falcone, F.; Villadangos, J. An Easy to Deploy Street Light Control System Based on Wireless Communication and LED Technology. Sensors 2013, 13, 6492–6523. [Google Scholar] [CrossRef]
- Hanine, M.; Boutkhoum, O.; El Barakaz, F.; Lachgar, M.; Assad, N.; Rustam, F.; Ashraf, I. An Intuitionistic Fuzzy Approach for Smart City Development Evaluation for Developing Countries: Moroccan Context. Mathematics 2021, 9, 2668. [Google Scholar] [CrossRef]
- Angelidou, M. Smart City Policies: A Spatial Approach. Cities 2014, 41, S3–S11. [Google Scholar] [CrossRef]
- Feng, X.; Murray, A.T. Spatial Analytics for Enhancing Street Light Coverage of Public Spaces. LEUKOS 2018, 14, 13–23. [Google Scholar] [CrossRef]
- Du, F.; Huang, X.; Pan, A.; Qi, X.; Niu, Z. Development Trends and Construction Strategies of Smart City and the Ubiquitous Power Internet of Things with Smart Streetlight Pole as Carrier. CIRED-Open Access Proc. J. 2020, 2020, 679–682. [Google Scholar] [CrossRef]
- Müllner, R.; Riener, A. An Energy Efficient Pedestrian Aware Smart Street Lighting System. Int. J. Pervasive Comput. Commun. 2011, 7, 147–161. [Google Scholar] [CrossRef] [Green Version]
- Mahoor, M.; Salmasi, F.R.; Najafabadi, T.A. A Hierarchical Smart Street Lighting System With Brute-Force Energy Optimization. IEEE Sens. J. 2017, 17, 2871–2879. [Google Scholar] [CrossRef]
- Gagliardi, G.; Lupia, M.; Cario, G.; Tedesco, F.; Cicchello Gaccio, F.; Lo Scudo, F.; Casavola, A. Advanced Adaptive Street Lighting Systems for Smart Cities. Smart Cities 2020, 3, 1495–1512. [Google Scholar] [CrossRef]
- Arun Bhukya, K.; Ramasubbareddy, S.; Govinda, K.; Aditya Sai Srinivas, T. Adaptive Mechanism for Smart Street Lighting System. In Smart Intelligent Computing and Applications; Satapathy, S.C., Bhateja, V., Mohanty, J.R., Udgata, S.K., Eds.; Smart Innovation, Systems and Technologies; Springer: Singapore, 2020; Volume 160, pp. 69–76. ISBN 978-981-329-689-3. [Google Scholar]
- Jin, D.; Hannon, C.; Li, Z.; Cortes, P.; Ramaraju, S.; Burgess, P.; Buch, N.; Shahidehpour, M. Smart Street Lighting System: A Platform for Innovative Smart City Applications and a New Frontier for Cyber-Security. Electr. J. 2016, 29, 28–35. [Google Scholar] [CrossRef]
- Prasad, R. Energy Efficient Smart Street Lighting System in Nagpur Smart City Using IoT-A Case Study. In Proceedings of the 2020 Fifth International Conference on Fog and Mobile Edge Computing (FMEC), Paris, France, 20–23 April 2020; pp. 100–103. [Google Scholar]
- Ouamri, M.A.; Oteşteanu, M.-E.; Isar, A.; Azni, M. Coverage, Handoff and Cost Optimization for 5G Heterogeneous Network. Phys. Commun. 2020, 39, 101037. [Google Scholar] [CrossRef]
- Yu, P.; Li, W.; Zhou, F.; Feng, L.; Yin, M.; Guo, S.; Gao, Z.; Qiu, X. Capacity Enhancement for 5G Networks Using MmWave Aerial Base Stations: Self-Organizing Architecture and Approach. IEEE Wirel. Commun. 2018, 25, 58–64. [Google Scholar] [CrossRef]
- Pizzuti, S.; Annunziato, M.; Moretti, F. Smart Street Lighting Management. Energy Effic. 2013, 6, 607–616. [Google Scholar] [CrossRef]
- Yao, J.; Zhang, Y.; Yan, Z.; Li, L. A Group Approach of Smart Hybrid Poles with Renewable Energy, Street Lighting and EV Charging Based on DC Micro-Grid. Energies 2018, 11, 3445. [Google Scholar] [CrossRef] [Green Version]
- Brazil, R. Lighting the Smart City. Eng. Technol. 2016, 11, 34–37. [Google Scholar] [CrossRef]
- Skandali, C.; Lambiri, Y.S. Optimization Of Urban Street Lighting Conditions Focusing On Energy Saving, Safety And Users’ Needs. J. Contemp. Urban Aff. 2018, 2, 112–121. [Google Scholar] [CrossRef] [Green Version]
- Jia, R.; Wu, W. Case Study on Intelligent Road Lighting in Foreign Countries under the Background of Smart City. J. Humanit. Soc. Sci. Stud. 2022, 4, 235–245. [Google Scholar] [CrossRef]
- Li, A.-D.; Xue, B.; Zhang, M. Improved Binary Particle Swarm Optimization for Feature Selection with New Initialization and Search Space Reduction Strategies. Appl. Soft Comput. 2021, 106, 107302. [Google Scholar] [CrossRef]
- Fang, D.; Qian, Y.; Hu, R.Q. Security Requirement and Standards for 4G and 5G Wireless Systems. GetMobile Mobile Comp. Comm. 2018, 22, 15–20. [Google Scholar] [CrossRef]
- Kouchaki, M.R.; Dabibi, M. Experiment on High Capacity Backhaul Transmission Link Aggregation Solution for 5G Networks. In Proceedings of the 2020 26th Conference of Open Innovations Association (FRUCT), Yaroslavl, Russia, 23–25 April 2020; pp. 1–6. [Google Scholar]
Figure 1.
Features and Applications of 5G Networks.

Figure 2.
Smart street lighting system.

Figure 3.
Schematic Diagram of Partition Mode.
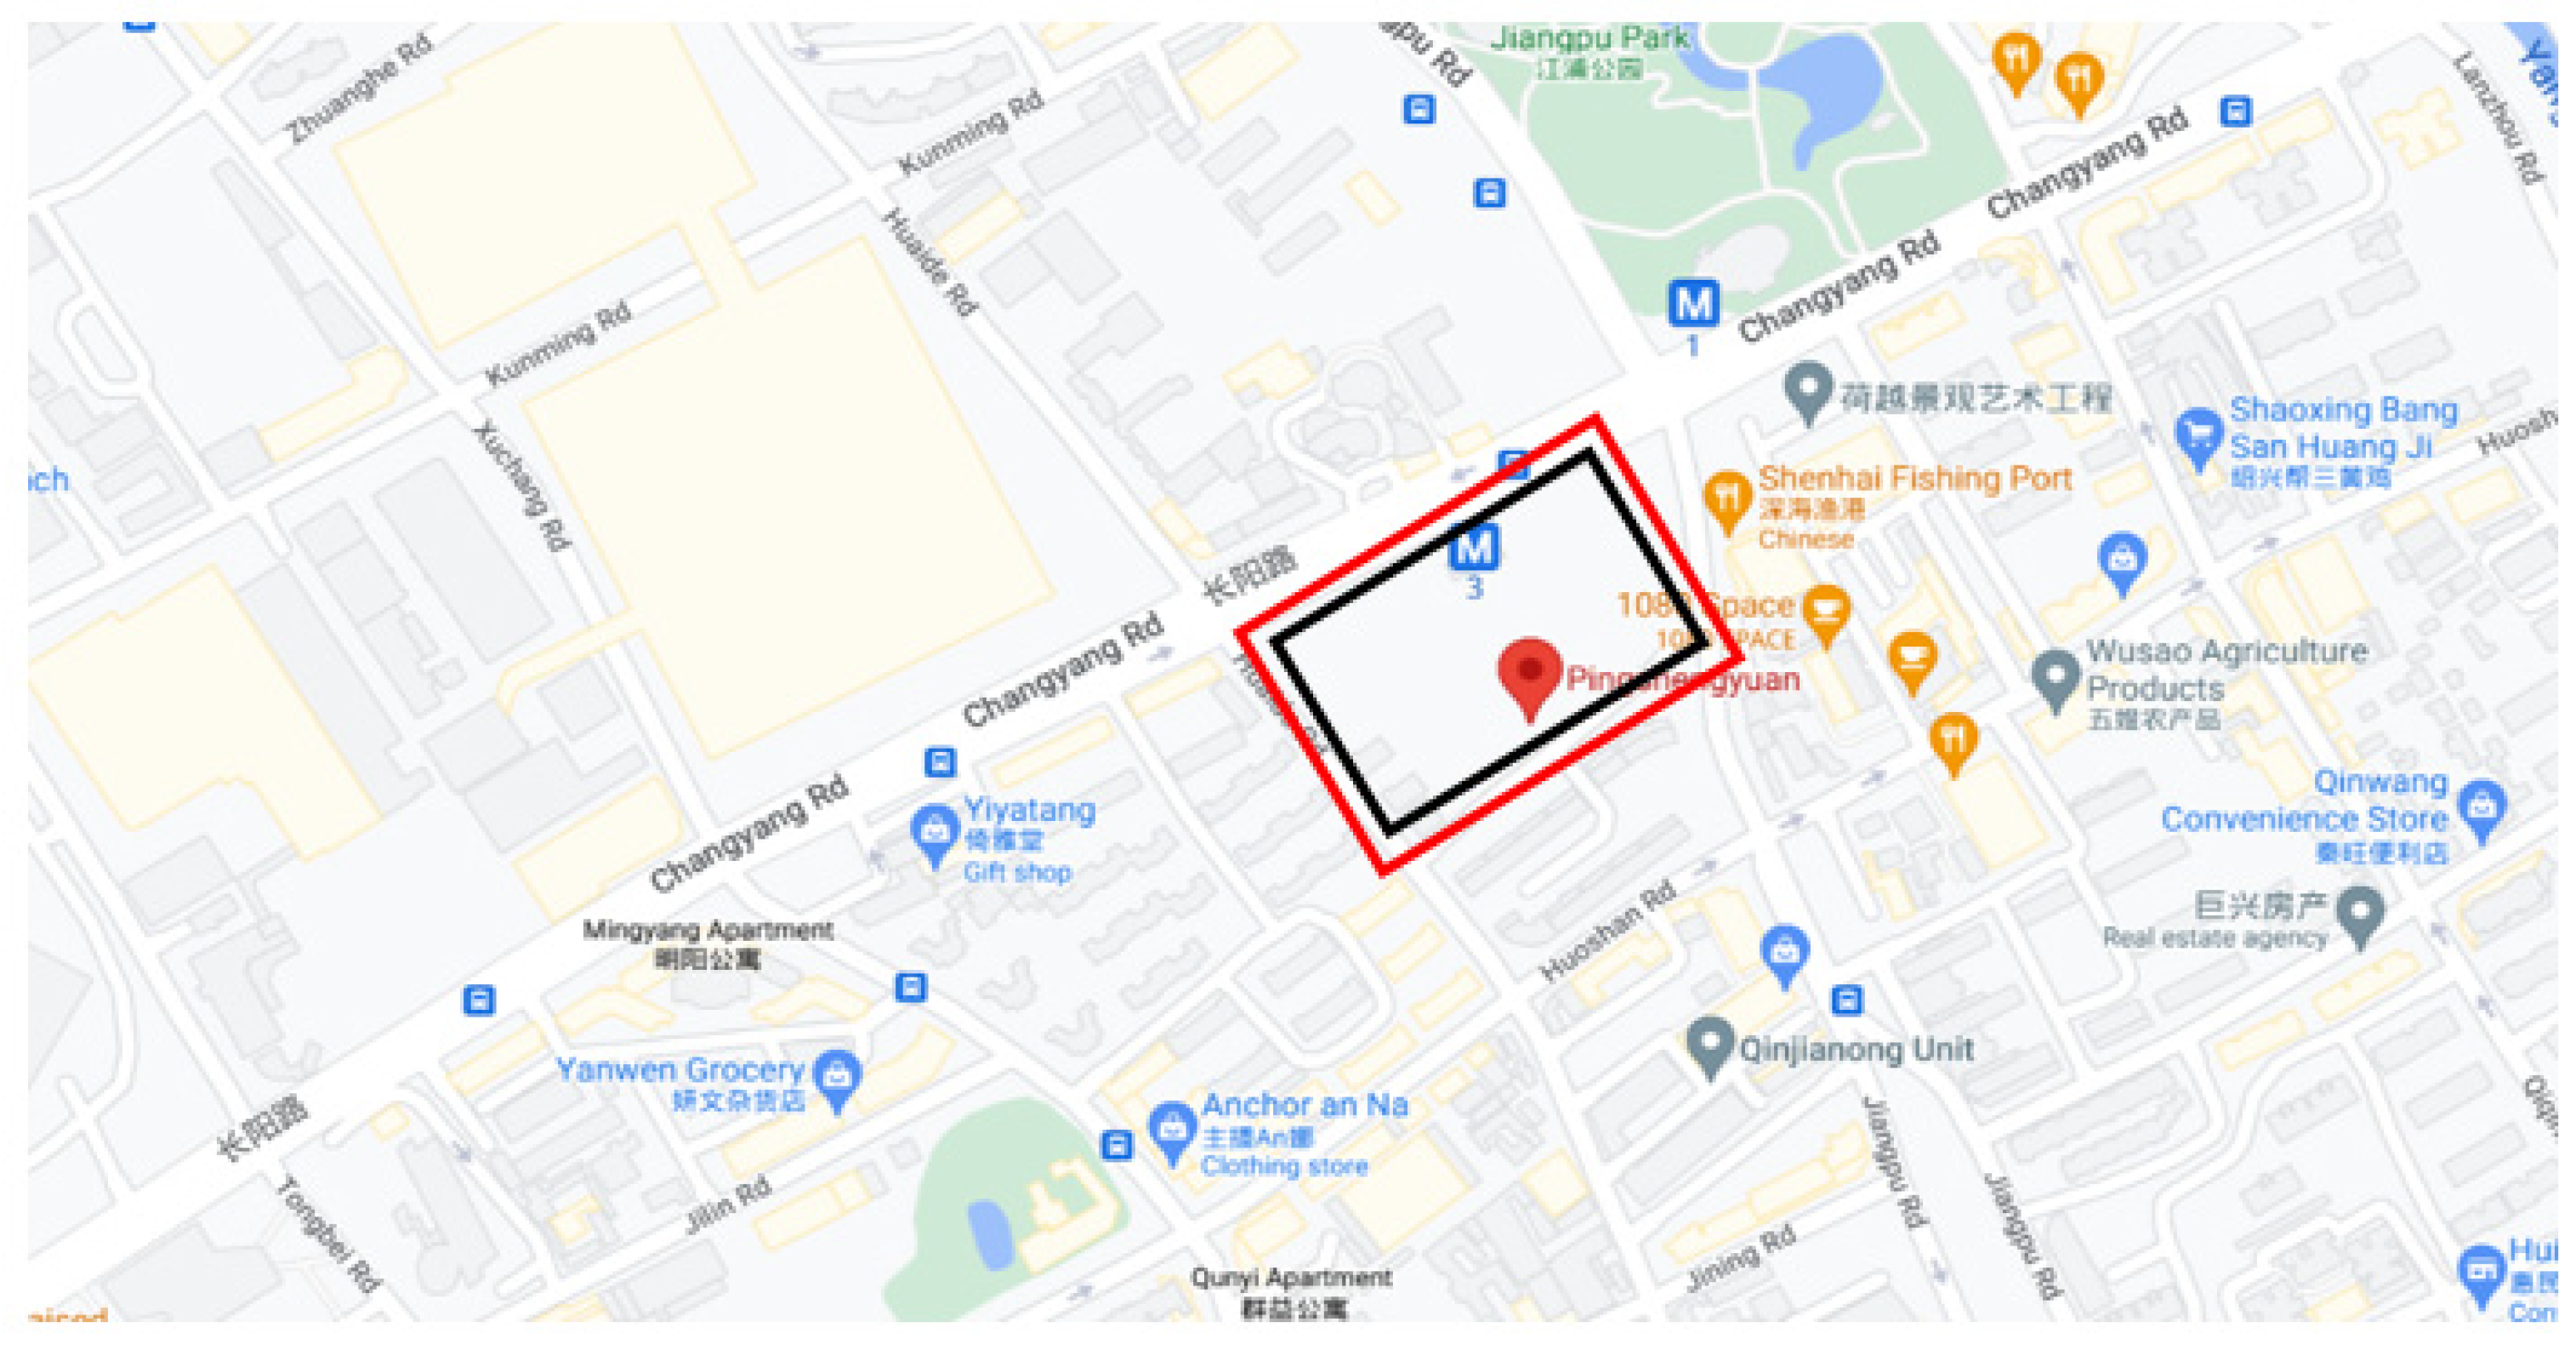
Figure 4.
Visualization of location selection results. (a) Commercial area location selection results. (b) Residential area location selection results. (c) Industrial area location selection results. Red numbers represent alternative points, and yellow dots represent site selection results.
Figure 4.
Visualization of location selection results. (a) Commercial area location selection results. (b) Residential area location selection results. (c) Industrial area location selection results. Red numbers represent alternative points, and yellow dots represent site selection results.


Table 1.
Frequently used notations throughout this paper.
| Notations | Descriptions |
|---|---|
| The combined ratio, the proportion of devices installed on light poles | |
| The coupling ratio, the percentage of coupling pole | |
| The unification ratio, the proportion of uniformity before and after site selection | |
| γ | The coverage rate, the percentage of area covered by target devices |
| The difficulty coefficient, the ratio of the target area to the light pole coverage area | |
| The combining capacity, measuring the combining capability | |
| The coupling capacity, measuring the coupling capability | |
| The unification capability, measuring the unification capability | |
| F | The subsystem coordination capability, measuring the coordination capability |
| The subsystem coordination degree, measuring the coordination degree |
Table 2.
Detailed details of three different functional areas.
| Region Name | Effective Area | Number | ||
|---|---|---|---|---|
| One-Sided Road Sections | Light Poles | Coupling Poles | ||
| Commercial area | 188,733 m2 | 48 | 200 | 41 |
| Residential area | 509,356 m2 | 64 | 392 | 97 |
| Industrial area | 681,662 m2 | 28 | 297 | 40 |
Table 3.
Location selection analysis results of different regions.
| Index | Commercial Area | Residential Area | Industrial Area |
|---|---|---|---|
| Difficulty coefficient Ø | 0.5912 | 0.6833 | 0.8103 |
| Coupling pole ratio | 20.50% | 24.74% | 13.47% |
| Coupling pole uniformity | 96.91% | 93.45% | 99.28% |
| 100% | 100% | 100% | |
| 100% | 100% | 62.50% | |
| 70.43% | 69.30% | 74.39% | |
| System coordination F′ | 97.51% | 96.24% | 82.00% |
| Select number | 7 | 14 | 16 |
| coverage rate | 94.88% | 93.37% | 94.36% |
Table 4.
Location selection results of the commercial area under different coverage constraints.
| Index | Coverage Requirement | ||
|---|---|---|---|
| 100% | 100% | 100% | |
| 100% | 87.50% | 81.82% | |
| 70.34% | 71.34% | 74.27% | |
| System coordination F′ | 97.51% | 95.29% | 89.54% |
| Select number | 7 | 8 | 11 |
| Coverage rate | 94.88% | 95.68% | 99.47% |
Table 5.
Location selection results of the residential area under different coverage constraints.
| Index | Coverage Requirement | ||
|---|---|---|---|
| 100% | 100% | 94.44% | |
| 100% | 93.75% | 88.24% | |
| 69.30% | 70.40% | 70.96% | |
| System coordination F′ | 96.24% | 93.44% | 88.19% |
| Select number | 14 | 16 | 18 |
| Coverage rate | 93.37% | 97.76% | 99.80% |
Table 6.
Location selection results of the industrial area under different coverage constraints.
| Index | Coverage Requirement | ||
|---|---|---|---|
| 100% | 83.33% | 75.00% | |
| 62.50% | 53.33% | 46.67% | |
| 74.39% | 75.37% | 76.38% | |
| System coordination F′ | 82.00% | 70.47% | 63.71% |
| Select number | 16 | 18 | 20 |
| Coverage rate | 94.4% | 95.34% | 99.85% |
Publisher’s Note: MDPI stays neutral with regard to jurisdictional claims in published maps and institutional affiliations. |
© 2022 by the authors. Licensee MDPI, Basel, Switzerland. This article is an open access article distributed under the terms and conditions of the Creative Commons Attribution (CC BY) license (https://creativecommons.org/licenses/by/4.0/).
Share and Cite
MDPI and ACS Style
Liu, H.; Li, W.; Cai, H.; Lin, Q.; Li, X.; Xiao, H. Research on Location Selection Model of 5G Micro Base Station Based on Smart Street Lighting System. Mathematics 2022, 10, 2627. https://doi.org/10.3390/math10152627
AMA Style
Liu H, Li W, Cai H, Lin Q, Li X, Xiao H. Research on Location Selection Model of 5G Micro Base Station Based on Smart Street Lighting System. Mathematics. 2022; 10(15):2627. https://doi.org/10.3390/math10152627
Chicago/Turabian StyleLiu, Hanwei, Wenchao Li, Huiling Cai, Qingcheng Lin, Xuefeng Li, and Hui Xiao. 2022. "Research on Location Selection Model of 5G Micro Base Station Based on Smart Street Lighting System" Mathematics 10, no. 15: 2627. https://doi.org/10.3390/math10152627
Note that from the first issue of 2016, this journal uses article numbers instead of page numbers. See further details here.