1. Introduction
There are large socio-economic gaps in university participation in England. Pupils who are eligible for Free School Meals (indicating they come from a low income household) are less than half as likely to go to university as other young people ([
1], Table 1). Only 17% of 18–19 year olds enter higher education in the bottom fifth of local areas ranked by the percentage of parents who are university graduates compared to 54% of those in the top fifth ([
2], Figure 19). Further reviews of the evidence are provided by Bekhradnia [
3] and Gorard
et al. [
4] and analysis of the socioeconomic gradient in university application and attendance for a recent cohort provided by Anders [
5]. Much of these gaps can be explained by differences in academic achievement that emerge long before the point at which young people may apply to university [
6]. However, there are still some differences in participation that cannot be explained by prior achievement. One possibility is low aspirations to go to university among young people from poorer backgrounds. In this paper, we investigate how young people’s expectations about application to university vary with family socio-economic background and their own prior attainment. And—our principal focus—we show how these expectations change during the teenage years.
At age 14, young people from the bottom fifth of families classified on an index of socio-economic position are 30 percentage points less likely than young people from the richest fifth to think that they will apply to university and get in [
7]. This striking difference appears to support the thesis that a difference in early aspirations is an important explanation of the participation gap. However, the dataset concerned also shows that nearly half of young people in this group think that they will go to university—a figure which is substantially higher than the proportion which does eventually end up going [
5]. This suggests, on the contrary, that an “aspirations deficit” cannot be an important contributory cause to the socio-economic gap in university participation. Chowdry
et al. [
7] also show that attainment at the end of primary school (measured in end of Key Stage 2 tests at age 11) is an important correlate of expectations. Other work has also highlighted the correlation between socio-economic background and expectations of higher education both in the UK [
8,
9,
10,
11] and around the world [
12,
13,
14]. However, a great deal is still not known about young people’s expectations about university entry. In particular, more information is needed on how early expectations translate through to actual decisions on whether or not to make a university application and on how expectations change as young people progress through their teens.
Our source of data to investigate these issues is the Longitudinal Study of Young People in England (LSYPE). The survey followed for seven years a cohort of young people in England who were aged 13/14 (Year 9) in 2003–04. This cohort could first enter university in 2008–09, under the funding regime that prevailed in England until autumn 2012: the LSYPE data do not measure expectations following the major changes in the funding system after this date, when nominal fees were raised sharply from £3000 per year to up to £9,000 per year. However, analysis of the LSYPE can establish the patterns of expectation prior to the 2012 reforms, allowing future analysis of new data to compare these patterns with those following the reforms. (Recent information on expectations of university entry among teenagers following the announcement of the 2012 fee increases is provided by Ipsos MORI [
15] and the Sutton Trust [
16]).
In contrast to Chowdry
et al. [
7], who drew on just the first three annual waves of the LSYPE cohort, we follow the study’s young people until age 20/21. We are thus able to link the expectations of the early teenage years to the actual applications and entry to university in the late teens (up to and including applications made during a single “gap year”).
As a preliminary step, we exploited this longitudinal feature of the data to confirm that the young people’s stated expectations were not just “noise”, devoid of informational content in the sense of being unrelated to later outcomes. We re-estimated the statistical model of the decision to apply to university based on LSYPE data by Anders [
5]. This model specifies the decision as a function of family income, other measures of socio-economic background, prior achievement at ages 11 and 16 (end Key Stages 2 and 4, respectively), and school type. We introduced a dummy variable into the model indicating the young person’s belief at age 14 that they were “likely to apply” to university (either “very” or “fairly” likely). Holding all other factors in the model constant (at their average values), young people with this belief are estimated to be 9 percentage points more likely to actually apply to university by age 20/21. We also checked the unconditional associations between the age 14 expectations and actual applications (see also [
17], Table 1). Using the seven wave sample we use in this paper, we find the proportion who apply to university by Wave 7 varies from 79% for those who say at age 14 that they are “very” likely to apply, to 51% for those reporting they are “fairly” likely, to 27% for those “not very likely”, and to 13% for those who say that they are “not at all likely” to apply. The expectations data do not appear to be just noise. This is in line with the conclusions of Jerrim [
18] from his review of literature on educational aspirations and expectations of children—that, by time of the early teenage years, answers to questions on these subjects have real informational content. We note, however, that informative and causal are not one and the same; see Gorard [
19] for a review leading to a sceptical conclusion on the causal impact of attitudes on educational attainment.
Section 2 describes the LSYPE, including the questions asked of the young people about their expectations for university application and entry.
Section 3 shows how these expectations change during the secondary school years, showing that overall they “harden”—young people becoming surer about what they expect to do—but that there is considerable change at the individual level between the annual LSYPE interviews.
Section 4 focuses on the patterns of change by family socio-economic status (measured by income and by parental education), prior attainment at age 11 (measured by end of Key Stage 2 tests) and, critically, the combination of the two. Are there significant numbers of bright young people from disadvantaged backgrounds who never expect to apply to university or who change their minds—either giving up on the idea or who start to think later on that they will apply?
Section 5 recognises two key points during the teenage years, taking exams at age 16 (the end of compulsory schooling for this cohort, at which the exams are known as GCSEs or some other equivalents; this is also referred to as end of Key Stage 4) and deciding whether to stay on in full-time education at this time point. How are these related to the change in expectations about university application?
Section 6 centres on the decision to actually apply to university in the light of previous expectations.
Section 7 concludes.
2. The LSYPE and its Measurement of University Expectations
The LSYPE is made up of seven annual waves. It began in summer 2004 when cohort members were in Year 9, and aged 13–14, and ended in summer 2010, two years after those who had stayed on in full-time education past the minimum leaving age would normally have completed their final secondary school exams (typically exams known as A-levels). Interviews at each wave were conducted with both the young people and, up to Wave 4, their parents, covering information about the cohort members themselves and their families (for further information see [
20] and [
21]). The survey used schools as the primary sampling unit, oversampling more deprived schools and oversampling pupils from minority ethnic groups. Taking both school and pupil non-response into account only 53% of issued sampled members responded at Wave 1 ([
22], Table 4.1). The figure rises to 73% if school non-response is ignored. Weights adjust for the survey design and the level and the observed pattern of both school and pupil non-response. The total number of full responses fell from around 15,000 in Wave 1 to 9000 by Wave 7.
The three key areas of information in LSYPE for the purposes of this paper are family socio-economic position, cognitive achievement before and during secondary school, and the expectations of the young people and their parents regarding university—together with the information recorded on actual university application and entry.
We could measure socio-economic position in various ways given the information available. We focus on parental education, which has been of long-standing interest in the literature on intergenerational transmission of economic status (e.g., [
23]). We take the highest qualification achieved by either the mother or the father, distinguishing between five roughly equal sized groups: anything less than one A*-C grade GCSE or equivalent (
i.e., less than one good pass at end of compulsory schooling—21%); at least one grade A* to C GCSE or equivalent (
i.e. at least one good pass at the end of compulsory schooling—27%); at least one A-Level or equivalent (successful completion of two years of beyond compulsory education—18%); higher education below degree level (16%); and degree level or above (18%). These do not quite sum to 100% due to rounding.
Measures of cognitive achievement are provided by linkage to the National Pupil Database. We make particular use of scores from Key Stage 2 (KS2) tests, taken at the age of 10 or 11 at the end of primary school. Later measures, e.g., Key Stage 4 (KS4, at age 16) and Key Stage 5 (KS5, at ages 17–18) public exam scores (GCSEs and A-levels or their equivalents), may be affected by the university application/entry expectations that we wish to study,
i.e., they may be endogenous variables, although we do make some use of the KS4 scores. (Chowdry
et al. [
7] show that LSYPE study members do better in KS4 exams if they think they are likely to apply to—and get into—university, although a causal relationship is not established.)
The KS2 tests scores are less likely to suffer from this problem. About 9% of Wave 1 participants have missing KS2 attainment data. One explanation is that the individual was at an independent school where KS2 tests are not obligatory but it is clear from the data that this is not the only reason. We impute a KS2 quintile group when KS2 data are missing using information on KS4 exam scores, allocating an individual with missing KS2 data to a quintile group on the basis of their KS4 quintile group, e.g., those in the bottom fifth at KS4 are allocated to the bottom fifth at KS2. The KS2 average scores in reading, maths and science has a correlation in the data of 0.68 with “capped 8” KS4 scores. We have chosen not to use in addition the KS3 test score data available in LSYPE, which also predates Wave 1.
Questions to the study members on their expectations of university application and entry begin in Wave 1. There are two questions, each with five possible responses (note that, in common usage, “not very likely” means “fairly unlikely”, rather than describing anything less than “very likely”):
How likely do you think it is that you will ever apply to go to university to do a degree?Very likely
Fairly likely
Not very likely
Not at all likely
Don’t know
How likely do you think it is that if you do apply to go to university you will get in?Very likely
Fairly likely
Not very likely
Not at all likely
Don’t know
The second question, on entry, was asked only to those who responded with one of the first three categories to the question on application: it was not asked to those “not at all likely” to apply or to those saying that they did not know whether they would apply. These questions were repeated verbatim until Wave 4, when the second one was dropped. By Wave 5, with some study members already having applied to university (this is the final year of schooling when A-level exams are completed), the first question was asked only to those who had not yet applied. Similarly, in Wave 6 it was asked only to those who had not already applied to university and who were also not defined by the LSYPE organisers as “low achievers”. We treat this group as being not likely to apply to university. This group is all not in education or employment (“NEET”) as well as being deemed “low achievers” in the LSYPE documentation, a term which is not obviously defined there. They represent about 7% of the Wave 7 weighted LSYPE sample, and are heavily skewed towards the bottom end of the KS4 distribution (over half being in the bottom quintile group. In Wave 7, no specific question on likelihood of application was asked, however some information on intention to apply is gained from a question to those currently doing A Levels on whether they are doing these qualifications so that they can apply to university later on. We have chosen not to use this question, instead concentrating simply on application to university by Wave 7 at this point.
Table 1 compares the answers to these two questions for all respondents to Wave 1 with valid data. Expectations of application to university in the LSYPE cohort were indeed high at this stage, with two-thirds of respondents (65.7%) saying they were “very” or “fairly” likely to apply. In the great majority of these cases, the young people also thought they were likely to get an offer were they to apply, although the degree of confidence exhibited by those reporting only that they were “fairly” likely to apply is notably lower—few of them think they would be “very” likely to get an offer (just 5%). Among those saying they were “not very likely” to apply, more than a third thought they would be likely to get an offer were they in fact to make an application. Almost all young people gave an opinion one way or the other to both questions (when asked): the response “don’t know” is rare.
One issue with the data is how much to read into the different strengths of the possible positive or negative responses: the difference between “very” and “fairly” likely and between “not very” and “not at all” likely. On the one hand, we find evidence that the distinctions may be informative. There are clear differences in the distribution of the positive responses between “very” and “fairly” likely to apply depending on socio-economic position. Young people in the top (richest) quintile group of our income measure responded “very likely” more often than “fairly likely” while the opposite was true for those in the bottom quintile group. On the other hand, there are no clear-cut definitions of “very” and “fairly” and a respondent might switch between the two categories at successive interviews with little real change in underlying attitudes. The same applies to the categories “not very” and “not at all”. This could be a potential source of regression to the mean, affecting our efforts to analyse how individuals’ attitudes change over time. For much of our analysis we collapse the four category variable into one with only two categories, “likely” (combining “very” and “fairly”) and “not likely” (combining “not very” and “not at all”), and then compare results on this basis with those obtained when just focusing on the response “very likely”. We include the small number of “don’t know” responses in the “not very likely” category, on the grounds that the respondent has not expressed a positive expectation. Taking the alternative approach of excluding the group who report that they “don’t know” does not make a substantive difference to our results.
Table 1.
Young persons’ expectations of application to university and of acceptance if an application is made: Wave 1 (year 9, age 13–14) (row %s).
Table 1.
Young persons’ expectations of application to university and of acceptance if an application is made: Wave 1 (year 9, age 13–14) (row %s).
| | Likelihood of getting into university if apply |
|---|
| Likelihood of application | Very likely | Fairly likely | Not very likely | Not at all likely | Don’t know | Not asked | Total | Size of group |
| Very likely | 43.2 | 51.3 | 1.6 | 0.2 | 3.7 | 0.0 | 100.0 | (32.3) |
| Fairly likely | 5.0 | 76.5 | 10.4 | 0.6 | 7.7 | 0.0 | 100.0 | (33.4) |
| Not very likely | 1.7 | 35.0 | 46.8 | 6.1 | 10.4 | 0.0 | 100.0 | (17.3) |
| Not at all likely | 0.0 | 0.0 | 0.0 | 0.0 | 0.0 | 100.0 | 100.0 | (12.6) |
| Don’t know | 0.0 | 0.0 | 0.0 | 0.0 | 0.0 | 100.0 | 100.0 | (4.4) |
| Total | 15.9 | 48.1 | 12.1 | 1.3 | 5.6 | 17.0 | 100.0 | 100.0 |
In the rest of the paper we restrict attention to the expectation to apply (Fumagalli [
11] instead focuses on the expectation of the likelihood of getting into university if an application is made).
3. The Evolution of Expectations through the Teenage Years
How do expectations about application to university evolve for the LSYPE cohort, taken as a group?
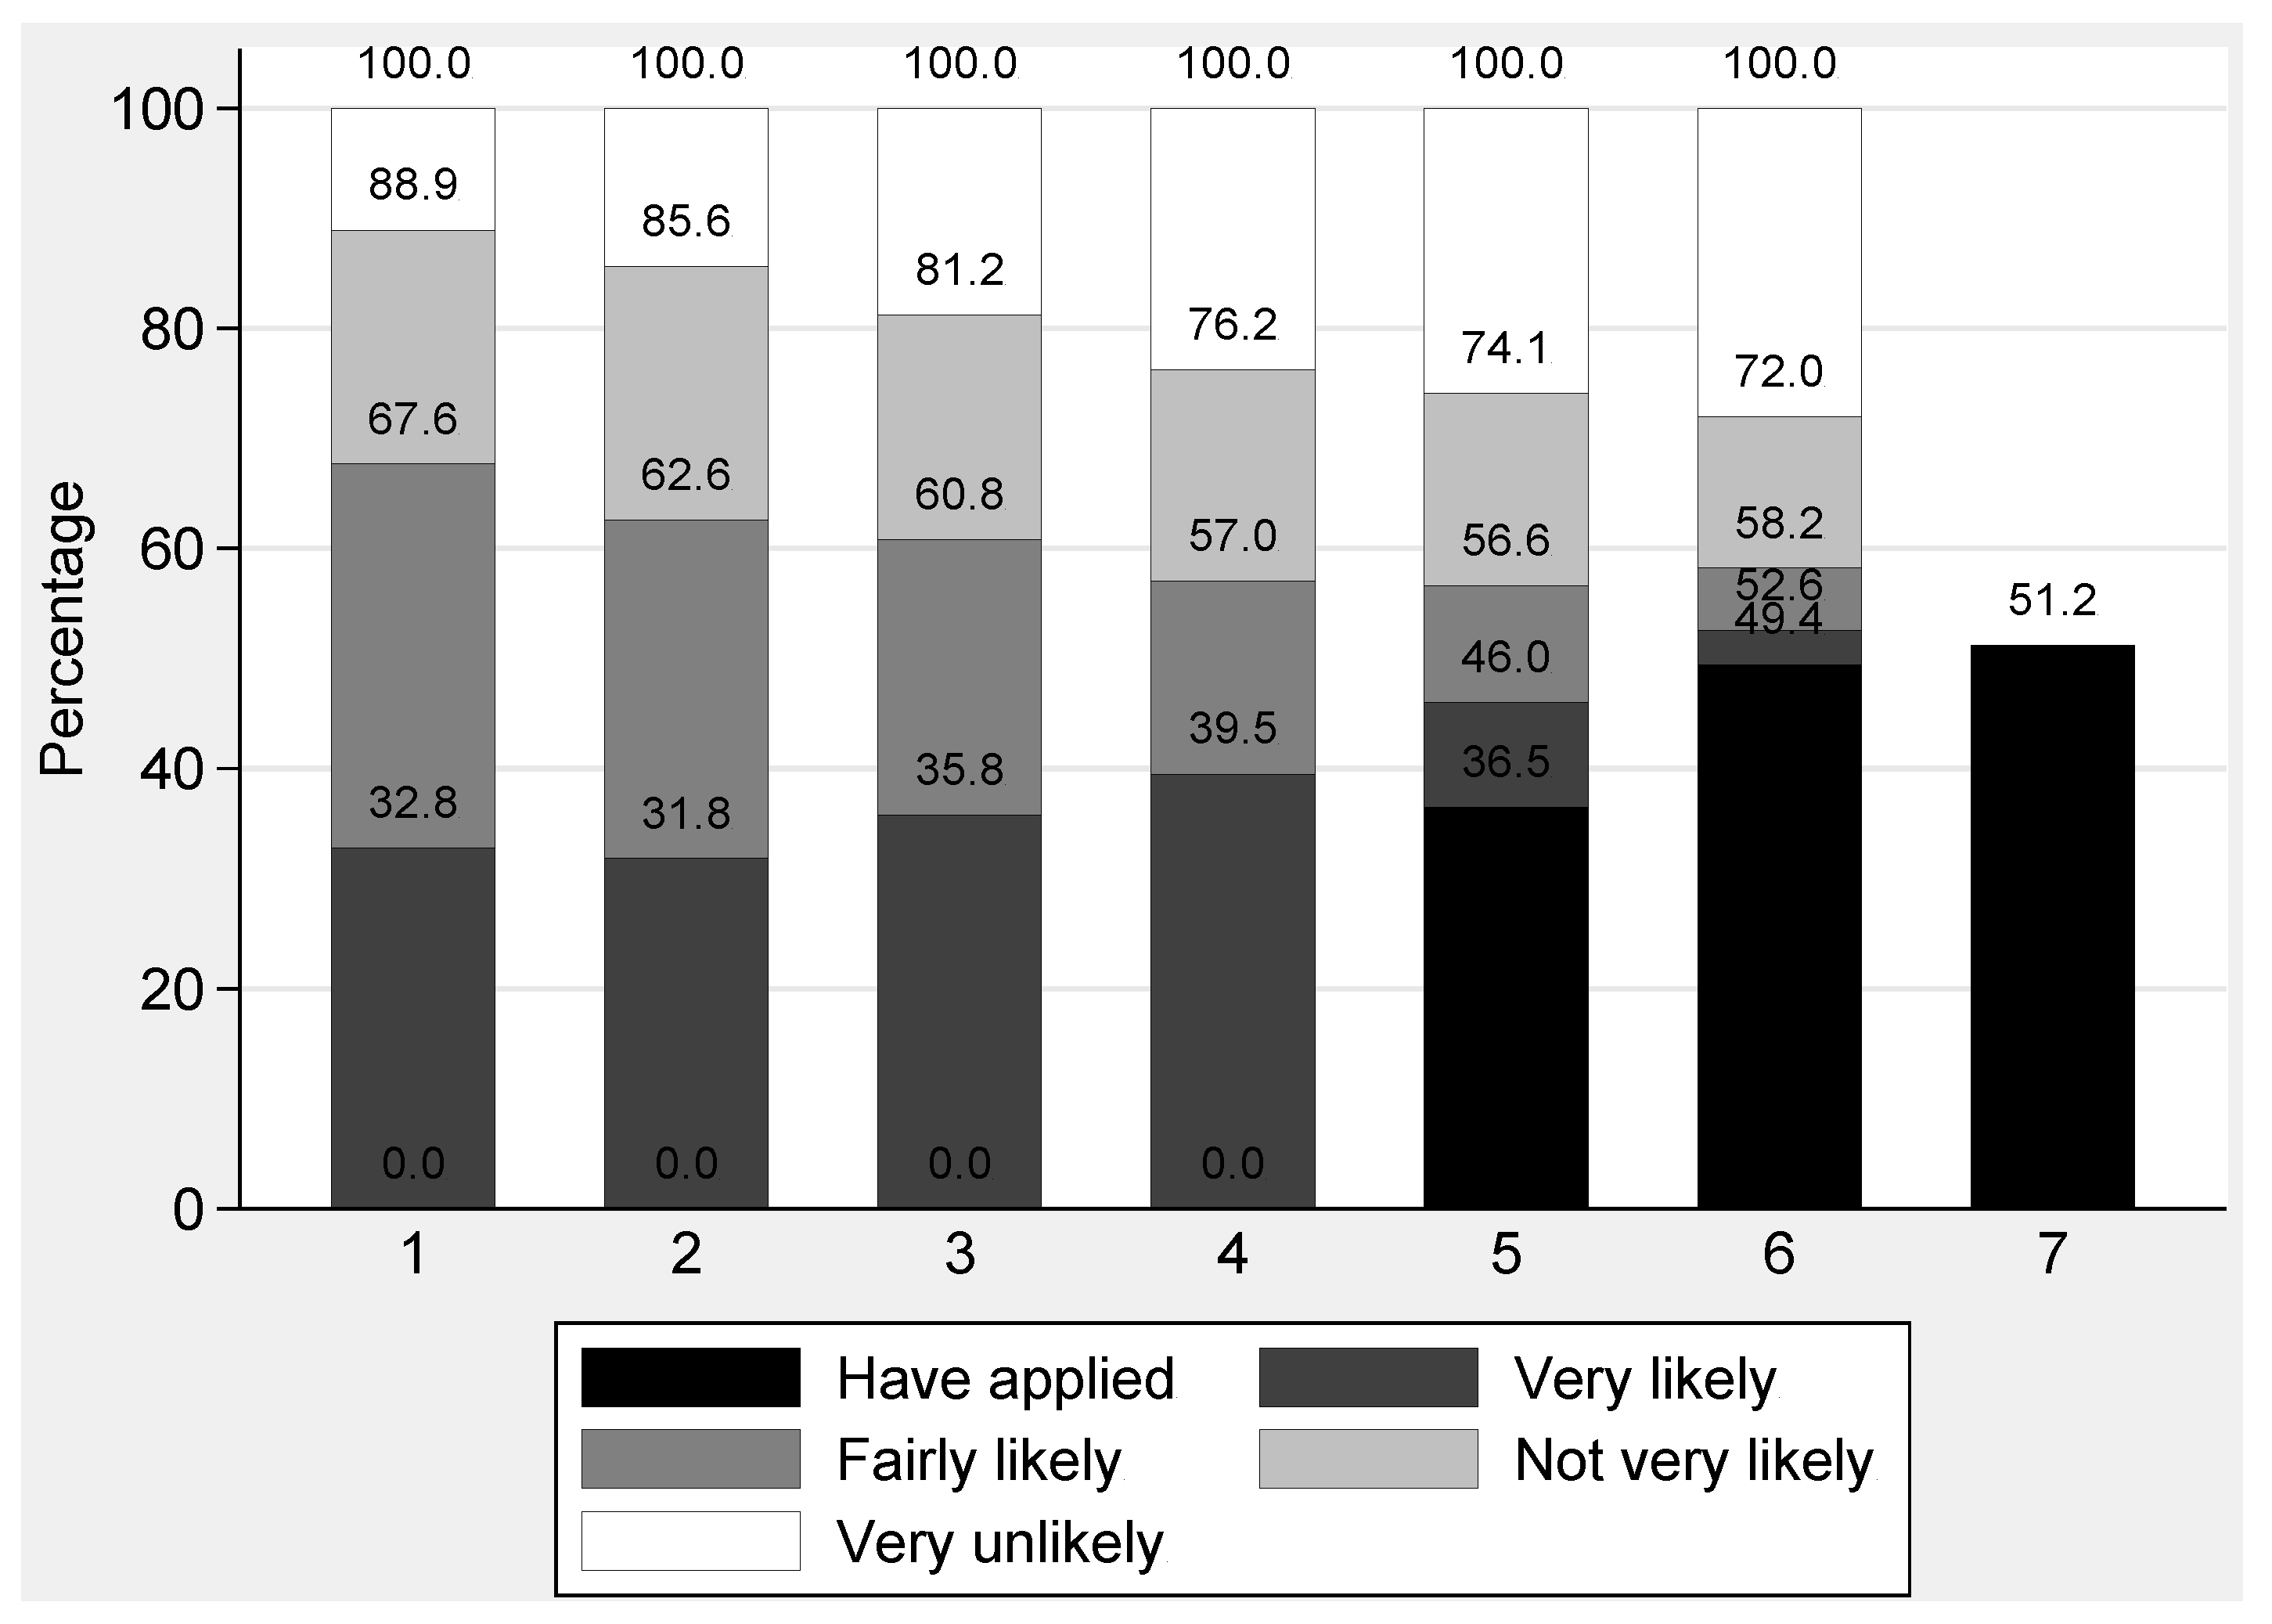
Figure 1 shows for each wave, 1 to 7, the percentages of young people who report being very likely, fairly likely, not very likely and not at all likely to apply to university. From Wave 5 onwards we include an additional category for those who have actually applied. In Wave 7, only the measure of having actually applied to university by this point is used.
In common with all graphs and tables in the rest of the paper,
Figure 1 is restricted to those individuals present in all seven waves, which results in a sample of about half the size of that used in
Table 1. The attrition in the LSYPE panel has the impact of raising very modestly the overall percentage of the sample that thinks it likely (“fairly” or “very”) that they will apply to university, from 66% in
Table 1 to 68% in
Figure 1 (this is after the application of weights that adjust for the observed pattern of attrition in addition to the survey design and Wave 1 non-response).
Figure 1.
Young people’s expectations of university application, Wave 1 (age 13–14) to Wave 7 (age 19–20). Notes: The sample is Wave 7 respondents with non-missing data on university expectations at all waves and university application (“don’t know” treated as “not very likely”). Wave 7 weights applied. Unweighted sample size = 8029. Data labels show cumulative percentages.
Overall, there is a substantial decline in the expectations of application as the LSYPE members age—from the 68% just noted in Wave 1 to 57% in Wave 4—at the end of the first year following GCSEs. There is essentially no change in Wave 5, when actual applications begin to be included (the “certain” to apply cases), before a small rise in Wave 6 when the study members were completing their secondary schooling (if they had stayed on at school). There is then a sharp fall of seven percentage points to 51% in the final wave of the panel. However, much of this may be driven by the lack of information on expectations in this final wave: we know from data from the University and Colleges Admissions Service (UCAS) that individuals will continue to enter university over the subsequent few years or later as mature students, and so it is probable that a small percentage of the sample would have responded that they were likely to expect to apply to university if they had been asked in Wave 7.
This final Wave 7 figure, reflecting actual applications, is notably higher than one would expect on the basis of aggregate data recording university applications by young people in England [
5]. The same is true of the percentage of the LSYPE cohort actually attending university in Wave 7. In both cases the LSYPE figure appears around 10 percentage points too high. The reasons are unclear. The observed pattern of both Wave 1 non-response and subsequent attrition is accounted for in the survey weights. Possible causes include the unobserved pattern of non-response and attrition, and definitional differences between LSYPE and aggregate sources of data.
Together with the overall decline in the expectation of application,
Figure 1 shows a clear strengthening of opinions across the waves with cohort members appearing more decisive in their expectations. The percentage of young people saying they are “very likely” to apply actually rises, it is the response “fairly likely” that sees a large decline. There is a similar but less marked pattern on the negative side, with a modest reduction in the proportion saying they are “not very likely” to apply more than offset by the increasing proportion saying they are “not at all likely”.
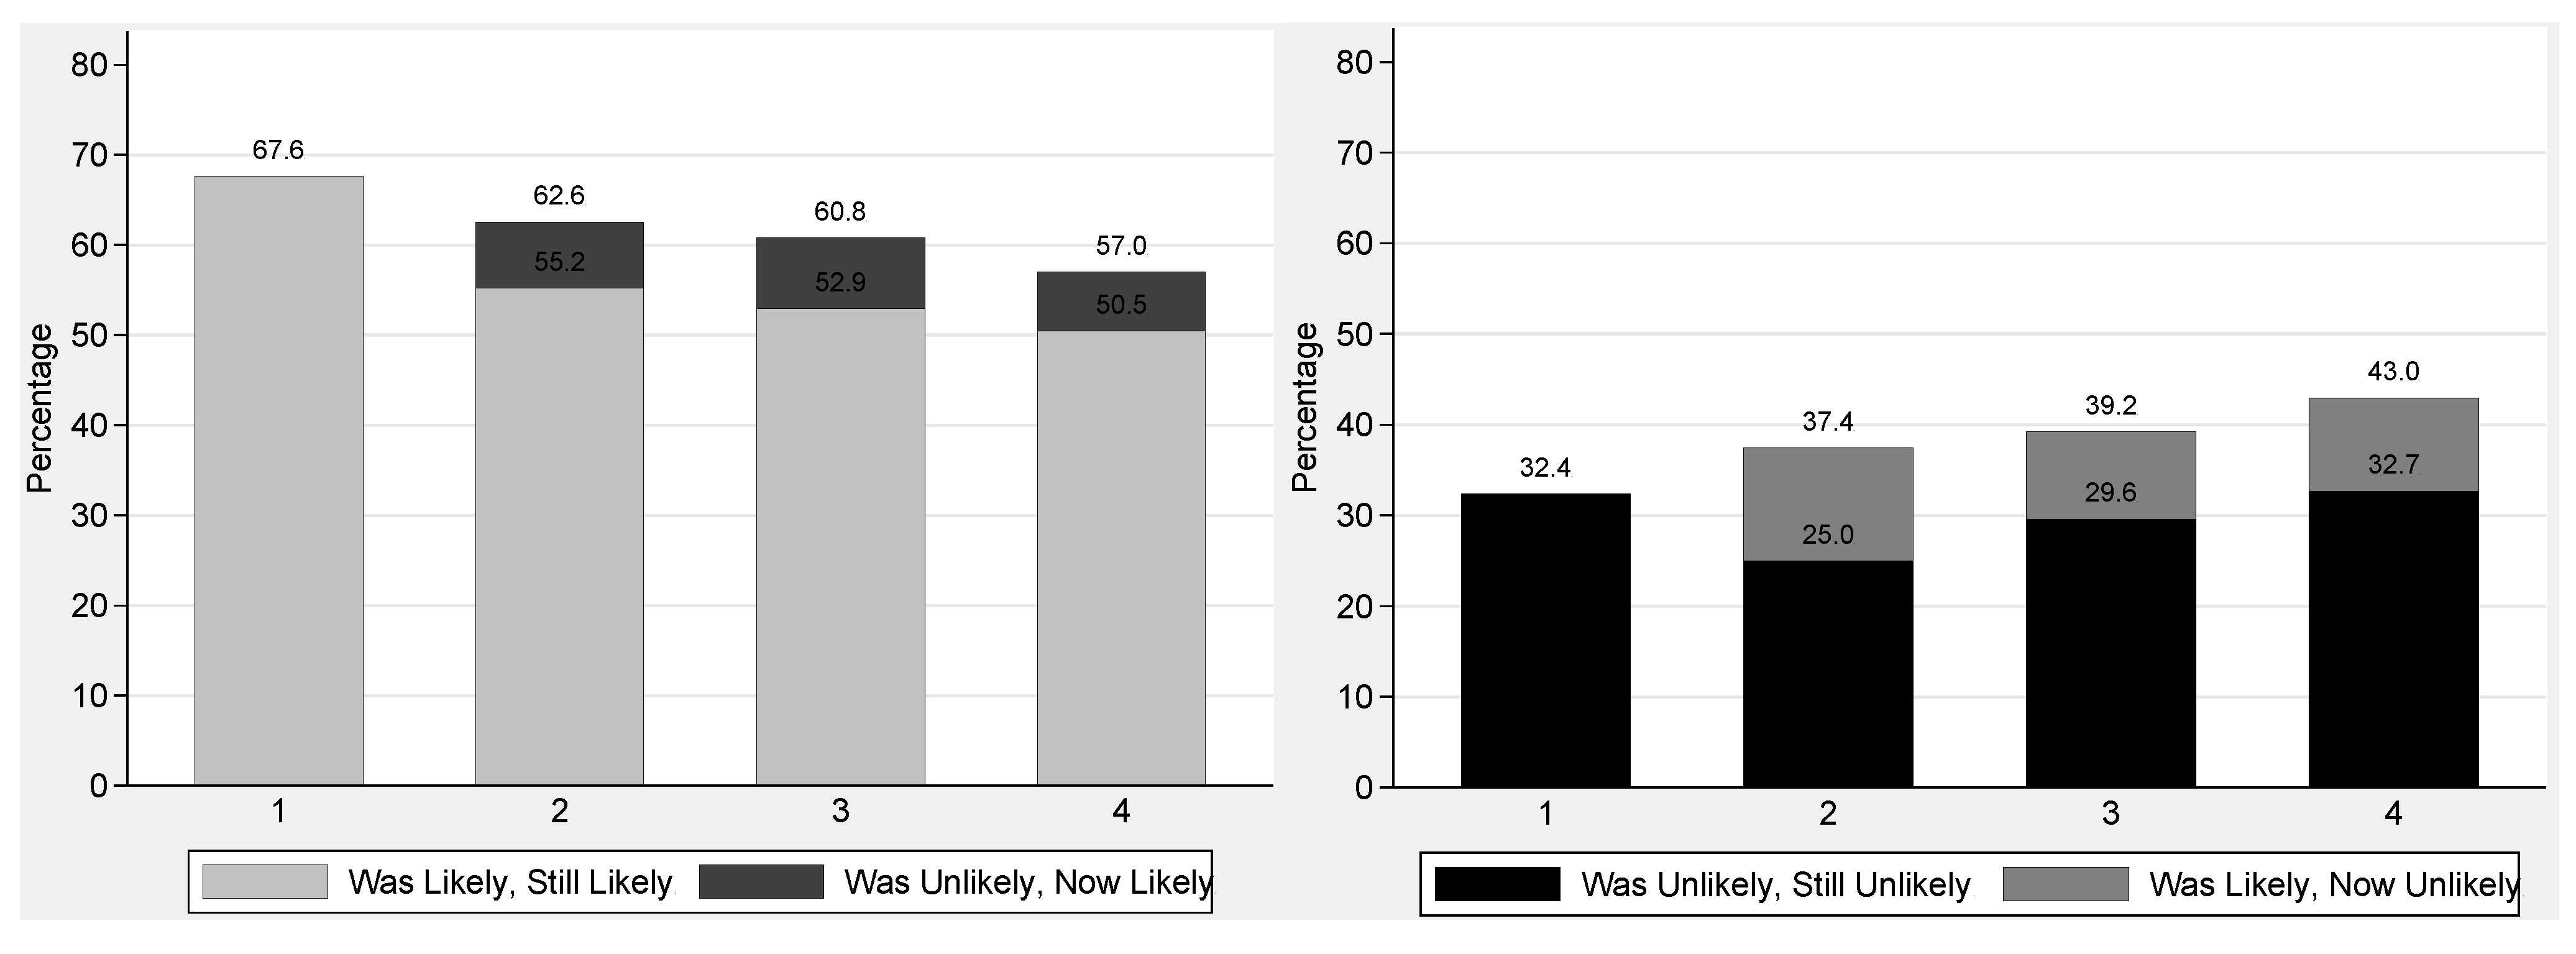
How do expectations change at the individual level? The overall decline across the waves in
Figure 1 is consistent with a gradual drop-off in expectations from wave to wave or with a much larger fall off, offset by some of those young people who thought they were unlikely to apply switching to a positive expectation.
Figure 2 sheds some light on the situation. The left half shows the percentage likely to apply (either very or fairly) at each of Waves 1 to 4 while the right half shows the percentage unlikely to apply. This repeats information given in
Figure 1 but we now also distinguish between those young people who held the same view at the previous wave and those who changed their view. The graphs show that of the 62% who are likely to apply at Wave 2—a lower level than at Wave 1—more than 1 in 8 (7.4 percentage points) are individuals who have changed opinion and who have switched from “unlikely” to “likely”. And the increase between waves 1 and 2 in the percentage unlikely to apply, from 32% to 37%, is the net result of some people with this view in Wave 1 changing their minds compensated for by an additional 12% switching to it at Wave 2. These patterns in
Figure 2 suggest that either there is considerable noise in the exact level of individuals’ expectation that they express in each wave or that there really are substantial genuine changes in opinion, we are unable to distinguish between these two explanations.
Figure 2.
Young people’s expectations of university application with previous wave status, Wave 1 (age 13–14) to Wave 4 (age 16–17). Notes: The sample is Wave 7 respondents with non-missing data on university expectations at all waves and university application. Wave 7 weights applied. Category “likely” includes both “very likely” and “fairly likely”; category “unlikely” includes both “fairly unlikely” and “not at all likely”. Unweighted sample size = 8029. Data labels show cumulative percentages.
4. Changing Expectations—Family Background and Prior Attainment
We now separate young people into five groups according to their family background in terms of parental education (
Figure 3). As with
Figure 2, each graph in this section is in two parts, the left panel showing the percentage of each group either very or fairly likely to apply and the right half restricted to just the response “very likely”. Also as before, the Wave 7 data point is the same in both halves: the percentage who have actually applied to university by that stage.
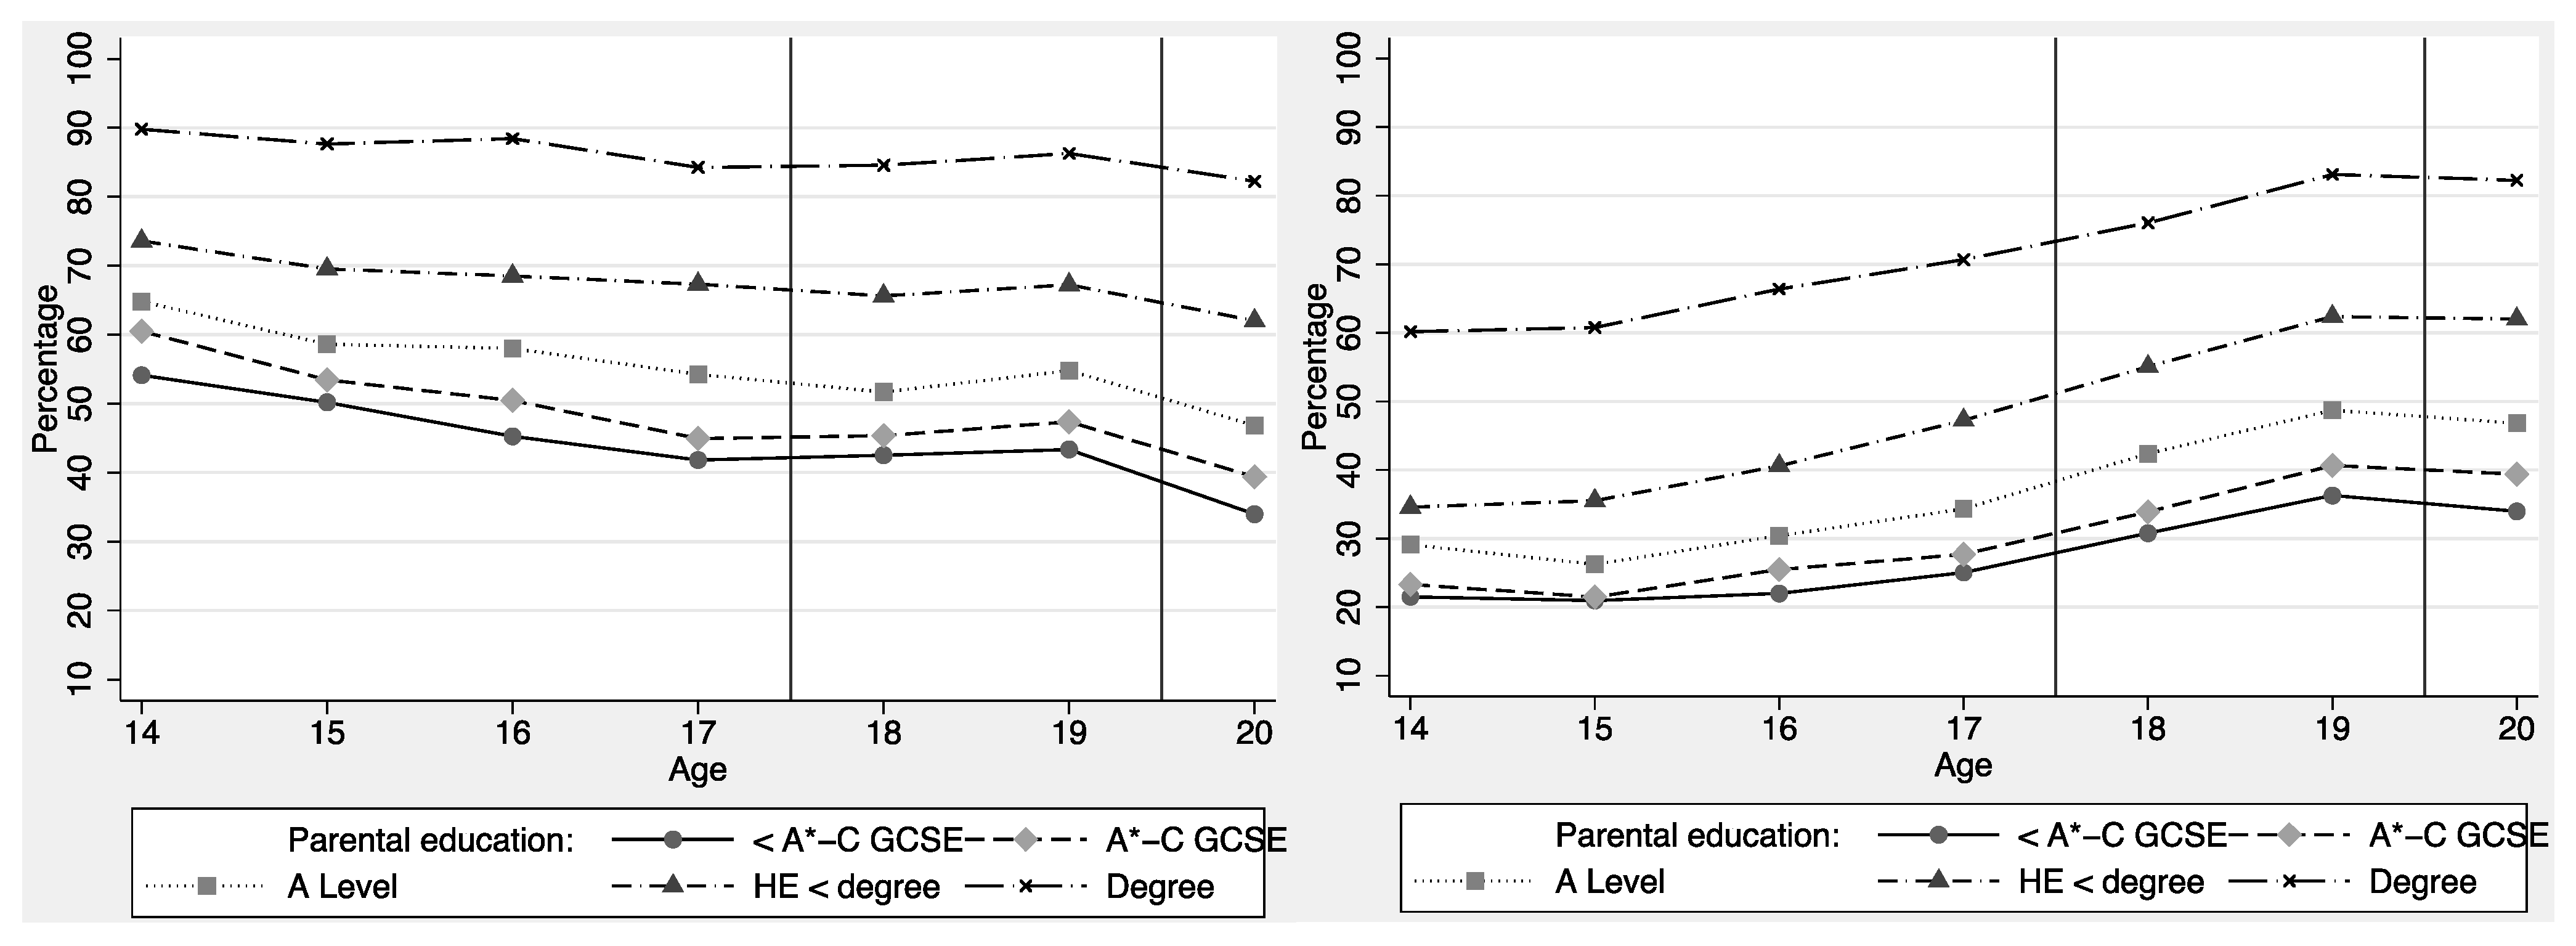
Figure 3.
Percentage of young people likely to apply (left panel) or very likely to apply (right panel) to university, Wave 1 (age 13–14) to Wave 7 (age 19–20), by level of parental education. Notes: Wave 7 respondents with non-missing data on university expectations at all waves, university application, and parental education. Wave 7 weights applied. Unweighted sample size = 7,659. Group sizes as follows: below A*-C GCSE 19.6%; A*-C GCSE 26.7%; A Level 18.2%; HE below degree 16.7%; Degree or above 18.8%.
These graphs show big differences by family background in expectations about application at Wave 1. As many as 90% of young people with parents with a degree say at age 13/14 that they are likely to apply to university compared to 54% of their peers with parents with qualifications below GCSE A*-C (left panel of
Figure 3), a gap of 36 points. It is expectations in the top category of parental education—a degree—that really stand out. The figure for the middle category—A-levels—is only 10–11 percentage points higher than for the no qualifications category. These gaps between the top and bottom groups are very similar if we switch to looking at the percentages who think they are very likely to apply (the right panel of each graph): 39 percentage points. However, the figures for the top group (a parent with a degree) are even more notably further away from the second group on this basis: children from the most advantaged backgrounds are stronger in their expectation of application, with over half of them thinking it very likely they will apply, compared to about a third for the next level of parental education.
The left panel of each Figure shows expectations of application (“very” or “fairly” likely) falling noticeably more for individuals from more disadvantaged backgrounds. Family background differences in young people’s expectations increase through the teenage years: the gap between the percentages for teenagers with a degree-holding parent and for teenagers whose parents have qualifications below GCSE A*-C increases from 36 points in Wave 1, to 43 points at waves 3 to 6, and to 47 points at Wave 7 (when the data measure actual university application rather than expectation). The differences in the percentages “very likely” to apply (right panel of each Figure) also increase by about the same amount: the gap between the top and bottom groups of parental education rises from 39 points at Wave 1 to 45 points at Wave 4.
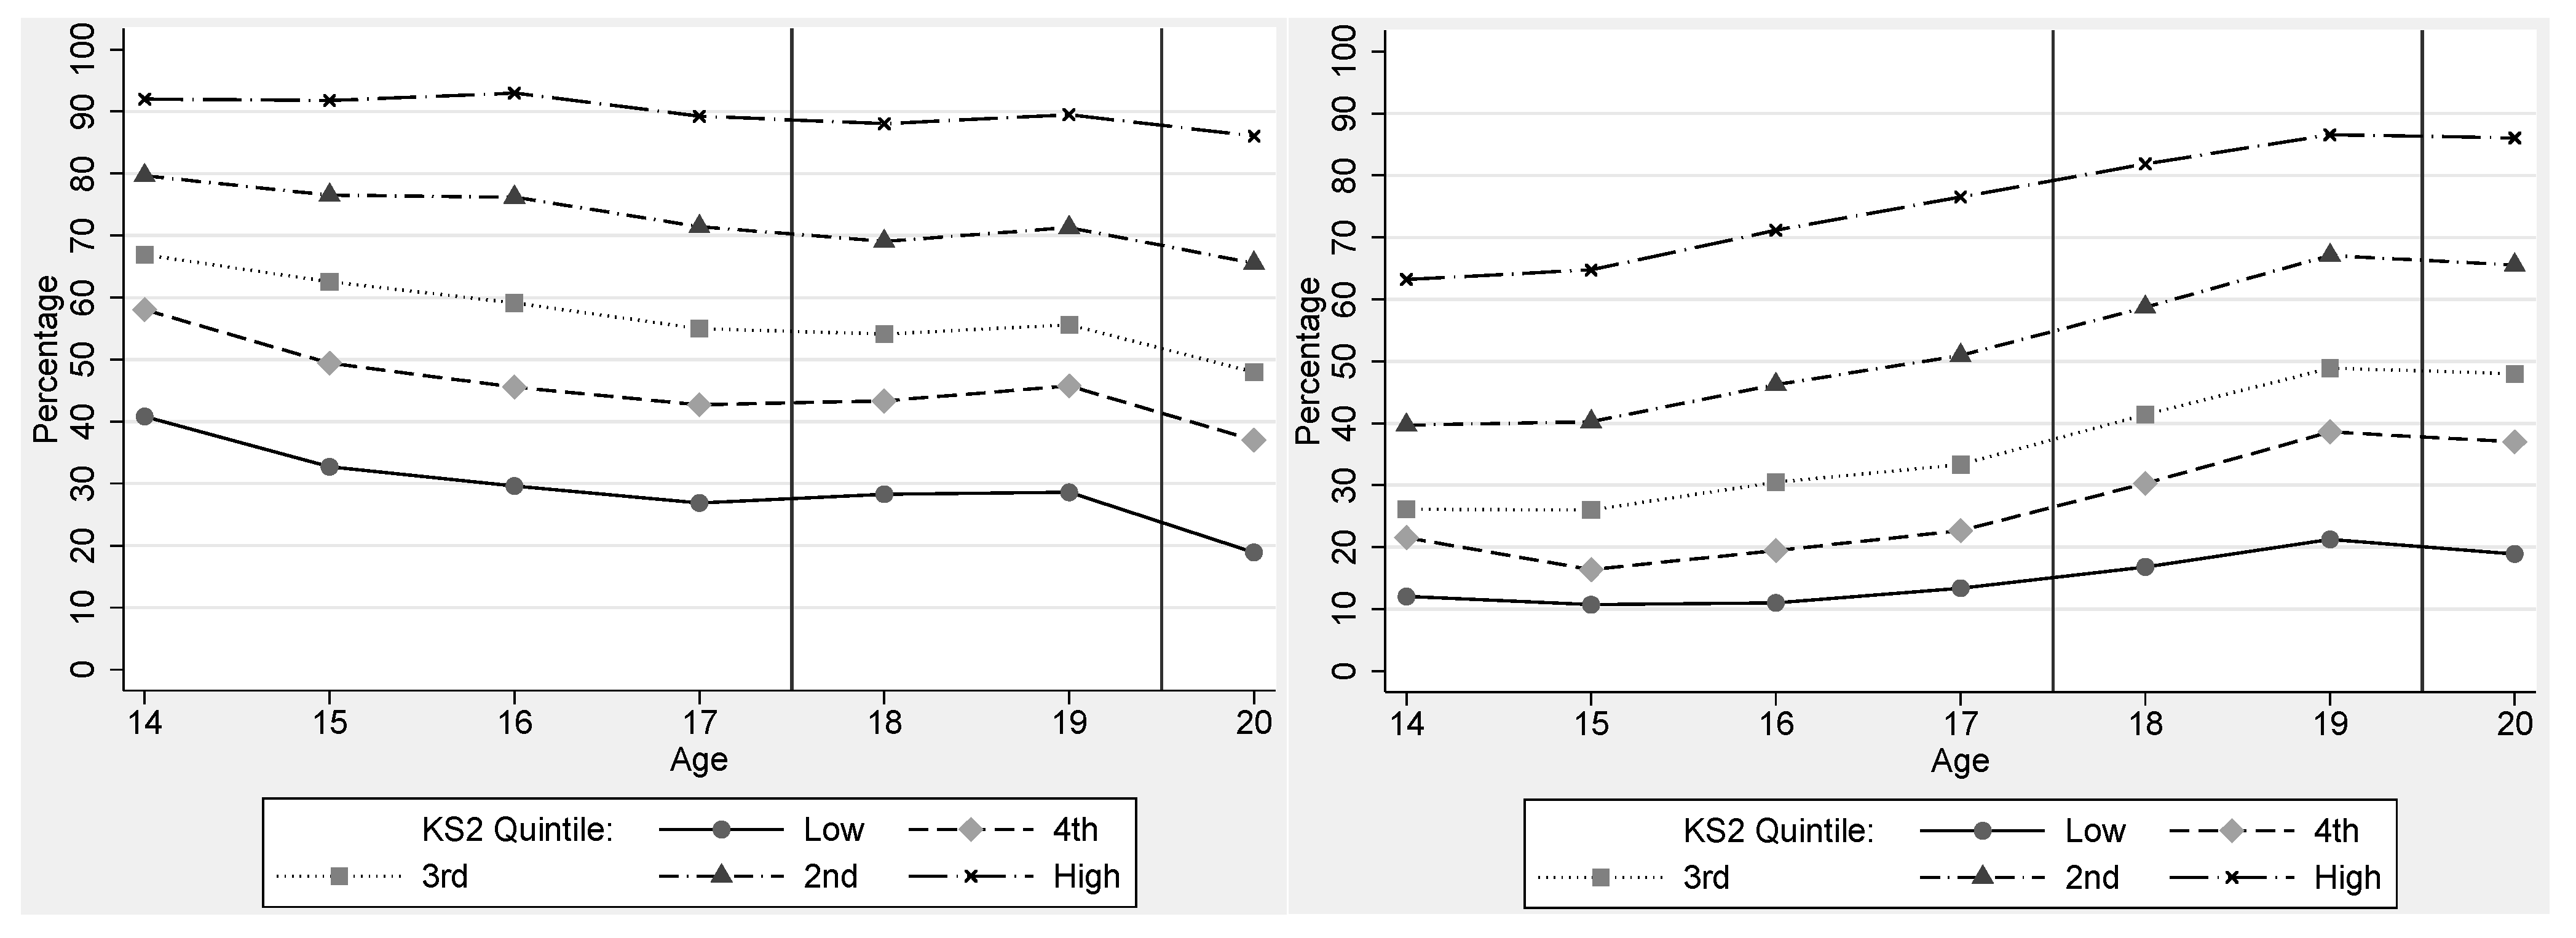
How does the picture vary with prior attainment at the end of primary school? In
Figure 4 we split the sample into quintile groups of attainment at age 11 (KS2). (The two-diagram design is as for earlier graphs.) University expectations are highly graded by performance at KS2 attainment tests, with over 90% of those in the top fifth reporting at Wave 1 that they are likely to apply (and over 60% very likely), compared to just over 40% for the bottom fifth. The difference of 50 percentage points between these two groups is also found if attention is restricted just to the reporting of being “very likely” to apply (right panel). The gap between the two groups rises over time—the fall off in the left panel is more marked for the lowest KS2 achievement group and the rise in the right panel less marked.
These differences in expectations by prior attainment are even greater than those by parental education. This analysis is robust to dropping individuals with missing KS2 scores, rather than imputing their quintile group on the basis of KS4 performance. It would be of obvious interest to try to see if just crossing a particular threshold of KS2 scores, e.g. the threshold for the expected level 4 or that for the higher level 5, has a causal impact on expectations of university application. This could be investigated with a regression discontinuity design as in the analysis of LSYPE data by Sartarelli [
24]. However, small sample sizes around the thresholds would threaten efforts to obtain precise estimates.
The interplay between prior attainment and family background is of key interest. Does a high KS2 score “win out” over a less advantaged family background when it comes to forming expectations about applying to university? Of course, family background can be expected to have had an impact on KS2 performance so any answer to this question has to be interpreted as conditional on the effect of the family up to the end of primary schooling.
Figure 4.
Percentage of young people say they are likely (left panel) or very likely (right panel) to apply to university from Wave 1 (age 13–14) to Wave 7 (age 19–20), by quintiles of KS2 attainment. Notes: Wave 7 respondents with non-missing data on university expectations at all waves, university application, and KS2 attainment. Wave 7 weights applied. Unweighted sample size = 7976.
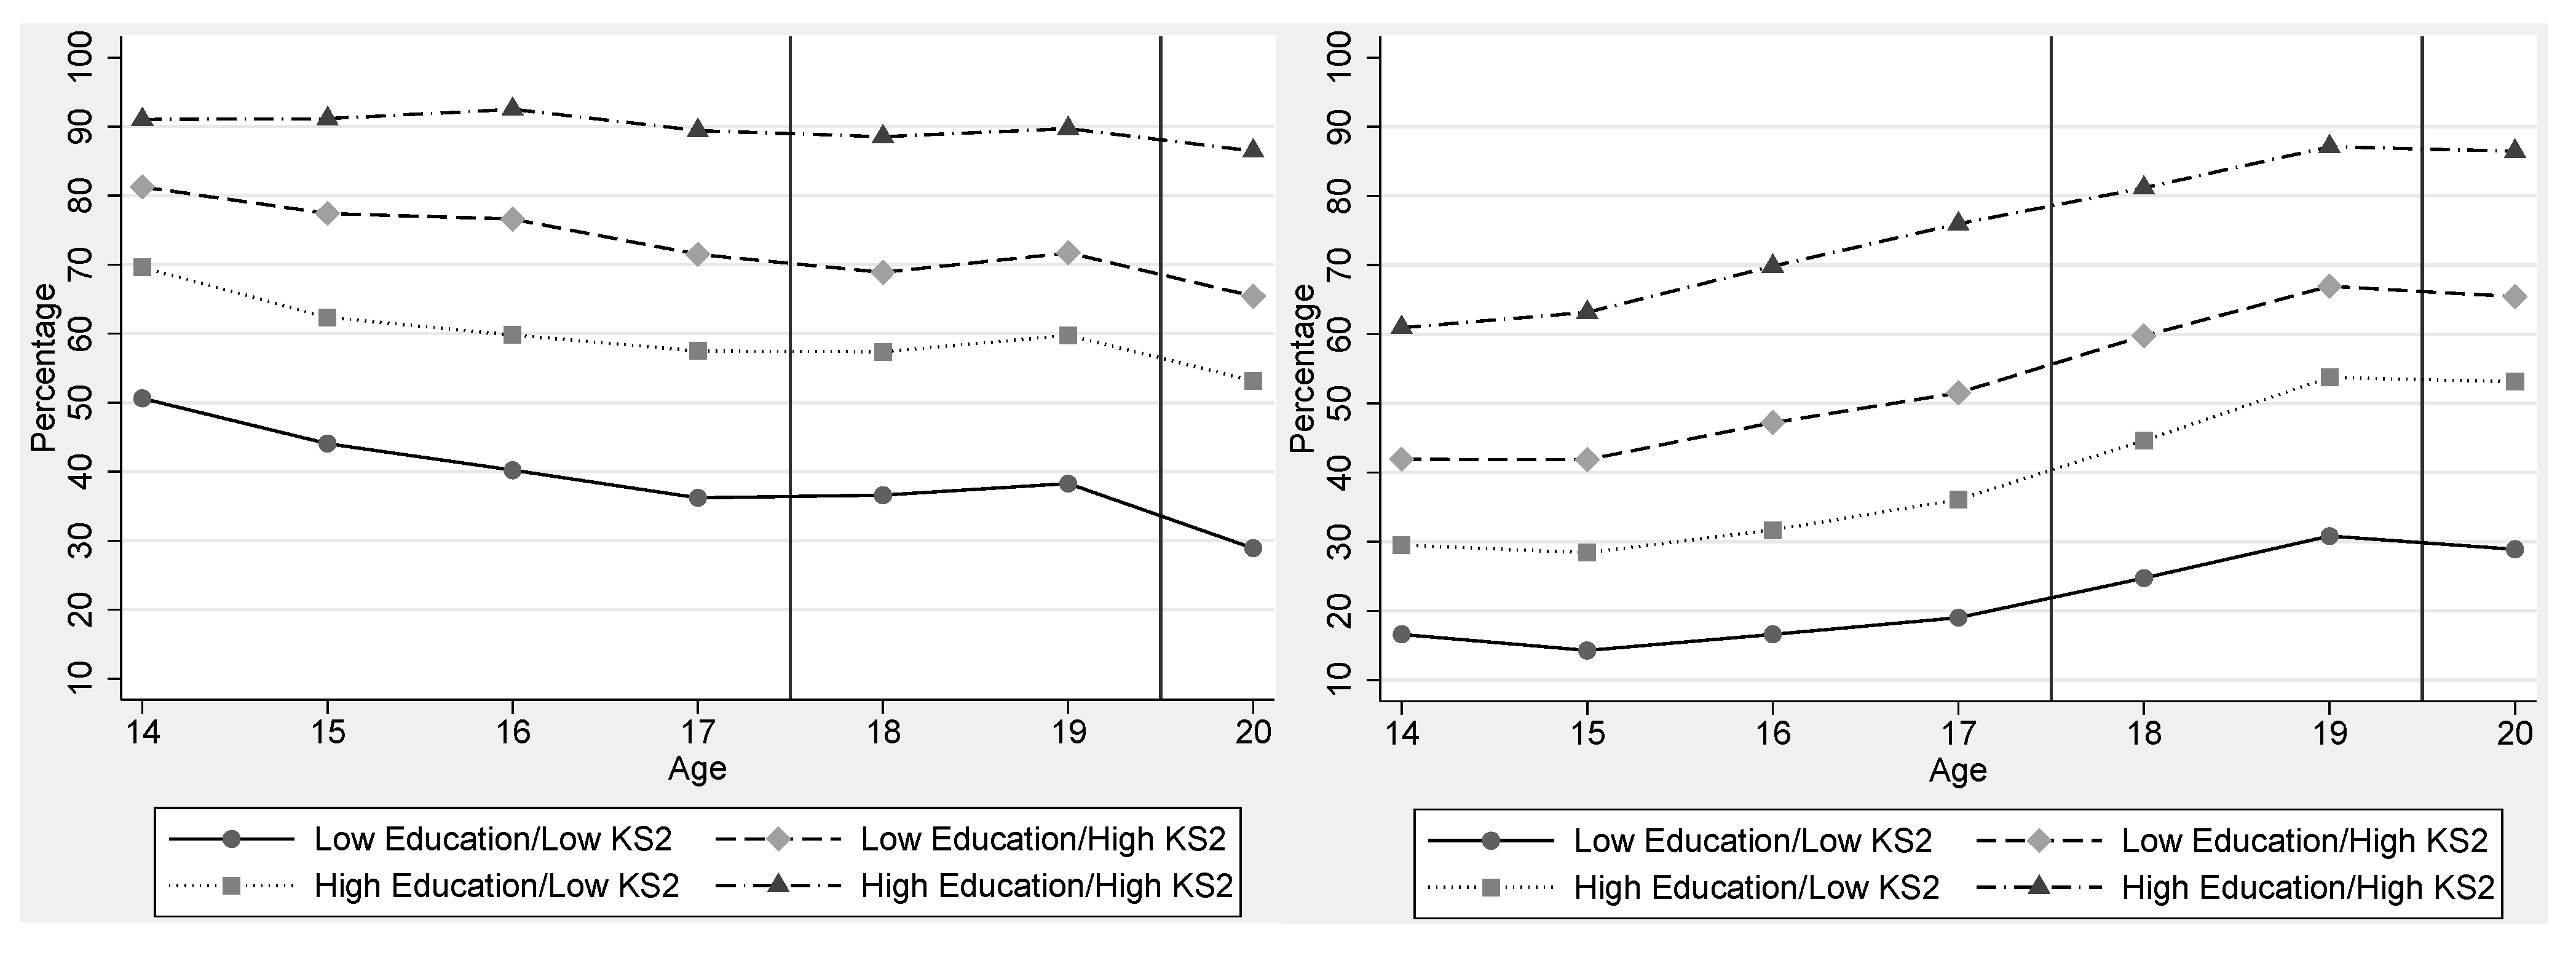
In
Figure 5 we split the sample into four combinations of high and low KS2 attainment and high and low family background. We define high KS2 as being in the top 40% of KS2 scores and high family background as being in the top two groups of parental education (a parent with higher education, whether or not at degree level). We are particularly interested in the low family background group/high KS2 group—young people who come from less advantaged family backgrounds but who were in the top 40% of performance at primary school. This group is far from trivial in size, representing about a fifth of the cohort. (The sizes of each group are given in the notes to the graphs.)
Figure 5.
Percentage of young people who say they are likely (left panel) or very likely (right panel) to apply to university, Wave 1 (age 13–14) to Wave 7 (age 19–20), by parental education and KS2 attainment. Notes: Wave 7 respondents with non-missing data on university expectations at all waves, university application, and parental education. Wave 7 weights applied. Unweighted sample size = 7611. “High education” means any kind of higher education (degree or below). “High KS2” means being in the top two quintiles of KS2 attainment. Group sizes as follows: Low Education/Low KS2 44.0%; Low Education/High KS2 19.7%; High Education/Low KS2 14.7%; High Education/High KS2 21.6%.
Expectations are strongly associated with KS2 performance even when controlling for family background (as noted previously for Waves 1–3 by Chowdry
et al. [
7]). Encouragingly, good performance in KS2 appears to outweigh much of the apparent effect of a less advantaged background (ignoring, as we have stressed, any impact of family background on the KS2 score itself). Notably, the “Low Education/High KS2” group has expectations of applying to university that are much higher than those of either of the “Low KS2” groups. At age 14, about two-fifths of the group with less advantaged family background and high KS2 scores in primary school say they are “very likely” to apply to university (right panel of
Figure 5). By age 17 (following GCSE results) the figure is up to a half, and by age 20 about two-thirds have actually applied. However, this final figure is still substantially below the application rate for the similar sized group of young people with an advantaged family background and high KS2 scores, where the rate by age 20 is around 85%. And at age 17, nearly 30% of the Low Education/High KS2 group are not very or fairly likely to apply to university (left panel of
Figure 5), substantially more than for the High Education/High KS2 group with the gap between the two groups having widened since age 14.
5. Changing Expectations—Age 16 Exams and Decisions, and the Influence of Schools
To this point, we have considered how expectations about application to university change across the teenage years without recognising two major stages in the English educational system that occur at age 16. First, young people take GCSE exams (or their equivalents). These provide new information on academic achievement and ability. In addition, unlike the KS2 scores at the end of primary school which we considered in the last section, GCSE results are declared in applications that are made subsequently for university entry—they are “high stakes” tests. Second, age 16 is the minimum school leaving age for this cohort. More recently, the age that individuals must remain in education was raised to 17 in September 2013 and, further, to 18 in September 2015. Individuals are not specifically required to remain in school, but if they do not then they must instead be doing an apprenticeship or traineeship, or be doing part time education alongside at least 20 hours a week of work or volunteering. At least in the short run, individuals who would previously have left school at age 16 are now still likely to end full-time formal schooling; as such, we do not anticipate our observations altering dramatically in a short space of time. Leaving full-time education at this point is not a complete bar to later university entry but it does close off the main route into higher education. In this section, we first consider these two major stages in the teenage years and then turn briefly to the importance of schools.
5.1. Age 16 Exams and Decisions
From one view, GCSE results and the decision on whether or not to leave school at 16 are events that may sharply change expectations of applying to university. Achieving good GCSE results updates a teenager’s view of his or her ability and should increase expectations of application. Leaving school at 16 may sharply reduce expectations, given that continuation in school and doing A-levels at 18 is the standard route to university. On another view, the GCSE exam results and the age 16 leaving decision are outcomes that are influenced by expectations of whether an application will be made to university. As we noted in
Section 2 in the case of the GCSE results, they may be endogenous variables to the process of evolving expectations that we are studying, a symptom or even an outcome of low expectations of application rather than a cause. Someone who thinks it unlikely that they will apply to university may take fewer GCSE subjects and put less effort into studying and preparation. Likewise, they may be more likely to leave school, deciding that there is little point in remaining in full-time education if they are not intending to go on to university. In this case the direction of causality would run from expectations to GCSE results and the leaving decision rather than the other way round.
In practice, it seems probable that the expectations and the GCSEs/leaving decision are jointly determined—there is bi-directionality in the causation between the two. While it would be extreme to view the GCSE results and leaving decisions entirely as exogenous “surprises” that suddenly hit expectations, at the same time it would also be extreme to view the expectations as only affecting these age 16 outcomes and being entirely uninfluenced by their anticipation. With this in mind, we now consider the association in the LSYPE data between expectations of university application and GCSE results and the leaving decision.
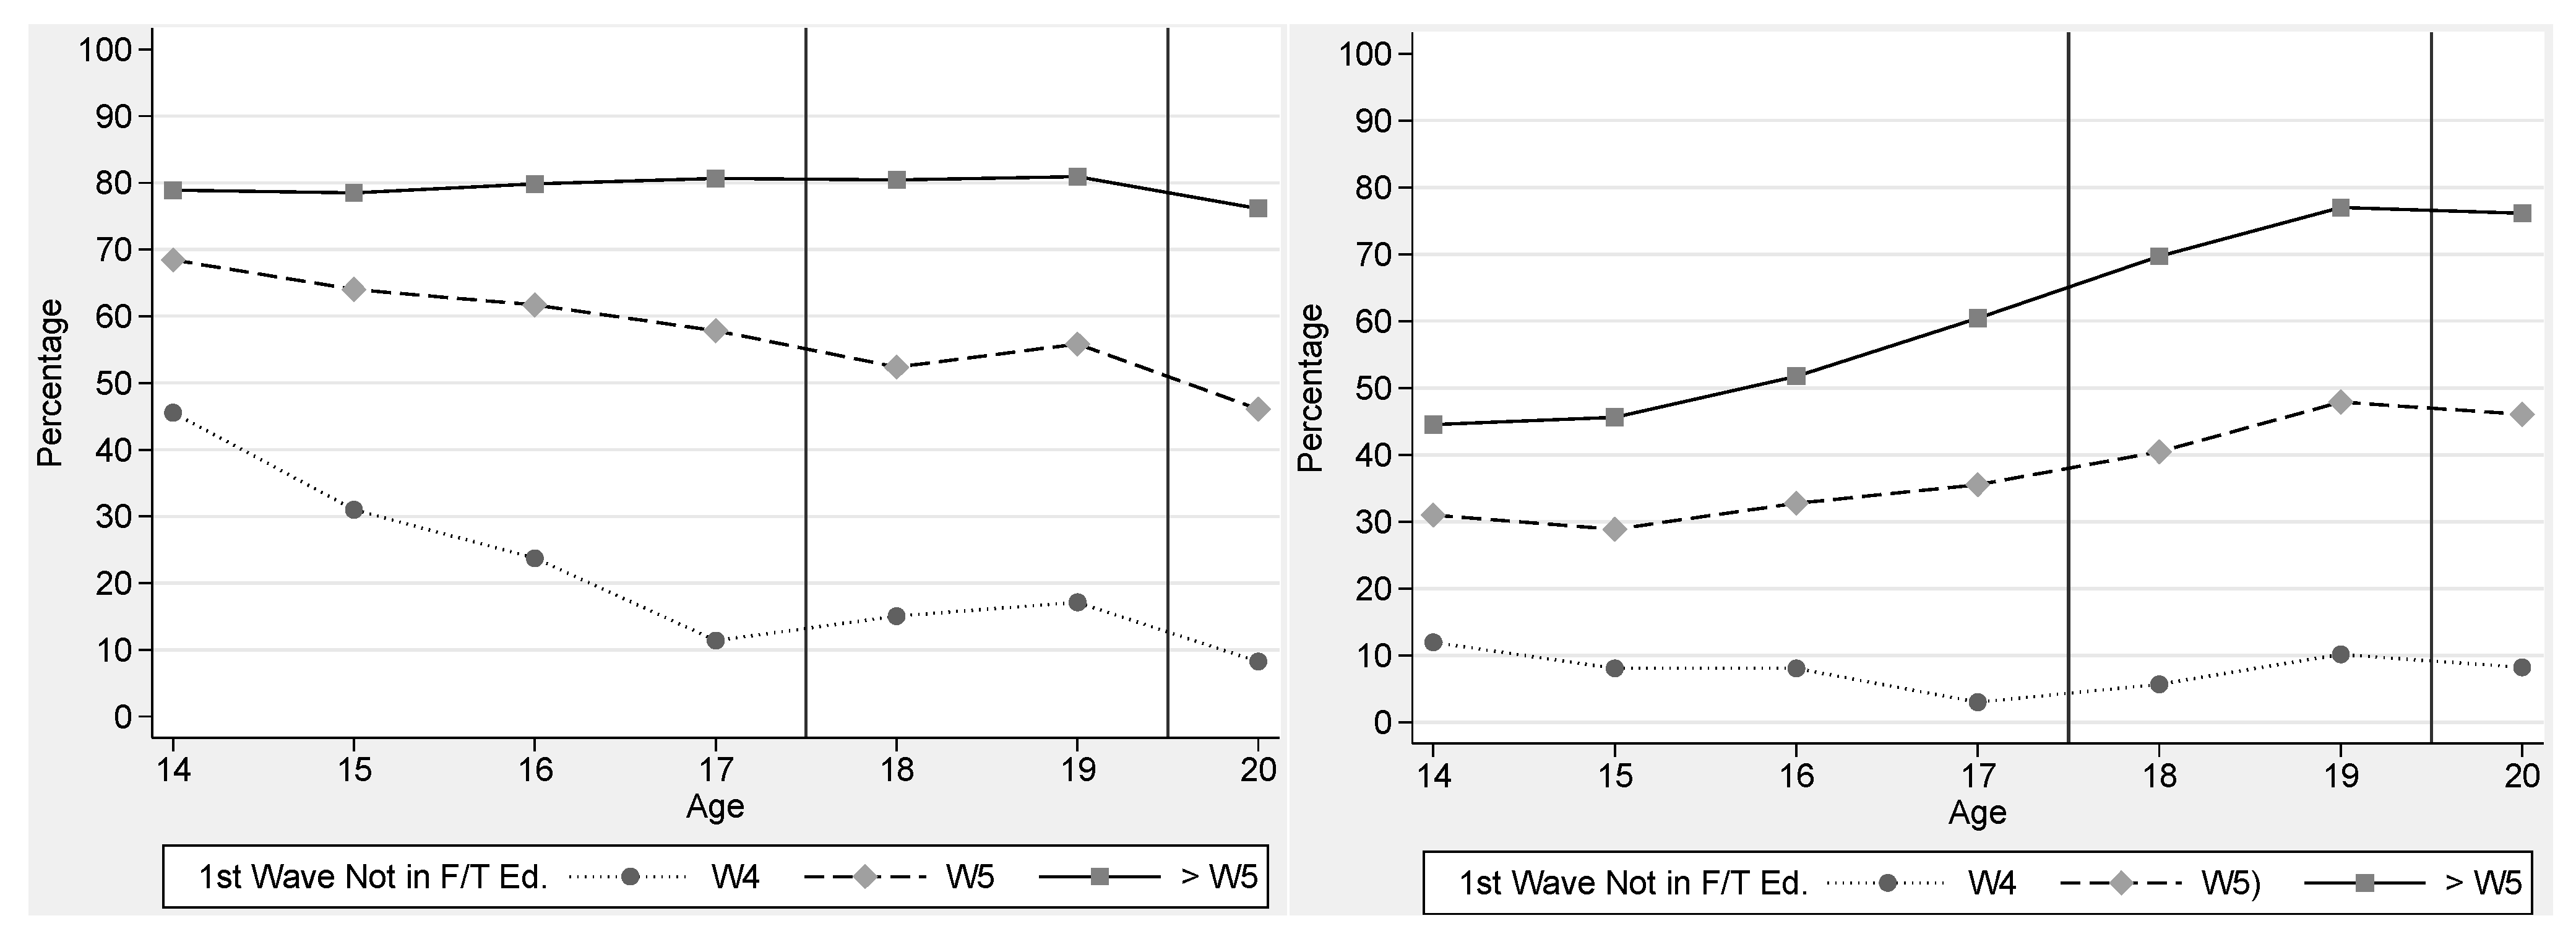
We start with the age 16 leaving decision. In
Figure 6 we divide the LSYPE sample into three groups: (i) those not in full-time education at Wave 4, the first interview following the minimum school leaving age of 16 (about a quarter of the sample); (ii) those who stayed on for another year but who were not in full-time education at Wave 5 (another quarter); and (iii) those who have stayed on in full-time education for at least another two years until A-levels or their equivalent are completed or beyond (about half). The Figure has the same design as the graphs in
Section 3.
Figure 6.
Percentage of young people who say they are likely (left panel) or very likely (right panel) to apply to university from Wave 1 (age 13–14) to Wave 7 (age 19–20), by the wave at which they first reported having left full time education. Notes: Wave 7 respondents with non-missing data on university expectations at all waves, university application, and activity status at Wave 4. Wave 7 weights applied. Unweighted sample size = 8029. Group sizes as follows: Left by Wave 4: 26.4%; left by Wave 5: 23.3%; still in full-time education at Wave 5: 50.3% (this group includes those who are still in full-time education by the end of the LSYPE).
Strikingly, all the decline through the teenage years in the percentage very or fairly likely to apply that we documented in
Figure 1 is concentrated in the two groups who do not stay on in full-time education at 16 for at least another two years,
i.e. those who have left by Waves 4 or 5 (left panel of the Figure). In these two groups, expectations of application start far lower and then fall. The decline is particularly large for the group who have left by Wave 4—from 46% at age 14 to 11% at age 17. Notably, this decline is fairly steady, wave by wave, to age 17—there is no evidence of a particularly sharp fall coming between ages 16 and 17 at the time of leaving school. While three-quarters of young people continuing in full time education for at least two years past age 16 have applied to university by Wave 7 (solid line), less than 1 in 10 have done so of the age 16 leavers (dotted line). Those that stay on for just one year are in an intermediate position (dashed line). Their expectations fall off from just under 70% viewing an application as likely at age 14 to just over 50% at age 18, with a little less than half having actually made an application by age 20 (Wave 7).
The right panel of
Figure 6 only re-enforces the story. The rise in the percentage “very likely” to apply comes among those staying on in full-time education past 16. Across Waves 1–4 the percentage continues to decline for those leaving full-time education at this age, although as in the left panel of the diagram there is then a modest rise to age 19. The increase in “very likely” is especially marked for the half of the sample who stay-on in education for at least two years past age 16 (solid line).
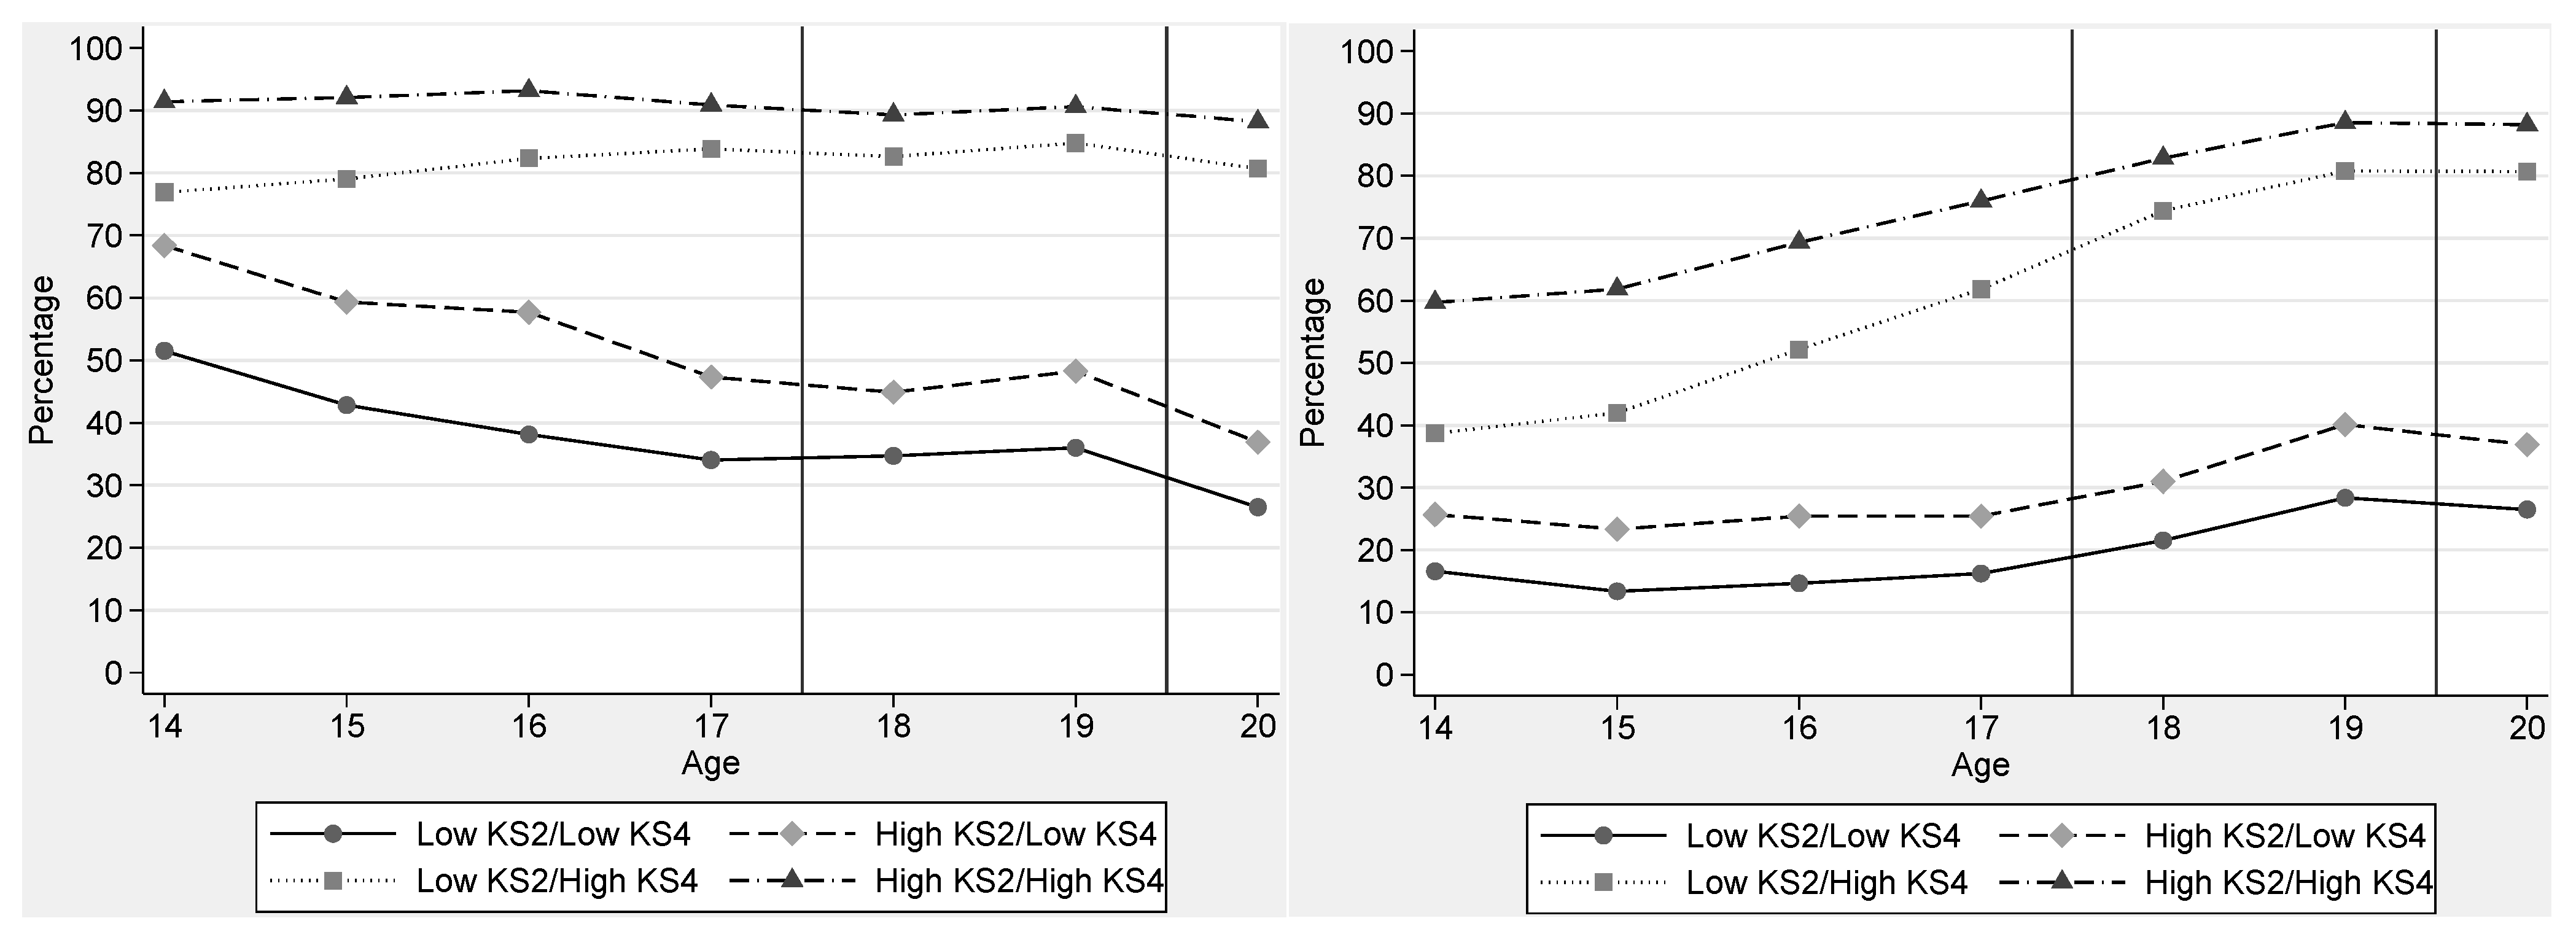
Figure 7 divides the sample into groups based on GCSE and KS2 scores. We use the same definition of high KS2 scores as in
Figure 5,
i.e., the top 40% of the distribution, and define high GCSE scores on the same basis (using the “capped 8” GCSE total points score). The graph shows the change in expectations for the four groups defined by combinations of these two binary variables indicating high or low (bottom 60%) of KS2 and GCSE scores. The key pattern here is again the lack of any apparent sharp change in expectations between ages 16 and 17,
i.e., when the GCSE results become known. The groups are far from being equal in size—the high KS2/low GCSE and low KS2/high GCSE groups each make up only about 1 in 10 of the sample.
As with
Figure 6, the patterns do not appear consistent with the hypothesis that the GCSE results suddenly provide a wholly exogenous update for young people on their academic ability and hence their suitability for university entry. The expectations of the high KS2/low GCSE group decline fairly steadily to age 17 (left panel of the Figure) or are flat if we restrict attention to a “very likely” expectation (right panel), while those of the low KS2/high GCSE rise pretty evenly, with the change between 15 and 16 similar to that between 16 and 17 (during which time GCSE results arrive).
Figure 7.
Percentage of young people who say they are likely (left panel) or very likely (right panel) to apply to university from Wave 1 (age 13–14) to Wave 7 (age 19–20), by Key Stage 2 and GCSE quintile groups. Notes: Wave 7 respondents with non-missing data on university expectations at all waves, university application, Key Stage 2 attainment and GCSE attainment. Wave 7 weights applied. Unweighted sample size = 7976.
Table 2 and
Table 3 exploit the information on leaving school and GCSE results in a different way. We estimate multiple regression models of the probability that a young person reports that they are likely to apply (either “very” or “fairly”) at age 17 in Wave 4—one model for those who said they were likely to apply at age 14 in Wave 1, and one model for those who did not report at that age that they were likely to apply. In effect, these are models of the W1 to W4 transitions:
Table 2 analyses the probability that an individual remains likely to apply at Wave 4 given that they said they were likely to apply at Wave 1 (we are not considering the intervening waves, so this is not a model of “survival” per se).
Table 3 analyses the probability that an individual switches to being likely to apply at Wave 4 given that they did not report that they were likely to apply at Wave 1.
Table 2.
Linear probability regression models of the probability that the young people say they are likely to apply when asked at Wave 4, using the subsample who said they were likely to apply at Wave 1.
Table 2.
Linear probability regression models of the probability that the young people say they are likely to apply when asked at Wave 4, using the subsample who said they were likely to apply at Wave 1.
| | 1. | 2. | 3. | 4. w/ School Fixed Effects |
|---|
| Constant | 0.551 *** | 0.559 *** | 0.684 *** | 0.692 *** |
| | (0.0151) | (0.0132) | (0.0137) | (0.0116) |
| High Education | 0.124 *** | 0.0798 *** | 0.0615 *** | 0.0513 *** |
| | (0.0152) | (0.0152) | (0.0140) | (0.0110) |
| H/h inc./£10k | 0.0377 *** | 0.0127 *** | 0.0100 ** | 0.0116 *** |
| | (0.00550) | (0.00440) | (0.00402) | (0.00443) |
| KS2 Z-Score | 0.159 *** | 0.00932 | 0.0119 | 0.0118 |
| | (0.00799) | (0.00946) | (0.00886) | (0.00799) |
| KS2 Missing | 0.0388 | 0.00687 | −0.00580 | −0.00833 |
| | (0.0333) | (0.0233) | (0.0200) | (0.0238) |
| Male | −0.0754 *** | −0.0365 *** | −0.0299 *** | −0.0405 *** |
| | (0.0131) | (0.0120) | (0.0113) | (0.0105) |
| Mixed | 0.136 *** | 0.128 *** | 0.0857 *** | 0.0808 *** |
| | (0.0301) | (0.0322) | (0.0284) | (0.0287) |
| Indian | 0.322 *** | 0.249 *** | 0.184 *** | 0.167 *** |
| | (0.0178) | (0.0186) | (0.0162) | (0.0304) |
| Pakistani | 0.313 *** | 0.271 *** | 0.203 *** | 0.204 *** |
| | (0.0319) | (0.0230) | (0.0200) | (0.0347) |
| Bangladeshi | 0.371 *** | 0.292 *** | 0.221 *** | 0.165 *** |
| | (0.0251) | (0.0242) | (0.0223) | (0.0565) |
| Black Caribbean | 0.273 *** | 0.261 *** | 0.208 *** | 0.182 *** |
| | (0.0415) | (0.0362) | (0.0417) | (0.0468) |
| Black African | 0.346 *** | 0.333 *** | 0.235 *** | 0.152 *** |
| | (0.0278) | (0.0253) | (0.0217) | (0.0394) |
| Other | 0.289 *** | 0.223 *** | 0.191 *** | 0.191 *** |
| | (0.0393) | (0.0307) | (0.0246) | (0.0337) |
| KS4 Z-Score | | 0.258 *** | 0.169 *** | 0.175 *** |
| | | (0.0115) | (0.0120) | (0.00972) |
| Not in FT Ed. | | | −0.445 *** | −0.440 *** |
| | | | (0.0199) | (0.0148) |
| N | 5481 | 5481 | 5481 | 5481 |
| R2 | 0.207 | 0.318 | 0.428 | 0.526 |
| Mean of dep. var. | 0.726 | 0.726 | 0.726 | 0.726 |
Table 3.
OLS regression models of the probability that the YP says they are likely to apply when asked at Wave 4, using the subsample who said they were unlikely to apply at Wave 1.
Table 3.
OLS regression models of the probability that the YP says they are likely to apply when asked at Wave 4, using the subsample who said they were unlikely to apply at Wave 1.
| | 1. | 2. | 3. | 4. w/ School Fixed Effects |
|---|
| Constant | 0.324 *** | 0.373 *** | 0.463 *** | 0.478 *** |
| | (0.0252) | (0.0240) | (0.0240) | (0.0245) |
| High Education | 0.0906 *** | 0.0694 *** | 0.0579 ** | 0.0728 *** |
| | (0.0273) | (0.0268) | (0.0254) | (0.0273) |
| H/h inc./£10k | 0.0123 | −0.0135 | −0.0150 | −0.0375 *** |
| | (0.0172) | (0.0144) | (0.0137) | (0.0134) |
| KS2 Z-Score | 0.115 *** | 0.0355 *** | 0.0434 *** | 0.0314 ** |
| | (0.0116) | (0.0132) | (0.0124) | (0.0144) |
| KS2 Missing | −0.241 *** | −0.0121 | −0.0805 ** | −0.0183 |
| | (0.0317) | (0.0369) | (0.0343) | (0.0547) |
| Male | −0.100 *** | −0.0686 *** | −0.0324 * | −0.00844 |
| | (0.0212) | (0.0207) | (0.0196) | (0.0212) |
| Mixed | 0.122 * | 0.163 *** | 0.139 ** | 0.114 |
| | (0.0727) | (0.0627) | (0.0643) | (0.0802) |
| Indian | 0.335 *** | 0.304 *** | 0.226 *** | 0.182 |
| | (0.0719) | (0.0725) | (0.0659) | (0.124) |
| Pakistani | 0.356 *** | 0.317 *** | 0.271 *** | 0.207 * |
| | (0.0656) | (0.0672) | (0.0660) | (0.119) |
| Bangladeshi | 0.399 *** | 0.336 *** | 0.283 *** | 0.274 |
| | (0.0834) | (0.0871) | (0.0762) | (0.177) |
| Black Caribbean | 0.355 *** | 0.389 *** | 0.298 *** | 0.357 *** |
| | (0.0864) | (0.0945) | (0.0946) | (0.132) |
| Black African | 0.513 *** | 0.498 *** | 0.394 *** | 0.265 |
| | (0.168) | (0.127) | (0.142) | (0.213) |
| Other | 0.471 *** | 0.401 *** | 0.331 *** | 0.417 *** |
| | (0.106) | (0.107) | (0.113) | (0.0976) |
| KS4 Z-Score | | 0.141 *** | 0.0967 *** | 0.113 *** |
| | | (0.0110) | (0.0111) | (0.0158) |
| Not in FT Ed. | | | −0.269 *** | −0.273 *** |
| | | | (0.0185) | (0.0224) |
| N | 1912 | 1912 | 1912 | 1912 |
| R2 | 0.125 | 0.183 | 0.263 | 0.500 |
| Mean of dep. var. | 0.259 | 0.259 | 0.259 | 0.259 |
Columns 2–4 include GCSE results and whether the individual leaves school as explanatory variables. We have warned against viewing these as exogenous variables. Rather, we are just using regression modelling to measure the associations between expectations and these variables in a convenient way. We use OLS regression despite the 0/1 nature of the dependent variables, estimating what are known as linear probability models. These models are convenient frameworks for including at the same time a range of other explanatory variables that we considered separately from one another until now: parental education (we include a dummy for higher education, whether degree level or not), family income (included as a continuous variable), gender, and ethnicity. We also include the individual’s KS2 score in all models (including a dummy variable where this is missing); both the KS2 score and GCSE results are standardised (they are measured in units of standard deviations). Recall that we have noted that the individual changes in expectations from wave to wave may be affected by noise as well as by any genuine shifts in opinion.
Column 1 shows that a one standard deviation increase in the KS2 score is associated with a 0.16 (
Table 2) and 0.12 (
Table 3) increase in the probability of the individual being likely to apply at Wave 4, controlling for family background and individual characteristics and for the Wave 1 expectations (through the estimation of separate models for the two sub-samples defined on those expectations). Both parental education and income are statistically significant in
Table 2, but the apparent income effect is small (a rise of £10k associated with an increase in the probability of only 0.04) and only parental education is significant in
Table 3. There are large differences by ethnic group, with all non-white groups having higher levels of expectations than the white reference group.
The impact of introducing the KS4 score in column 2 is striking. The KS2 score is driven to statistical insignificance in
Table 2 and the estimated coefficient is hugely reduced in
Table 3. A one standard deviation increase in GCSE score is associated with a rise of 0.26 in the probability of remaining likely to apply (
Table 2) and a 0.14 rise in the probability of switching to being likely to apply (
Table 3)—controlling for all the other variables in the model including the KS2 score. We are of course unable to say how much of this represents the causal impact of the arrival of the GCSE results. The estimated coefficients of almost all of the family and individual characteristics fall between columns 1 and 2, reflecting the fact that some of the impact of these variables comes through the GCSE results. In column 3 we add a dummy variable for not in full-time education at 17 (
i.e. leaving at 16). In line with
Figure 6, the estimated coefficients are very large in both tables and the coefficients of other variables, including now the GCSE score, are again diminished. We experimented with introducing quadratics in KS2 and KS4 scores (and again in the later regressions in
Table 5 and
Table 6). Perhaps unsurprisingly, these fit the data better than a linear specification for test scores but the impact on the coefficients of other variables in the model is quite mild.
5.2. The Influence of Schools
In the last column in each of
Table 2 and
Table 3 we recognise the roles that schools may play in influencing pupil expectations about university application—something we have again not considered until now (other than through the test and exam score variables which schools will have an impact on). We do this in a simple way through the addition to the models of a set of dummy variables for the schools attended at age 14,
i.e. by allowing for school fixed effects. The key thing to note is the substantial rise in R-squared in both tables, by 0.10 in
Table 2 and 0.24 in
Table 3. This implies that schools seem really quite important in the explanation of age 17 expectations (the school attended at age 14 may not be the same as that at age 17), conditional on the age 14 expectations (remember we are estimating separate models for those saying at age 14 that they are likely to apply and those saying they are unlikely to do so). This may be because of direct encouragement of educational aspirations, it may reflect peer influences on expectations, or it may reflect unmeasured pupil or family attributes correlated with school admissions. We are unable to conclude between these different explanations for why schools appear to “matter”.
6. From Expectation to Actual Application
Finally, we focus on how expectations following the age 16 events—the GCSE results and the decision whether to stay on at school—convert into the decision on whether actually to apply to university. We switch to comparison of those who are “very likely” compared with anything less at this point on the grounds that most planning to apply by age 20 are likely to have a good degree of certainty by this point. Nevertheless, analysis of “likely” compared to “unlikely” reveals similar patterns, but lower overall levels of application in all groups.
Table 4 conditions on the age 16 leaving decision by focusing on the three-quarters of the sample who stay on in full-time education (two of the three groups analysed in
Figure 6). This is overwhelmingly the main route to university by age 20. Among those who leave at 16, only 8% apply by age 20 and only 3% are actually attending university at that point (or have done so and then dropped out). The figures for those staying on in full-time education are 67% and 52%.
Table 4 shows for this majority group how the percentage applying differs between those who said they were “very likely” to apply at Wave 4 (just under half) and the rest, and within each of these two sub-samples how the application rate varies across the four groups defined by combinations of parental education and KS2 achievement that we focused on in
Figure 5. Respondents will have taken their GCSE exams a year earlier and at the time of interview for Wave 4 will be taking or awaiting the results of AS exams (the first stage of the two-year A-level course). They are only a few months before the point at which they can actually apply to university for the first time.
Table 4.
Changes in expectations: % of each group that have applied by Wave 7 by whether they are very likely to apply at Wave 4.
Table 4.
Changes in expectations: % of each group that have applied by Wave 7 by whether they are very likely to apply at Wave 4.
| Group | Group | Very likely to apply at W4? | % applied by W7 | Sample size (weighted) |
|---|
| High parental education | High KS2 | Yes | 96.8 (0.52) | 1223 |
| Low parental education | High KS2 | Yes | 92.3 (1.05) | 755 |
| High parental education | Low KS2 | Yes | 93.6 (1.37) | 392 |
| Low parental education | Low KS2 | Yes | 66.1 (2.51) | 433 |
| All | All | Yes | 92.1 (0.56) | 2968 |
| High parental education | High KS2 | No | 65.7 (2.84) | 295 |
| Low parental education | High KS2 | No | 52.1 (2.36) | 488 |
| High parental education | Low KS2 | No | 41.4 (2.42) | 451 |
| Low parental education | Low KS2 | No | 37.9 (1.39) | 1565 |
| All | All | No | 54.3 (1.16) | 3331 |
Among those who say at Wave 4 that they are very likely to apply to university, over 90% actually do so by age 20 if they come from the high parental education group and/or the high KS2 group (defined as in
Figure 5). Importantly, the low parental education/high KS2 group have an application rate that is very close to the high parental education/high KS2 group. Only the low parental education/low KS2 group have a notably lower rate, although it is still 66%.
However, among those who do not say at Wave 4 that it is “very likely” that they will apply, many fewer actually make applications. In that sense the expectation expressed does appear to provide a good guide to behaviour. The application rate for the high parental education/high KS2 group reaches 66%, but only half of the low parental education/high KS2 group end up applying. It should be noted that these are two relatively small groups, making up only about 1 in 8 of all those who stay on in full-time education at 16.
In
Table 5 and
Table 6 we build on these results by estimating OLS regressions of a similar form to those in
Table 2 and
Table 3 for the sample of age 16 stayers. However, in contrast to our regression analysis of the Wave 1 to 4 transitions, in this case we separate the stayers as in
Table 4, between those who say it very likely they will apply (
Table 5) and those not giving this response (
Table 6). (In
Table 2 and
Table 3 we separated the sample between those “likely”, whether “very” or “fairly” and the rest.) Columns 1 and 2 in each case have the same specification as the models in
Table 2 and
Table 3. We also carried out the same analysis using logistic regression as a robustness check given the high value of the mean of the dependent variable in
Table 5. This did not change the story presented appreciably and we have chosen to report the OLS regression models for ease of comprehension (and comparability with school fixed effects models, which of necessity use OLS regression). Parental education, family income (see [
5] for details of the LSYPE’s measurement of this factor), KS2 score, and non-white ethnicity are all positively associated with the conversion of a “very likely” potential applicant into an actual applicant (
Table 5) or of someone of a less positive opinion (
Table 6).
Gender however is insignificant in both cases—conditional on the individual’s Wave 4 view of the likelihood of application, gender is uncorrelated with the application decision (controlling for other observed factors). (It should be noted that we have conditioned on not leaving school.) Non-white ethnicity has a much stronger association with the actual application for those who do not say at Wave 4 that they are very likely to apply (
Table 6), with estimated coefficients in the range 0.2 to 0.4.
Column 2 in each table again shows KS4 scores to be very strongly associated with actual application. This time the KS4 outcomes clearly pre-date the Wave 4 opinions by which we divide the sample between the two regression models. However, it would again be wrong to see the KS4 scores as exogenous—unobserved influences on the application decision may be correlated with KS4 success.
Parental expectations may be one such influence. We include a dummy variable into our regressions for parental expectations at Wave 4, focusing on the column 2 specification which includes the KS4 score. The coefficients on most other variables moderate in size, while the dummy for parental expectations itself gains a large, positive and statistically significant coefficient (0.31 in the
Table 5 model and 0.20 in the
Table 6 model). Finally, as in
Section 5, the fit of the models is much improved by the addition of dummies for the Wave 1 schools (column 3 in each table) although the interpretation again is not straightforward.
Table 5.
Linear probability regression models of the probability that the young person says they have applied to university by Wave 7, using the subsample who were in full time education at Wave 4 and said they were very likely to apply to university in the same interview.
Table 5.
Linear probability regression models of the probability that the young person says they have applied to university by Wave 7, using the subsample who were in full time education at Wave 4 and said they were very likely to apply to university in the same interview.
| | 1. | 2. | 3. w/ School Fixed Effects |
|---|
| Constant | 0.813 *** | 0.751 *** | 0.770 *** |
| | (0.0157) | (0.0171) | (0.0117) |
| High Education | 0.0538 *** | 0.0324 *** | 0.0340 *** |
| | (0.0112) | (0.0107) | (0.0101) |
| H/h inc./£10k | 0.0176 *** | 0.00793 ** | 0.00486 |
| | (0.00358) | (0.00311) | (0.00361) |
| KS2 Z-Score | 0.0708 *** | −0.0206 * | −0.0255 *** |
| | (0.0106) | (0.0114) | (0.00845) |
| KS2 Missing | −0.0139 | −0.0658 *** | −0.0761 *** |
| | (0.0303) | (0.0253) | (0.0206) |
| Male | −0.0174 | −0.00144 | 0.00750 |
| | (0.0111) | (0.0103) | (0.01000) |
| Mixed | −0.0147 | −0.00157 | 0.0124 |
| | (0.0322) | (0.0266) | (0.0265) |
| Indian | 0.0907 *** | 0.0892 *** | 0.0804 *** |
| | (0.0202) | (0.0158) | (0.0245) |
| Pakistani | 0.0996 *** | 0.0965 *** | 0.0883 *** |
| | (0.0211) | (0.0210) | (0.0303) |
| Bangladeshi | 0.0897 *** | 0.0780 *** | 0.0672 |
| | (0.0261) | (0.0290) | (0.0474) |
| Black Caribbean | 0.0832 *** | 0.116 *** | 0.150 *** |
| | (0.0300) | (0.0301) | (0.0403) |
| Black African | 0.109 *** | 0.139 *** | 0.138 *** |
| | (0.0337) | (0.0261) | (0.0324) |
| Other | 0.0376 | 0.00695 | 0.0252 |
| | (0.0352) | (0.0297) | (0.0277) |
| KS4 Z-Score | | 0.196 *** | 0.175 *** |
| | | (0.0178) | (0.0122) |
| N | 3559 | 3559 | 3559 |
| R2 | 0.0796 | 0.163 | 0.385 |
| Mean of dep. var. | 0.813 | 0.813 | 0.813 |
Table 6.
Linear probability regression models of the probability that the young person says they have applied to university by Wave 7, using the subsample who were in full time education at Wave 4 and said they were less than very likely to apply to university in the same interview.
Table 6.
Linear probability regression models of the probability that the young person says they have applied to university by Wave 7, using the subsample who were in full time education at Wave 4 and said they were less than very likely to apply to university in the same interview.
| | 1. | 2. | 3. w/ School Fixed Effects |
|---|
| Constant | 0.298 *** | 0.329 *** | 0.348 *** |
| | (0.0209) | (0.0200) | (0.0222) |
| High Education | 0.105 *** | 0.0907 *** | 0.0981 *** |
| | (0.0234) | (0.0226) | (0.0239) |
| H/h inc./£10k | 0.0448 *** | 0.0174 | 0.0119 |
| | (0.0110) | (0.0109) | (0.0118) |
| KS2 Z-Score | 0.129 *** | 0.0105 | 0.00227 |
| | (0.0113) | (0.0128) | (0.0153) |
| KS2 Missing | −0.138 *** | 0.136 *** | 0.0662 |
| | (0.0528) | (0.0380) | (0.0553) |
| Male | 0.00311 | 0.0291 | 0.00609 |
| | (0.0206) | (0.0195) | (0.0209) |
| Mixed | 0.0889 | 0.0912* | 0.117 * |
| | (0.0586) | (0.0546) | (0.0615) |
| Indian | 0.406 *** | 0.373 *** | 0.411 *** |
| | (0.0520) | (0.0427) | (0.0936) |
| Pakistani | 0.205 *** | 0.180 *** | 0.314 *** |
| | (0.0443) | (0.0387) | (0.0919) |
| Bangladeshi | 0.376 *** | 0.294 *** | 0.407 *** |
| | (0.0670) | (0.0619) | (0.139) |
| Black Caribbean | 0.192 *** | 0.215 *** | 0.296 *** |
| | (0.0689) | (0.0554) | (0.107) |
| Black African | 0.350 *** | 0.360 *** | 0.317 ** |
| | (0.109) | (0.0954) | (0.126) |
| Other | 0.208 ** | 0.154 * | 0.133 |
| | (0.0891) | (0.0816) | (0.0896) |
| KS4 Z-Score | | 0.220 *** | 0.249 *** |
| | | (0.0144) | (0.0187) |
| N | 2541 | 2541 | 2541 |
| R2 | 0.113 | 0.192 | 0.407 |
| mean of dep. var. | 0.121 | 0.121 | 0.121 |
7. Conclusions
In this paper, we have produced new evidence on how the expectations of applying to university of young people in England change through the teenage years and how these expectations translate into actual applications. One important caveat is that the LSYPE data pre-date the large rise in maximum university fees in 2012 and the associated changes in support for low income students. It will be important to explore possible changes as new data emerge in the coming years from young people considering entry to higher education under the new system.
In common with previous studies, we find that expectations are high at age 14, with over two-thirds of young people at this age reporting it “very” or “fairly” likely that they will apply to university. This is substantially higher than the proportion which ends up doing so. However, using the longitudinal data available to us we also document less commonly highlighted aspects of young people’s expectations during this period. We find that the percentage expecting to apply falls by about 10 points between ages 14 and 17. As well as the downward trend, we also document a pattern of expectations hardening through the teenage years: young people tend to move to become either “very likely” to apply or “not at all likely”, rather than anywhere in between. The result is that the proportion thinking they are “very likely” to apply rises, from about a third at age 14 to two-fifths at age 17. In addition, there is noise and/or uncertainty in young people’s expectations. Individuals move in and out of the different categories of being likely to apply, so that the gross flows are larger than the net flows. The largest gross flows are between “very” and “fairly” likely, rather than between these two states taken together and being “unlikely” to apply.
We confirm that there is a strong correlation between expecting to apply at age 14 and actually applying by age 20. The expectations data are informative in this sense. The proportion who apply to university by age 20/21 varies from 79% for those who at age 14 say that they are “very likely” to apply down to 13% for those who say that they are “not at all likely” to apply.
We also document important trends in terms of family background and prior attainment. Expectations start lower and fall faster for those from more deprived family backgrounds. The gap between teenagers with a parent with a degree and parents in the lowest educational group (no age 16 qualifications) is about 35 percentage points at age 14 and widens thereafter by about 5 percentage points. Expectations are particularly high for children of parents with a degree—this group stands out from all those below. Likewise, university expectations are strongly graded by KS2 attainment. The gap in the percentage likely to apply between top and bottom fifths of the KS2 distribution is about 50 percentage points at age 14 and widens by another 10 points by age 17, driven by a fall in expectations at the bottom of the distribution.
Importantly, however, our results suggest that a high KS2 score is more important for the path of an individual’s expectations than an advantaged family background in the sense that the group with high KS2/low parental education (about a fifth of the cohort) have higher expectations of application than the group with low KS2/high parental education. Nevertheless, by age 17 nearly 30% of this high KS2/low family background group do not report being likely to apply to university and a similar proportion do not go on to make an application by age 21.
The decline in expectations through the teenage years is concentrated among those who leave full-time education at age 16 and, to a lesser extent, a year later. There is no decline at all in expectations among those who continue in full-time education to do A-levels or equivalent qualifications. Indeed, schools appear to be an important factor in sustaining positive expectations of application and in changing expectations from being negative to positive, although we have not explored the reasons for this in this paper.
These findings also point to some potentially important implications for policymakers and practitioners. Our observations were both that expectations are informative, in the sense of usefully predicting the probability of application over and above exam results, and that schools are able to able to play a role in maintaining and raising expectations, suggest a potential value in schools tracking their pupils’ educational expectations over time. This will strengthen their ability to support pupils in a position to benefit from higher education, but in need of encouragement to keep them on track. Furthermore, post-14 is an appropriate time for interventions of this kind, since individuals are still adjusting their expectations; waiting until post-16, on the other hand, may be too late.


