Article

Investigating Gender and Racial/Ethnic Invariance in Use of a Course Management System in Higher Education

1
Faculty of Education Southwest University, No.2 Tiansheng Road, BeiBei District, Chongqing 400715, China
2
School of Education, 350 Huntington Hall, Syracuse, NY 13244, USA
3
Information Technology Department, West Virginia University, PO Box 6500, Morgantown, WV 26506-6500, USA
*
Author to whom correspondence should be addressed.
Educ. Sci. 2015, 5(2), 179-198; https://doi.org/10.3390/educsci5020179
Submission received: 8 April 2015 / Accepted: 2 June 2015 / Published: 10 June 2015
(This article belongs to the Special Issue Critical Issues in Educational Technology)

Abstract

:
This study focused on learning equity in colleges and universities where teaching and learning depends heavily on computer technologies. The study used the Structural Equation Modeling (SEM) to investigate gender and racial/ethnic heterogeneity in the use of a computer based course management system (CMS). Two latent variables (CMS usage and scholastic aptitudes)—with two moderation covariates (gender and ethnicity)—were used to explore their associational relationships with students’ final grades. More than 990 students’ CMS data were collected from courses at a Midwest public university in the United States. The final model indicated that there was gender and racial/ethnic invariance in the use of the CMS. Additionally, CMS use was significantly positively associated with students’ academic achievement. These findings have policy and practical implications for understanding the correlation between technology use and academic achievement in colleges and universities. This study also pointed out future research directions for technology use in higher education.

1. Introduction

The traditional higher education institution has been transformed by the convergence of powerful new information and instructional technologies. Today, most of the faculty and students used technology in and outside of the class for educational activities and their professional developments [1]. The dramatic increase in computer technology use in higher education is driving changes in how faculty approach teaching, how much they use computer technology, and how courses are offered [2]. For example, online degree and distance education programs have created wider access to educational resources for learners who are geographically away from the campus. Computer based Course Management Systems (CMS) such as Blackboard, Desire2Learn, and Moodle allow students to regularly communicate, share experiences, and discuss questions posted by their instructors or academic partners across different majors, departments, or universities [3].
Along with the rapid increase in the use of technologies at universities has come greater concern about inequalities in the access and use of computer technologies (including personal computer, mobile, and iPad, etc.) [4]. In most cases, universities with higher tuition rates and/or more resources can purchase more equipment and provide greater access to the most updated technologies than did universities with fewer resources [5]. It is important to note that racial/ethnic minority students are less likely to attend higher cost universities due to their lower family incomes [6]. Inequity also may result when schools and faculty require students to purchase a computer and a student who has limited financial resources could be disadvantaged. However, providing public computer facilities does not eliminate inequalities. Given widely differing experiences prior to attending university, students could have various levels of computer proficiency. Digital inequity in higher education is rooted in K-12 technology experiences where the effects of resource inequities are even more pronounced [7]. The different levels of exposure to computers in childhood may cause students to have different attitudes towards computer use and, result in varying effectiveness for computer use. Those who have a great deal of experience with computers are more likely to incorporate new technology into their work and study habits. However, those who have few or unpleasant experiences or who hold negative attitudes towards the new technologies may not believe that computer use can enhance their work efficiency [8]. Such inequalities regarding computer use in higher education may ultimately result in differences in students’ academic achievement.

1.1. Gender Differences

Historically, gender was an important factor in the digital divide [9,10,11]. Gender disparity in the computer domain has attracted constant attention from scholars since computers were introduced in the educational field. Early studies suggest that disparities influence computer technology use for women when compared to men of similar ages and professions [12,13,14]. For example, Shashaani [15,16] summarizes that male and female students differed in computer ownership, computer use, and attitude towards computers. Middendorf found that females visited public computer labs less frequently than males and were also somewhat less likely to have Internet access at home (45% vs. 63%) via a self-reported survey [17]. The study also found that male students spent about five hours more per week on a computer than did female students in general.
In more recent years, although gender seems no longer play a significant role in overall technology access and use, gender disparity still exists in the purposeful use of particular types of technology. For example, a university where all students had their own laptops, students tended to use them in the same fashion, but females still rated their skill levels lower than males [18]. In another study, Weber and Custer surveyed 348 middle school students and 311 high school students enrolled in technology education classes in Wisconsin [19]. They found striking contrasts between males and females in technology activities. Males were much more interested in using computers to produce designs and make projects, while females liked to solve problems by collaborating with peers. Nicole and Rosanna [20] surveyed 238 undergraduate students and found gender difference for online behavior: men reported that they played more games on social networking sites while women reported that they tended to use social networking sites to maintain relationship. Deursen and Dijk [21] surveyed a largely representative sample including 108,000 people to examine digital divide. They classified computer use into 7 categories: personal development, leisure, commercial transaction, social interaction, information, news, and gaming. The findings showed that gender was a significant factor associated with different uses of computer. Males preferred to play games and read news online, use advanced software; whereas females tended to use computers for leisure and social interaction such as emailing, instant messaging and shopping. In addition, females used computers mainly to complete academic tasks or study, whereas males were motivated by a variety of personal purposes for computer use.

1.2. Race/Ethnicity Difference

Since the United States entered the “information age”, inequity for economically disadvantaged groups in terms of accessing computer technologies has become a more pressing issue. Non-Caucasian, especially from African American and Hispanic populations, often have much lower annual incomes than Caucasians and less chance of computer access [6]. Racial/ethnic differences in technology use are reflected through various aspects of Internet use, access to information and communication technologies among college students [22]. The ethnic digital gap is associated with experiences, attitudes and perceptions towards computers and the Internet. Slate, Manuel, and Brinson [22] studied more than 200 Hispanic college freshmen at a southwestern university and found that students whose primary language at home was English felt that the Internet was more useful than those whose primary language at home was Spanish. The English-speaking group reported less anxiety in technology use in class, while the Hispanic-speaking group more frequently asked for help to learn computer skills through a class or from friends. Minority college students who faced greater obstacles accessing technology tended to be less willing to use Internet and computers for study, and less likely to perceive computers and the Internet as enhancing their work efficiency [23].
Although literature mentioned above reflects racial/ethnic inequality one decade ago, the gap has been enlarged with the development of information technologies in recent years. The Caucasian group increasingly gained access to more information than the minority group. Information technologies became potential accelerators and lead to the formation of disadvantaged technology users [24]. Wei and Hindman [25], for example, found that racial/ethnic status was more strongly related to the use of most updated IT than with that of traditional IT, and that the differential use of the most updated IT was associated with a greater knowledge gap than that of traditional media. As for the nature of computer and Internet use, students from different racial groups used the computer and the Internet for different purposes. Junco [26] conducted a survey of college students (n = 2359), along with observations or other logging research methods. The study found that Hispanic college students used the Internet networking site more often for entertainment rather than for academic purposes and social communication. These recent studies suggested that the digital divide in recent years even matters more than before, practically and theoretically. After all, the information technologies developed in recent years requires more research to examine their academic use across gender and racial/ethnic groups in higher education.

1.3. Why Study the Use of CMS

Despite a large number of research studies illustrating the existing gender and ethnicity divide from perspectives of computer access, process, and attitude, most of these studies were conducted in the broad context of computer technology. Few studies have examined whether or not the divide found in the broad context of technology also affects students’ use of a specific educational computer software and, if so, how. If such inequity exists, it is also unknown whether students’ academic achievement can be associated with the use of a specific computer-based educational system for learning (e.g., Blackboard). Researchers have argued that computer-based educational software enriches students’ learning experiences and also promotes their academic outcomes [27]. However, these studies failed to report the sample ratio of ethnicity and gender composite. Therefore, it is risky to draw a general conclusion that computer-based educational technology would be beneficial for all students regardless of their backgrounds. In order to further understand how efficiently course management systems reinforce students’ academic achievement, it would be clearer to break down the investigation by gender and ethnicity. Unfortunately, only very few studies have been conducted to examine the inequality issue in the specific CMS settings. These studies used small samples and were restricted to one or two course subjects. Further, they often used traditional statistical methods (e.g., descriptive statistics, t-test, or regression) to analyze data that might have improper statistical properties for studying theoretical constructs such as academic achievement and computer literacy [28,29].
Blackboard CMS, currently used by 75% of colleges and more than half of the K-12 districts in the United States [30], is one of the most widely used CMSs around the world. It is built upon computer technology that provides a variety of instructional functions. Some functions are intended to provide students with extra materials to enrich course contents, such as references, self-test, a help center, and quiz modules. Students can complete assignments online and obtain feedback instantly. Communication functions, such as chat rooms, private emails, and announcements, supply an additional way of communication that supplements traditional face-to-face interaction or serves as an online interactive platform for distance education. However, Blackboard Vista is not self-explanatory CMS software. In order to take full advantage of the learning system, students must have basic computer and software skills. A study of college students’ perceptions of Blackboard CMS as e-learning tools indicated that some college students need further training before CMS could actually serve as an effective learning tool [31]. While users’ computer literacy backgrounds are different, students also may have various attitudes, perceptions, and competences with CMS use. In more recent literature, Unal and Unal [32] compared the CMS with Moodle in terms of users’ friendliness and concluded that functions embedded in the CMS were hard to use for low computer literacy users and further suggested that use of Moodle in online courses could be a suitable alternative to the current CMS. The study inferred that the effectiveness of Blackboard CMS was partially dependent on students’ initial knowledge of computer technologies. Additionally, a recent review of the literature on CMS courses found that variation exists in the perceptions of satisfaction and learning outcomes by students [33]. So inequality issues regarding the CMS effectiveness and students’ attitudes toward and use of such systems were of increasing concern to educational administrators [34]. Wei, Peng, and Chou [35] surveyed 381 college students and analyzed their actual-use CMS logs and self-reported data, and found that CMS actual use had significant mediating effects on online learning performance, and perceived usefulness of interactive CMS functions affected online learning performance. However, this study did not explore gender or racial/ethnic differences among their participants from one online-course at three universities.
The purpose of this study was to employ a combination of course management tracking data and student demographic information to determine if a computer based course management system provided learning equality for academic success to students from different backgrounds. Specific research objectives were to: (1) examine whether there were group effects (i.e., gender and race/ethnicity) on the undergraduates’ CMS use behaviors for learning purposes; (2) investigate how CMS use was associated with students’ final course grades; and (3) examine the correlation between the students’ scholastic aptitude and CMS use.

2. Methods

2.1. Sample

The data were drawn from a convenience sample of students enrolled during Spring 2010 at a large midwest public university. The study’s data were collected ex-post facto from university records. Student participation in this study depended on instructors’ use of the Blackboard Vista system. Most of the students were first- or second- year undergraduates who were born around 1990. The sample consisted of 993 students enrolled in a 200-level Anthology course, Biology course, and a 100-level Chemistry course. The three particular subjects were selected since the instructors in the class used CMS for teaching frequently during that semester. The multi-course subjects enlarged the number and variety of the sample and thus could provide methodological benefits to analysis, such as increased external validity, statistical power, and a control of instructor variance. These three courses were selected for this study because faculty actively used Blackboard Vista for teaching and learning. All three instructors uploaded course PPT slides, readings, and other course related materials online and recommended their students to preview and overview courses by checking these online materials. They also required their students to discuss course contents with their classmates and ask teachers questions in the discussion board.
Among this sample, 774 students were selected for the analysis after extraneous observations were removed. The extraneous observations included: the records in which CMS automatically created for experiments, instructors manually input in error, students who signed for course but fail to attend, and students who took two of the three selected courses in the same semester. If a student who took two courses were treated as two observations, this would cause multicollinearity in the later analysis. The sample was comprised of 402 females (52%) and 372 males (48%). The students’ mean age was identical with the university mean age of 20. Approximately 1.8% of participants self-identified as African American, 5.5% as Asian American/Pacific Islander, 3.4% as Hispanic/Latino, 0.3% as Native American/Alaskan Native, 86.8% as Caucasian, and 2.2% as other or preferred not to respond. These percentages were similar to that of the university’s overall demographics, except the percentage of African Americans is slightly under representation. Table 1 provides a summary of the student demographics as compared with the university average. Overall, student ethnicity, and age represented in this sample were similar or nearly identical to the larger sample and the university population. Women were slightly overrepresented in the study sample.
Table 1. Summary of student demographics.
SampleUniversity Population
Ethnicity (percentage)
 African American1.82%3.50%
 Native American/Alaskan Native0.28%0.34%
 Asian American5.46%5.45%
 Caucasian86.83%85.00%
 Hispanic American3.36%3.11%
 Other & Not Reported2.24%2.60%
Gender (percentage)
 Female51.90%42.40%
 Male48.10%57.60%
Age (mean)20.1320.60

2.2. Measures of Constructs

This study involved two constructs: scholastic aptitude and computer use behavior. Each construct was measured by multiple indicators.
Scholastic aptitude was defined as an individual’s potential ability to perform in scholastic and educational activities. Earlier studies with children used IQ scores to evaluate children’s cognitive development [36]. An adult’s scholastic aptitude is highly correlated with measures of his or her Scholastic Aptitude Test (SAT)/American College Test (ACT) scores and high school grades [37,38]. In this model, scholastic aptitude, the immeasurable and unobservable latent variable, is represented by current GPA scores, SAT verbal, SAT mathematic, and SAT writing scores. These variables were collected through the enrollment management system.
Computer use behavior referred mainly to a student’s involvement with computers as part of academic work. Many studies found that a student’s involvement with a computer is highly correlated with his or her attitude towards computers and use efficiency [39]. Students who frequently use computers to work develop greater control of technology; the ability to use a computer efficiently will, in turn, probably enhance these students’ positive attitudes towards computer use. In addition, researchers have found that a student’s computer use ability can be reasonably predicted by aptitude [40]. The latent construct computer use behavior was examined by the Blackboard Vista course management system. The CMS routinely collects individual student’s information when he or she studies with electronic tools embedded in the system. There are twelve tool elements in CMS in total, but most are not used often by instructors. Hence, five commonly used tool elements were selected for analysis. The five indicator variables were collected automatically by the system and harvested across numerous courses within the institution through a database query. The five indicator variables in the Blackboard Vista course management system are described in Table 2.
Table 2. Description and data type for course management system (CMS) use indicator variables.
Indicator Variable (Label)DescriptionType
Discussion postings read (DisR)The total number of discussion postings opened by the student. If a student opens the same discussion posting multiple times, the system records each entry.Interval (Min = 1, Max = 191)
Content folder viewed (Content)The total number of content files opened by the student. If a student opens the same content file multiple times, the system records each entry.Interval (Min = 1, Max = 823)
Assessments completed (Assess)The number of assessments completed by the student. If a student opens the same assessment task multiple times, the system records each entry.Interval (Min = 1, Max = 6)
Web link viewed (Web)The total number of web links associated with the course opened by the student. If a student opens the same link multiple times, the system records each entry.Interval (Min = 1, Max = 111)
Files viewed (File)The number of course files opened by the student. If a student opens the same course file multiple times, the system records each entry.Interval (Min = 1, Max = 280)

3. Analysis Results

Mean, standard deviation, skewness, and kurtosis indices for each observed indicator are provided in Table 3 and Table 4. These descriptive statistics described the data separately by each covariate (gender and ethnicity). Non-normal indicators may bias estimates of model fit, model parameters and standard errors in structural equation model analyses [41]. With the original indicator variables, highly skewed and kurtotic indicators were identified. Based on the criteria of skewness > 2.0 and kurtosis > 7.0 [42], variables such as “Web Links Viewed” and “Assessments Began” were considered moderately non-normal. Log transformations were applied to reduce the variable non-normality [41]. After the log transformations were made, all the skewed and/or kurtotic indices for variables were within the appropriate range. In addition, the robust estimator of Maximum Likelihood Estimation with Robust Standard Errors (MLR) was used to attenuate the problems of non-normality of observations [43].
Because the measures of SAT scores and the uses of course management tools were in different scales, the standard errors for variables ranged from approximately one or two units to several hundred units. The various magnitudes of standard errors led to a non-convergence problem. In order to resolve this issue, scales of SAT scores were standardized to a level comparable to other indicator variables in the data.
Table 3. Descriptive characteristics of the study sample by gender.
Indicator/Outcome VariablesMeanSDSkewnessKurtosis
MaleFemaleMaleFemaleMaleFemaleMaleFemale
Academic Aptitude
 GPA2.843.010.860.74−0.67−0.89−0.190.60
 SAT_Verbal567.52547.7774.1777.340.020.23−0.08−0.29
 SAT_Mathematic636.97564.6377.7983.91−0.36−0.020.07−0.38
 SAT_Writing550.20544.9475.4877.76−0.04−0.070.020.07
CMS Use
 Sessions56.5958.1036.4940.041.401.552.563.90
 Discussions Read Messages42.9241.9432.8437.971.050.921.68−0.02
 Assessments Began0.920.760.890.861.571.354.672.24
 Web Links Viewed7.348.4412.2514.913.823.4717.9314.44
 Content Folders Viewed188.24153.80135.47154.121.151.331.401.65
 Files Viewed65.4754.8547.5452.881.221.092.100.69
Outcome
 Final Grade3.894.001.080.99−0.67−0.87−0.420.30
Table 4. Descriptive characteristics of the study sample by ethnicity.
Indicator/Outcome VariablesMeanSDSkewnessKurtosis
CCAAAHCCAAAHCCAAAHCCAAAH
Academic Aptitude
 GPA2.922.952.620.800.740.74−0.82−0.28−0.100.19−1.05−0.81
 SAT_Verbal561.85564.36502.4374.7873.4169.500.17−0.55−0.33−0.310.79−0.64
 SAT_Mathematic591.35659.74544.5985.4176.7990.60−0.14−0.70−0.08−0.28−0.02−0.71
 SAT_Writing549.09562.05499.7275.3673.7883.96−0.01−0.550.010.150.17−0.40
CMS Use
 Sessions54.2765.4164.5436.9435.1446.951.690.961.364.760.021.96
 Discussions Read Messages42.4349.7851.1336.5644.2727.990.891.690.420.033.730.34
 Assessments Began0.771.290.810.781.070.741.211.050.942.400.821.70
 Web Links Viewed7.466.0313.0013.2512.4421.683.675.313.1216.4029.9111.02
 Content Folders Viewed154.57221.54202.92137.94132.03180.401.330.891.032.070.410.37
 Files Viewed54.3878.4174.5448.4839.4961.641.250.420.811.830.11−0.18
Outcome
 Final Grade3.934.083.681.020.871.18−0.70−0.66−0.39−0.21−0.20−0.93
Note: CC = Caucasian; Non-Hispanic; AA = Asian American; Pacific Islander; AH = African American & Hispanic Latino (a).
Multiple goodness-of-fit indices, including root-mean-square error of approximation (RMSEA), weighted root mean residual (WRMR), comparative fit index (CFI), and Tucker Lewis index (TLI) were recommended for models with large sample size and categorical responses [44,45,46]. The Chi-square index was not used to assess the model fit because of its sensitivity to large sample size [47].

3.1. Measurement Model

Confirmatory factor analysis (CFA) was used to examine the underlying dimensionality of all the observed indicators. Based on a theoretical framework, these indicators should have been reflected by two theoretically derived latent factors. 
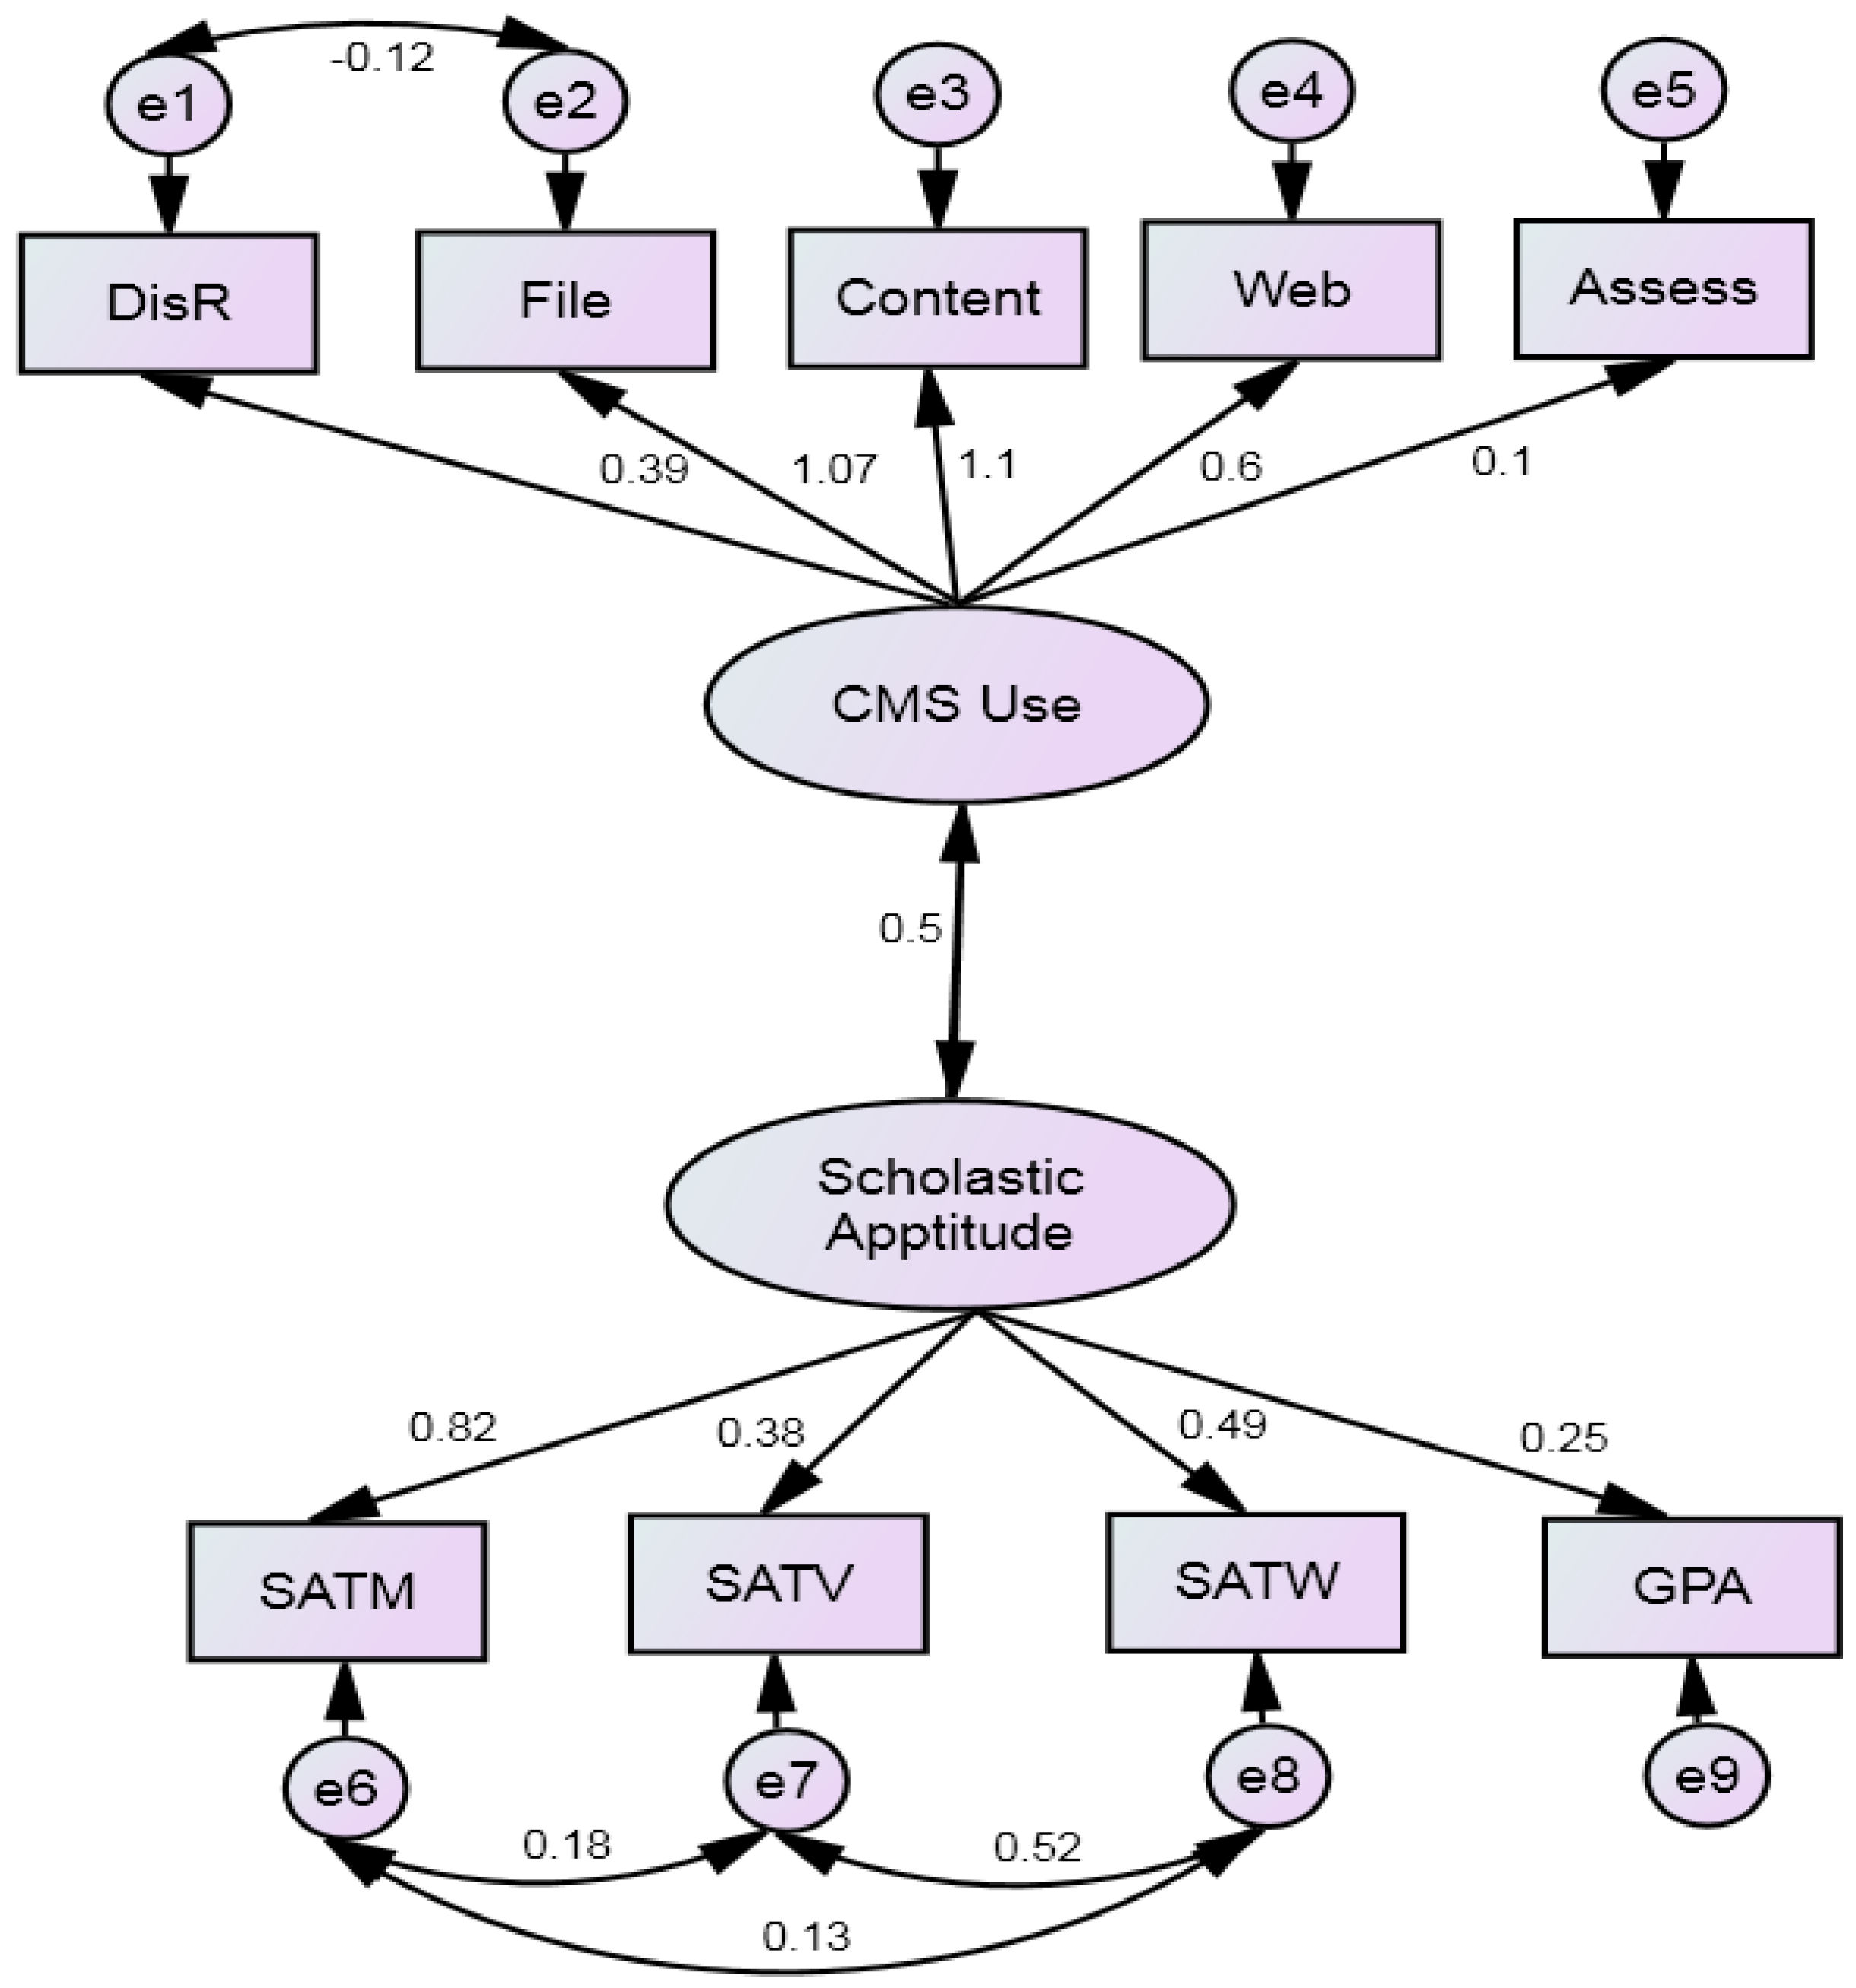
Figure 1 shows the path diagram of the measurement model. The SAT mathematic, SAT verbal, and SAT writing are the subtests of one examination so these variables were correlated with one another. The correlations were reflected by the double arrows connecting SATM, SATV, and SATW in Figure 1. “Discussion” was connected with “File” because students had to read course files before they discussed the file content on Blackboard Vista.
Figure 1. Confirmatory factor model.
Education 05 00179 g001
The RMSEA for the two factors model was 0.07 for an acceptable model fit [47]. Its 90% confidence interval ranges were from 0.06 to 0.08. The CFI was 0.97 and the TLI was 0.95. The SRMR was 0.06. The standardized loadings, standard error, p-value, and correlation of the two latent constructs are shown in Table 5. The loading of “assessment” was 0.1, because the “assessment” had a smaller mean compared with other indicators (Table 5).
Table 5. Loadings of CFA model.
LoadingS.E.Est./S.E.p-Value
CMS Use
 Discussion0.3940.0636.271<0.001
 Content1.1000.02740.956<0.001
 File1.0660.02838.096<0.001
 Web0.6010.0609.976<0.001
 Assessment0.0970.0432.2690.023
Academic Aptitude
 GPA0.2450.0425.839<0.001
 SAT Verbal0.3840.0824.682<0.001
 SAT Math0.8210.0958.648<0.001
 SAT Writing0.4870.0945.155<0.001
CMS Use with Academic Aptitude a0.4970.0677.397<0.001
Note: a the factor correlation between computer use and academic aptitude.

3.2. Structural Model

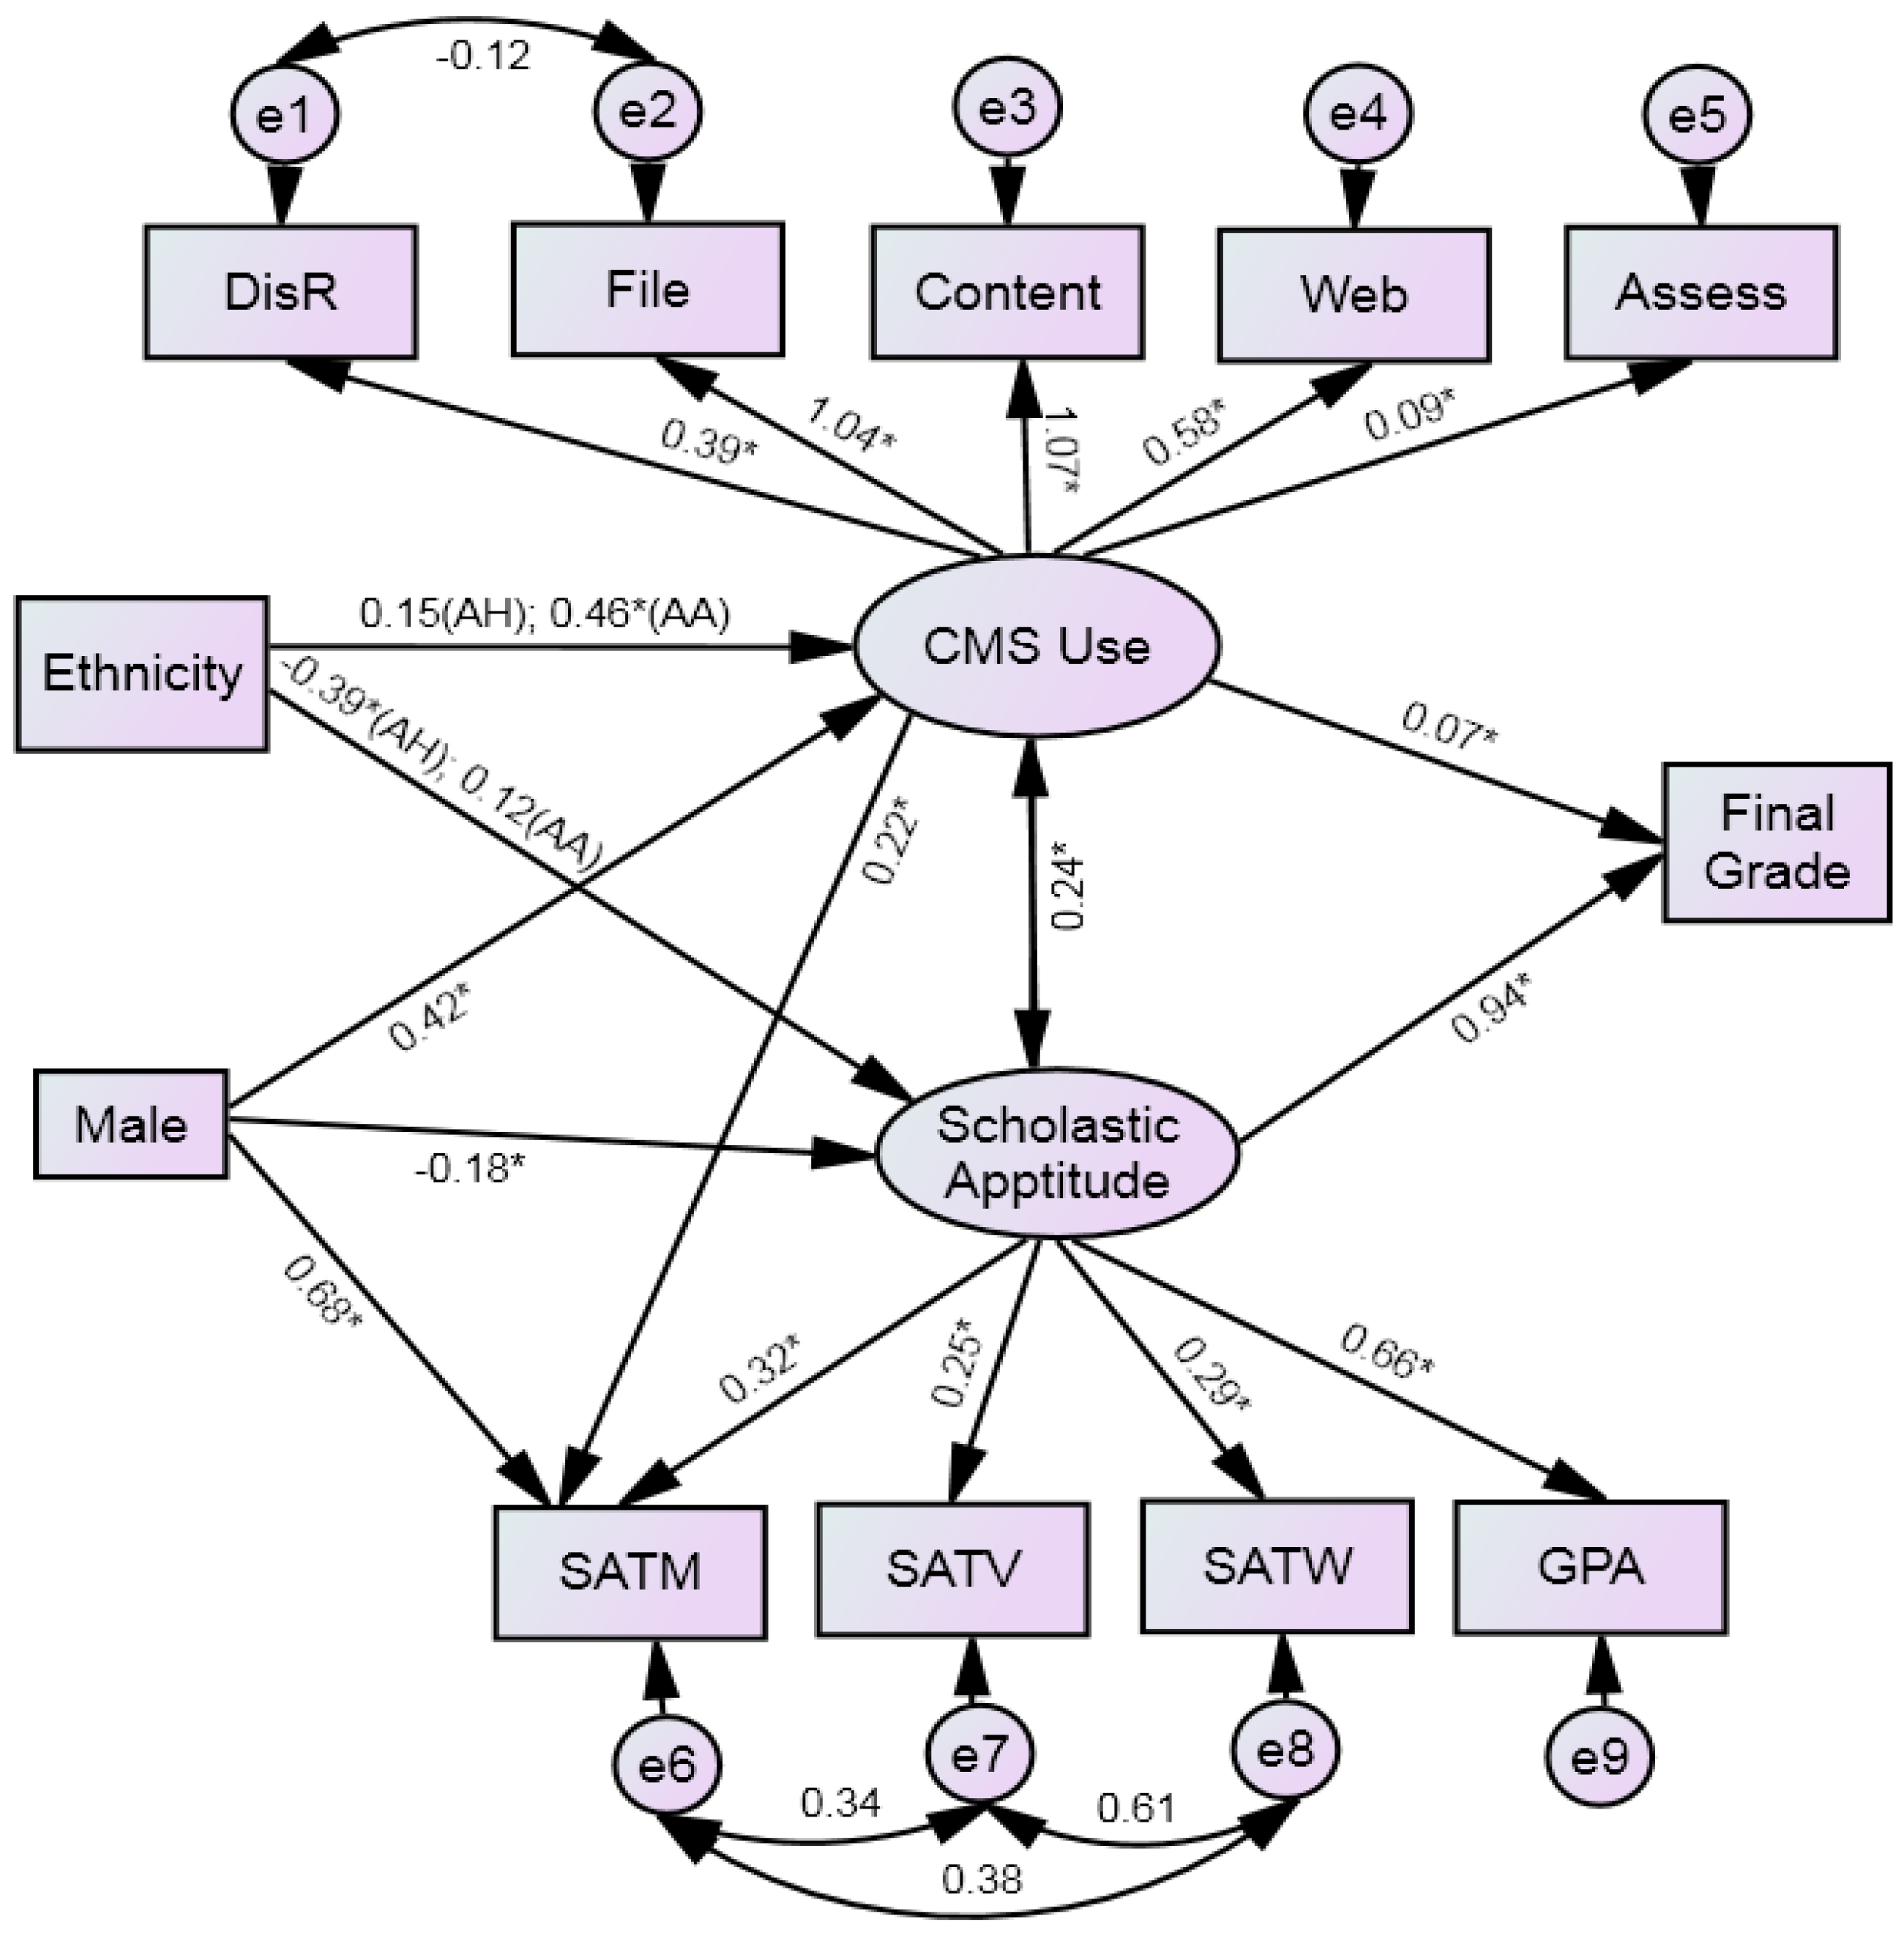
Extra observed variables were used in the structural model. The two additional variables included: (1) the dependent variable of academic outcome that was represented by students’ final grades; (2) the two covariate variables-gender and ethnicity. The structural model allowed investigating the gender and ethnicity differences on computer technology use controlling for the effects of the scholastic aptitude. However, the model did not achieve a good fit (RMSEA = 0.09, CFI = 0.89, TLI = 0.86, SRMR = 0.08). The modification indices given by Mplus software [48] indicated that additional parameters needed to be estimated in analysis: (1) “Male—SAT Mathematic”; (2) “SAT Mathematic—Computer Use”. After the two additional paths were added into the original model, the model achieved better fit (Figure 2), CFI = 0.97, TLI = 0.95, SRMR = 0.05, and RMSEA = 0.06. The 90% confidence interval for RMSEA was 0.05 to 0.07.
The two additional parameters were selected from the modification indices given by Mplus software. There is the risk that models generated in this way may not generalize to other samples. The modified model had better model fit and was statistically significantly different from the original model on the chi-square change test (p < 0.05). Moreover, previous research supported the theoretical appropriateness of the modified model. Since the 1960s, male students have consistently scored higher than female students on the SAT mathematic subtest by an average of 46 points [49]. Thus, there is a great likelihood that the relationship between gender and SAT math score exists in the current data. Previous studies also provide justification for the second extra estimation “SAT Mathematic—Computer Use.” Mathematic ability has been frequently linked to positive performance in use and mastery of computer knowledge among U.S. subjects [50,51,52,53]. In most of these studies, SAT mathematic scores were used to measure mathematic ability because the SAT has been accepted as a valid measure for mathematic ability for many years. These studies theoretically supported the association between mathematic ability (represented by SAT mathematic score) and computer use in this study. In another word, the study found SAT mathematic score disadvantaged for female students.
Figure 2. Path diagram for structural model with final grade (alternative model). Note: Gender was coded 0 = Female and 1 = Male, Ethnicity was coded 0 = Caucasian, 1 = African American & Hispanic (AH), 2 = Asian American (AA).
Education 05 00179 g002
Table 6 provides estimates of structural relationships depicted in Figure 2. Standardized coefficients (β) can be interpreted as estimates of effect size, in which less than 0.10 can be considered “small” effects, larger than 0.30 “medium” effects, and larger than 0.50 “large” effects [47].
Table 6. Effects of gender/ethnicity on computer use and academic achievement.
CMS Use on aEstimate (β)S.E.Estimate/S.E
 Gender (Male = 1)0.4200.0765.562 *
 African American & Hispanic0.1530.1820.841
 Asian0.4590.1114.147 *
Scholastic Aptitude on
 Gender (Male = 1)−0.1780.082−2.184 *
 African American & Hispanic−0.3880.198−1.961 *
 Asian0.1180.1550.758
CMS Use by b
 SAT Mathematic0.2210.0278.246 *
SAT Mathematic on
 Gender (Male = 1)0.6780.05312.721 *
Final Grade on
 CMS Use0.0680.0282.450 *
 Scholastic Aptitude0.9440.03924.259 *
Note: * Indicates significance at 0.05; a Regress CMS use on male, African American & Hispanic and Asian; b SAT mathematic is cross loaded on CMS use.
Male students had a significantly higher mean than female students in use of CMS (β = 0.42, p < 0.001). In terms of ethnicity, Asian students had a significantly higher mean in use of the Blackboard CMS than Caucasian students (β = 0.46, p < 0.001). There was no significant difference between African American and Caucasian students. Correspondingly, the study found that Asian students had the highest final scores among all ethnic groups. It’s worth mentioning that the causal relationship between academic achievement and use of CMS cannot be made. However, the association warrants further exploration. Further, Caucasian, African American, and Hispanic students used CMS at approximately the same frequency level, but Caucasian students had higher final scores than did African American and Hispanic students. One possible explanation is related to how students use CMS associated with their academic achievement. Green compared Caucasian and African American students’ use of Web 2.0 applications for academic purposes and found that Caucasian students were more likely to utilize the applications for academic purposes than were their African American peers [54].
The model found that male students had significantly lower scholastic aptitude than female peers (β = −0.178, p < 0.001). This finding resonates with recent literature. Many researchers found that gender inequality in US college entrance and achievement has been changed [55,56]. Chee, Pino, and Smith used survey data collected from students at a medium-size state university in the Southeast. Results of the analysis indicated that women were more likely to possess a more positive academic attitude than men and also tended to have higher GPAs.
In addition, the amount of involvement with the Blackboard CMS was found to be significantly related to students’ academic outcome. Variations in final grades were well explained by the two latent constructs. Computer use had a significant, small direct association with students’ academic outcome (β = 0.07, p < 0.001) whereas scholastic aptitude had a significant, large direct association with students’ academic outcome (β = 0.94, p < 0.001). In other word, students’ academic outcome was mainly associated with their scholastic ability, rather than the use of CMS.
Because differences in students’ use of the Blackboard CMS were found based on students’ gender and ethnicity, and such differences have been shown to be associated with students’ academic outcomes, educators may want to explore how students use different functions embedded in CMS. Such research might reveal which specific function has the most influential association with students’ learning outcomes. In this study, in order to answer this question, tests of equivalence were conducted to evaluate the specific functions embedded in CMS. Significant direct associations of gender and ethnicity on all indicator variables were of interest. The results showed that Hispanic and African American students appeared to use the discussion function more often than their Caucasian and Asian peers. But they had the lowest final course grades. The negative relationship between use of discussion function and the students’ final grade is incongruent with the existing study. Abbott et al. [57] suggested that students’ level of classroom involvements and interactions should have positively related with their academic achievements. The reason may be that the users may not appropriately use the “Discussion” platform as faculty expected them to. Burbules and Callister [42] noted that technology can be used well or poorly. Its advantages can only be attained under the conditions of how the technology is used, by whom, and for what purposes. In addition, student’s learning success was not associated with technology itself, but with the quality of use specifically for learning purposes [58].
The correlation between the CMS use and scholastic aptitude was significant. Students with higher scholastic aptitude tended to use CMS for course work more frequently, controlling for gender and ethnicity invariance. Similarly, more frequent use of CMS was closely associated with higher scholastic aptitude. The high inter-correlations indicated that there might be other factors that influence both latent factors. For example, social economic status may be a common cause for both computer use [59] and scholastic aptitude [60]. In addition, the imperfect representation of scholastic aptitude may also lead to the high correlation. In this study, the scholastic aptitude was represented by two variables: SAT and GPA. Extensive research has been conducted to determine what factors can accurately predict a student’s learning ability in college. Past studies have examined the relationship of SAT, ACT, and high school/current GPA on academic success [61,62,63]. However, these measures, which only control for previous performance, are not sufficient to predict a student’s scholastic aptitude. Other potential factors worth exploration may include achievement motivation, cognitive development, and personality characteristics [64,65].

4. Discussion

4.1. Implication for Practice

Even though the data used in this study was a few years old, and during that time frame, some newer CMS (e.g., MOOC, Moodle) started taking a share of the market; the current findings are still important and necessary for future reference. As Reeves and Reeves (2015) suggested, educational technology research needs to focus on educational problems instead of specific technological “things” [66] (p. 27). Online learning platforms have many forms and will continue to evolve, but the problem of digital divide rooted in students’ childhoods need to be addressed no matter what technologies are used. The study set out to investigate the relationship between learning inequalities and disparate use of CMS for college students who experienced digital divide in their childhood.
The results of this study may have important implications for faculty members and higher education administrators when they consider the issue of learning equity. This study provided an initial examination of the different behaviors of females and males, and among Caucasian, Asian American, African American, and Hispanic students in terms of using course management systems in higher education. The evidence provided by this study suggests there are different use patterns of the course management system among students with different backgrounds. The finding resonates with recent studies that the digital divide still remains [67], but the divide has already shifted from the quantity of technology use to the quality of technology use. Such divide, if not intervened, may have the potential to amplify existing forms of educational inequality. The study suggested directions for the development of alternative learning technology with the expectation to provide more pedagogical functions that fit for the needs of different kinds of students, and the potential to leverage the influence of existing digital inequality.

4.1.1. Set Specific Educational Goals for Use of CMS and Providing Guidance

The tests of equivalence showed that Hispanic and African American students appeared to use the discussion function more often than their Caucasian and Asian peers, whereas they had the lowest final course grades. The negative relationship between use of discussion function and the students’ final grade is incongruent with the traditional theory. Previous research has revealed that students’ classroom participation should have positively associated with their academic outcome [57]. The reason is likely that users may not appropriately use the “Discussion” platform for the academic purpose. Technology can be used well or poorly. The success of technology use lies in the conditions of how to use, by whom, and for what purposes [58]. Thus, in order to take full advantage of course management systems, educators should set specific educational goals for a CMS assisted class. Students are novices for learning new knowledge and they may not have the ability to judge the efficient method for learning in a CMS assisted class. Therefore, instructors should consider provide specific guidance to students on how to use CMS properly by assigning students specific assignments using specific functions, and helping them understand the purpose of using course management systems and research it accordingly.

4.1.2. Encourage the Use of Advanced Statistical Modeling Methods to Integrate with Academic Analytics to Support Decision Making Process

With the increasing of data sizes and types in the technology-rich learning systems, more complicated and advanced modeling methods should be encouraged to use for academic analytics so that the analytics can have better predictive power and the implicit relationships among latent and observed variables can be better addressed. Even though research in the field of learning analytics addressed the issue of developing academic analytics to identify at-risk students, researchers mostly used traditional statistical modeling methods and analytics research are still in demand of development [68]. Our study implemented an advanced structural equation modeling (SEM) method and investigated the interwoven relationships between CMS use, scholastic aptitude, and academic achievement, and also the gender/ethnicity differences that traditional statistical analysis may not be able to analyze. In addition, it provides insights with an example of utilizing CMS technology-use data and student demographic information to conduct academic analytics in higher education so that it may facilitate the decision making process.

4.1.3. Be Realistic about the Impact of CMS on Learning

The relatively weak effect from students’ use of the course management system is likely because the use of technology is not strong enough in this study. It has been pointed out that to examine the relationship between technology use and student outcomes, the quality of technology use is a more significant factor than the quantity of technology use [69]. In the study, there was no significant association observed when only the quantity of technology use was examined. A significant association between technology use and student outcomes could be identified only if, how technology is used and what it used for, were specified. Therefore, the findings of the current study are congruent with previous findings on this point. Faculty, parents, and education administrators should not unrealistically expect dramatic increases in student academic performance through one or two specific course management system experiences.

4.2. Future Direction and Limitations

Newer CMS should continue to be evaluated for learning equity with new samples of students. Continued evaluation also should incorporate socio-economic status as another factor in the model. Based on the existing literature, students from lower resourced families tend to have disadvantages in using computers and new technologies. With the increased use of CMS, more functions will be used extensively by instructors and more course data will be available. A second important issue for future study is to incorporate more actively used CMS functions into the analysis. Thirdly, the sample in this study only included 3 particular subject areas, and with subjects drawn from classes where instructors actively used CMS. With the popularity of CMS use in higher education, more types of courses should be included in future research to reveal possible technology use differences across subjects. Another area for future study is to conduct a follow-up interview or qualitative fieldwork with students and instructors within the study. This will help the field better understand what factors are more likely to associate with and/or cause group differences than what we have found with the quantitative data.
Inherent limitations to secondary analysis include having limited indicators to represent constructs and single university sample. Even though it is a well-designed study where analyses were conducted properly, the conclusions cannot be over-generalized because the structural relations among multiple variables are limited to a specific population [46]. There could be other alternative models that also fit the data as well as the one selected herein. Previous studies have shown that more than one alternative model are more likely to result using a large sample [70]. In order to confirm the significance of the selected alternative model, extra efforts should be made to rule out the existence of other alternatives. For example, using a cross-validation index (ECVI) method can to a certain degree overcome this problem by comparing alternative models to select alternative models with greater generalization.

5. Conclusions

The present study was built on the learning equity issue by investigating gender and racial/ethnic differences in use of CMS. The study examined the relationships across samples of female and males; and African American, Asian, and Caucasian college students. The study established the well-fit measurement model of these constructs and then incorporated gender and race/ethnicity covariates to achieve the well-fit structural model. The results suggest that male students, on average, had a significantly higher level of use of the Blackboard CMS than did female students. In terms of race/ethnicity, Asian students on average had a significantly higher level of use of CMS than did Caucasian and African American students. In addition, CMS use is associated with students’ achievement. Higher levels of CMS use are significantly associated with higher academic outcomes. The study also sheds light on the field of academic analytics and provides an example of how to utilize information data to effectively identify at risk students. Even though a causal relationship cannot be drawn based on the academic analytics in this study, the strong correlation may still yield theoretical and practical importance, and is worth further exploration.

Acknowledgments

The research is supported by the Scientific Research Plan Funds for the Faculty of Education at Southwest University (2014YBXM20) and the Fundamental Research Funds for the Central Universities (SWU1409440). The data for this research was extracted from the institutional data repository and can be accessed by your request. The research was conducted under the approval of the Institutional Review Board (IRB) in the United States. The rights and welfare of human subjects involved in the research are protected during their participation.

Conflicts of Interest

The authors declare no conflict of interest.

References

  1. Venkataraman, S.; Sivakumar, S. Engaging students in group based learning through e-learning techniques in higher education system. Int. J. Emerg. Trends Sci. Technol. 2015, 2, 1741–1746. [Google Scholar]
  2. Dahlstrom, E. The ECAR Study of Undergraduate Students and Information Technology. 2012. Available online: http://net.educause.edu/ir/library/pdf/ERS1208/ERS1208.pdf (accessed on 9 August 2014).
  3. Panday, R.; Purba, J.T. Lecturers and students technology readiness in implementing services delivery of academic information system in higher education institution: a case study. Commun. Comput. Inform. Sci. 2015, 516, 539–550. [Google Scholar]
  4. Pearce, K.; Rice, R. Digital divides from access to activities: Comparing mobile and personal computer Internet users. J. Commun. 2013, 63, 721–744. [Google Scholar] [CrossRef]
  5. Olatunji, S.O. Comparative assessment of public-private universities’ computer literacy contents of English language teacher preparation curricula in Nigeria. Eur. J. Sci. Res. 2011, 53, 108–116. [Google Scholar]
  6. Weller, C.E. Economic Snapshot: September. 2013. Available online: https://cdn.americanprogress.org/wp-content/uploads/2013/09/Economic_Snapshot_sep2013.pdf (accessed on 9 March 2015).
  7. Krumsvik, R.J. From digital divides to digital inequality—The emerging digital inequality in the Norwegian Unitarian school. US China Educ. Rev. 2008, 5, 1–17. [Google Scholar]
  8. Ghandoura, A.W. A qualitative study of ESL college students’ attitudes about computer-assisted writing classes. Engl. Lang. Teach. 2012, 5, 57–64. [Google Scholar]
  9. Bain, C.D.; Rice, M.L. The influence of gender on attitudes, perceptions, and uses of technology. J. Res. Technol. Educ. 2006, 39, 119–132. [Google Scholar] [CrossRef]
  10. Jackson, L.A.; Ervin, K.S.; Gardner, P.D.; Schmitt, N. Gender and the internet: Women communicating and men searching. Sex Roles 2009, 44, 363–379. [Google Scholar] [CrossRef]
  11. Schumacher, P.; Morahan-Martin, J. Gender, internet, and computer attitudes and experiences. Comput. Hum. Behav. 2001, 17, 95–110. [Google Scholar] [CrossRef]
  12. Compaine, B.M. The Digital Divide: Facing a Crisis or Creating a Myth? MIT Press: Cambridge, MA, USA, 2001. [Google Scholar]
  13. Norris, P. Digital Divide: Civic Engagement, Information Poverty, and the Internet Worldwide; Cambridge University Press: Cambridge, MA, USA, 2001. [Google Scholar]
  14. Johns, S.; Johnson-Yale, C.; Millermaier, S.U.S. College students’ internet use: Race, gender and digital divides. J. Comput. Mediat. Commun. 2001, 14, 244–264. [Google Scholar]
  15. Shashaani, L. Socioeconomic status, parents’ sex-role stereotypes, and the gender gap in computing. J. Res. Comput. Educ. 1994, 26, 433–452. [Google Scholar]
  16. Shashaani, L. Gender differences in computer attitudes and use among college students. J. Educ. Comput. Res. 1997, 16, 37–51. [Google Scholar] [CrossRef]
  17. Middendorf, E. Computernutzung und Neue Medien im Studium [Computer Use and New Media in Higher Education]; Bundesministerium fur Bildung und Forschung: Bonn, Germany, 2002. (In German) [Google Scholar]
  18. McCoy, L.P.; Heafner, T.L. Effect of gender on computer use and attitudes of college seniors. J. Women Minor. Sci. Eng. 2004, 10, 55–66. [Google Scholar] [CrossRef]
  19. Weber, K.; Custer, R. Gender-based preferences toward technology education content, activities, and instructional methods. J. Technol. Educ. 2005, 16, 55–71. [Google Scholar]
  20. Nicole, L.M.; Rosanna, E.G. Make new friends or keep the old: Gender and personality differences in social networking use. Comput. Hum. Behav. 2012, 28, 107–112. [Google Scholar]
  21. Deursen, A.V.; Dijk, J.V. The digital divide shift to differences in usage. New Media Soc. 2014, 16, 507–526. [Google Scholar] [CrossRef]
  22. Slate, J.R.; Manuel, M.; Brinson, K.H. The “digital divide”: Hispanic college students’ views of educational uses of the Internet. Assess. Educ. High. Educ. 2002, 27, 75–93. [Google Scholar] [CrossRef]
  23. Linda, A.; Jackson, L.A.; Zhao, Y.; Kolenic, A.; Fitzgerald, H.E.; Harold, R.; Eye, A.V. Race, gender, and information technology use: The new digital divide. CyberPsychol. Behav. 2008, 11, 437–442. [Google Scholar]
  24. Witte, J.C.; Mannon, S.E. The Internet and Social Inequalities; Routledge: New York, NY, USA, 2010. [Google Scholar]
  25. Wei, L.; Hindman, D.B. Does the digital divide matter more? Comparing the effects of new media and old media use on the education-based knowledge gap. Mass Commun. Soc. 2011, 14, 216–235. [Google Scholar] [CrossRef]
  26. Junco, R. Inequalities in Facebook use. Comput. Hum. Behav. 2013, 29, 2328–2336. [Google Scholar] [CrossRef]
  27. Chen, Y.C.; Hwang, R.H.; Wang, C.Y. Development and evaluation of a Web 2.0 annotation system as a learning tool in an e-learning environment. Comput. Educ. 2011, 58, 1094–1105. [Google Scholar] [CrossRef]
  28. Rollag, K. Teaching business cases online through discussion boards: Strategies and best practices. J. Manag. Educ. 2010, 34, 499–526. [Google Scholar] [CrossRef]
  29. Ross, D.N.; Rosenbloom, A. Reflections on building and teaching an undergraduate strategic management course in a blended format. J. Manag. Educ. 2011, 35, 351–376. [Google Scholar] [CrossRef]
  30. Empson, R. Education Grant Blackboard buys MyEdu to Help Refresh Its Brand and Reanimated Its User Experience. 2014. Available online: http://techcrunch.com/2014/01/16/education-giant-blackboard-buys-myedu-to-help-refresh-its-brand-and-reanimate-its-user-experience/ (accessed on 6 January 2015).
  31. Burgess, L.A. WebCT as an e-learning tool: A study of technology students’ perceptions. J. Technol. Educ. 2003, 15, 6–15. [Google Scholar]
  32. Unal, Z.; Unal, A. Evaluating and comparing the usability of web-based course management systems. J. Inf. Technol. Educ. 2011, 10, 19–38. [Google Scholar]
  33. Arbaugh, J.B.; Desai, A.; Rau, B.L.; Sridhar, B.S. A review of research on online and blended learning in the management disciplines: 1994–2009. Org. Manag. J. 2010, 7, 39–55. [Google Scholar] [CrossRef]
  34. Billsberry, J.; Rollag, K. Special issue: New technological advances applied to management education. J. Manag. Educ. 2010, 34, 634–636. [Google Scholar] [CrossRef]
  35. Wei, H.; Peng, H.; Chou, C. Can More Interactivity Improve Learning Achievement in an Online Course? Effects of College Students’ Perception and Actual Use of a Course-Management System on Their Learning Achievement. Comput. Educ. 2015, 83, 10–21. [Google Scholar] [CrossRef]
  36. Schneider, W.; Bjorklund, D.F. Expertise, aptitude, and strategic remembering. Child Dev. 1992, 63, 461–473. [Google Scholar] [CrossRef] [PubMed]
  37. Carstens, C.B.; Beck, H.P. The relationship of high school psychology and natural science courses to performance in a college introductory psychology class. Teach. Psychol. 1986, 13, 116–118. [Google Scholar] [CrossRef]
  38. Griggs, R.A.; Jackson, S.L. A reexamination of the relationship of high school psychology and natural science courses to performance in a college introductory psychology class. Teach. Psychol. 1998, 15, 142–144. [Google Scholar] [CrossRef]
  39. Adomi, E.A.; Anie, S.O. An Assessment of Computer Literacy Skills of Professionals in Nigerian University Libraries. Libr. Hi Tech. News 2006, 23, 10–14. [Google Scholar] [CrossRef]
  40. Erdogan, Y.; Aydin, E.; Kabaca, T. Exploring the psychological predictors of programming achievement. J. Instr. Psychol. 2008, 35, 264–270. [Google Scholar]
  41. West, S.G.; Finch, J.F.; Curran, P.J. Structural equation models with non-normal variables: Problems and remedies. In Structural Equation Modeling: Concepts, Issues, and Applications; Hoyle, R.H., Ed.; Sage: Thousand Oaks, CA, USA, 1995; pp. 56–75. [Google Scholar]
  42. Burbules, N.; Callister, T., Jr. Watch IT: The Promises and Risks of New Information Technologies for Education; Westview Press: Boulder, CO, USA, 2000. [Google Scholar]
  43. Flora, D.B.; Curran, P. An evaluation of alternative methods of estimation for confirmatory factor analysis with ordinal data. Psychol. Methods 2004, 9, 466–491. [Google Scholar] [CrossRef] [PubMed]
  44. Hu, L.T.; Bentler, P.M. Cutoff criteria for fit indexes in covariance structure analysis: Conventional criteria versus new alternative. Struct. Equ. Model. 1999, 6, 1–55. [Google Scholar] [CrossRef]
  45. MacCallum, R.C.; Austin, J.T. Application of structural equation modeling in psychology research. Annu. Rev. Psychol. 2000, 51, 201–226. [Google Scholar] [CrossRef] [PubMed]
  46. Kline, R.B. Principles and Practice of Structural Equation Modeling; Guilford Press: New York, NY, USA, 2005. [Google Scholar]
  47. Browne, M.V.; Cudeck, R. Alternative ways of assessing model fit. In Testing Structural Equation Model; Bollen, K.A., Long, J.S., Eds.; Sage: Newbury Park, CA, USA, 1993; pp. 136–161. [Google Scholar]
  48. Muthén, L.K.; Muthén, B.O. Mplus: Statistical Analysis with Latent Variables, User’s Guide; Muthén & Muthén: Los Angeles, CA, USA, 2010. [Google Scholar]
  49. College Entrance Examination Board. Profile of SAT and Achievement Test Takers; College Entrance Examination Board: New York, NY,USA, 1988. [Google Scholar]
  50. Butcher, D.F.; Muth, W.A. Predicting performance in an introductory computer science course. Commun. ACM 1985, 28, 263–268. [Google Scholar] [CrossRef]
  51. Dey, S.; Mand, L.R. Effects of mathematics preparation and prior language exposure on perceived performance in introductory computer science courses. SIGSCE Bull. 1986, 18, 144–148. [Google Scholar]
  52. Fan, T.S.; Li, Y.C. Is math ability beneficial to performance in college computer science programs? J. Natl. Taipei Teach. Coll. 2002, 1, 69–98. [Google Scholar]
  53. Konvalina, J.; Wileman, S.A.; Stephens, L.J. Math proficiency: A key to success for computer science students. Commun. ACM 1983, 26, 377–382. [Google Scholar] [CrossRef]
  54. Green, M.E. Journalism Students, Web 2.0 and the Digital Divide. Ph.D. Thesis, The University of Southern Mississippi, Hattiesburg, MS, USA, 2009. [Google Scholar]
  55. Bailey, M.J.; Dynarski, S.M. Gains and Gaps: Inequality in U.S. College Entry and Completion. 2011. Available online: http://www.nber.org/papers/w17633.pdf (accessed on 3 January 2015).
  56. Chee, K.H.; Pino, N.W.; Smith, W.L. Gender differences in the academic ethic and academic achievement. Coll. Stud. J. 2005, 39, 604–619. [Google Scholar]
  57. Abbott, R.; O’Donnell, J.; Hawkins, D.; Hill, K.; Kosterman, R.; Catalano, R. Change teaching practices to promote achievement and bonding to school. Am. J. Orthopsychiatry 1998, 64, 542–552. [Google Scholar] [CrossRef]
  58. Lei, J.; Zhao, Y. Technology uses and student achievement: A longitudinal study. Comput. Educ. 2007, 49, 284–296. [Google Scholar] [CrossRef]
  59. Warschauer, M.; Knobel, M.; Stone, L. Technology and equity in schooling: Deconstructing the digital divide. Educ. Policy 2004, 18, 562–588. [Google Scholar] [CrossRef]
  60. Dar, Y.; Getz, S. Learning ability, socioeconomic status, and student placement for undergraduate studies in Isreal. High. Educ. 2007, 54, 41–60. [Google Scholar] [CrossRef]
  61. Spencer, H.E. Mathematical SAT test scores and college chemistry grades. J. Chem. Educ. 1996, 73, 1150–1153. [Google Scholar] [CrossRef]
  62. House, J.D. Noncognitive predictors of achievement introductory college chemistry. Res. High. Educ. 1995, 36, 473–490. [Google Scholar] [CrossRef]
  63. Carmichael, J.W.J.; Bauer, J.S.; Sevenair, J.P.; Hunter, J.T.; Gambrell, R.L. Predictors of first-year chemistry grades for Black Americans. J. Chem. Educ. 1986, 63, 333–336. [Google Scholar] [CrossRef]
  64. Busato, V.V.; Prins, F.J.; Elshout, J.J.; Hamaker, C. The relation between learning styles, the big five personality traits and achievement motivation in higher education. Personal. Individ. Differ. 2000, 26, 129–140. [Google Scholar] [CrossRef]
  65. Chamorro-Premuzik, T.; Furnham, A. Personality predicts academic performance: Evidence from two longitudinal university samples. J. Res. Personal. 2003, 37, 319–338. [Google Scholar] [CrossRef]
  66. Reeves, T.C.; Reeves, P.M. Educational technology research in a VUCA world. Educ. Technol. 2015, 55, 26–30. [Google Scholar]
  67. Judith, S. Using an adapted, task-level technology acceptance model to explain why instructors in higher education intend to use some learning management system tools more than others. Comput. Educ. 2014, 71, 247–256. [Google Scholar]
  68. Siemens, G. The journal of learning analytics: Supporting and promoting learning analytics research. J. Learn. Anal. 2014, 1, 3–4. [Google Scholar]
  69. Lei, J. Quantity versus quality: A new approach to examine the relationship between technology use and student outcomes. Br. J. Educ. Technol. 2009, 41, 455–472. [Google Scholar] [CrossRef]
  70. MacCallum, R.C.; Wegener, D.T.; Uchino, N.N.; Fabrigar, L.R. The problem of equivalent models in applications of covariance structure analysis. Psychol. Bull. 1993, 114, 185–199. [Google Scholar] [CrossRef] [PubMed]

