Effect of the Great Crisis on Sectoral Female Employment in Europe: A Structural Decomposition Analysis


1
Department of Electrical, Electronic and Communications Engineering, Public University of Navarre, Campus Arrosadia, 31006 Pamplona, Spain
2
Department of Economics, Public University of Navarre, Campus Arrosadia, 31006 Pamplona, Spain
3
Institute for Advanced Research in Business and Economics (INARBE), Campus Arrosadia, 31006 Pamplona, Spain
*
Author to whom correspondence should be addressed.
Economies 2020, 8(3), 64; https://doi.org/10.3390/economies8030064
Submission received: 18 June 2020
/
Revised: 5 August 2020
/
Accepted: 7 August 2020
/
Published: 12 August 2020
Abstract
:Sectoral gender segregation in labor markets is a fact. This paper examines the female distribution of employment by sectors in the EU 28, thereby contributing to the literature on the effects of the recession and subsequent austerity measures on female employment. An input-output model and structural decomposition analysis are used to assess the contribution of factors such as technological change, productivity change and final demand change. The latter had a positive impact over the period of analysis by creating new job opportunities for women, especially in the public service sectors, whereas productivity growth had a negative impact, particularly in the private service sectors. These changes have resulted in a reduction in the level of gender sectoral segregation; change in household expenditure again is the main driver of this reduction. Changing trends in labor requirements and gross capital formation have the opposite effect; thus, these trends increase the level of sectoral segregation.
Keywords:
female employment; EU-28; crisis; structural decomposition analysis; input-output analysis; sectoral gender segregation indexJEL Classification:
C67; J70; J711. Introduction
Gender differences in employment have drawn growing attention in the last few decades. It is now commonplace to hear leaders and institutions stressing the need to reduce gender inequalities and break with traditional economic principles by seeking to balance wealth creation with wealth distribution between men and women. Feminist economists, however, see the pursuit of economic development through the economic empowerment of women as a flawed approach and call for a serious reconsideration of the androcentric economic system, which is focused exclusively on monetization (Karamessini and Rubery 2014a; Pérez Orozco 2005) and shows a general disregard for dependency relationships between individuals, while also eluding any responsibility for people’s living conditions (Gálvez Muñoz and Rodríguez-Modroño 2017). The aims of the feminist economic movement are to broaden economic perspectives by bringing to the fore the active role played by women, which has long been forced into oblivion, and by pointing out and presenting the evidence for gender-power relationships within the current economic system and showing them to be susceptible to economic assessment (Pérez Orozco 2005). These feminist critics have led some researchers to flag the need to focus a “gender lens” on economic, social, managerial, organizational and labor relationships (Gálvez Muñoz and Rodríguez-Modroño 2017; Rubery and Hebson 2018).
Workers’ available options are limited by the hierarchically-ordered categories of gender, race and nationality into which they are classified by society, thus allowing some groups to benefit at the expense of others (Alonso-Villar and del Río 2017a). One of the mechanisms through which between-group inequalities persist is through gender-based job segregation. Work is not fairly distributed; men and women hold clearly differentiated positions in the social hierarchy, both in the home and in the workplace (Maruani 2000). Thus, even in the realm of paid work, gender differences persist. In the labor market, gender inequality can take the form of wage differences, job segregation and/or unequal opportunities for promotion (Aldaz Odriozola and Eguía Peña 2016).
Gender-based job segregation is the term used to describe the tendency towards an inequitable distribution of men and women among workforce echelons, occupations, and industries (Steinmetz 2012). Vertical gender segregation leaves men dominating the upper echelons within the same occupation, and women underrepresented in managerial positions. Horizontal gender segregation presupposes that men and women will take up different occupations. Finally, industrial or sectoral gender segregation leads to certain economic sectors being largely dominated by employees of one gender (Tonoyan et al. 2020). Gender segregation results in the over-representation of women in lower-paid, lower-status1 sectors and occupations (OECD 2017; European Commission 2017), where they tend to be undervalued and offered fewer opportunities for career advancements (Blau and Winkler 2018). The cumulative effect of all these circumstances often reaches beyond labor market issues leading to poverty, social discrimination or over-dependence on the welfare system (Aldaz Odriozola and Eguía Peña 2016).
Despite the observed changes in labor markets across the world, women remain overrepresented within certain types of sectors around the globe (Yurtoglu and Zulehner 2009; Pena-Boquete et al. 2010; Steinmetz 2012; Tonoyan et al. 2020; Borrowman and Klasen 2020; Blau and Kahn 2017). This sectoral gender segregation, which is the focus of our analysis, contributes to the gender pay gap (Hegewisch et al. 2010; Hegewisch and Liepmann 2014; Blau and Kahn 2017; Alonso-Villar and del Río 2017a; Blau and Winkler 2018; Sin et al. 2017). Over time, human capital factors (mainly work experience and education) have lost explanatory power for the wage gap (Scicchitano 2012, 2014). As women have increased their productivity by enhancing their skills, knowledge and experience, the role of human capital in the gender wage gap has been squeezed out (Goldin 2014), while that of gender-based occupation and sector segregation has grown (Kunze 2018; Boll et al. 2016, 2017; Boll and Lagemann 2018; European Commission 2019; Perugini et al. 2019). According to Bettio et al. (2013), however, while female employment trends are heavily affected by both sectoral and occupational job-loss patterns during an economic downturn, the distinctly sectoral impact of economic crises makes the sectoral factor the stronger one. Karamessini and Rubery (2014a) concluded that sectoral segregation appeared as the main determinant of the pattern of job changes during the recent recession and subsequent periods of austerity. Nevertheless, despite its increasing role as a determining factor of gender inequality in the labor market, sectoral segregation has been neglected in the vast majority of empirical studies (Pena-Boquete et al. 2010; Borrowman and Klasen 2020).
Following upon findings suggesting a relationship between structurally-driven sectoral output shifts and female labor force dynamics (Gaddis and Klasen 2014), there have also been efforts (Goldin 1994; Choudhry and Elhorst 2018; Lechman and Kaur 2015) to analyze changes in the female labor force participation rate as a function of a country’s economic development. The literature claims that sectors using more labor-intensive technology tend to employ larger shares of women workers (Caraway 2006; Saraçoğlu et al. 2018), and contribute more to changes in the female share of employment (Kucera and Tejani 2014). So-called added and discouraged effects are additional factors that can theoretically contribute to gender differences in labor supply decisions. After a period of unemployment, some workers give up job seeking in the belief that low employment rates will prevent them from finding work. Thus, they become discouraged workers. This also has a compensatory effect among the population, since the need to make up for a lost job, and thus a lost source of family income, does, in fact, bring more workers into the labor market. These are termed added workers. According to the European Commission (2017), partnered women represented the bulk of added workers in Europe during the last recession, while the majority of discouraged workers were men (Bettio et al. 2013). Another approach uses the buffer and substitution hypothesis to explain the changes in female employment (Rubery 1988). The buffer effect refers to women workers being used as a demand shock absorber by being hired when the economy expands and fired when demand slows down. Substitution is the effet whereby men are replaced with women because times of crisis bring pressure for cost reduction, and female labor is usually cheaper. In the substitution hypothesis, female employment is considered as a secondary labor source. The literature also suggests sectoral gender segregation as a possible reason why women’s employment growth is less sensitive than men’s to economic cycle effects (Razzu and Singleton 2016, 2018; Peiró et al. 2012).
The latest economic recession had a gendered impact on labor markets. The basic explanation for this, in the case of the EU, lies in the high level of gender segregation in EU labor markets, where the crisis had a sectoral dimension and the public policies implemented to tackle it were too sector-oriented (Périvier 2014). Connelly and Kongar (2017) report that the first effects of the recession in several industrialized countries were felt in the manufacturing and construction industries and certain branches of the financial sector. Since these sectors are mainly occupied by men, the initial decline was much deeper in male than in female employment (Bettio et al. 2013; Périvier 2018), thereby leading Karamessini and Rubery (2014a) to dub it a “he-cession”. The drop in final demand was associated with a drop in trade and the manufacturing and construction sectors, while employment in the services sectors fell only slightly and in some cases even increased (OECD 2012). As a result, female employment was less affected2 and the gender gap in employment actually narrowed (Bettio and Verashchagina 2014; European Commission 2017). The response to the crisis in many countries was to implement fiscal policies that would favor physical infrastructure over social infrastructure or social services (Connelly and Kongar 2017). Although these policies boosted employment, they benefited men more than women.
Indeed, the austerity measures, brought in by many countries in the EU 28 in the post-recession period, involved reductions in government spending for publicly-provided goods and services, which, for various reasons affected the labor market, inequality and social stability (Perugini et al. 2019), and had a greater impact on women than men. Firstly, these measures had a sectoral, and inevitably, therefore, a gender component (Martínez-Tola et al. 2018), because the sectors experiencing the greatest reductions were those where women provide the main workforce. The public sector employed a large percentage of women, most of whom were educated women (United Nations 2017; OECD 2012). In gender-relative terms, therefore, austerity measures are more detrimental for female than for male employment. In this sense, sectoral segregation has ceased to protect against job loss and has become a factor in unemployment risk exposure (Karamessini asnd Rubery 2017). In order to achieve gender equality, the economy needs to reduce occupational and sectoral segregation, both by employing more women in male dominated sectors, and encouraging more men into female dominated sectors.
Secondly, these measures appear to be having a differential effect, since the worst affected, alongside the older and low-income groups, are women, who are often more dependent on state income support and social services than men (Karamessini and Rubery 2014b) and thus more vulnerable to austerity measures (Rubery 2015; Kushi and McManus 2018). The deterioration of the welfare state, in areas such as childcare, social and eldercare services, results in families having to provide these services, usually in the form of unpaid female labor (Rubery and Rafferty 2013). Indeed, due to gender inequality, women are still expected to take responsibility for the care of their families, neighbors and communities and (Bargawi et al. 2017) as recently thrown into focus by the COVID-19 health crisis, the wider repercussions of this affect women more severely than men (Alon et al. 2020). In this sense, Sevilla and Smith (2020) and Adams-Prassl et al. (2020) find that women are taking on the majority of the additional home childcare and are more likely than men to have stopped working during the lockdown, because the crisis has most severely hit service sectors where workers have frequent social contact and women are over-represented (Hupkau and Petrongolo 2020; Thomason and Macias-Alonso 2020).The lack of flexible work arrangements can also result in one member of the household having to quit work to care for the family and this, under the current division of labor, is very likely to be a woman (Alon et al. 2020). In addition, working-age women have proved more susceptible to the virus than working-age men, partly due to the fact that women form the bulk of the health sector workforce (Bertocchi 2020).
Governments do not take non-market and unpaid work into account when implementing their macroeconomic policy framework. Although the focus of this study is on the paid labor, it is also important to acknowledge the contribution of unpaid work in maintaining social wellbeing. Conventional economic theories take labor as a given input. However, to maintain the labor supply, unpaid work is always necesssary. Every human being needs someone to take care of them at some point, be it as newborns, as they get old, as they get sick, for cleaning, for preparing meals, etc. These services were historically and are even today largely performed by women. These gender norms reinforce and maintain inequalities inside the life of households.
The result is that, by being expected to take on a larger share of household work and family support, women see their capacity for formal employment undermined (Kushi and McManus 2018). Women´s need to reconcile work and family care poses a series of challenges if they are to meet the degree of effort, flexibility and continuity required in their jobs, thus leaving them at a disadvantage when it comes to attaining better-paid and higher level posts (Perugini et al. 2019), or even entering the labor market at all. Often, gender equality issues have been discussed by women’s participation rate, paying little attention to wether women’s entry to the labor reduces the time they are able to devote to unpaid work and requires more unpaid work hours from men. That is, if women entering the labor market signifies real structural systematic change or simply an addition to their work load (Bargawi et al. 2017). Women are also more vulnerable to a recession because they are predominantly engaged in part-time or temporary jobs and various forms of informal or self-employment (Karamessini and Rubery 2017). All these circumstances lead Karamessini and Rubery (2014a) to dub this period “sh(e)austerity”.
Several papers published since the 2008 economic crisis have addressed the impact of the decline in economic activity on female employment; an effect mediated by the existence of marked sectoral segregation (Martínez-Tola et al. 2018). The form and pattern of this segregation may vary; and whether it exposes or protects women depends on different recessionary effects across sectors; but, once recovery starts, changes in gender segregation are possible if gender substitution takes place (Rubery and Rafferty 2013).
This research uses a gender biased input-output employment model (Gunluk-Senesen and Senesen 2011) to analyze changes in female sectoral employment in the European Union between 2008 and 2018. Specifically, input-output tables and the demand model developed by Leontief (1974) are used to conduct a structural decomposition analysis (SDA)3. This involves computing the number of jobs created in a given sector focusing not only on the employer sector, but also on the indirect generation of employment through inter-sectoral links (Gunluk-Senesen and Senesen 2011). This approach is inspired by the contribution of Skolka (1989) who analyzes variations in the use of labor in the Austrian economy due to structural and technological change. Thus, the sources of variations in female employment can be broken down into two components: technological change and final demand change. Technological change can, in turn, be due to variations in intermediate consumption demand or in female labor requirement (deriving from changes either in the female participation rate or in productivity). The second component, final demand change, may be a reflection of absolute change in final demand or change in its structural composition (household expenditure, public sector expenditure, gross capital formation and exports). All these changes are calculated4 and then used to compute different segregation indexes in order to assess the significance of each source of change in the level of gender sectoral segregation in the European labor market.
Other authors have used input-output methodology to study patterns in specific forms of labor and in different contexts: Forssell (1990) studies changes in the use of labor in Finland by education levels; Gregory et al. (2001) analyses the effect of growth in domestic demand, international trade and technological change in the skill structure of employment in UK; Schaffer (2007, 2008) considers gender patterns in German labor markets; Belegri-Roboli et al. (2011) use it to study the determinants of labor productivity change in Greece; Tin (2014) to analyze the sources of labor growth in the Malaysian manufacturing sector; Danchev et al. (2014) for the analysis of the Greek labor market following the 2008 crisis; Simas et al. (2014) to quantify the extent of the bad labor footprint associated with final demand; Salgueiro et al. (2016) to examine employment rates by level of education; Carrascal (2017) for a study of youth employment in European countries; Rueda-Cantuche and Sousa (2017) to study women’s share in export-related employment in the EU; Saraçoğlu et al. (2018) to analyze the effect of changes in trade patterns in women’s sectoral employment in 30 countries for the period 1995–2011; Simas and Wood (2018) to evaluate the impact of European household consumption on domestic and foreign labor, Duarte et al. (2019) to quantify the change in female employment rates in Spain, Kim et al. (2019) and De Henau and Himmelweit (2020) to compute the gender effect on employment brought about by public investment in care services.
It is important, however, to acknowledge the limitations of this research. The first constraint is the need to work with monetary figures due to the unavailability of I-O tables in constant prices. Also, given that the objective of the paper is to analyze labor patterns, a more precise measure than the number of employees, such as the number of worked hours, would have enabled us to calculate full- time equivalent employment and determine whether the majority of new job opportunities for women prove to be part-time jobs. If sector-gender breakdown statistics on jobs had been available, the change in occupational (as well as sectoral) segregation could have been analyzed. Furhermore, national input-output tables for the reference period would have enabled the analysis of cross-country differences, taking into account country-specific effects on labor market performance, particularly in relation to women.
The paper is structured as follows. The next section presents the methodology, data sources and main European employment trends, with a specific focus on the evolution of female employment patterns. It is followed by a section explaining and discussing the empirical results of the structural decomposition analysis. The last section offers the discussion and main conclusions.
2. Methodology
2.1. Structural Decomposition Analysis
The structural decomposition analysis is based on input-output tables and on the specifications of the demand model, in order to capture both direct and indirect effects of sectoral demands. The basic concept underlying the input-output model is that the production of an output (X) requires some inputs. Input-output links are considered using a double-entry framework to create a so-called input-output table. This matrix, in which the economic system is decomposed for analysis into n number of production sectors, considers all payments to and from a sector within a year. Intermediate inputs (xij) are goods and services used in the production process and not intended to be sold for final use, but instead for producing other goods and services. The columns (j) show sectors which purchase inputs and the rows (i) show sectors which sell outputs. Final use of outputs (D) can be broken down into final household consumption expenditure, final government consumption expenditure, gross capital formation and exports. Production, meanwhile, can be divided into intermediate inputs and value added. Value added can, in turn, be separated into operating surplus and compensation of employees.
Based on the input-output table, Leontief proposed the well-known demand model, which can be expressed as follows:
where X is a sectoral production vector; A is the technical coefficient matrix where every element is given by is the Leontief inverse matrix, which will be denoted by M in the following equations; D is a vector of sectoral final demands. Therefore, the model can be written as .
If data on the use of other inputs, such as female employment, are available, it is possible to account for the female employment coefficient.
where is the number of women working in the jth sector and denotes its output. Thus, refers to the number of women needed to produce one unit of output in the jth sector. It is a diagonal matrix of direct female labor requirements per sector.
By combining expressions (1) and (2), it is possible to express the number of women working in a sector as the product of multiplying the female employment coefficient by the Leontief inverse matrix by the demand vector. Thus, female employment by sector depends on three main factors: the number of female workers each sector needs to produce one unit of output (W), the dependence of each sector on inputs from other sectors per unit of demand (Leontief inverse matrix) and, finally, the volume of final demand per sector. In other words, in each sector, female employment depends on the quantity of output required to meet final demand () taking into account the number of female workers required per unit output (W).
Since the aim was to study female employment change before and after the recent crisis, at times 0 and t, the expression for computing this change, and the basis for the remaining steps in the analysis was:
Female employment change was then further analyzed by performing a structural decomposition based on the proposal made by Carrascal (2017). Standard decomposition analysis focuses on a set of statistical changes in key variables in order to explain economic change (Rose and Chen 1991). The traditional model explains output change by studying the effects of changes in the use of intermediate inputs or technological change5, changes in final demand and interaction between these two variables (Miller and Blair 2009). Rearranging Equation (4) results in:
where the effect of technological change, shown in the change in labor requirement (W) and change in the intermediate input coefficients (M) is computed as , which is a measure of female employment change in each sector, absent any change in final demand; final demand change as , which is a measure of female employment absent any technological change; and the interaction between the two as .
At the same time, technological change can be divided into change in the amount of female labor required, change in intermediate consumption and the interaction between these two variables:
Change in the labor requirement can also be further decomposed by expressing the female employment coefficient per sector (j) as two coefficients: women’s participation and the inverse sectoral productivity, whereby the following holds:
where is the number of female workers per sector and is the total number of workers per sector. The female share in total employment per sector is computed by dividing by (). Analogously, the number of workers required per unit output is obtained by dividing by (), which accounts for inverse productivity measured as total output per worker.
By substitution and rearrangement, the expression for change in female labor requirement can be disaggregated into change in the female share, productivity change and the interaction of the two. That is to say:
Final demand, which accounts for , can also be split into different components: changes in final household consumption expenditure, final government consumption expenditure, gross capital formation and exports, which results in:
It is important to mention, however, that, there is no unique decomposition (Dietzenbacher and Los 1998) and results can vary from one decomposition to another, thus biasing the conclusions. The just-cited authors conclude that the mean of the two polar decompositions is very close to the average of all possible decompositions, and therefore recommend using the former. Finally, having determined the two proposed decompositions, the next step is to compute their average. Both effects have the same weight and the results lie on a middle point.
2.2. Measuring of Gender Segregation
Our focus is on sectoral gender segregation; that is, horizontal segregation across sectors of the economy. Attempts to understand its changing patterns have led to a multitude of proposals for composite indices as a basis of comparison over time and across countries (Borrowman and Klasen 2020). In our case, the variation in the level of gender segregation over the study period was measured by means of the modified version of the dissimilarity index (Duncan and Duncan 1955) proposed by Moir and Smith (1979), which is given by the following expression:
where k is the number of sectors, and and are the number of women workers and total number of employed, respectively, in the ith sector. This index takes values between zero and one, with higher values indicating higher segregation. It can be interpreted as the change in the proportion of women workers required to eliminate segregation.
Following the recommendation of Alonso-Villar and del Río (2017a, 2017b) an additional measure (local segregation) was computed to enable a robustness check of the results. The estimated equation can be specified as follows:
This index takes values between zero and , with higher values indicating higher segregation. Given that neither of these indices is affected by the size of the group or the size of the economy, it is possible to compare the results at different points in time (Alonso-Villar and del Río 2017b). As is usually the case with this type of measure, the index values capture gender segregation only within the formal labor market, thus ignoring unpaid housework.
These indices are computed based on the change in the number of women and men employed due to each component in the structural decomposition analysis. Thus, it is possible to analyze the contribution of each one in the level of sectoral gender segregation throughout the study period.
2.3. Sources of Information
This study analyzed structural change in female employment between the years 2008 and 2018 for the EU 28 using Eurostat data. The data are compiled in accordance with the European System of National and Regional Accounts (European Council 2013), which is compatible across EU countries and enables a detailed description of an economy.
First, input-output tables were constructed to show EU 28 aggregate domestic product flows at basic prices. The tables used are those for the years 2008 and 2018 (Eurostat 2019a). Therefore, the period selected to analyze the impact of the economic crisis on female employment runs from the onset of the crisis to once it has been overcome.
Next, aggregate EU 28 female, male and total employment data for the 15 to 64 age groups were taken from the detailed annual survey section of the EU Labor Force Survey for every year from 2008 to 2018 (Eurostat 2019b).
The input-output model is based on a 64-sector breakdown of the economy; and a 90-sector level of disaggregation of employment by gender and sector. The employment data were therefore organized into the 64 sectors of the input-output tables shown in the Appendix A.
According to Gunluk-Senesen and Senesen (2011), one of the key factors determining the effectiveness of gender-biased input-output employment studies could be whether or not they recognize the gender factor in the non-homogeneity of labor, and therefore conceptual awareness should be complemented with the restructuring of the data compilation to account for women’s labor. As already stated, a large proportion of female labor is employed in the informal sector and in unpaid domestic work. As it does not form part of the labor market, it is largely unaccounted for in databases and is therefore not factored in by structural change and input-output studies. This area of research also often fails to take this unpaid work into consideration when analyzing structural change. Schaffer (2007) demonstrates, moreover, that there are differences in the gender composition of labor when measured as the number of workers rather than the number of hours worked, which is a more precise measure of the labor factor in production processes. The only available data for this study is a measure of female labor force participation based on the number of women workers.
3. Results
3.1. The Evolution of Female Employment and Trends in Its Sectoral Distribution
In 2018, total employment in the EU 28 was 222,869,400 jobs (for men and women). As can be observed in Figure 1, there is a much greater number of men than women in the EU labor market. Furthermore, men’s and women’s jobs are not equally affected by external factors, as seen during the latest economic recession.
From 2008 to 2018, total employment increased by 4,632,500 jobs, as the result of a gender- differentiated growth pattern, with male employment falling by 258,600 jobs while female employment grew by 4,896,400. In the first years of the crisis, more men than women faced job loss, and later, when the female employment rate had steadied, male employment continued to decline. From 2014, although annual male and female employment growth rates become positive6, the overall picture shows that, unlike male employment, female employment regained, and even surpassed, its initial level. The similarity between male and female employment growth rates since 2015, however, suggests that female employment has suffered the effects of the austerity measures adopted by many European countries.
The sectors providing the highest shares of total employment, according to data for 2008, are manufacturing with 17.3 percent; wholesale and retail trade with 14.3 percent; human health and social work activities with 9.6 percent; and construction with 8.44 percent. All sectors did not respond in the same way during the recession and recovery periods, however. While the near majority saw a decline in total employment at the start of the economic crisis, some, including water supply activities, accommodation and food services, real estate activities, professional and administrative activities, education, human health and social work activities and arts increased their shares of total employment during those years. All of the sectors just mentioned continued this upward trend throughout the entire period, thus proving their superior dynamics (Kaminioti 2014). Sectors which had begun on a downward trend and were upward bound by the end of the period include manufacturing, construction, retail, transportation and storage, information and communication, public administration and defence as well as other service activities. Meanwhile, agriculture, forestry and fishing, mining and quarrying and financial and insurance activities followed a downtrend throughout the entire period, while total employment in the electricity, gas, steam and air conditioning supply sector increased at first but was on the decline by 2018.
It is important to highlight that the greatest change took place in the construction sector, which, by 2018, was employing 3,139,800 fewer workers (2,984,000 of them male) than in 2008. The fact that 90 percent of those employed in the construction sector were men explains the high proportion of male employment loss in that sector. A complete contrast to this appears in the human health and social work activities sector, which saw a marked rise in employment, with an additional 3,616,400 jobs, 2,878,000 of which went to women, leaving this sector with one of the highest female shares in total employment7.
In this context, the evolution of female employment is shown in Figure 2 for groupings with more than one million female workers. The data shown are for 2008, 2011 and 2018. The sectors employing the largest numbers of women in absolute terms are human health and social work activities (Q), retail (G), education (P) and professional and administrative activities (M). The ranking of sectors by number of women employed changed little over the study period. The most noticeable features are the gradual decline in the number of women workers in the manufacturing (C) and agriculture, forestry and fishing (A) sectors and the increase in absolute female employment numbers in the human health and social work (Q), professional and administrative activities (M) and education (P) sectors. These results are consistent with those reported by Woetzel et al. (2015), who found that women dominated the services sector in every region of the world (except South Asia), while men dominate the industry sector worldwide. These authors also report a concentration of women in low productivity sectors.
Female employment shares per sector, for the 64 sectors of the input-output tables, are shown in Figure 3, where the horizontal axis shows the sectors ordered from lowest to highest in terms of female employment shares, based on data from 2008. This graph clearly illustrates the sectoral differences in the gender distribution of employment. Some sectors, including industry and manufacturing, are predominantly occupied by men, while others are female-dominated. The data for 2008 show that the sectors employing the highest percentages of women workers are the households-as-employer sector (c63), residential care (c57), other personal services (c62), human health (c56) and education (c56). Those employing fewest women are construction (c27), mining (c4) and the repair sector (c23). There is a major feminization of some service activities, where a qualitative change has been observed in the sense that women have gained access to more qualified jobs (Cebrián and Moreno 2018).
Figure 3 also shows the volatility of the percentage of female workers per sector during the recession and recovery period. The greatest change took place in travel services (c52), which saw a considerable reduction in the ratio of women to men employed. Agriculture (c1), publishing services (c37), and rental services (c50) also experienced significant reductions, while the largest increase took place in the employment services sector (c51) followed closely by other professional (c49) and personal (c62) services, and chemical products (c11).
These graphs show that the EU has a gender-segregated labor market. According to the modified version of the dissimilarity index used (IDw), based on the 64-sector breakdown, the proportion of women workers required to eliminate gender segregation in 2008 was 21.01%, decreasing to 20.27% by 2018. The index points in the same direction (with values of 0.1385 and 0.1272, respectively). Thus, gender sectoral segregation in the European labor market declined over the study period, chiefly as a result of male job-losses (Humpert 2015).
3.2. Structural Decomposition Results
The effects cited below are the measures of the change in female employment if, and only if, the aforementioned component is considered. They are the average of the two possible polar decompositions8. The overall results for female employment, presented in Table 1, show that technological change reduced female employment opportunities over the study period, while shifts in final demand increased them9. Since the latter effect is greater than the former, this translates into a growth rate of almost 1% in female employment in the EU. The two components, while respectively assuming a positive/negative evolution in the number of jobs, contribute to the reduction in female sectoral segregation, due to sectoral differences in changes in the distribution of female and male employment, an issue that will be analyzed later.
Just as employment patterns vary across sectors, the same can be expected for the effects of the various components of the model. As can be seen from Figure 4, total female employment decreased in absolute terms in sectors such as agricultural (c1) and textiles (c6) products, and retail services (c30). Female employment growth was concentrated in the service sectors; more specifically, growth was concentrated in residential care (c57), education (c55) and human health (c56). These three sectors employed 27.3% of the female workforce in the EU 28 in 2008; a share which rose to over 30.8% by 2018. Smaller but nevertheless significant growth can also be observed in the accommodation (c36), travel (c52) and legal accounting (c45) sectors. The overall effect, therefore, is a marked increase in employment, particularly in the activities involved in delivering public services, which were affected by the austerity measures adopted by some countries, which consisted mainly of public service cuts aimed at reducing national budgets. These forced an increase in final household consumption expenditure on such services, and ultimately had a direct positive impact on female labor opportunities.
The demand effect results, ceteris paribus, in the creation of over 20 million female jobs, that is, around 20% of the pre-2008 figure (Table 1). It is quite clear that final demand change had a positive impact in almost all sectors, but mainly in the services sectors; especially those employing higher shares of female workers; i.e., human health (c56), residential care (c57), retail (30) and education (c55).
All four demand components contribute positively, but to different degrees. The bulk of the impact comes from household expenditure, which accounts for 47% of the aggregate demand effect. Government expenditure has the next strongest influence with 29%; the export component is also significant, accounting for 18% of the total demand effect. The minor contribution of gross capital formation, meanwhile, shows that this final demand component remained practically stable throughout the entire study period. All components other than gross capital formation contributed to reduce female sectoral segregation.
A look at the components of final demand change, shown in Figure 5, enables us to conclude that several sectors benefited considerably due to change in household consumption. The highest female employment gains, in order of magnitude, occurred in retail (30), accommodation (c36), residential care (c57), security (c53) and human health (c56) services. Very few sectors were negatively affected by change in private consumption, and, even then, the impact was negligible. The reduction in the segregation index due to this effect taken in isolation would be due mainly to the performance of four sectors, three of them feminized. In the textile industry (c6) the number of women employed decreased more than that of men, and in education (c55) and health (c56) services, the number, both of women and men employed, grew, but the increase relative to the total was lower for women. In construction, the fourth sector in question, which employs predominantly male workers, the reduction in the segregation index is due to the fact that, although both magnitudes grew in absolute terms, they both decreased in relation to total employment, although the male ratio fell further than the female ratio. The trend in some sectors would have the opposite effect, thereby increasing the segregation index. These include retail (c30) and accommodation (c36) services, where there is a higher concentration of female than male workers, and the women’s share increases more than that of men. The agriculture sector (c1) also contributes positively to the increase in the index, but in this case due to men’s share in employment increasing more than that of women.
The effect of change in government expenditure follows a clear pattern. Employment opportunities for women increase in all sectors, thanks to higher public expenditure. This, in addition to the household expenditure effect, explains the increase in female employment in the service sectors. However, it is obvious that job options for women improved only in a few sectors which already had a predominance of female workers, including, predictably, the three main publicly-financed sectors of human health (c56), residential care (c57) and education (c55). The evolution of employment in these three sectors contributes positively to the increase in the segregation index due to higher growth in the female than the male share in total employment. The agricultural sector also contributes positively to the increase in the index, but, in this case, the reduction is greater in the women’s share, thus resulting in further masculinization of the sector. The retail (c30) and accommodation (c36) services and construction sector (c27) contribute in the opposite direction due to the reduction in the female share being greater in the first two, and the reduction in the male share being greater in the last. These changes narrow the gap between the two shares, thus reducing their contribution to the segregation index.
Taking into account the under-representation of women in export-oriented sectors (Rueda-Cantuche and Sousa 2017), the security services (c53) is where export-change effects are felt the most. In this case, the impact is positive and greater than that experienced by any other sector. Meanwhile, exports increased female job opportunities in legal services (c45), retail (c30) and wholesale (c29) trade sectors, and in some industrial sectors such as motor vehicles (c20) and textiles (c6). The employment trends of all sectors are seen jointly to reduce gender sectoral segregation; the biggest contributors are construction (c27) and the three largely public contributors are service sectors of education (c55), health (c56) and residential care (c57). The opposite situation applies in sectors such as the textile industry (c6) and security services (c53) which employ more women than men and show higher growth in female employment. Other sectors, such as motor vehicles (c20) and other transport (c21) industries, present a similar picture, but, being male dominated, show higher growth in male than female employment.
Finally, globally speaking, the effects of investment change are not significant and account for around 5% of the total demand change effect. Analysis by sectors shows that the investment component had a significant impact in two sectors that develop a particular kind of capital, namely security and investigation (c53) and computer programming (c40) services. The overall trend leads to an increase in the segregation index, where the main contributors are computer programming (c40), security services (c53) and construction (c27).
Technological change also has a significant impact, albeit with a very different trend pattern, having caused a net decrease in female employment of more than 15 million jobs. Its components vary behaviorally. Change in intermediate consumption requirements increased female employment opportunities by the equivalent of 0.22 million jobs, whereas changes in female labor requirements had a strong, negative effect over the study period, reducing female employment opportunities by 15.4 million jobs (Table 1). Deeper examination of this negative effect identifies the main cause as increased productivity, which led to a job loss for women of 15.2 million. Change in the female share in the job market also contributed negatively, but on a much smaller scale. This last component contributes to increase female sectoral segregation, while the others have the opposite effect.
Technological change had a negative overall effect on most sectors. It is worth noting that those worst hit were the retail (c30) and agricultural sectors (c1), which, as mentioned earlier, saw the biggest drop in female employment in absolute terms. These sectors are followed immediately in the ranking by human health services (c56), which employs one of the highest absolute numbers of women.
With respect to the components of technological change, as Figure 6 shows, intermediate consumption change had a fairly modest impact in many sectors, with notable effects in only a few. Its greatest positive impact was in security (c53), computer (c40) and retail (c30) services, whereas it had a negative impact on labor use in sectors such as construction (c27), agriculture (c1) and wholesale trade services (c29). If account were also taken of the evolution in male employment, this would result in a decrease in the segregation index. Under these circumstances, the health (c56) and residential care (c57) services would contribute positively to this reduction, given that it was the women’s share in employment that sustained the greater loss. In other, more male-dominated, sectors, such as mining (c4), metals (c15 and c16) or construction (c27), the contribution of these sectors to the reduction in the segregation index is due to the male share experiencing the bigger drop.
Change in labor requirements across sectors had a very different overall effect from that of intermediate consumption change, in that it was negative and of greater magnitude. A sector that was particularly negatively affected was, as expected, retail trade services (c30). Meanwhile, there was a decline in the number of women’s job opportunities in security (c53) and health (c56) services due to changing labor requirements, which also had a negative impact on the agricultural (c1) sector, the textile industry (c6) and education services (c55).
As already stated, change in female labor requirements depends on change in the female participation rate and change in productivity. According to Figure 7, productivity change had a much more significant impact than change in female labor participation. With some exceptions, it was the services sectors that saw the main impact of productivity growth, which was the main factor behind the reduction in female employment in retail trade services (c30); the next worst affected were security (c53) and health (c56) services. Other sectors in which productivity change led to a major reduction in female employment were agriculture (c1), the textile industry (c6), education (c55) and financial services (c41). Given that the effect of productivity growth on male employment is even greater, the global impact on the level of gender segregation should be positive, and therefore lead to a decrease in the index. Many sectors contribute to this change. Among the male dominated sectors, those showing the greatest drops in male employment are agriculture (c1) and construction (c27); while, among the feminized ones, retail services (c30) and the textile industry (c6) make the biggest contributions. However, some sectors contribute in the opposite direction; these include education (c55) and residential services (c57), where the productivity growth trend leads to a proportionally higher increase in female employment, thereby increasing the level of gender segregation.
Although the impact of change in the female participation rate is not comparable to that of change in the productivity growth trend, it can be seen to have had a negative impact on agriculture (c1). Again, retail (c30) and accommodation (c36) services are the second and third most negatively affected, whereas in some sectors, such as security (c53), education (c55) and other personal (c62) services, it meant an increase in women’s job opportunities. Note that education and other personal services are the two sectors with the highest shares of female employment. All these factors considered, what should be observed is an increase in the level of gender segregation. The main contributions would be from some feminized sectors such as education (c55) and other personal (c62) sectors. The employment trend in other sectors, such as retail (c27) and accommodation (c36) services would have the opposite effect, contributing to reduce the level of segregation.
4. Discussion and Conclusions
This paper examines the evolution of sectoral female employment in the EU 28 from 2008 to 2018 using a structural decomposition analysis. Final-demand components are considered along with intermediate consumption and labor market factors and comparative statics analysis is used to isolate individual factor effects. Potential change in the level of sectoral gender segregation under these effects is also analyzed.
Analysis of employment figures in the EU 28 has revealed the presence of sectoral gender bias, strongly contrasting male and female employment distribution patterns, and over- and under-representation of women in certain sectors. Male workers predominate in construction and other industrial sectors, while women are employed mainly in the services sectors. This could be the reason for the strongly negative initial reaction of the male employment rate to the 2008 recession, which hit the male-dominated sectors hardest.
The results of the structural decomposition analysis show that the sectors employing the largest numbers of women are the most volatile. The initial breakdown of change in the number of women workers into technological change and final demand change shows that the former had an overall negative impact on female employment, while the latter, in general, increased women’s job opportunities. Taking this information together with the results obtained for men, it can be said that female employment patterns over the 10 year period of reference support the hypothesis suggesting that, in the event of an economic crisis, women fare better than men in terms of employment. This can be seen in the impact of technical change, which causes a reduction in employment that is greater, in both absolute and relative terms, for men. Final demand performance provides employment gains for both men and women, but has brought about a higher percentage increase in female employment. This links with the aforementioned phenomenon of added workers and the substitution hypothesis, which predicts an increase in jobs for women. These same results cannot support the buffer hypothesis, however, which postulates lower numbers of women in employment.
Analysis of the impact of technological change shows that change in labor demand is the main contributing factor to change in the number of women workers, given that, in most sectors, the other component had a very modest impact in this respect. This suggests that changes in intersectoral dependencies caused little variation in women’s job opportunities. Increased productivity was the reason why job opportunities for women fell so dramatically as a result of technological change. In fact, output grew faster than employment in most sectors during the recession, which meant that each worker was required to produce more than before. The negative impact of productivity growth was strongest in the services sectors, but was also felt in agriculture and textiles. It is important to note, however, that the hardest hit of all was the retail sector, one of the main employers of women along with education and health services. Change in female labor participation had a relatively small negative effect globally, but patterns vary widely by sectors. The main negative effect is to be found in agriculture, accommodation and retail services, whereas some other service sectors, such as research, education and other personal services, saw a positive effect.
Final demand had a completely different impact, however. In all cases, its effect was positive, manifesting in an increase in the number of women workers, particularly in the service sectors, which saw the largest growth in job opportunities for women. This growth took place in the second part of the study period; however, the quality of the new jobs, would be worth investigating, if the necessary data were available. The main driver of female employment was household expenditure, which had most impact in service sectors, such as health and education. Another group of sectors where household expenditure had a positive impact are those serving basic human needs, such as food, which has low income elasticity of demand. This group includes agriculture, the food and beverage industries, and accommodation and food services. Governments’ final demand expenditure increased significantly across the European Union over the entire study period 2008-2018. As might be expected, this had an undeniable positive impact on female employment opportunities, since the sectors employing the largest numbers of women include three public sectors, education, health and residential care services, which is where the highest growth in female employment (81.6%) took place. Increased exports in some sectors caused a major positive impact on female employment. External demand had a strong impact in the retail sector, some manufacturing activities and in some business services. However, the fact that women are concentrated into less export-dependent sectors suggests a gender gap in terms of export-supported employment across the EU (Rueda-Cantuche and Sousa 2017).
As in previous periods, increased demand in the domestic service industry is a key contributor to the rise in the female employment rate observed from 2008 onwards (Akbulut 2011). As already shown, these are the activities that employ the largest numbers of women, and the sectors which, together with internal demand effects, have contributed most to increasing female labor opportunities in Europe over the last few years.
Again, it would be interesting to obtain further information on contractual arrangements by sectors, given that, according to Addabbo et al. (2014), female participation in the labor market is sometimes atypical, i.e., through non-permanent jobs, involuntary part-time jobs or temporary work. The gender bias affecting women in the labor market is also linked to changes in social norms with respect to formal employment for women and household arrangements (Rubery and Rafferty 2013). Thus, the decision to engage in formal employment also depends on the normative context in which the decision-making is embedded. This means that those women who are expected to shoulder a larger share of house work and family support see their capacity for formal employment undermined (Kushi and McManus 2018).
These changes have resulted in a reduction in the level of gender sectoral segregation; change in household expenditure again being the main driver. Changing trends in labor requirements and gross capital formation have the opposite effect, thus increasing the level of sectoral segregation. These results show that, despite the observed increase in female employment in the European Union over the study period, there is still further need for gender-equity policies. Some empirical studies have presented evidence suggesting that the expansion of social care services, specially in times of crisis and high unemployment, would lead to economic recovery and generate employment in Europe, while stimulating sustainability and gender equality. In fact, it might even lead the way towards new and more effective policies for reducing unemployment and generating growth while at the same time reducing gender inequality.
Author Contributions
All authors contributed equally to the data preparation and the analysis and to the interpretation of results. All authors made major contributions to writing the manuscript. All authors have read and agreed to the published version of the manuscript.
Funding
This work was supported by the Spanish Ministry of Economy and Competitiveness (Project ECO2016-76681-R).
Conflicts of Interest
The authors declare no conflict of interest.
Appendix A. Sectors and Codes
| Sectors | Code |
| Products of agriculture, hunting and related services | c1 |
| Products of forestry, logging and related services | c2 |
| Fish and other fishing products; aquaculture products; support services to fishing | c3 |
| Mining and quarrying | c4 |
| Food, beverages and tobacco products | c5 |
| Textiles, wearing apparel, leather and related products | c6 |
| Wood and of products of wood and cork, except furniture; articles of straw and plaiting materials | c7 |
| Paper and paper products | c8 |
| Printing and recording services | c9 |
| Coke and refined petroleum products | c10 |
| Chemicals and chemical products | c11 |
| Basic pharmaceutical products and pharmaceutical preparations | c12 |
| Rubber and plastic products | c13 |
| Other non-metallic mineral products | c14 |
| Basic metals | c15 |
| Fabricated metal products, except machinery and equipment | c16 |
| Computer, electronic and optical products | c17 |
| Electrical equipment | c18 |
| Machinery and equipment n.e.c. | c19 |
| Motor vehicles, trailers and semi-trailers | c20 |
| Other transport equipment | c21 |
| Furniture and other manufactured goods | c22 |
| Repair and installation services of machinery and equipment | c23 |
| Electricity, gas, steam and air conditioning | c24 |
| Natural water; water treatment and supply services | c25 |
| Sewerage services; sewage sludge; waste collection, treatment and disposal services; materials recovery services; remediation services and other waste management services | c26 |
| Constructions and construction works | c27 |
| Wholesale and retail trade and repair services of motor vehicles and motorcycles | c28 |
| Wholesale trade services, except of motor vehicles and motorcycles | c29 |
| Retail trade services, except of motor vehicles and motorcycles | c30 |
| Land transport services and transport services via pipelines | c31 |
| Water transport services | c32 |
| Air transport services | c33 |
| Warehousing and support services for transportation | c34 |
| Postal and courier services | c35 |
| Accommodation and food services | c36 |
| Publishing services | c37 |
| Motion picture, video and television programme production services, sound recording and music publishing; programming and broadcasting services | c38 |
| Telecommunications services | c39 |
| Computer programming, consultancy and related services; Information services | c40 |
| Financial services, except insurance and pension funding | c41 |
| Insurance, reinsurance and pension funding services, except compulsory social security | c42 |
| Services auxiliary to financial services and insurance services | c43 |
| Real estate services excluding imputed rents | c44 |
| Legal and accounting services; services of head offices; management consultancy services | c45 |
| Architectural and engineering services; technical testing and analysis services | c46 |
| Scientific research and development services | c47 |
| Advertising and market research services | c48 |
| Other professional, scientific and technical services and veterinary services | c49 |
| Rental and leasing services | c50 |
| Employment services | c51 |
| Travel agency, tour operator and other reservation services and related services | c52 |
| Security and investigation services; services to buildings and landscape; office support and other business support services | c53 |
| Public administration and defence services; compulsory social security services | c54 |
| Education services | c55 |
| Human health services | c56 |
| Residential care services; social work services without accommodation | c57 |
| Creative, arts, entertainment, library, archive, museum, other cultural services; gambling services | c58 |
| Sporting services and amusement and recreation services | c59 |
| Services furnished by membership organisations | c60 |
| Repair services of computers and personal and household goods | c61 |
| Other personal services | c62 |
| Services of households as employers; goods and services produced by households for own use | c63 |
| Services provided by extraterritorial organisations and bodies | c64 |
References
- Adams-Prassl, Abigail, Teodora Boneva, Marta Golin, and Christopher Rauh. 2020. Inequality in the Impact of the Coronavirus Shock: Evidence from Real Time Surveys. Journal of Public Economics. in Press. [Google Scholar] [CrossRef]
- Addabbo, Tindara, Lina Galvez Munoz, Antigone Lyberaki, Natacha Ordioni, and Paula Rodriguez Madrono. 2014. The Impacts of the Crisis on Gender Equality and Women’s Wellbeing in EU Mediterranean Countries. Turin: UNICRI United Nations Interregional Crime and Justice Research Institute. [Google Scholar]
- Akbulut, Rahşan. 2011. Sectoral changes and the increase in women’s labor force participation. Macroeconomic Dynamics 15: 240–64. [Google Scholar] [CrossRef] [Green Version]
- Aldaz Odriozola, Leire, and Begoña Eguía Peña. 2016. Segregación ocupacional por género y nacionalidad en el mercado laboral español/Gender and Nationality Based Occupational Segregation in the Spanish Labor Market. Revista Española de Investigaciones Sociológicas 156: 3–20. [Google Scholar] [CrossRef]
- Alon, Titan, Matthias Doepke, Jane Olmstead-Rumsey, and Michèle Tertilt. 2020. The Impact of COVID-19 on Gender Equality. NBER Working Paper Series 26947. Cambridge: National Bureau of Economic Research. [Google Scholar]
- Alonso-Villar, Olga, and Coral del Río. 2017a. Segregación ocupacional por razón de género y estatus migratorio en España y sus consecuencias en términos de bienestar. Ekonomiaz 91: 124–63. [Google Scholar]
- Alonso-Villar, Olga, and Coral del Río. 2017b. Local Segregation and Well-Being. Review of Income and Wealth 63: 269–87. [Google Scholar] [CrossRef]
- Bargawi, Hannah, Giovanni Cozzi, and Susan Himmelweit. 2017. Economics and Austerity in Europe. Gendered Impacts and Sustainable Alternatives. London: Routledge. [Google Scholar]
- Belegri-Roboli, Athena, Maria Markaki, and Panayotis G. Michaelides. 2011. Labour productivity changes and working time: The case of Greece. Economic Systems Research 23: 329–39. [Google Scholar] [CrossRef]
- Bertocchi, Graziella. 2020. COVID Susceptibility Women and Work. VOX CEPR Policy Portal. London: Centre for Economic Policy Research. [Google Scholar]
- Bettio, Francesca, and Alina Verashchagina. 2014. Women and men in the “Great European recession”. In Women and Austerity. The Economic Crisis and the Future for Gender Equality. Edited by Maria Karamessini and Jill Rubery. London: Routledge, pp. 57–81. [Google Scholar]
- Bettio, Francesca, Marcella Corsi, Carlo D’Ippoliti, Antigone Lyberaki, Manuela Samek, and Alina Verashchagina Lodovici. 2013. The Impact of the Economic Crisis on the Situation of Women and Men and on Gender Equality Policies. Luxemburg: European Commission. [Google Scholar] [CrossRef]
- Blau, Francine D., and Lawrence M. Kahn. 2017. The gender wage gap: Extent, Trends, and Explanations. Journal of Economic Literature 55: 789–865. [Google Scholar] [CrossRef] [Green Version]
- Blau, Francine D., and Anne E. Winkler. 2018. The Economics of Women, Men, and Work. New York: Oxford University Press. [Google Scholar]
- Boll, Christina, and Andreas Lagemann. 2018. Gender Pay Gap in EU Countries Based on SES (2014). Luxemburg: European Commission. [Google Scholar] [CrossRef]
- Boll, Christina, Julian Leppin, Anja Rossen, and André Wolf. 2016. Magnitude and Impact Factors of the Gender Pay Gap in EU Countries. Luxemburg: European Commission. [Google Scholar] [CrossRef]
- Boll, Christina, Anja Rossen, and André Wolf. 2017. The EU Gender Earnings Gap: Job Segregation and Working Time as Driving Factors. Jahrbucher Fur Nationalokonomie Und Statistik 237: 407–52. [Google Scholar] [CrossRef] [Green Version]
- Borrowman, Mary, and Stephan Klasen. 2020. Drivers of Gendered Sectoral and Occupational Segregation in Developing Countries. Feminist Economics 26: 62–94. [Google Scholar] [CrossRef]
- Caraway, Teri L. 2006. Gendered paths of industrialization: A cross-regional comparative analysis. Studies in Comparative International Development 41: 26–52. [Google Scholar] [CrossRef]
- Carrascal, André. 2017. Drivers of change in the European youth employment: A comparative structural decomposition analysis. Economic Systems Research 29: 463–85. [Google Scholar] [CrossRef]
- Cebrián, Inmaculada, and Gloria Moreno. 2018. Desigualdades de género en el mercado laboral. Panorama Social 27: 47–63. [Google Scholar]
- Choudhry, Misbah T., and Paul Elhorst. 2018. Female labour force participation and economic development Article information. International Journal of Manpower 39: 896–912. [Google Scholar] [CrossRef]
- Connelly, Rachel, and Ebru Kongar. 2017. Feminist Approaches to Time Use. In Gender and Time Use in a Global Context. The Economics of Employment and Unpaid Labor. Edited by Rachel Conenlly and Ebru Kongar. New York: Palgrave Macmillan, pp. 1–28. [Google Scholar]
- Danchev, Svetoslav, Grigoris Pavlou, and Ilias Kostarakos. 2014. Input-Output Analysis of Sectoral Labor Dynamism. In The Rebirth of the Greek Labor Market. Building Toward 2020 After the Global Financial Meltdown. Edited by Panagiotis E. Petrakis. New York: Palgrave Macmillan, pp. 153–80. [Google Scholar]
- De Henau, Jerome, and Susan Himmelweit. 2020. Stimulating OECD Economies Post-Covid by Investing in Care. IKD Working Paper 85. Milton Keynes: The Open University, Innovation, Knowledge and Development Research Centre. [Google Scholar]
- Dietzenbacher, Erik, and Bart Los. 1998. Structural Decomposition Techniques: Sense and Sensitivity. Economic Systems Research 10: 307–24. [Google Scholar] [CrossRef]
- Duarte, Rosa, Cristina Sarasa, and Mónica Serrano. 2019. Structural change and female participation in recent economic growth: A multisectoral analysis for the Spanish economy. Economic Systems Research 31: 574–93. [Google Scholar] [CrossRef] [Green Version]
- Duncan, Otis D., and Beverly Duncan. 1955. A Methodological Analysis of Segregation Indexes. American Sociological Review 20: 210–17. [Google Scholar] [CrossRef]
- European Commission. 2017. EU Action Plan 2017–2019 Tackling the Gender Pay Gap. COM(2017) 678 Final. Luxemburg: European Commission. [Google Scholar]
- European Commission. 2019. Report on Equality between Women and Men in the European Union. Luxemburg: European Commission. [Google Scholar]
- European Council. 2013. Council Regulation (EC) No 549/2013 on the European System of National and Regional Accounts in the European Union (ESA 2010). Brussels: European Council. [Google Scholar]
- Eurostat. 2019a. Symmetric Input-Output Table at Basic Prices. Eurostat Home. Available online: https://appsso.eurostat.ec.europa.eu/nui/show.do?dataset=naio_10_cp1700&lang=en (accessed on 30 September 2019).
- Eurostat. 2019b. Employment by Sex, Age and Detailed ECONOMIC activity. Eurostat Home. Available online: https://appsso.eurostat.ec.europa.eu/nui/show.do?dataset=lfsq_egan22d&lang=en (accessed on 30 September 2019).
- Forssell, Osmo. 1990. The input-output framework for analysing changes in the use of labour by education levels. Economic Systems Research 2: 363–76. [Google Scholar] [CrossRef]
- Gaddis, Isis, and Stephan Klasen. 2014. Economic development, structural change, and women’s labor force participation: A reexamination of the feminization U hypothesis. Journal of Population Economics 27: 639–81. [Google Scholar] [CrossRef]
- Gálvez Muñoz, Lina, and Paula Rodríguez-Modroño. 2017. Crisis, austeridad y transformaciones en las desigualdades de género. Ekonomiaz 91: 330–59. [Google Scholar]
- Goldin, Claudia. 1994. The U-shaped female labour force function in economic development and economic history. NBER Working Paper Series 4707: 61–90. [Google Scholar]
- Goldin, Claudia. 2014. A grand gender convergence: Its last chapter. American Economic Review 104: 1091–119. [Google Scholar] [CrossRef] [Green Version]
- Gregory, Mary, Ben Zissimos, and Christine Greenhalgh. 2001. Jobs for the skilled: How technology, trade and domestic demand changed the structure of UK employment, 1979–90. Oxford Economic Papers 53: 20–46. [Google Scholar] [CrossRef]
- Gunluk-Senesen, Gulay, and Umit Senesen. 2011. Decomposition of labour demand by employer sectors and gender: Findings for major exporting sectors in Turkey. Economic Systems Research 23: 233–53. [Google Scholar] [CrossRef]
- Hegewisch, Ariane, and Heidi Liepmann. 2014. Occupational Segregation and the Gender Wage Gap: A Job Half Done. Washington, DC: Institute for Women´s Policy Research. [Google Scholar]
- Hegewisch, Ariane, Heidi Liepman, Jeff Hayes, and Heidi Hartman. 2010. Separate and Unequal: Occupation-Establishment Sex Segregation and the Gender Wage Gap. Washington, DC: Institute for Women´s Policy Research. [Google Scholar]
- Humpert, Sthephan. 2015. Gender-based Segregation before and after the Great Recession. Theoretical Applied Economics 22: 53–62. [Google Scholar]
- Hupkau, Claudia, and Barbara Petrongolo. 2020. Work, care and gender during the Covid-19 crisis. In CEP Covid-19 Analysis. Paper No. 002. London: London School of Economics and Political Science. [Google Scholar]
- ILO. 2016. Women at Work: Trends 2016. Geneva: International Labour Office. [Google Scholar]
- Kaminioti, Olympia. 2014. The Labor Dynamism of the Sectors of Economic Activity. In The Rebirth of Greel Labor Markets. Building Toward 2020 after the Global Financial Meltdown. Edited by Panagiotis E. Petrakis. New York: Palgrave Macmillan, pp. 127–52. [Google Scholar]
- Karamessini, Maria, and Jill Rubery. 2014a. Economic crisis and austerity. Challenges to gender equality. In Women and Austerity. The Economic Crisis and the Future for Gender Equality. Edited by Maria Karamessini and Jill Rubery. London: Routledge, pp. 314–51. [Google Scholar]
- Karamessini, Maria, and Jill Rubery. 2014b. The Challenge of Austerity For Equality. Revue de l’OFCE 133: 15–39. [Google Scholar] [CrossRef] [Green Version]
- Karamessini, Maria, and Jill Rubery. 2017. The Challenge of Austerity for Gender Equality in Europe: A Consideration of Eight Countries at the Center of the Crisis. In Gender and Time Use in a Global Context. Edited by Rachel Connelly and Ebru Kongar. New York: Palgrave Macmillan, pp. 51–83. [Google Scholar]
- Kim, Kijong, Ipek Ilkkaracan, and Tolga Kaya. 2019. Public investment in care services in Turkey: Promoting employment & gender inclusive growth. Journal of Policy Modeling 41: 1210–29. [Google Scholar] [CrossRef]
- Kucera, David, and Sheba Tejani. 2014. Feminization, defeminization, and structural change in manufacturing. World Development 64: 569–82. [Google Scholar] [CrossRef]
- Kunze, Astrid. 2018. The gender wage gap in developed countries. In The Oxford Handbook of Women and The Economy. Edited by Susab L. Averett, Laura M. Argys and Saul D. Hoffman. Oxford: Oxford University Press, pp. 369–94. [Google Scholar]
- Kushi, Sidita, and Ian P. McManus. 2018. Gendered Costs of Austerity: The Effects of the Great Recession and Government Policies on Employment across the OECD. International Labour Review 157: 557–87. [Google Scholar] [CrossRef]
- Lechman, Ewa, and Harleen Kaur. 2015. Economic growth and female labor force participation –verifying the U-feminization hypothesis. New evidence for 162 countries over the period 1990–2012. Economics and Sociology 8: 246–57. [Google Scholar] [CrossRef]
- Leontief, Wassily. 1974. Structure of the World Economy: Outline of a Simple Input-Output Formulation. American Economic Review 64: 823–34. [Google Scholar]
- Madariaga, Rafa. 2018. Factors driving sectoral and occupational employment changes during the Spanish boom (1995–2005). Economic Systems Research 30: 400–21. [Google Scholar] [CrossRef]
- Magacho, Guilherme R., John S. L. McCombie, and Joaquim J. M. Guilhoto. 2018. Impacts of trade liberalization on countries’ sectoral structure of production and trade: A structural decomposition analysis. Structural Change and Economic Dynamics 46: 70–77. [Google Scholar] [CrossRef]
- Maier, Friederike. 2011. Will the crisis change gender relations in labour markets and society? Journal of Contemporary European Studies 19: 83–95. [Google Scholar] [CrossRef]
- Martínez-Tola, Elena, María L. De la Cal, and Irantzu Álvarez-González. 2018. Crisis and austerity: Threat for women´s employment in the European regions. Convergentia. Revista de Ciencias Sociales 77: 29–53. [Google Scholar] [CrossRef] [Green Version]
- Maruani, Margaret. 2000. De la Sociología del trabajo a la Sociología del empleo. Política y Sociedad 34: 9–17. [Google Scholar]
- Miller, Ronald E., and Peter D. Blair. 2009. Input–Output Analysis. Foundations and Extensions, 2nd ed. Cambridge: Cambridge University Press. [Google Scholar]
- Moir, Hazel, and Joy S. Smith. 1979. Industrial segregation in the Australian Labour Market. The Journal of Industrial Relations 21: 281–91. [Google Scholar] [CrossRef]
- OECD. 2012. Closing the Gender Gap. Act Now. Paris: OECD Publishing. [Google Scholar]
- OECD. 2017. The Pursuit of Gender Equality: An Uphill Battle. Paris: OECD Publishing. [Google Scholar] [CrossRef]
- Peiró, Amado, Jorge Belaire-Franch, and María T. Gonzalo. 2012. Unemployment, cycle and gender. Journal of Macroeconomics 34: 1167–75. [Google Scholar] [CrossRef]
- Pena-Boquete, Yolanda, Sergio De Stefanis, and Manuel Fernández-Grela. 2010. The distribution of the gender wage discrimination in Italy and Spain: A comparison using the ECHP. International Journal of Manpower 31: 109–37. [Google Scholar] [CrossRef] [Green Version]
- Pérez Orozco, Amaia. 2005. Economía del género y economía feminista ¿conciliación o ruptura? Revista Venezolana de Estudios de La Mujer 10: 43–64. [Google Scholar]
- Périvier, Hélène. 2014. Men and Women during the Economic Crisis. Employment Trends in Eight European Countries. Revue de l’OECD 133: 41–84. [Google Scholar] [CrossRef] [Green Version]
- Périvier, Hélène. 2018. Recession, austerity and gender: A comparison of eight European labour markets. International Labour Review 157: 1–37. [Google Scholar] [CrossRef]
- Perugini, Cristiano, Jelena Žarković Rakić, and Marko Vladisavljević. 2019. Austerity and gender inequalities in Europe in times of crisis. Cambridge Journal of Economics 43: 733–67. [Google Scholar] [CrossRef]
- Razzu, Giovanni, and Carl Singleton. 2016. Gender and the business cycle: An analysis of labour markets in the US and UK. Journal of Macroeconomics 47: 131–46. [Google Scholar] [CrossRef] [Green Version]
- Razzu, Giovanni, and Carl Singleton. 2018. Segregation and Gender Gaps in the United Kingdom’s Great Recession and Recovery. Feminist Economics 24: 31–55. [Google Scholar] [CrossRef]
- Rose, Adam, and Sthephen Casler. 1996. Input-Output structural analysis decomposition: A critical appraisal. Economic System Research 8: 33–62. [Google Scholar] [CrossRef]
- Rose, Adam, and Chia-Yon Chen. 1991. Sources of change in energy use in the U.S. economy, 1972–1982. A structural decomposition analysis. Resources and Energy 13: 1–21. [Google Scholar] [CrossRef]
- Rubery, Jill. 1988. Women and Recession. London: Routledge, New York: Kegal Paul. [Google Scholar]
- Rubery, Jill. 2015. Austerity and the future for gender equality in Europe. Industrial and Labor Relations Review 68: 715–41. [Google Scholar] [CrossRef]
- Rubery, Jill, and Gail Hebson. 2018. Applying a gender lens to employment relations: Revitalisation, resistance and risks. Journal of Industrial Relations 60: 414–36. [Google Scholar] [CrossRef]
- Rubery, Jill, and Anthony Rafferty. 2013. Women and recession revisited. Work, Employment and Society 27: 414–32. [Google Scholar] [CrossRef]
- Rueda-Cantuche, José M., and Nuno Sousa. 2017. Are EU Exports Gender-Blind? Some Key Features of Women Participation in Exporting Activities in the EU. TRADE Chief Economist Note, No. 3. Brussels: European Union, pp. 1–20. [Google Scholar]
- Salgueiro, Fernando, Suzana Quinet de Andrade, and Marcilio Zanelli. 2016. Decomposição Estrutural Do Emprego E Da Renda No Brasil: Uma Análise De Insumo-Produto—1990 a 2007. Nova Economia 26: 909–42. [Google Scholar]
- Saraçoğlu, Dürdane Ş., Emel Memiş, Ebru Voyvoda, and Burça Kızılırmak. 2018. Changes in Global Trade Patterns and Women’s Employment in Manufacturing, 1995–2011. Feminist Economics 24: 1–28. [Google Scholar] [CrossRef]
- Schaffer, Axel. 2007. Women’s and men’s contributions to satisfying consumers’ needs: A combined time use and input-output analysis. Economic Systems Research 19: 23–36. [Google Scholar] [CrossRef]
- Schaffer, Axel. 2008. Gender-Specific Input-Output Analysis. Interdisciplinary Information Sciences 14: 61–68. [Google Scholar] [CrossRef] [Green Version]
- Scicchitano, Sergio. 2012. The male–female pay gap across the managerial workforce in the United Kingdom: A semi-parametric decomposition approach. Applied Economics Letters 19: 1293–97. [Google Scholar] [CrossRef]
- Scicchitano, Sergio. 2014. The gender wage gap among Spanish managers. International Journal of Manpower 35: 327–44. [Google Scholar] [CrossRef]
- Sevilla, Almudena, and Sarah Smith. 2020. Baby Steps: The Gender Division of Childcare after COVID19. Discussion Paper Series No. 13302. Bonn: IZA Institute of Labor Economics. [Google Scholar]
- Simas, Moana S., and Richard Wood. 2018. The distribution of labour and wages embodied in European consumption. In The Social Effects of Global Trade Quantifying Impacts Using Multi-Regional Input-Output Analysis. Edited by Joy Murray, Arunima Malik and Arne Geschke. Singapore: Taylor & Francis, pp. 103–16. [Google Scholar]
- Simas, Moana S., Laura Golsteijn, Mark A. J. Huijbregts, Richard Wood, and Edgar G. Hertwich. 2014. The “bad labor” footprint: Quantifying the social impacts of globalization. Sustainability 6: 7514–40. [Google Scholar] [CrossRef] [Green Version]
- Sin, Isabelle, Steven Stillman, and Richard Fabling. 2017. What Drives the Gender Wage Gap? Examining the Roles of Sorting, Productivity Differences, and Discrimination. Motu Working Paper 17-15. Motu Economic and Public Policy Research. [Google Scholar] [CrossRef] [Green Version]
- Skolka, Jiří. 1989. Input-Output Structural Decomposition Analysis for Austria. Journal of Policy Modelling 11: 45–66. [Google Scholar] [CrossRef]
- Steinmetz, Stephanie. 2012. The Contextual Challenges of Occupational Sex Segregation: Deciphering Cross-National Differences in Europe. Berlin: VS Verlag. [Google Scholar]
- Thomason, Bobbi, and Inmaculada Macias-Alonso. 2020. COVID-19 and raising the value of care. Gender, Work & Organization, 1–4. [Google Scholar]
- Tin, Poo B. 2014. A decomposition analysis for labour demand: Evidence from Malaysian manufacturing sector. WSEAS Transactions on Business and Economics 11: 32–41. [Google Scholar]
- Tonoyan, Vartuhi, Robert Strohmeyer, and Jennifer E. Jennings. 2020. Gender Gaps in Perceived Start-up Ease: Implications of Sex-based Labor Market Segregation for Entrepreneurship across 22 European Countries. Administrative Science Quarterly 65: 181–225. [Google Scholar] [CrossRef]
- United Nations. 2017. El empoderamiento económico de la mujer en el cambiante mundo del trabajo. E/CN.6/2017/3. Vol. E/CN.6/201. Consejo Económico y Social. Naciones Unidas. New York: United Nations. [Google Scholar]
- Woetzel, Jonathan, Anu Madgavkar, Kweilin Ellingrud, Eric Labaye, Sandrine Devillard, Eric Kutcher, James Manyika, Richard Dobbs, and Mekala Krishnan. 2015. The Power of Parity: How Advancing Women’s Equality Can Add $12 Trillion to Global Growth. London: McKinsey Global Institute. [Google Scholar]
- Yurtoglu, B. Burcin, and Christine Zulehner. 2009. Sticky Floors and Glass Ceilings in Top Corporate Jobs. Available online: https://ssrn.com/abstract=1470860 (accessed on 3 August 2020).
| 1 | |
| 2 | The protective effect of gender segregation on female employment in less cyclical sectors had also been identified in previous recessions (Rubery 1988; Rubery and Rafferty 2013). |
| 3 | Other decompositions, based on shift-share analysis, can be found in the literature, but they consider only two components: the demographic effect and the participation effect (Rubery 1988; Périvier 2014; Rubery and Rafferty 2013). |
| 4 | This is to evaluate changes in male and female employment, and thus compute the respective sectoral segregation indexes. In the results section, however, the exposition and analysis consider changes only in female employment. |
| 5 | In this structural decomposition method, changes in input-output coefficients are interpreted as technological change, that is, changes that do not necessarily impact on total technological growth, in the Solow sense of the term (Magacho et al. 2018). These changes are interpreted as any factor that can cause a change in the technical coefficient, such as technological change, technical substitution and scale effects (Rose and Casler 1996). |
| 6 | During the recovery stage of previous recessions, annual growth rates were higher for male than for female employment (Maier 2011). |
| 7 | In some countries, the female share in total employment has grown as some housework has been externalized through public services, but most of the jobs are in the care sector (Périvier 2018). This has been a key contributing factor to the gender segregation of labor markets. |
| 8 | The interaction effects are ignored because, based on this average, they are almost null. |
| 9 | This is a common finding in SDA applications analyzing employment change, which is why authors focus their analyses mainly on the other components (Madariaga 2018). |
Figure 1.
Evolution of female and male employment (left axis, thousands of employees) from 2008 to 2018 and annual change (right axis, percentage) in EU 28.
Figure 1.
Evolution of female and male employment (left axis, thousands of employees) from 2008 to 2018 and annual change (right axis, percentage) in EU 28.
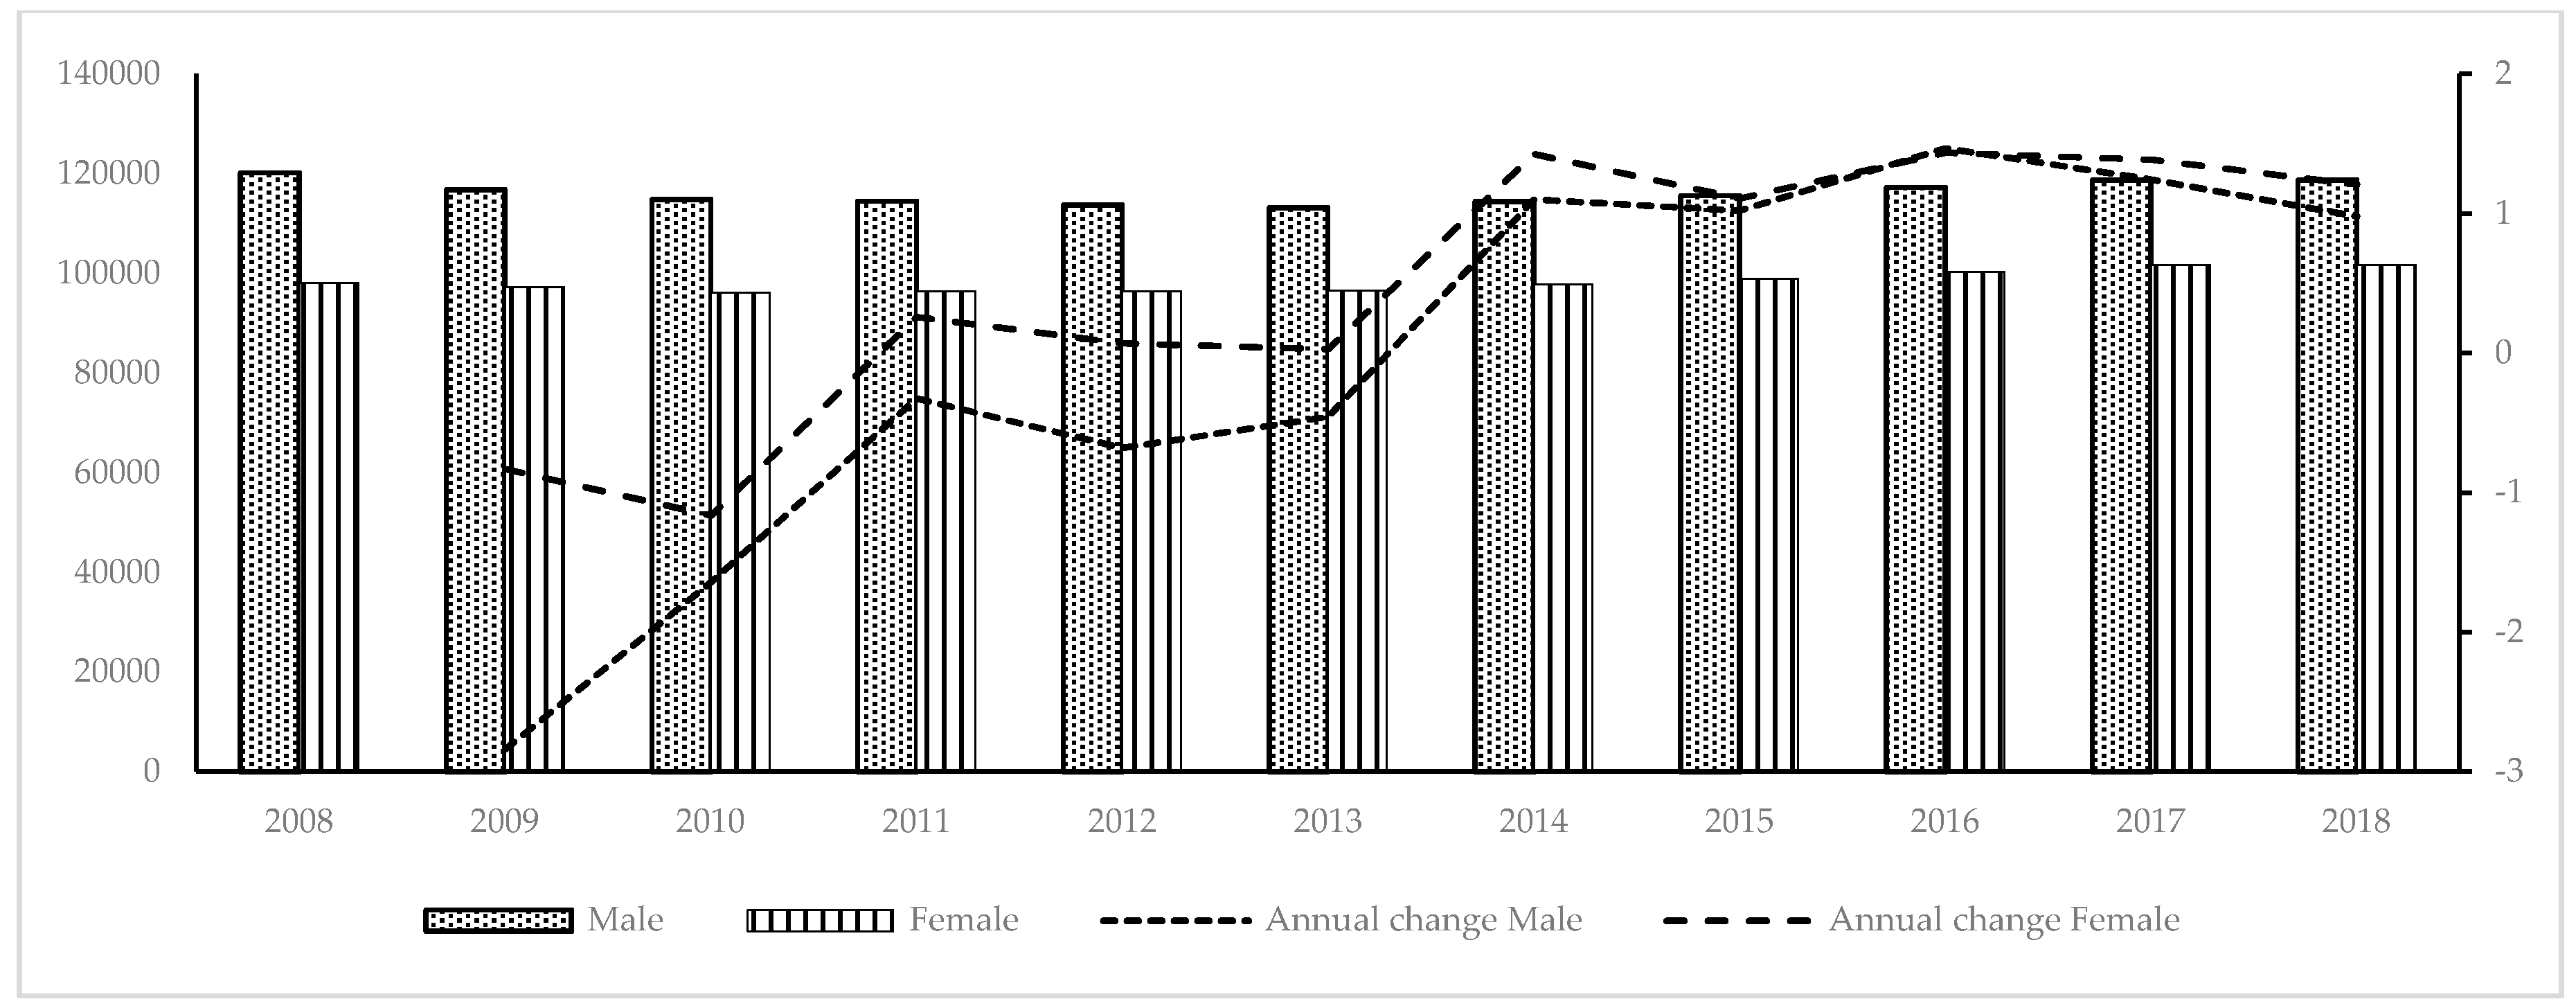
Figure 2.
Evolution of female employment by groups of sectors (thousands).
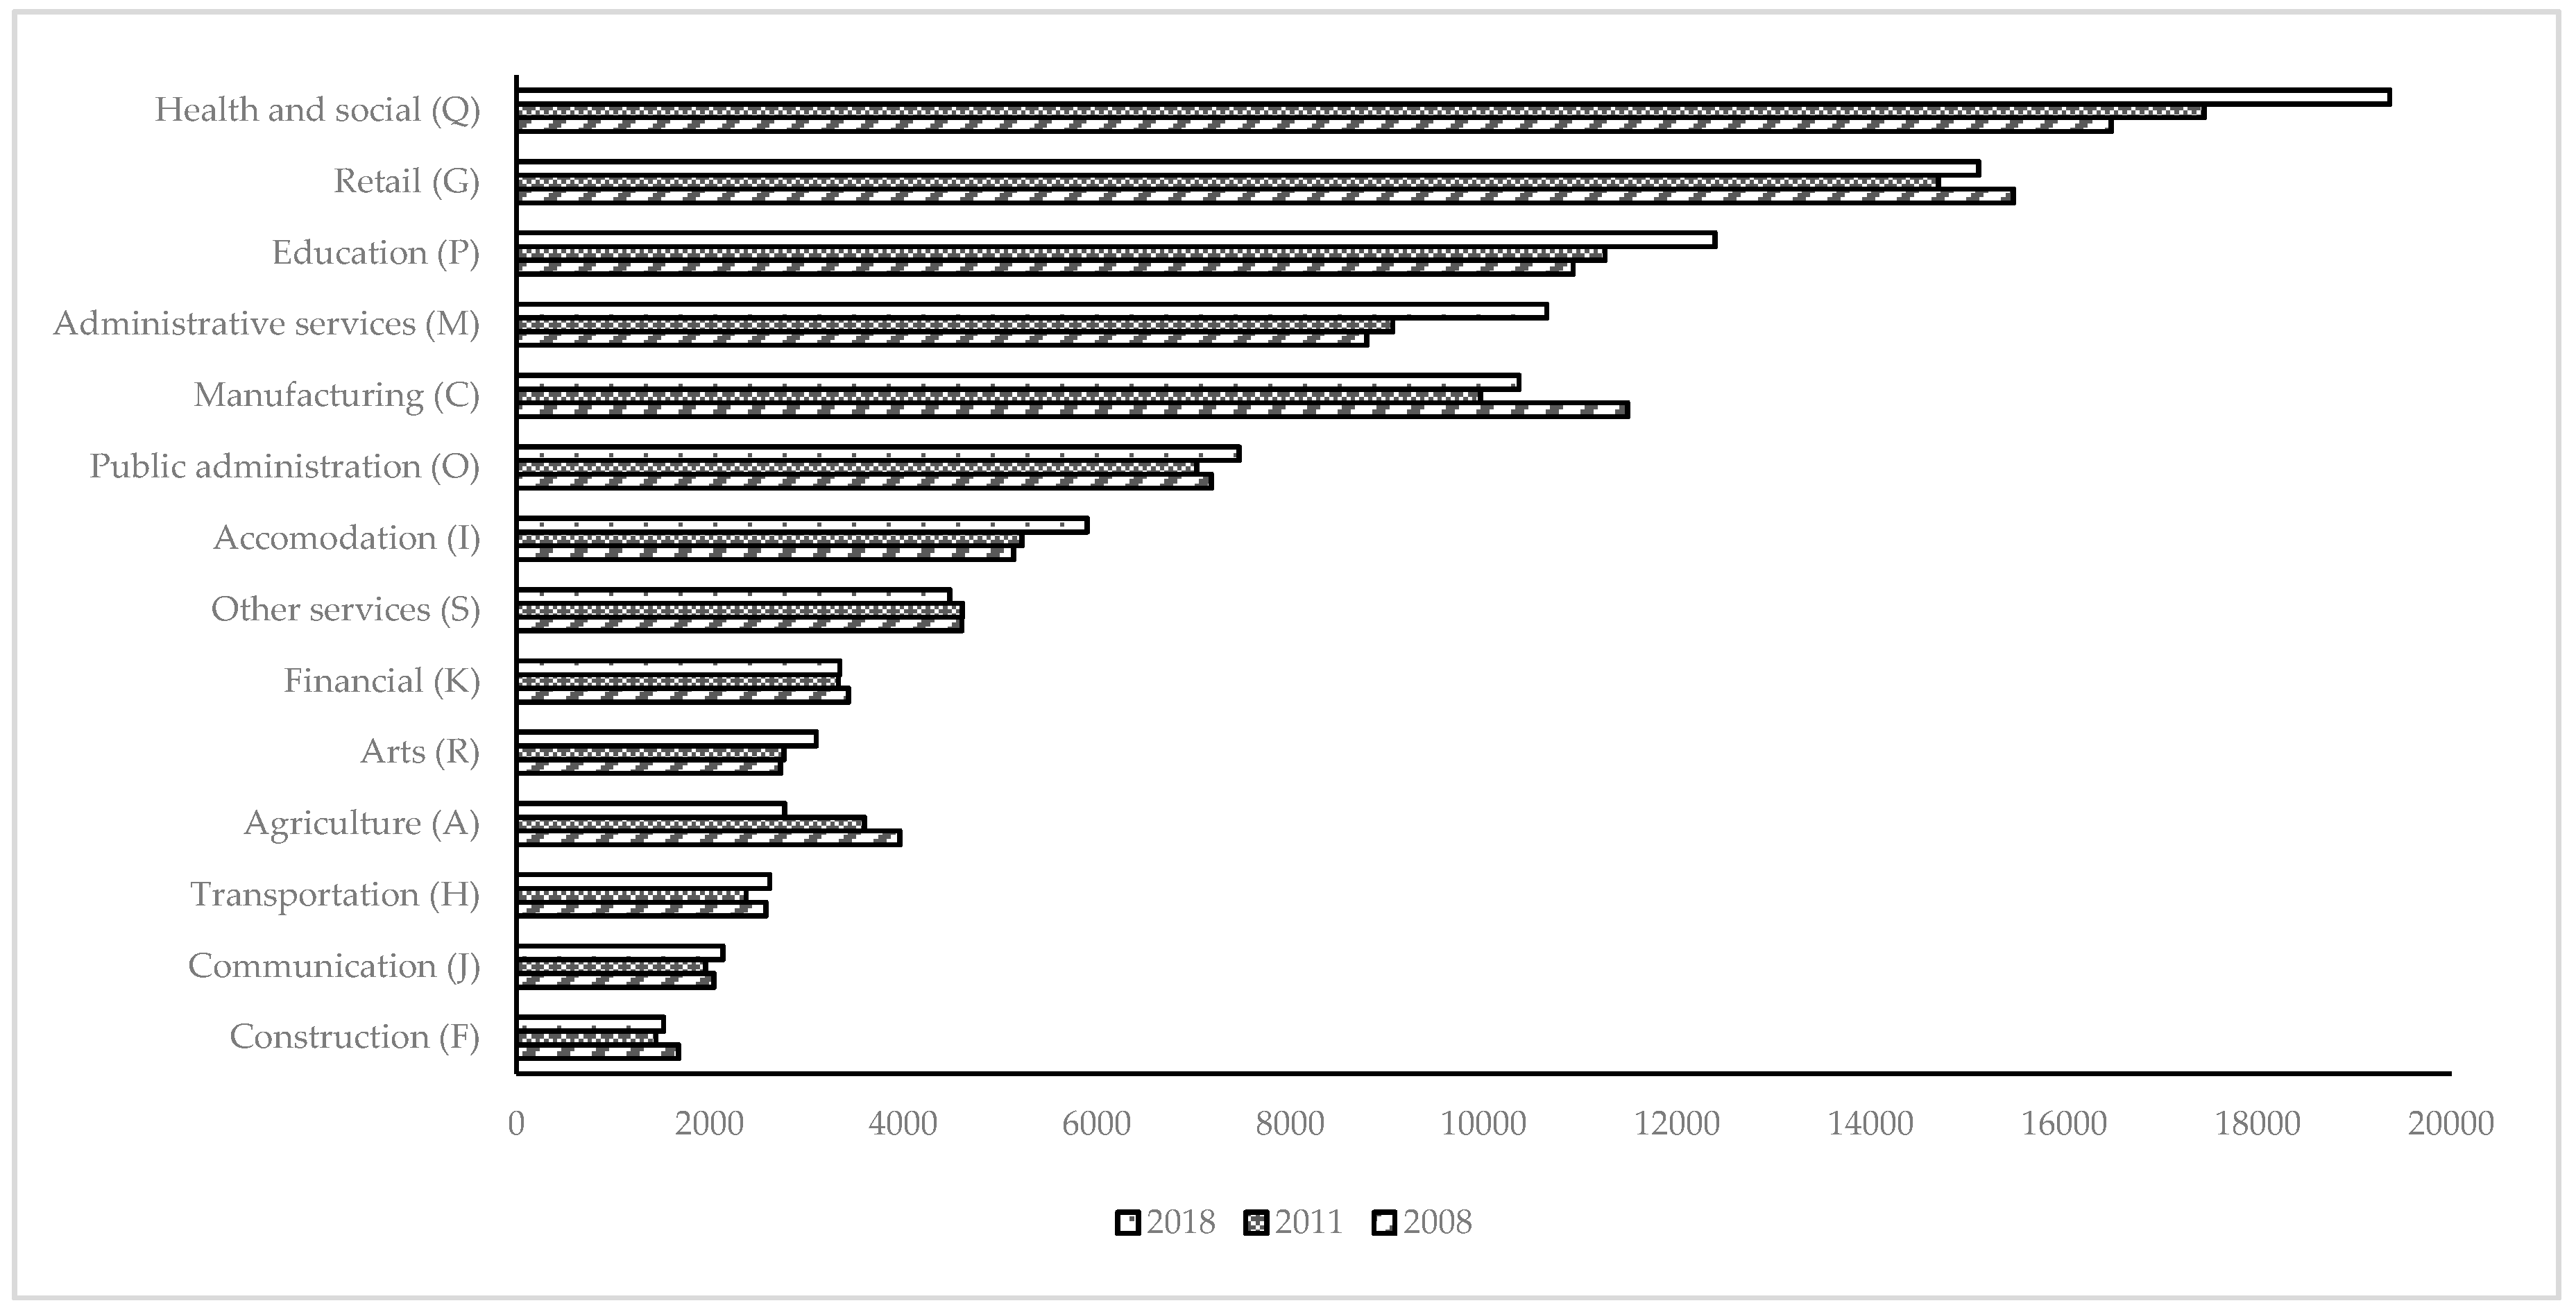
Figure 3.
Female workers in each sector (left axis, percentage of total workers) and the change between 2008 and 2018 (right axis, percentage of 2008 figures). The sectors are ordered by percentage of female workers in 2008.
Figure 3.
Female workers in each sector (left axis, percentage of total workers) and the change between 2008 and 2018 (right axis, percentage of 2008 figures). The sectors are ordered by percentage of female workers in 2008.
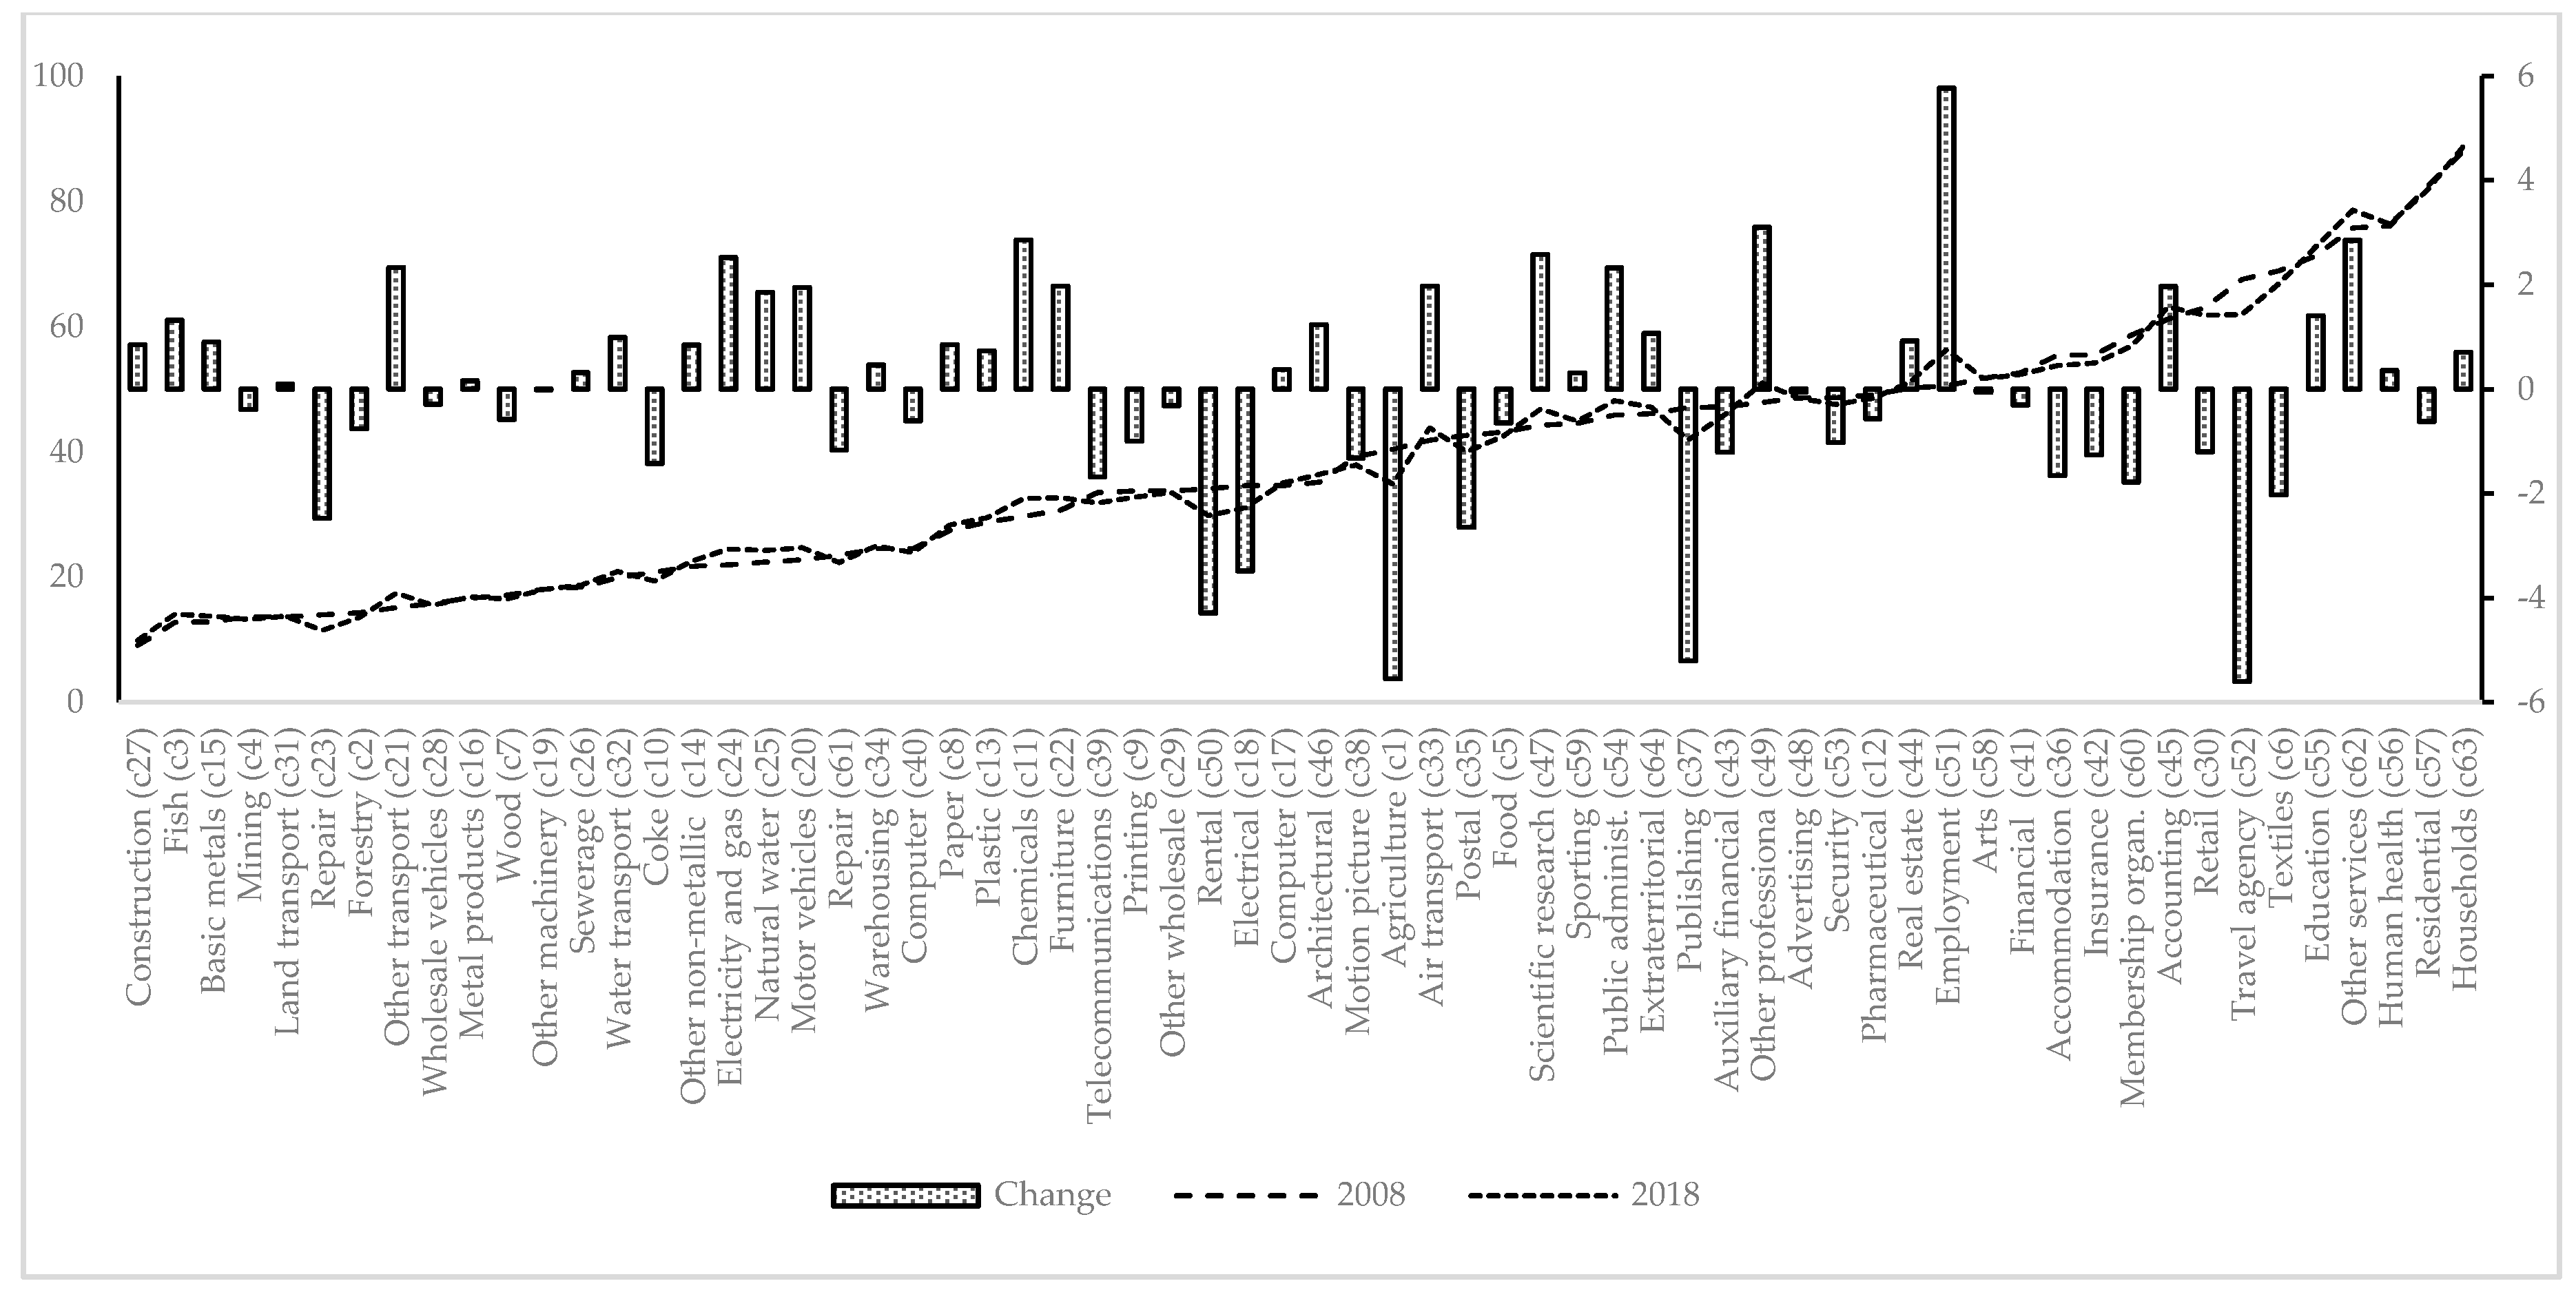
Figure 4.
Total, final demand and technological change in female employment (millions of jobs). The sectors are ordered by total change.
Figure 4.
Total, final demand and technological change in female employment (millions of jobs). The sectors are ordered by total change.
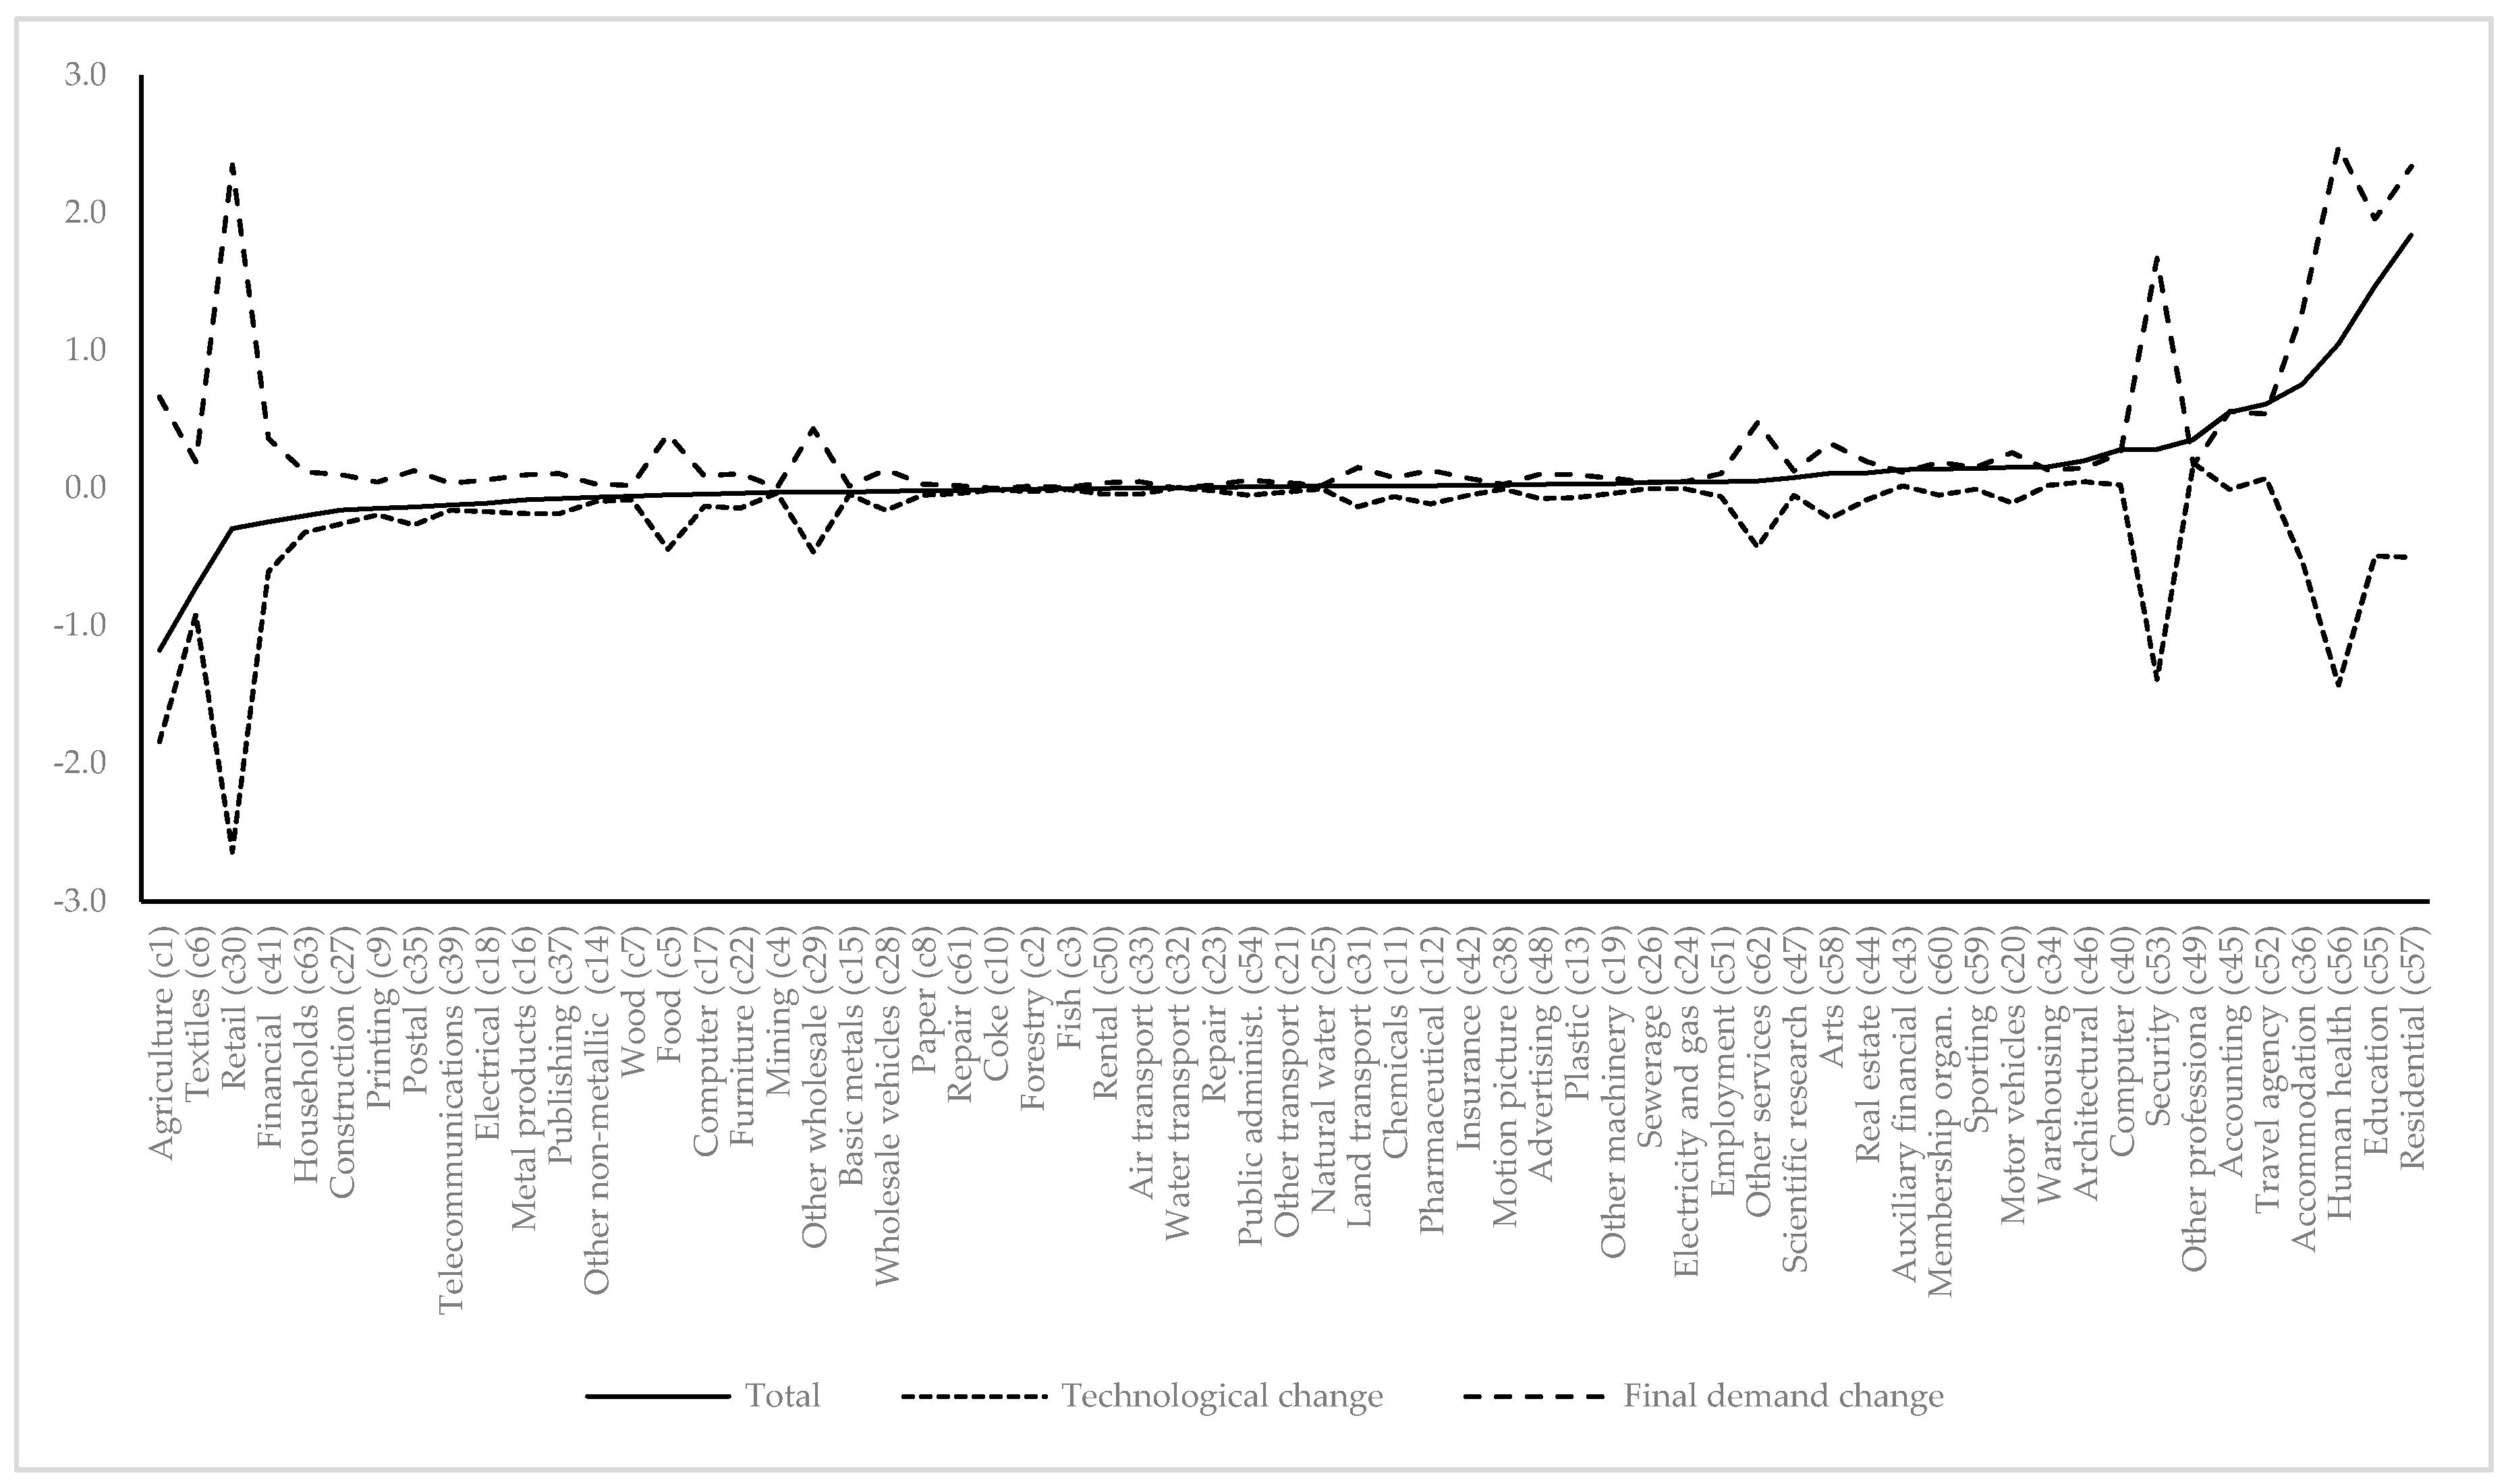
Figure 5.
Final demand change effect on female employment by sectors (millions of jobs). The sectors are ordered by total final demand change.
Figure 5.
Final demand change effect on female employment by sectors (millions of jobs). The sectors are ordered by total final demand change.
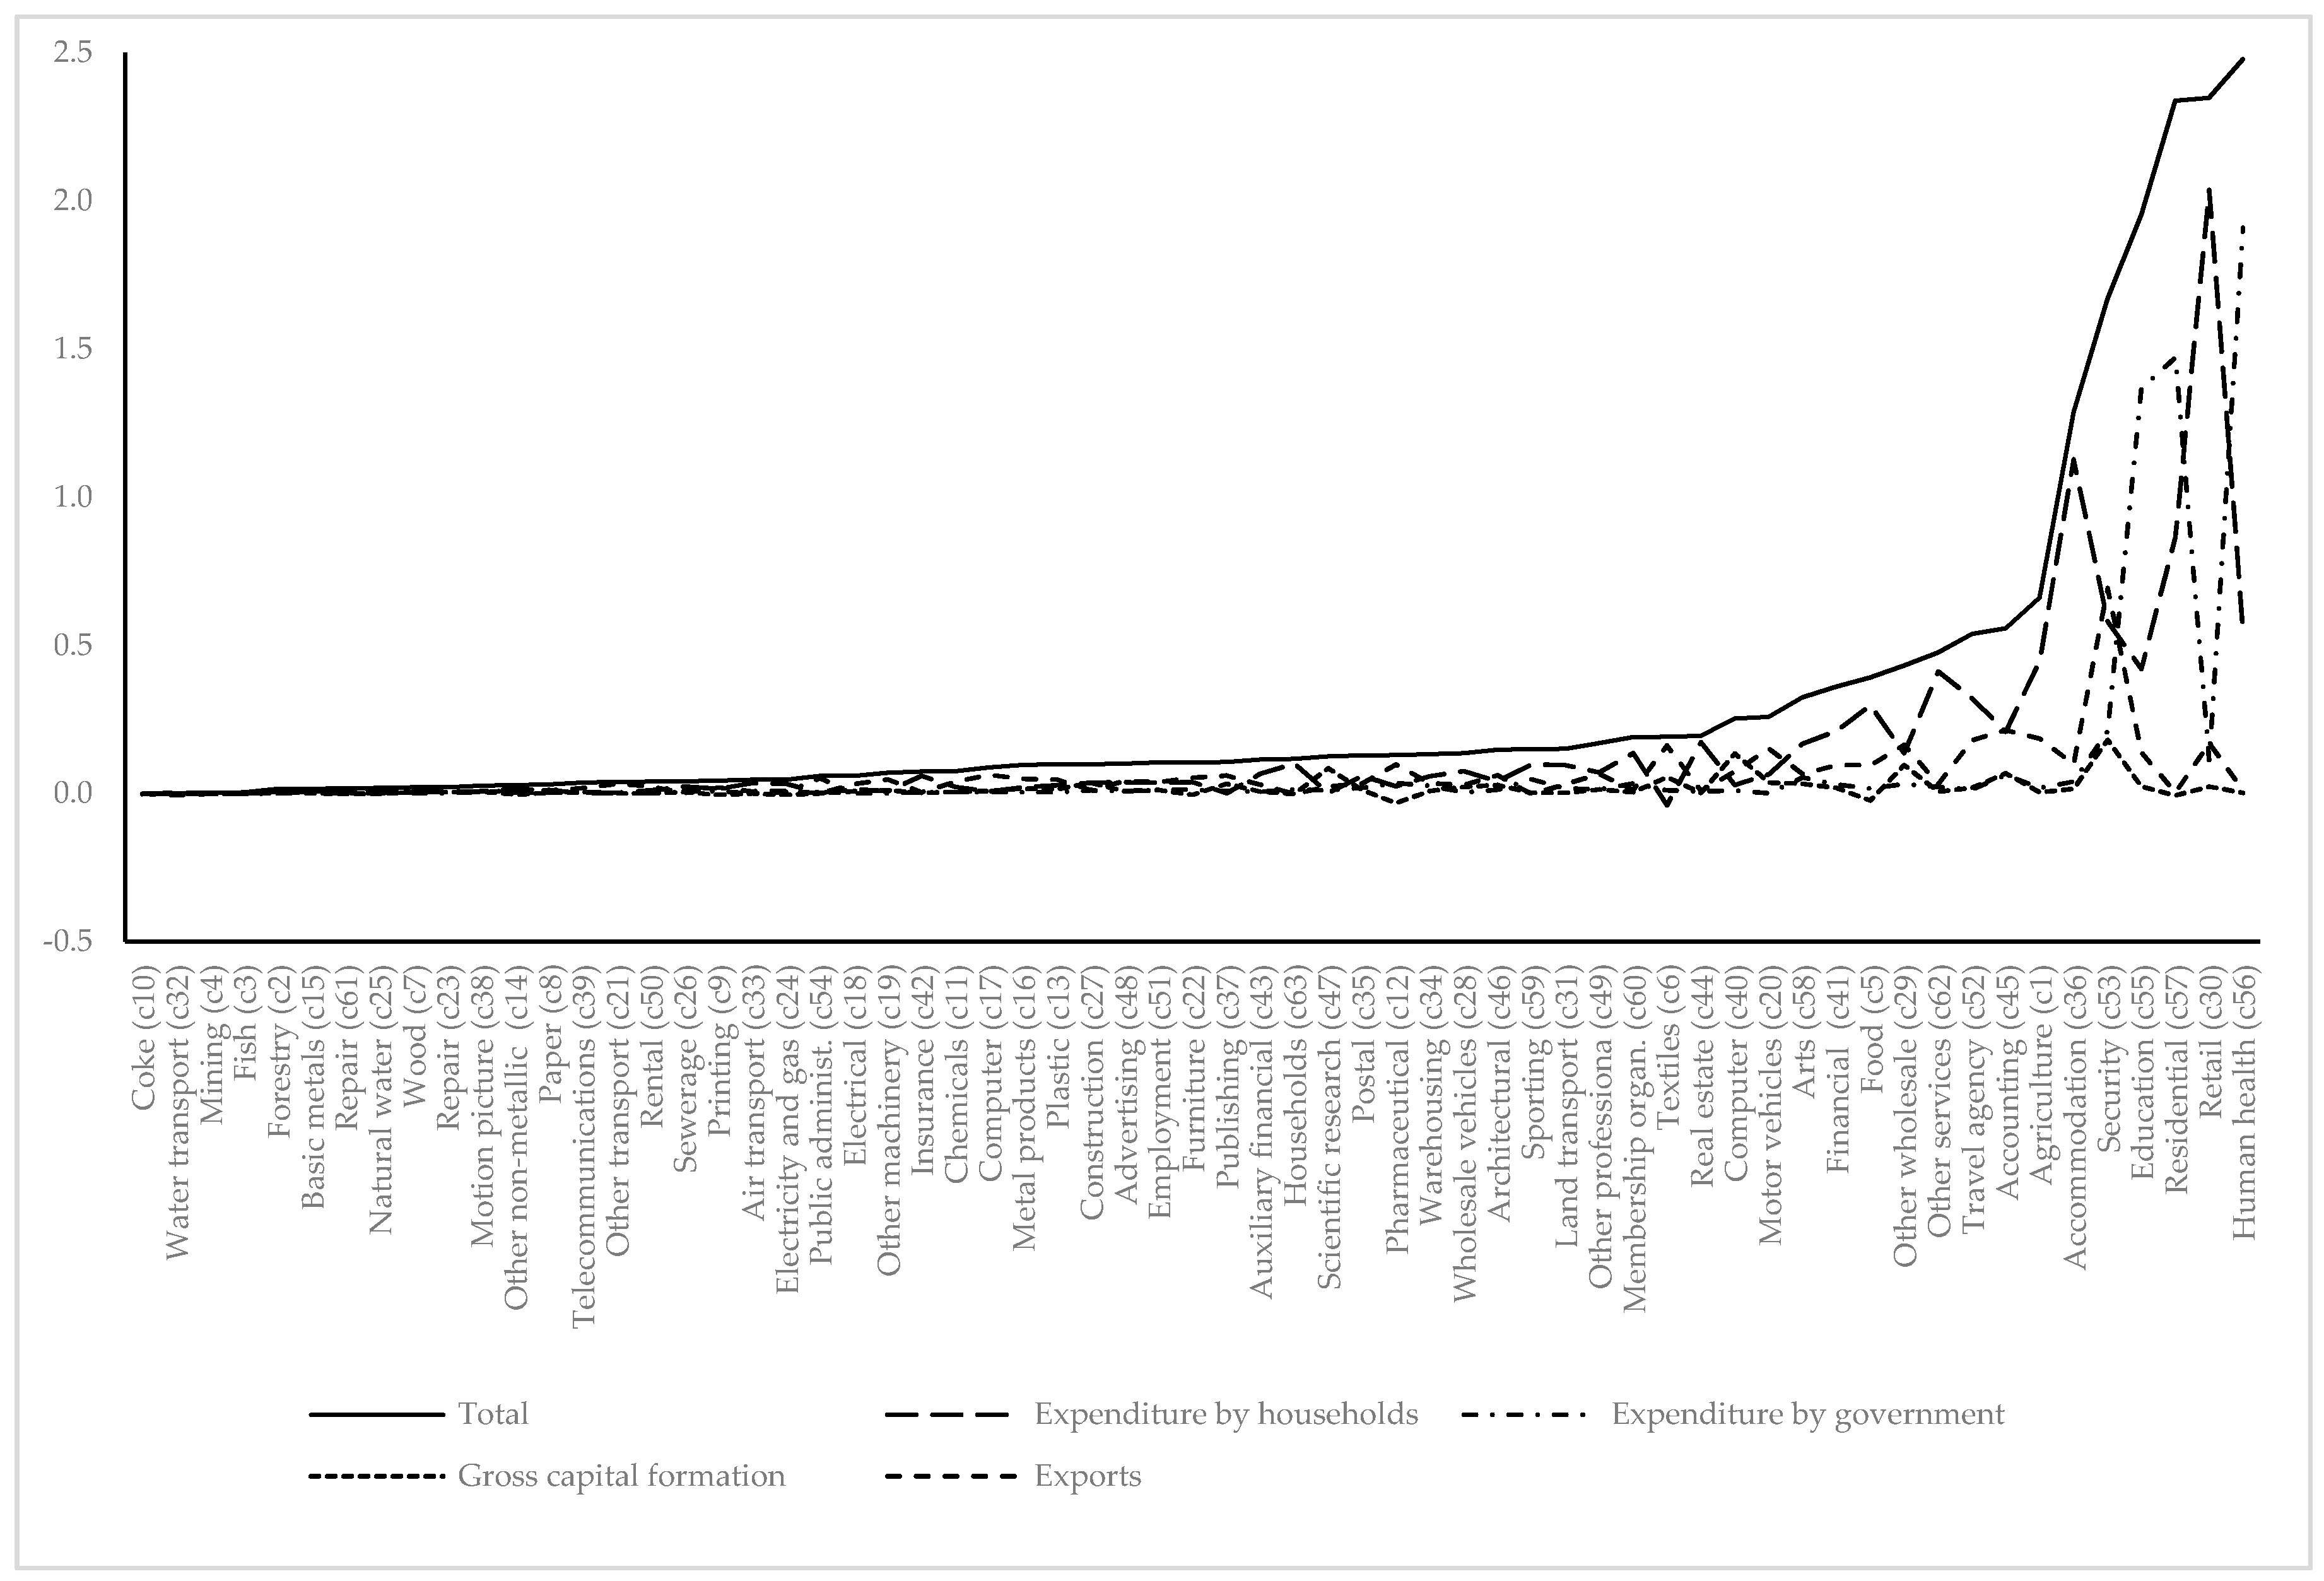
Figure 6.
Technological change effect on female employment by sectors (millions of jobs). The sectors are ordered by total technological change.
Figure 6.
Technological change effect on female employment by sectors (millions of jobs). The sectors are ordered by total technological change.
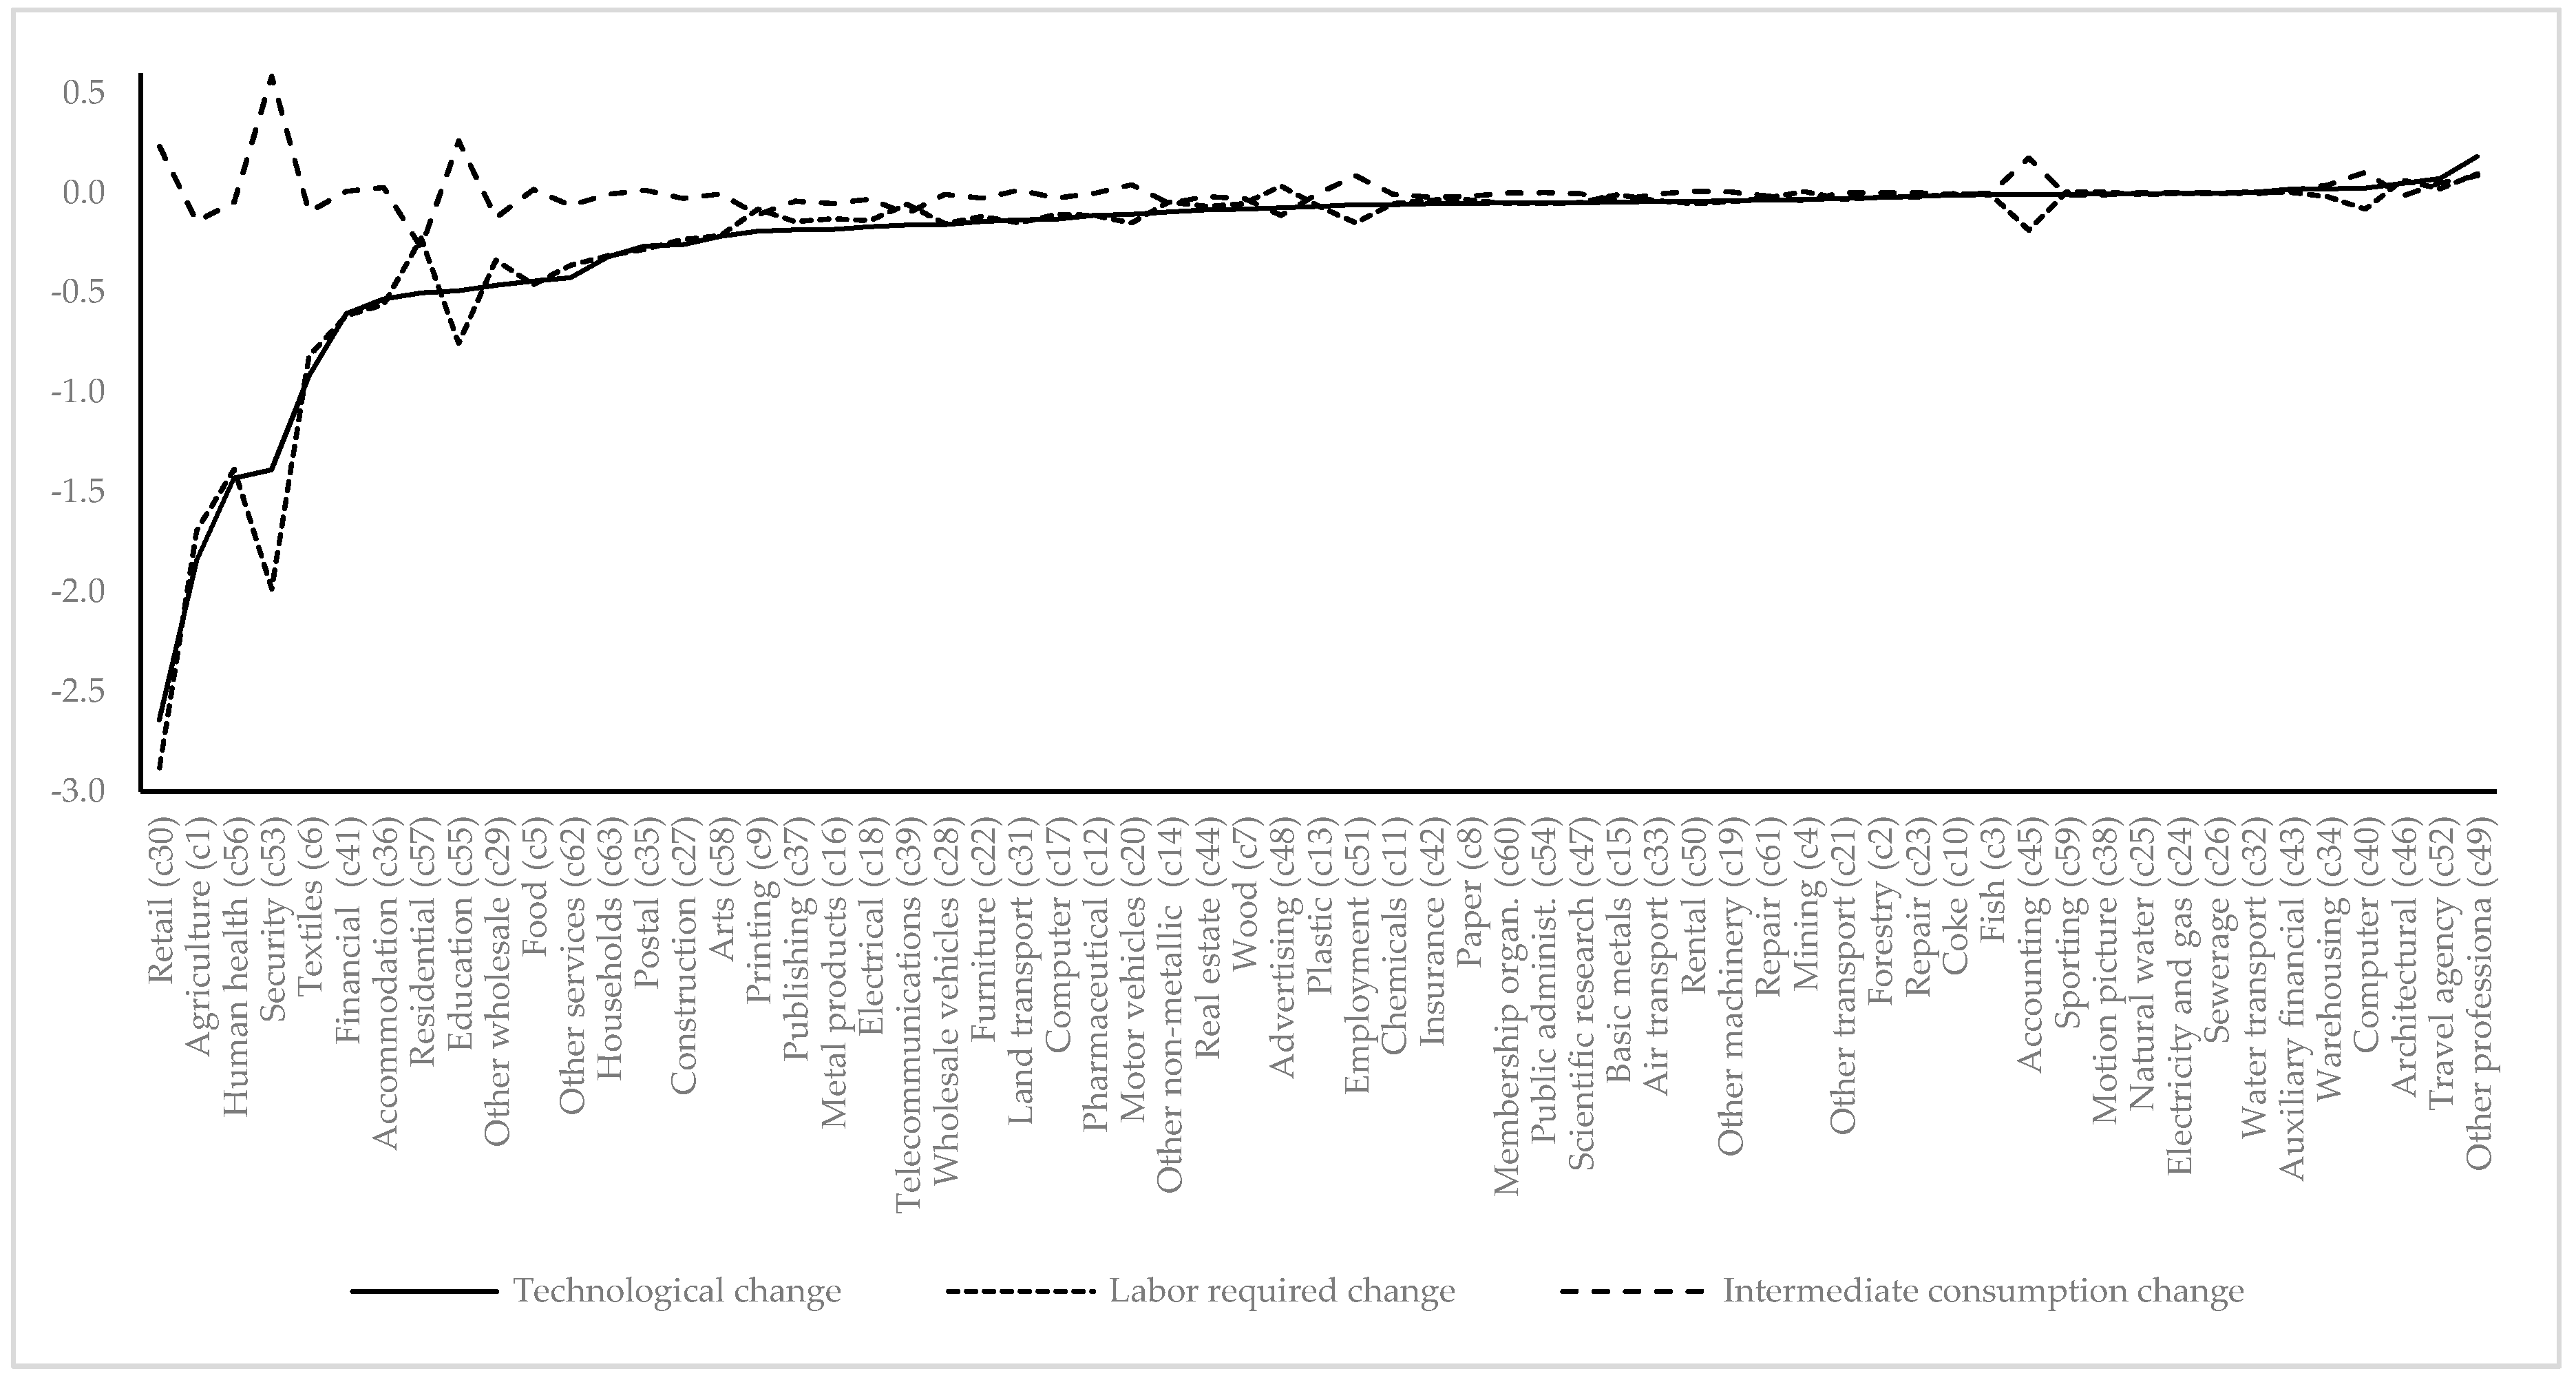
Figure 7.
Labor requirement change effect on female employment by sectors. The sectors are ordered by the total labor requirement change.
Figure 7.
Labor requirement change effect on female employment by sectors. The sectors are ordered by the total labor requirement change.
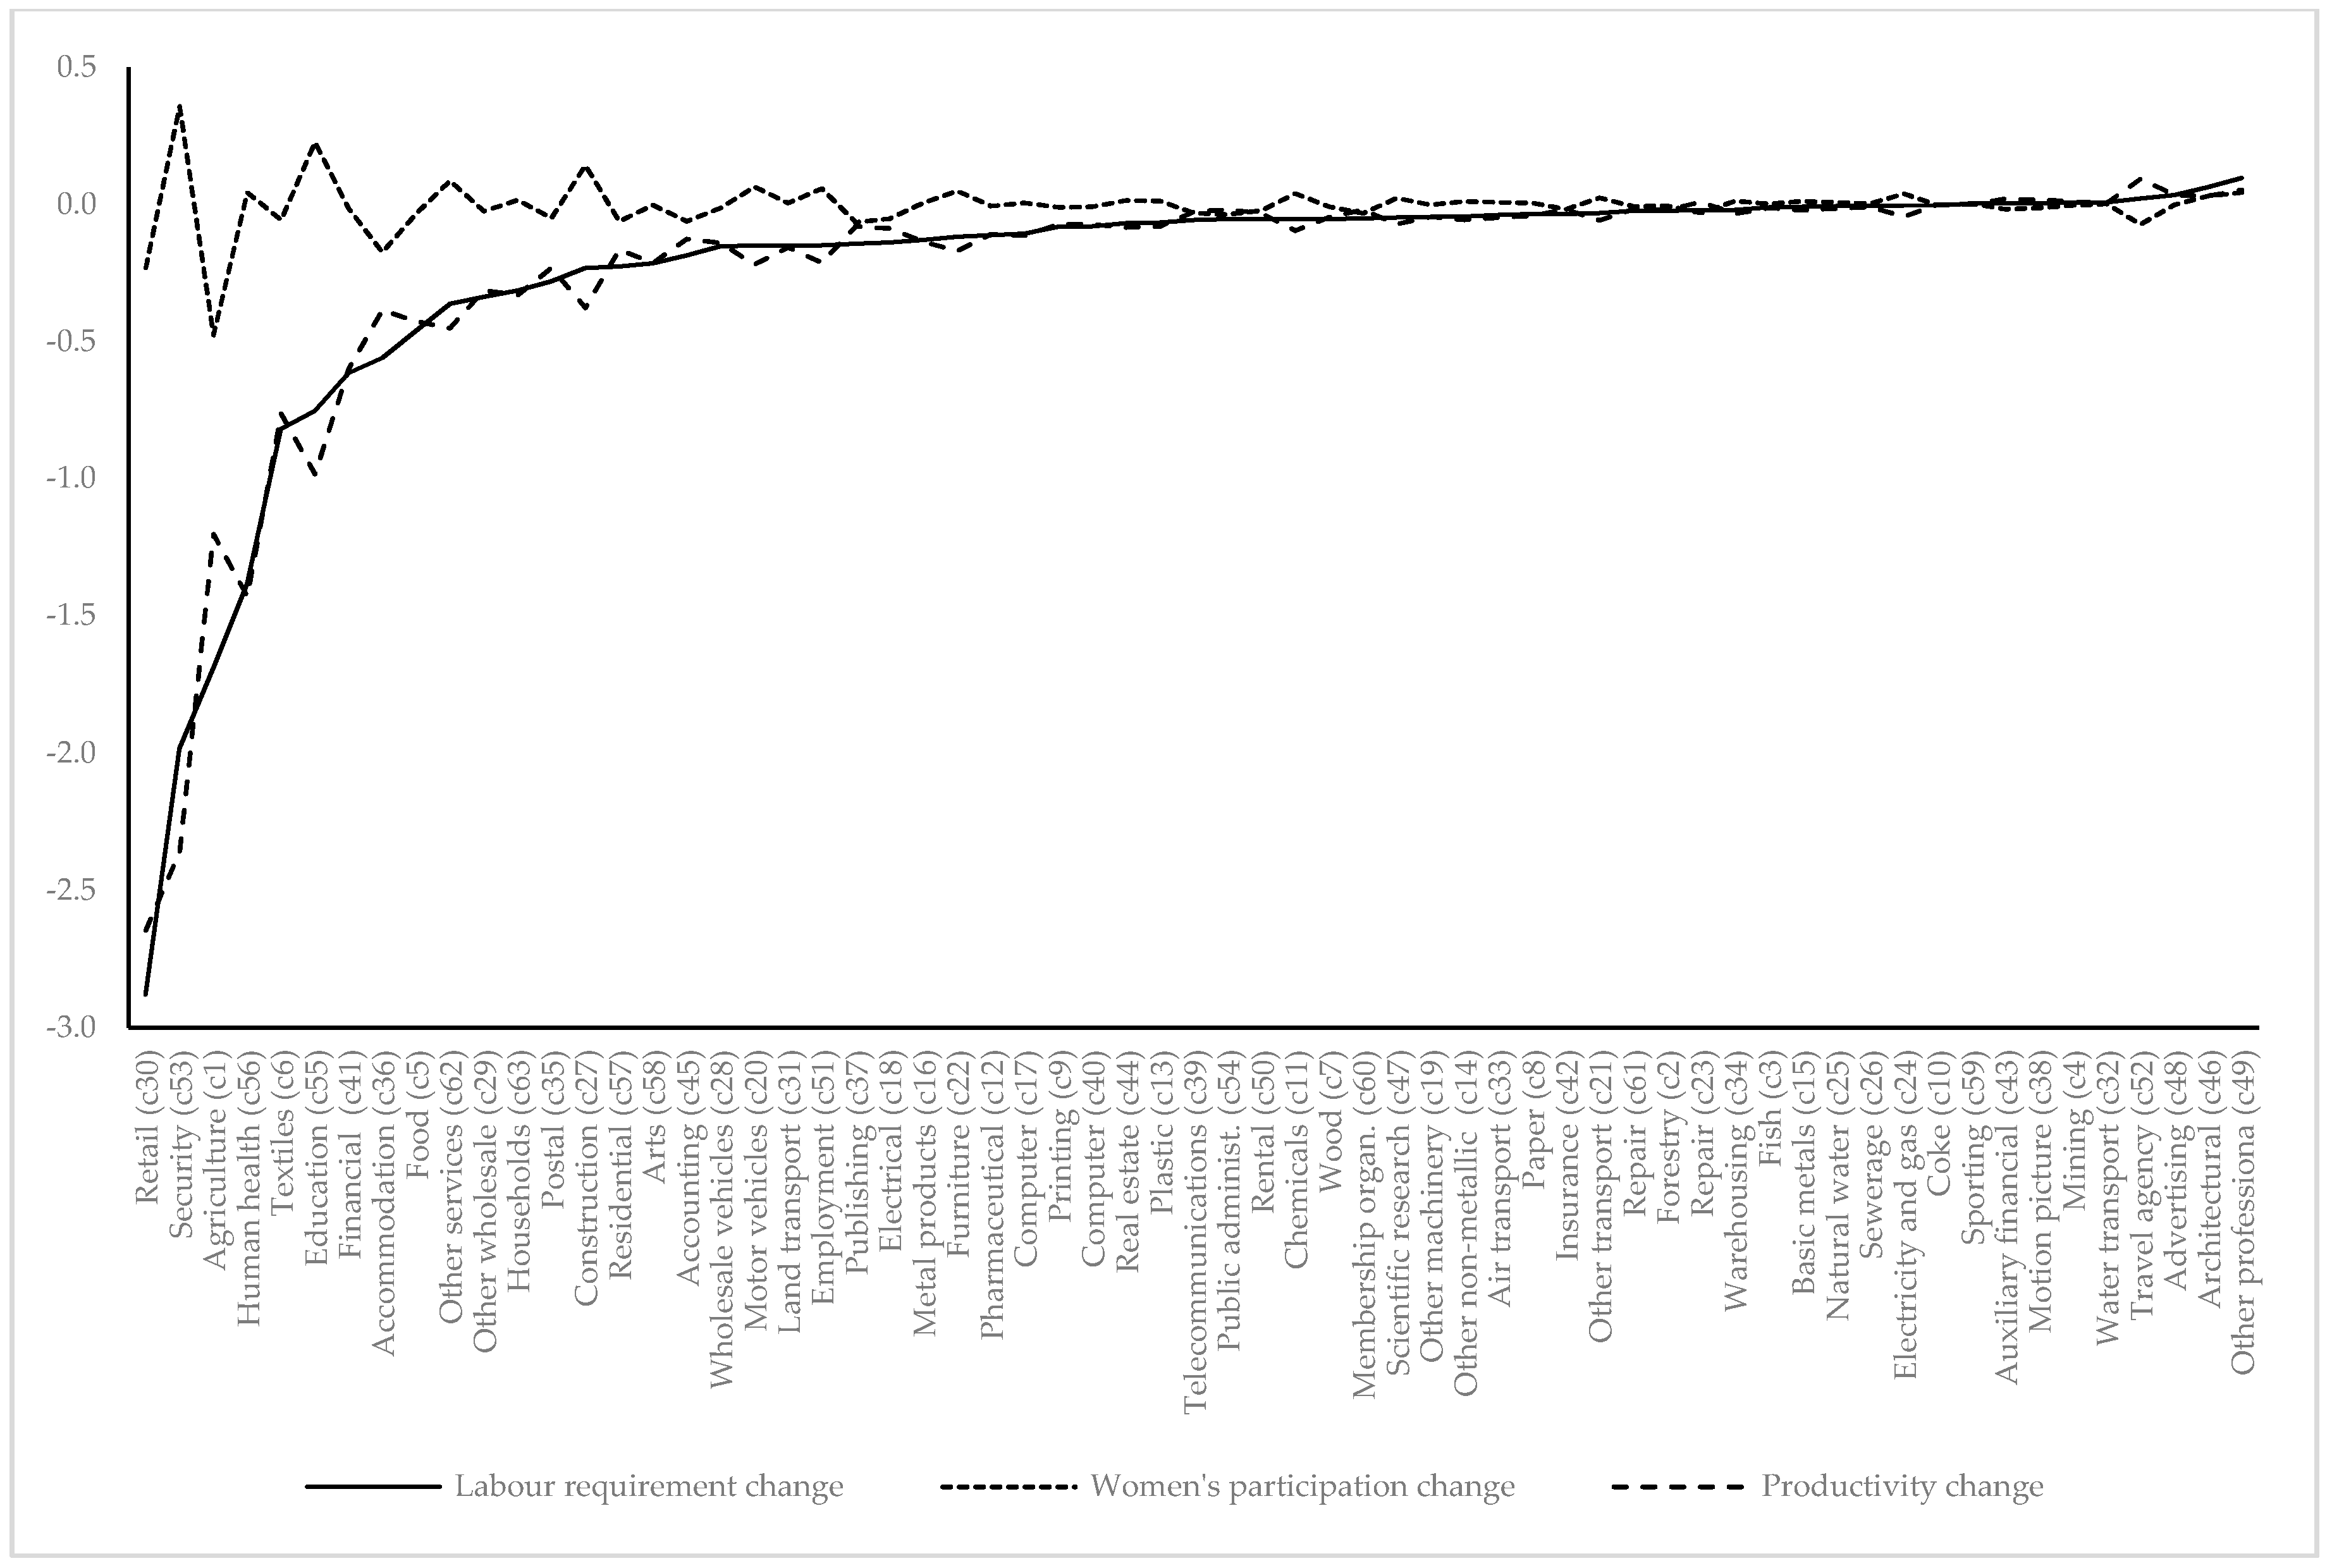

Table 1.
Structural decomposition of female employment change.
| Component | Thousands of Jobs | ||
|---|---|---|---|
| Initial indices of sectoral gender segregation | 21.01 | 0.1382 | |
| Technological change | −15,182.9 | 20.91 | 0.1345 |
| Labor requirement change | −15,402.0 | 21.27 | 0.1398 |
| Change in women’s labor participation | −239.8 | 21.26 | 0.1390 |
| Productivity change | −15,169.6 | 20.97 | 0.1381 |
| Intermediate consumption change | 223.8 | 20.71 | 0.1361 |
| Final demand change | 20,087.5 | 20.47 | 0.1328 |
| Expenditure by households | 9434.8 | 20.56 | 0.1342 |
| Expenditure by government | 5884.8 | 20.85 | 0.1371 |
| Gross capital formation | 1087.5 | 21.09 | 0.1391 |
| Exports | 3680.4 | 20.91 | 0.1371 |
| Total change/final indices | 4904.6 | 20.27 | 0.1272 |
© 2020 by the authors. Licensee MDPI, Basel, Switzerland. This article is an open access article distributed under the terms and conditions of the Creative Commons Attribution (CC BY) license (http://creativecommons.org/licenses/by/4.0/).
Share and Cite
MDPI and ACS Style
Barba, I.; Iraizoz, B. Effect of the Great Crisis on Sectoral Female Employment in Europe: A Structural Decomposition Analysis. Economies 2020, 8, 64. https://doi.org/10.3390/economies8030064
AMA Style
Barba I, Iraizoz B. Effect of the Great Crisis on Sectoral Female Employment in Europe: A Structural Decomposition Analysis. Economies. 2020; 8(3):64. https://doi.org/10.3390/economies8030064
Chicago/Turabian StyleBarba, Izaskun, and Belen Iraizoz. 2020. "Effect of the Great Crisis on Sectoral Female Employment in Europe: A Structural Decomposition Analysis" Economies 8, no. 3: 64. https://doi.org/10.3390/economies8030064
Note that from the first issue of 2016, this journal uses article numbers instead of page numbers. See further details here.