The Effects of the Catch-Up Mechanism on the Structural Transformation of Sub-Saharan Africa

1
Economics Department, Hankamer School of Business, Baylor University, Waco, TX 76798, USA
2
School of Economics, Makerere University, Kampala 7062, Uganda
*
Author to whom correspondence should be addressed.
Economies 2019, 7(4), 111; https://doi.org/10.3390/economies7040111
Submission received: 13 March 2019
/
Revised: 26 October 2019
/
Accepted: 4 November 2019
/
Published: 8 November 2019
(This article belongs to the Special Issue International Trade and Its Intersection with Development, Labor, and Public Economics)
Abstract
:Structural transformation is one of the processes of productivity growth urgently needed in Sub-Saharan Africa (SSA). This study uses the catch-up mechanism to analyze how international contacts and domestic absorptive capacity constraints are shaping the pattern of structural transformation in SSA. Using a two-step Generalized Method of Moments on 2000–2015 data for 29 SSA countries, the paper finds that SSA is undergoing a non-classical structural transformation led by the service sector instead of manufacturing. Import penetration, a key variable of international contact, has negative coefficients for both the agricultural and manufacturing shares of gross domestic product (GDP) but is positively associated with both the services shares of employment and GDP. A test of Kaldor’s third law finds that if growth in employment outside manufacturing is in services, it can also increase economy-wide productivity. Hence, it is the international constraints, such as import penetration and foreign direct investment, that are making the structural transformation of SSA non-classical. Services that involve transfer of skills and technology, such as international tourism and information and communications technology services exports, provide opportunities for structural change and productivity growth.
Keywords:
structural transformation; import penetration; foreign direct investment; absorptive capacityJEL Classification:
F43; F63; O14; O551. Introduction
The non-classical structural transformation unfolding in Sub-Saharan Africa (SSA) is engendering a lot of policy debates, and raising questions about the sustainability of the recent rapid economic growth rates. Some studies have focused on whether the rapid growth rates have been accompanied by structural change (Busse et al. 2019; McMillan et al. 2014; De Vries et al. 2015). Others, such as Harchaoui and Üngör (2018), have probed the potential relationship between rapid growth rates and convergence to the U.S. level of income per capita. What appears to be overlooked is the examination of the underlying factors determining the unique patterns of structural change unfolding in SSA. The rapid economic growth rates and urbanization in SSA since the mid-1990s are at variance with the downtempo classical structural change. Specifically, on average the nations of SSA are experiencing either stagnant or declining manufacturing value-added percent of gross domestic product (GDP). Unless the factors responsible for this non-classical structural transformation are understood, the policies aimed at structural change itself and productivity growth in SSA are likely to be unsuccessful. The goal of this paper is to apply the theory of catch-up growth to understand the determinants of the non-classical pattern of structural change unfolding in SSA, and its effects on productivity growth.
The theoretical framework of this paper is built with three pillars. First, the theory of economic growth. Economic growth depends on two basic processes, namely, factor accumulation and productivity growth (Lucas 1988; Romer 1986, 1990; Grossman and Helpman 1991). In addition to technological change and improvement in efficiency, productivity growth entails structural transformation, that is, shifting of resources from lower into higher productivity sectors. What is puzzling about SSA is that despite the rapid economic growth rates and urbanization in recent decades, the structure of its economies has not changed in the classical sense. Second, the catch-up theory of growth (Vivarelli 2018; Wan 2004; Abramovitz 1986). In countries where research and development are low, the catch-up mechanism is crucial for acquiring modern technology. Structural change requires modern technology, physical and human capital, and a conducive business climate. This mechanism enables low-income countries to increase their productivity by taking advantage of extant knowledge and technologies in advanced economies. Since most of the technology-embodying physical assets in SSA are imported, the catch-up dynamics of international trade and investment, and the domestic absorptive capacity are pivotal for structural change. Last, Kaldor’s third law that there exists a strong positive relationship between growth of manufacturing output and growth of productivity outside manufacturing (Thirlwall and Pacheco-López 2017). The law implies that, one, overall productivity growth is positively related to the growth of manufacturing and industry, but negatively related to the growth of employment outside manufacturing. Two, the more a country builds and diversifies the manufacturing sector during the catching-up process, the more likely it can sustain high rates of long-run growth. Hence, structural transformation is key for long-run growth, and in developing countries the catch-up mechanism is intrinsic to it.
The catch-up mechanism hinges on two main factors: the strength of a nation’s contacts with the innovating economies, and its absorptive capacity. The extent of economic globalization captures the degree of contact, and a nation’s business climate reflects its absorptive capacity. According to McMillan et al. (2014), globalization has played an important behind-the-scenes role in driving the patterns of structural change in developing countries. The recent decades have witnessed a wave of economic globalization across Africa primarily via international trade, foreign direct investment (FDI), and the international movements of people. Globalization is largely a common external phenomenon whose effects on an economy depend on its local circumstances, especially its absorptive capacity. Hence, we use the globalization components of import penetration and foreign direct investment for the degree of contact, and the years of schooling and economic freedom for the absorptive capacity to examine the determinants of structural change in SSA. There is an interplay between economic growth, structural transformation, and the catch-up mechanism.
The evidence presented in this paper contributes to literature, first, by applying the catch-up theory of growth to understand the determinants of the pattern structural transformation unfolding in SSA. The catch-up theory has enabled us to capture the effects of both domestic and international constraints on structural transformation. Despite the lower level of human capital and economic freedom in SSA, they could kickstart manufacturing given the opportunity. It is the international constraints, such as import penetration and foreign investment liberalization especially in resource-based activities, that are making structural transformation SSA nonclassical. The estimated coefficients of import penetration are negative for agriculture and manufacturing value-added percent of GDP, but positive for services value-added percent of GDP and its share of employment. Hence, without a competitive domestic manufacturing sector to take advantage of trade liberalization, contact with industrially advanced economies might stifle manufacturing in SSA. The premature de-industrialization in SSA (Rodrik 2016a, 2016b) is, in part, due to premature liberalization.
Second, the paper reinforces McMillan et al. (2014) who find that after 2000, structural change has contributed to Africa’s overall productivity growth. We go a step further to demonstrate that the productivity growth in SSA is hitherto driven by the service sector. Without invalidating Kaldor’s third law, we find that in addition to the manufacturing sector, if an increase in nonmanufacturing employment is in the services sector it can increase productivity growth. Services, such as international tourism and ICT services, which involve the acquisition of skills and technology can foster structural change and productivity growth.
These findings have important implications for SSA. Since manufacturing has a higher rate of technology transfer, it also has a higher potential for productivity catch-up. Above all, high productivity knowledge-based services require very high human capital which is scarce. While services are also productivity-enhancing, confinement into low-productivity services will constrain the long-run growth of SSA. Hence, in order to transform its economies, SSA needs to be strategic in its catch-up efforts, namely, gradually opening to international trade and FDI liberalization when at the same time building domestic capabilities and regional trade networks.
The remainder of the paper is organized as follows: Section 2 is a brief literature review. Section 3 describes the data, methodology, and estimation models. Section 4 presents the results of the determinants of the non-classical structural change in SSA. Section 5 has discussion and policy recommendations. Section 6 is the conclusion.
2. Literature Review
Developing countries are generally described as dual economies due to the happenstance of the traditional agricultural and the modern industrial capitalist sectors. This two-sector model has a long history starting with David Ricardo’s The Principles of Political Economy and Taxation (Ricardo 1821). Ricardo formulated the labor surplus concept under the assumption of the diminishing marginal productivity of labor in agriculture. The mechanism of transformation from a traditional into a modern economy was formalized using the two-sector surplus labor model by (Lewis 1954; Fei and Ranis 1964; Chenery and Taylor 1968). The neoclassical pattern of structural change predicts that as an economy grows, the shares of agriculture in GDP and employment would decline, while the shares of manufacturing and skilled services would increase.
Since the McMillan et al. (2014) striking finding that in many Latin American and Sub-Saharan African countries the broad patterns of structural change between 1990–2000 have served to reduce rather than increase economic growth, there has been a growing interest in SSA specific studies of structural transformation. Busse et al. (2019) find that although the agricultural sector is still dominant, a structural transformation has taken place and that it has significantly contributed to African growth in the period 1980–2014. Busse et al. (2019) use a two-sector model of agriculture and non-agriculture without distinguishing between the industrial and service sectors, and they do not account for the non-classical nature of structural change unfolding in SSA. Studying the Tanzanian economy, Diao et al. (2018) find that although employment in the formal sector has increased, the bulk of growth is accounted for by firms in the informal sector. They find that 80 percent of employment growth in the nonagricultural sector in Tanzania is largely accounted for by informal enterprises, and they find no indication that this pattern is likely to change any time soon. However, the informal sector is beset with many handicaps to sustain long-run growth. Haraguchi et al. (2017) and Felipe and Mehta (2016) find that while the world manufacturing value-added percent of GDP and its share of employment have not declined since 1970, it has declined in many developing countries. They find that there has been a shift of manufacturing activities to a relatively small number of populous countries, such as China. According to Haraguchi et al. (2017) even among developing countries where the share of manufacturing value-added and employment are declining, industrialization continues to play a key role in their growth. Enache et al. (2016) document a historical account of structural transformation in Africa. They find evidence that in Africa convergent pressures are stronger in service industries than in manufacturing. Some countries had an early transition of labor from agriculture into manufacturing in the decades prior to the 1990s, while among others especially in the more recent decades, in the 1990s and 2000s, services have played a dominant role in labor allocation. Harttgen and McMillan (2015) trace Africa’s recent rapid growth rates to a decline in the share of labor force in agriculture. However, unlike other developing countries, in general, African countries have not had an increase in the share of the labor force employment in manufacturing. Instead, the shift in employment share has been towards the service sector. This observation aligns with Rodrik (2016a, 2016b) who finds that African countries are prematurely de-industrializing or even non-industrializing.
The cited papers are corroborated with reports by some of the key development partners of SSA. The World Bank (2014) reports that Africa is bypassing industrialization as a major driver of growth and jobs, and the region’s economies are developing in unexpected ways. According to the African Development Report (2015), the pattern of structural transformation in Africa is different from the classical pattern of a transition from agriculture to manufacturing, and finally to knowledge-based services. In Africa, labor that is moving out of agriculture and rural areas is not going into manufacturing industries but is absorbed into low productivity services and informal urban activities. The United Nations Economic Commission for Africa (2014) points out some static gains and dynamic losses. Static gains arise because labor productivity is higher in services than in agriculture, while dynamic losses arise because the growth of labor productivity in the expanding service sector is lower than that in manufacturing. Above all, the report says that productivity growth in services was sluggish and increasingly falling behind the world frontier. These reports are supported by De Vries et al. (2015) who find that in SSA countries, during the early post-independence period, resources were reallocated to manufacturing activities with high productivity growth. Structural change stalled in the mid-1970s, and when it resumed in the 1990s, workers mainly relocated to distributive trade services. They find that in recent decades labor has flowed from both agriculture and manufacturing into services.
Two questions arise from this literature review. First, what is responsible for the non-classical structural transformation in SSA? Mensah et al. (2016) address the question of what drives structural transformation in SSA. They focus on the country-specific fundamentals (income per capita, population, arable land, and minerals), institutions, and policy reforms as the key drivers, but do not address the role of globalization. The current paper uses the catch-up mechanism to incorporate both the role of domestic absorptive capacity and international contact with the more competitive advanced economies. Second, how then would developing nations grow if manufacturing, the driver of growth, is declining (Haraguchi et al. 2017)? The paper addresses this question by testing Kaldor’s third law of growth on SSA to demonstrate that in addition to manufacturing, modern services can also positively contribute to productivity growth in SSA.
3. Data, Model and Estimation Methodology
The empirical regression analysis uses a sample period from 2000 to 2015 for 29 countries of SSA. We focus on this time period for three reasons. First, it is the time period when SSA has experienced consistent growth. Second, it is the period when we have the largest consistent data and sample of countries. Countries are included in the sample-based data availability. The sample is exclusively from SSA because the patterns of economic realities in SSA have evolved differently from the rest of the world for most of the 1980s, 1990s, and 2000s. For instance, Perkins et al. (2013) find that by 2005, the poverty gap had fallen to 10% or less everywhere, but in SSA it remained at over 20%. As the population of SSA grew, absolute poverty increased from 214 million in 1981 to 391 million in 2005. Hence, combining countries of SSA with other countries across the world might lead to false conclusions.
Third, it is the period when the recent wave of economic globalization has reached most of the developing nations, which is the driver of contact between the SSA and the rest of the world. Table A1 provides the key variables, their sources, and definition. Table A2 has descriptive statistics.
Correlation coefficients have been estimated and included in the Appendix A of the manuscript in Table A3a–c. The coefficients give suggestive evidence of structural transformation in SSA in the following ways. One, both the agriculture shares of employment and GDP are negatively correlated with the structural change term, and the shares of manufacturing and services in employment and GDP are positively related to this term. Two, the determinants of the catch-up theory also point in the right direction. Human capital and economic freedom are negatively correlated with agriculture percent of GDP and its share of employment, while positively correlated with both manufacturing and services shares in GDP and employment. Three, the correlations of foreign direct investment are negative with both manufacturing and services share of GDP, and not statistically significant with any shares of employment. Lastly, the correlations of import penetration are positively related to the structural change term, manufacturing share of GDP, and both the manufacturing and services shares of employment. Suggesting that services could be the channel through which import penetration is positively correlated with the structural change term. However, correlation coefficients must be consciously interpreted because they describe pairwise relationships without controlling for other factors. This makes them less informative, even though almost all of them are statistically significant with the expected signs. We, therefore, estimate the two-step GMM regressions to improve our predictions about the strength and direction of the effects of catch-up variables on structural change.
Figure 1 and Figure 2 use average values to illustrate some embryonic evidence of structural change in SSA. The figures provide us some cognizance of the evolution of the key variables over time. On average, services contribute two times and five times to GDP as much as agriculture and manufacturing respectively. However, agriculture’s share of employment is 55.23 percent while that of services is 31.76 percent, suggesting that a lot of labor force is still stuck in low productivity agriculture. Figure 1 reveals two important patterns in line with the non-classical structural change literature. First, while agriculture value-added percent of GDP is declining, labor productivity in agriculture measured by agriculture value-added per worker is rising. Second, the output share of manufacturing which had started increasing prior 2000, has since the mid-2000s almost flattened out. There had been an increase in the resources rents percent of GDP from 9.2 percent in 2001 to 14.9 percent in 2008 due to price increases and the growing global demand for resources. Resource rents appear to be going back to their prior to the 2000s shares of GDP. Figure 2 demonstrates that between 2000 and 2015, employment in agriculture declined by about 7.87 percentage points, but increased in both industry and services by about 1.9 percentage points and 5.97 percentage points respectively. This suggests that labor is reallocating out of agriculture, and new labor force entrants are joining more into services than industry, while employment in manufacturing percent of the total is slightly declining. Hence, most of the increase in industrial labor is going into the non-manufacturing sectors such as mining and construction. Urbanization is on the rise, nearly 40 percent of the total population no longer live in rural areas. Growth in the urban population signifies a demographic transition and is associated with shifts from agriculture to industry and services activities. However, the rural population percent of the total is still higher than the agriculture value-added percent of GDP. This implies that a larger rural population is sharing a smaller and declining fraction of GDP, a phenomenon that augments rural-urban income inequality and migration. Figure 2 illustrates an increase in the share service jobs and a low and declining manufacturing share of jobs. All these descriptive statistics point to a service-sector-driven type of structural change unfolding in the SSA.
Following McMillan et al. (2014) we use the labor productivity framework to construct the key dependent variable measuring structural change as follows:
where and refer to economy-wide and sectoral labor productivity levels respectively, and is the share of employment in sector . The operator denotes the change in productivity and in employment shares of three broad sectors, namely, agriculture, industry, and services between and . The first term on the right captures productivity growth within a sector for a given share of labor. Productivity can increase as a result of physical and human capital accumulation, technological change, and a better understanding of the production process: better management, motivation, and specialization. The second term on the right captures the productivity effect of labor re-allocation between sectors. It is the structural change term of interest. If there is any structural change, we expect that labor would reallocate from a lower productivity sector to a higher productivity sector which would boost the economy-wide productivity term .
Using Equation (1), the structural change term and the productivity growth term within each sector are derived by computing the change in the employment shares and value-added per worker in agriculture, industry, and services for each country. Table 1 reports the average changes for each country for 2000–2015. Apart from four countries: Botswana, Senegal, and Uganda, all the other countries in the sample have experienced a decline in the employment share of agriculture between 2000 and 2015. The countries in which agriculture gained employment experienced a decline in either industry or services or both. In Botswana, the employment share was lost only in the industry sector. In Senegal, employment share was lost only in the services sector, while in Uganda employment share was lost in industry. On average, both the industry and service sectors gained employment, with the service sector gaining more. The sectoral value added per worker has also on average increased on the continent. However, in Madagascar all three sectors lost labor productivity. In Burkina Faso, Lesotho, and Rwanda both the industry and service sector declined in labor productivity. Table 1 demonstrates some evidence of structural change but with mixed effects on labor productivity. For instance, the agricultural sector has lost employment share but gained some productivity, which is a good indicator of structural change. The service sector has enjoyed the greatest increase in the employment share and productivity, suggesting its dominant role in the region’s structural transformation.
Table 2 presents the economy-wide productivity growth accounting whose relationship with structural change this paper intends to explain as well. With respect to economy-wide productivity growth driven by the structural change, we observe the following: first, except for Botswana and Senegal, the remaining countries in the sample have a negative productivity growth due to structural change in terms of agriculture. These are same countries whose employment share of agriculture increased in Table 1. In addition, eight of the 29 countries have a negative total structural change term. This is an indicator that labor could have moved from more productive activities into less productive activities. Second, other than The Gambia, Namibia, Senegal, and Togo, all the other countries with negative total productivity growth due to structural change also have a negative structural change in industry. This is another indicator of the importance of manufacturing in positive structural transformation, and again a pointer to the non-classical transformation. Ten countries out of the 29 have negative overall economy-wide productivity growths. The variations in labor allocation between sectors have had mixed effects on sectoral labor productivity growth and economy-wide productivity growth. The focus of this paper is to examine the determinants of structural transformation in SSA, and whether it is increasing productivity.
The empirical estimations are executed using the two-step system Generalized Method of Moments (GMM) which provides a robust estimator (Arellano and Bond 1991; Arellano and Bover 1995; Blundell and Bond 1998; Roodman 2009a, 2009b). It is based on the assumption that the error term is not serially correlated. Thus, disturbances in the equations are uncorrelated with the instrumental variables, which are the lagged levels of the series after the equation has been first-differenced to eliminate country-specific effects. The two-step system Generalized Method of Moments (GMM) is preferred for the empirical analysis for a couple of reasons: first, endogeneity is always of great concern when analyzing macroeconomic data. Some regressors may not be strictly exogenous. For instance, both agriculture value-added and FDI can be determined by the same factors such as economic freedom. FDI are investments, which might be attracted to agriculture because the returns are good and the business climate in the country is conducive. Second, we have 16 time periods (T) are but 29 countries (N): T < N. According to Roodman (2009a) the Arellano-Bond estimator was designed for small-T and larger-N panels. Third, the system GMM estimations technique simultaneously controls for the unobserved country-level heterogeneity, autocorrelation, and endogenous variables (Roodman 2009a). According to Dieleman et al. (2013) and Dieleman and Hanlon (2014) the two-step GMM is an efficient estimation because it removes time-invariant heterogeneity (Hayakawa 2009a, 2009b; Roodman 2009a). Last, the instruments are validated by using two tests: the Hansen over-identifying restrictions test and the Arellano and Bond autocorrelation (AR (2)) test for the validity of the instruments and the absence of autocorrelation among the residuals respectively. In robust estimations, Stata reports the Hansen statistic with a joint null hypothesis that instruments are valid instruments, that is, uncorrelated with the error term. The Arellano–Bond test for autocorrelation has a null hypothesis of no autocorrelation. To avoid proliferation of instruments, we do not allow the number of instruments to exceed the number of countries. Fixed effects estimators have also been estimated for comparison. However, since the fixed effects estimators do not eliminate the endogeneity problem and are not suitable for estimating dynamic models, we limit the explained results and discussion to the Two-step GMM results.
The empirical estimations progress in three phases: first, we establish the mode of structural change unfolding in SSA and the associated changes in the major sectoral proportions as economies grow. Following Mijiyawa (2017) we model the relationship as non-linear to capture what happens to the structural change process as income per capita. It also allows for a more flexible relationship. In the early stages of economic growth, which are typical of SSA, agriculture would hold the largest shares of GDP and employment. Structural change would involve a shift away from agriculture toward industry and services, as income per capita increases. Hence, structural change would be higher at the lower levels than at the higher levels of income. For instance, economies would first industrialize before they deindustrialize. The structural transformation term, from Equation (1) would change more significantly when the economy is at a lower level of income. Equation (2) sets up the relationship between the structural change variables and income per capita.
where are the unobserved country-specific effects; are the time-effects; and are the observation error terms. If structural change were to follow a classical modality, coefficients would be positive while will be negative, reflecting an initial transition from a traditional into a modern economy. The structural change term from Equation (1) is substituted by other variables that reflect structural transformation, namely, agriculture as percent of GDP, manufacturing as percent of GDP, and services as percent of GDP. Both Mijiyawa (2017) and Rodrik (2016b) use manufacturing share of GDP as the dependent variable.
Second, we apply the theory of catch-up growth to examine the determinants of the patterns of structural change unfolding in SSA. With the structural change term from Equation (1) as the dependent variable, the relationship between structural transformation and its potential determinants is estimated using the following equation.
where are the contact and absorptive capacity variables, are the time-effects, and are the observation error terms. The selection of the variables are informed by the theory of catch-up growth. In this mechanism, trade and foreign direct investment are the main channels of contact for gaining technology. Absorption capacity is driven by such factors as human capital and economic freedom. The structural change variable is again substituted by shares in GDP and employment in agriculture, manufacturing, and services.
Third, we proceed to find out whether the pattern of structural transformation in the SSA is productivity increasing. We estimate Equation (4) with the economy-wide productivity term from Equation (1) and GDP per worker as the dependent variables. Controlling for within the productivity of inputs, , the first term on the right, we estimate the effect of changes in the sector shares of employment on the economy-wide productivity. The results are cross-checked by testing for the effects of the determinants of structural change on productivity. This is under the assumption that if structural change is productivity increasing, the determinants of structural change, that is, , from Equation (3) should have an effect on labor productivity as well.
Last, we apply Kaldor’s third law to test whether the non-classical structural change in SSA is productivity-enhancing. At this stage, the focus is on the effect of growth in the employment share of services to the overall productivity growth of SSA. Kaldor’s third law predicts that the faster the employment growth is outside the manufacturing industry the slower the overall productivity grows. Following Thirlwall and Pacheco-López (2017), we test this hypothesis indirectly because the output of the service sectors is difficult to measure directly, especially the output of public services, such as education and health, which are measured by cost of inputs.
where GDP per worker growth captures the overall productivity growth of an economy, controlling for the effect of growth in manufacturing , we test for the effect of employment growth in the non-manufacturing sectors . Following the prediction of Kaldor’s third law, coefficients should be positive while should be negative.
4. Estimation Results
4.1. Characteristics of Structural Change in the SSA
Equation (2) is estimated, and the results are in Table 3. All the coefficients are elasticities reflecting the potential percentage point change in the dependent variable associated with a one percentage point change in the explanatory variables. It must be pointed out from the outset that the empirical analysis does not imply any causal inferences, but rather associations between the contact and absorptive variables with the structural change indicators. The estimation results are all valid because the null hypotheses of the Hansen test of over-identification restrictions (OIR) and AR (2) tests are not rejected. The test for AR (1) process in the first differences usually rejects the null. However, in our estimations, it does not always reject it, but this should not be a problem because:
The test for AR (2) in the first differences is more important for detecting autocorrelation. We fail to reject the null hypothesis of no autocorrelation for AR (2). With respect to the estimated coefficients: first, the coefficients of income per capita and its squared value on the structural change term and agriculture value-added percent of GDP are positive and negative respectively. This suggests that there is more structural change at the lower levels of income, but it would slow down, or even die out at higher levels. As economies grow, agriculture becomes less dominant and its share of national income and employment declines. Following Engle’s law, the proportion of income spent on food declines as income rises (John Baffes and Etienne 2016). Hence, the relative importance of agriculture would decline because income grows faster than the demand for food. However, the coefficients of income per capita and its squared value on the manufacturing and services value-added percent of GDP are negative and positive respectively. This result is non-classical in the sense that it reveals a deindustrializing process even before SSA has industrialized. These coefficients suggest that the patterns of structural change are not inducing a modernization process since the service sector also has a U-shaped relationship with an increase in incomes. Given that most SSA nations are still low income, a U-shaped relationship between squared income per capita and both manufacturing and services shares of GDP suggests three things: one, there is a lot of labor force currently not absorbed into the modern formal sectors. Two, due to low manufacturing competitiveness, an increase in income per capita is accompanied by a reduction in the manufacturing share of GDP until a certain level of income from which both income and domestic manufacturing would increase (Mijiyawa 2017). When income per capita is low, an increase in incomes creates a sudden increase in demand for consumer manufactured goods which is met by increased imports instead of domestic production. This outcome is likely to be more significant if the increase in average incomes is driven by a boom in natural resource exports. Last, on the upside, the positive coefficients of squared income per capita suggest that SSA has a lot of potential for growth through both manufacturing and services.
4.2. Contact, Absorptive Capacity, and Structural Change
The structural change term in Equation (1) captures the productivity effect of cross-sector labor re-allocations. The degree of import penetration and foreign direct investment (FDI) are used as measures of contact between SSA and the rest of the world. Since most of the technology-embodying capital assets in Africa are imported, the catch-up theory predicts that higher contact would increase the flow of knowledge, physical capital, and technology into the region, all of which would contribute to productivity growth and structural change. Acquisition of higher knowledge, assets, and technology can enable an economy to engage in new productive activities. First, we examine the contact variables of import penetration and FDI. The two-step GMM results in Table 4a show that while import penetration is not statistically significant with the structural change term, and with the agriculture and manufacturing shares of employment, it has a positive statistically significant coefficient with the services share of employment. Examples of services boosted by import penetration which are associated with the high rate of urbanization are petty retail trade, banking and finance, food preparation, real estate services, and transportation. In Table 4b, GMM results, import penetration has a significant negative effect on the agriculture and manufacturing shares of GDP, but a positive coefficient with the services share of GDP. This suggests that as incomes in SSA increase, the associated increasing demand is significantly met by imports. In Table 4a, FDI has negative statistically significant coefficients on the structural change term and services share of employment. If services are the leading sector of the pattern of structural change, this explains the negative coefficient FDI has with the structural change term. In addition, to the extent that FDI inflow into SSA is dominated by natural resource-based activities, such as petroleum, minerals, and agricultural production, it tends to be capital intensive, and therefore may not create many jobs. The contact estimations indicate that the contact variables are associated with some form of structural change in SSA, but not in the classical sense of increased manufacturing. Trade liberalization in SSA has exposed industries, which are largely small and labor-intensive, to competition from Asian emerging economies which have a comparative advantage in labor-intensive manufacturing. Often cases, the least competitive firms exit the industry while firms that remain employ less labor, that is, the remaining manufacturing firms become more capital and skill intensive. Thus, de-industrialization is often accompanied by industry rationalization (McMillan et al. 2014).
We now turn to the absorptive capacity of SSA, and its effects on the structural change in Table 4a,b two-step GMM results. Human capital is the key determinant of absorptive capacity. We use the index of human capital per person, based on years of schooling and returns to education from the Penn World Tables. Table 4a shows that human capital is positively associated with the structural change term and employment shares of manufacturing and services, but negatively associated with the employment share of agriculture. This result crucially points to the relationship between human capital and structural change through manufacturing and services. At the heart of the structural transformation is competence building, in which old processes are replaced by innovative alternatives (Lundvall and Lema 2014). Borensztein et al. (1998) find that foreign financial flows such as foreign direct investment, aid, and remittances contribute to growth more effectively when a minimum threshold stock of human capital is available in the host country. Stokey (2015) finds that local human capital is critical in letting countries effectively exploit technologies imported from abroad and in allowing that inflow to continue. Similarly, Schmidt et al. (2018) find that the effect of adopting clover on the urban population in Denmark was mediated by its impact on human capital formation. However, in an environment that is not conducive for economic growth, human capital just as any other resource can be squandered. Hence, a favorable business climate for private enterprise comprising of institutions, economic freedom, and financial development are some of the catalysts under which human capital can have an effect on structural change and productivity growth.
The components of economic freedom averaged are business freedom, investment freedom, trade freedom, monetary freedom, financial freedom, and property rights. Not only do institutions reduce transaction costs and risk, but they also enable entrepreneurship and innovation. Following Catrinescu et al. (2009) we use the components of the Index of Economic Freedom by The Heritage Foundation to test the hypothesis that policies that guarantee the liberty of entrepreneurs to use their resources without undue restraint and government interference can promote structural change and productivity growth. The results in Table 4a,b two-step GMM show that, first, economic freedom has a positive coefficient with the agriculture share of employment. However, the rest of the coefficients with the employment and GDP shares are not statistically significant. McMillan et al. (2014) also do not find that institutional indicators, such as measures of corruption or the rule of law, play a statistically significant role. This result does not downplay the role of institutions, instead it buttresses the notion that improving the business climate in SSA is imperative. A good investment climate in terms of institutions and economic freedom is critical for structural change. According to the Heritage Foundation, the overall score of economic freedom for SSA from 2000 to 2015 is mostly unfree, although it has improved from 52.2 percent to 55.5 percent respectively. The moderately free scores range between 60−70 percent of the economic freedom index.
4.3. Structural Change and Productivity Growth
A related question of interest is whether the structural change unfolding in SSA productivity-enhancing is. Structural change would lead to economy-wide growth in productivity if labor reallocates from lower to higher productivity activities, that is if employment shares in manufacturing and services increase while the shares in agriculture decrease. Data analysis in Table 1 shows that on average the service sector has had the largest increase in the employment share while agriculture’s share declined, and with a small increase in industry. Table 5 panel (a) is based on Equation (1). We control for productivity growth within the individual sectors, , to find out whether changes in labor allocations have had any effects on the economy-wide productivity term . The estimated results show that structural change associated with an increase in the manufacturing and services shares of employment increases economy-wide labor productivity growth by 0.28 and 0.42 percentage points respectively. The services share of employment is also positively associated with GDP per worker, but the manufacturing share of employment is statistically insignificant. In Table 5 panel (b) we extend the investigation to how the catch-up determinants of structural change affect output per worker. We find that a 1 percentage point increase in human capital is associated with a 1.4 percentage point increase in economy-wide productivity. The rest of the contact and absorptive capacity variables have statistically significant relationships with real GDP per worker but not with the economy-wide productivity term. We find that FDI and economic freedom increase GDP per worker, while import penetration decreases it. Globalization is a double-edged sword. FDI inflows would increase GDP and income per capita as well as per worker. However, since FDI is diverse, its impact on structural change and economy-wide productivity growth depend on the specific activity and dynamics of technology spillovers. The effect of FDI in natural resource-based industries on structural transformation depends on how the rents are managed by the host economy. In some countries primary product exports have induced development, for example, diamonds in Botswana. However, in some others, such as diamonds in the Democratic Republic of Congo and Sierra Leone, natural resource abundance has been a blessing and a curse.
In Table 5 panel (c) we extend the analysis to capture the role of exports. Structural transformation is often reflected by changes in a country’s exports. Firms producing for export engage in competitive global markets and often apply new technologies. We examine the effects of the exports of agriculture raw materials, manufactures, ores and metals, international tourism, and ICT services on the structural change term and economy-wide labor productivity. The results in Table 5 panel (c) show that the relationship between the leading exports of SSA and structural change and productivity growth is still weak. Specifically, an increase in agricultural raw materials export is anti-productivity growth. Natural resource exports can increase GDP, and can, therefore, engender economic growth. However, exports of ores and metals discourage structural change and have a statistically significant negative coefficient with the structural change term. Services are varied, but we focus on the exported modern services. ICT services exports have positive coefficients with both the economy-wide productivity and structural change terms. International tourism manifests a positive effect on GDP per worker. Our results are in line with McMillan et al. (2014) who find that while higher commodity prices have increased income per capita, and therefore economic growth rates, they fail to generate much employment, unlike manufacturing industries and services. However, most of the employment in the service sector is still in low productivity activities such as petty trade, transportation, and food preparation. What is needed is structural change to improve the demand characteristics of exports (Thirlwall and Pacheco-López 2017). The rapid growth rates in SSA without significant structural transformation have often been attributed to the increased global demand for natural resources, especially oil, and ores and metals. De Brauw et al. (2014) attribute the high urbanization rates in some African countries to resource exports. For instance, in Nigeria, the 1970 oil boom was largely invested in the development of urban centers. Rural labor was, therefore, attracted to construction and service jobs (Akpan 2012). Hence, instead of production cities, consumption cities emerged (Jedwab 2011), which have subsequently created a market for agricultural output.
Lastly, we use the traditional Kaldor’s third law of growth to test whether the growth of employment in the non-manufacturing sectors is productivity-enhancing. In Table 6, growth of GDP per worker is regressed on growth in the non-industrial employment controlling for manufacturing output. We use 5-year averages to control the business cycle’s effects on growth rates. We find that total growth of employment outside manufacturing industry does not have a statistically significant coefficient in the two-step GMM regression. However, when non-industrial employment is broken-down into services and agriculture, the growth of employment in the service sector consistently increases labor productivity up to a 0.44 percentage point elasticity, while growth in employment in agriculture is not statistically significant. This result continues to suggest that apart from manufacturing, the service sector is the next hope for SSA.
5. Discussion and Policy Recommendations
While low-income countries are a natural locus for structural transformation, the process is not automatic. It is intriguing that many African economies have enjoyed higher than average rates of growth for about two decades, but the structure of their economies has not significantly changed. The rapid growth rates in SSA nations without structural change has often been attributed to the increased global demand for natural resources, especially oil, and ores and metals. Our findings show that indeed ores and metal exports have resulted in higher GDP but are negatively associated with the structural change term. Historically, industrialization has been the key driver of structural change and productivity growth, with the latest examples from the Asian emerging economies. There is growing consensus that the patterns of structural transformation in SSA are non-classical. While industrialization is a common part of it, structural change in the SSA may not necessarily follow the conventional pattern of first agriculture, manufacturing, and then skilled services in that order. Services, and sometimes informal services, instead of manufacturing, are driving the change. In the empirical analysis manufacturing exports did not have a statistically significant relationship with both productivity and structural change. Why is manufacturing not picking up in the SSA? What can SSA countries do? If they cannot, what is it about them?
In Table 4a,b human capital is the only catch-up variable positively contributing to manufacturing employment and share of GDP. There are a number of arguments why cheap labor by itself might not deliver industrialization to Africa. One, the classical process of the structural change via industrialization assumes that light manufacturing industries will relocate to Africa to take advantage of the abundant cheap labor. It assumes that Africa will eventually gain a comparative advantage in light manufacturing. However, the migration of light manufacturing might not quickly and significantly occur because, with progress in technology, light manufacturing is becoming less and less labor-intensive. By adopting modern technology, Asia may retain the hub of light manufacturing, and the SSA may fail to compete. In addition, an increase in income per capita, amidst low manufacturing competitiveness, results in increased demand for manufactured (consumer) goods which is met by increased imports, thus reducing an economy’s own manufacturing share of GDP. Above all, Asia still has a huge supply of cheap labor with human capital higher than that of SSA. The population of China is more than that of Africa, and the same is true of India. A Verdoorn effect appears to be at work, that is, once a region obtains a growth advantage it will tend to sustain it at the expense of other regions because faster growth in manufacturing output leads to faster productivity growth (Thirlwall and Pacheco-López 2017). This effect will for a long time keep East Asia competitive in the export of light manufactured goods that gave it earlier and faster growth than SSA. Two, Haraguchi et al. (2017) hold that after its successful labor-intensive industries, China is likely to upgrade its industrial structure following the path of the high-income countries. This would open up opportunities for the currently low-income countries to pursue light manufacturing. This notion too has some potential limitations. It was much easier for China to acquire light manufacturing technology than it will be for it to gain high-technology mass production. There are both institutional and human capital barriers. The intellectual property rights of cutting-edge technology are heavily protected. Above all, innovation requires much higher levels of human capital and technology than adoption and adaptation of the already existing old technology. Hence even if China eventually upgrades its industrial structure, it will be a slow process. Three, according to Badiane (2014) and Binswanger-Mkhize et al. (2010) economic transformation has not been successful in Africa partly due to lack of growth both in agriculture and outside agriculture, leaving the entire burden of absorbing the growing labor force to the service sector. Hence, industrial policies would have to address boosting productivity not only in manufacturing but also in agribusiness and services. Last, there is growing agro-pessimism on the basis that agriculture in developing countries has the least productivity (Gollin 2010; Dercon 2009; Dethier and Effenberger 2012). Hence, the large share of agriculture in national income among developing countries does not imply that overall growth has to be based on the Agricultural Development Led Industrialization (ADLI) strategy. Otherwise, as SSA economies become more open, comparative advantage in primary products and agriculture may either draw resources from higher productivity non-agricultural sectors into the lower productivity agricultural sector (Dethier and Effenberger 2012) or simply lock them up in agriculture. Productivity growth in agriculture is necessary, but it is not sufficient for structural transformation. SSA needs to significantly increase human capital in science and technology, and reform its business climate in order to gain some global competitiveness.
The World Development Report 2008 demonstrates that in a number of Asian economies, such as China, India, Malaysia, and Vietnam, agricultural development preceded industrialization. However, it remains debatable whether agricultural modernization caused the industrialization. As early as the 1970s, the newly industrializing nations of East Asia took advantage of the increasing demand for manufactures (especially electronics), and the search for low-cost production locations by the corporations from developed economies (Perkins et al. 2013). They boosted their labor technical skills and training, built export pressing zones (EPZs), improved business institutions, and attracted a lot of manufacturing FDI. SSA has tried several industrialization strategies such as import substitution parastatals, ADLI, and export processing zones but with limited success. With the emergence of Asia as hub of light manufacturing, powered by early globalization since the 1970s, the industrialization of SSA might be harder to achieve. According to Collier (2007) Asian economies have attained economies of agglomeration in manufacturing and services, and many SSA economies seem to have missed the first boat. It was thought that globalization will bring the boat back around, but the current trends of globalization and import penetration are making the waiting longer and harder. Resource-rich SSA nations are doubly locked up into natural resource exports because of the Asian manufacturing export agglomerations and the increasing demand for natural resources particularly by emerging Asia (Collier 2007). The empirical results have clearly demonstrated that increased dependency on natural resource exports can increase GDP but discourage structural transformation. SSA must, therefore, strategically use its resource rents to diversify its economies towards activities such as ICT service exports and international tourism which can transfer skills and technology and have the potential to create modern jobs.
According to Gereffi and Kaplinsky (2001) what matters for a country’s development is not so much of its overall level of industrialization as the type of value chain activities it is involved in. However, Conde et al. (2015) contend that the level of industrialization is one of the structural factors that determine a country’s participation in global value chains (GVCs). The level of industrialization, that is, the share of manufacturing value-added in GDP is strongly related to backward participation in GVCs, especially in factory-type activities such as assembly which dominate the early stages of industrialization. In addition, a key feature of the GVCs is the progressive outsourcing by lead firms in developed countries of their peripheral, and frequently low-value, productive functions to low-cost countries and regions, while retaining control of the core nodes of value creation in their home countries (Neilson et al. 2014).
Therefore, SSA needs to develop policy options to manage the downside effects of globalization on industrialization while enhancing participation in GVCs in order to intensify catch-up growth and structural change (Conde et al. 2015). Financial deepening is another key aspect. According to Paulson and Townsend (2004), Banerjee and Newman (1993), Aghion et al. (1999) low access to credit is one of the significant constraints to business in developing countries. In addition, for investors to seek credit from financial intermediaries, they need a favorable business environment. Given the small size of most SSA economies, being in a neighborhood of states with poor institutions will further limit international investment into an economy even if it has good institutions, especially if it is landlocked. In such circumstances, regional economic integration provides a significant opportunity to minimize cross-border barriers to intra-SSA trade and investment and to enhance regional value chain integration (Conde et al. 2015). In particular, small and medium enterprises are more likely to succeed in the regional markets where they have better market information. The African Continental Free Trade Area is one step in the right direction. Successful structural transformation and the attraction of value allocations to SSA requires a significant boost in human capital, infrastructural and institutional development, regional economic integration, and trade facilitation (World Bank: Global Value Chain Development Report 2017).
6. Conclusions
We have used the catch-up growth theory to identify the determinants of the non-classical structural transformation unfolding in SSA. Labor flows from the low-productivity agricultural sector more into low-productivity services than it does into manufacturing. The theory hinges on contact with innovating economies and the absorptive capacity of the developing economies. In the effort to open up and increase contact, import penetration and FDI in natural resource-based activities have had limiting effects on structural change in SSA. For global contact to enhance productivity growth and structural change, developing economies need to build stronger absorptive capacities, and time is of essence. All hope is not lost. We find that the service sector, specifically international tourism and ICT service exports, are positively contributing to the overall productivity growth and structural change. If the growth in the non-manufacturing sector is in the services that involve transfer of skills and technology, it can significantly increase productivity in Africa. At the same time, although the manufacturing share of GDP is still either stagnant or even declining, it is also still productivity-enhancing. This result is in line with McMillan et al. (2014), who find that after 2000, structural change started contributing to Africa’s overall productivity growth.
The low levels of industrialization, global contact, and absorption capacity pose a challenge but also point to opportunities for SSA. However, these opportunities are not automatic. The rising wages in China do not necessarily make Africa an attractive destination for light manufacturing. The high global demand for natural resources can become a curse especially if SSA nations do not adopt strong democratic institutions and regulatory standards. The silver lining for SSA is in the new policy approaches, such as the African Continental Free Trade Area. SSA is geographically far Europe, Asia, and North America, which are the key hubs of the GVCs. Therefore, regional integration provides an opportunity for building the ship while sailing and protecting infant enterprises before they can compete in the global markets.
Author Contributions
Conceptualization, J.S.; Formal analysis, J.S. and E.B.; Methodology, J.S.; Writing-original draft, J.S.; Writing-review and editing, J.S. and E.B.
Funding
This research received no external funding.
Acknowledgments
We would like to thank two anonymous referees and the editor for their excellent suggestions. Any remaining errors are our own.
Conflicts of Interest
The authors declare no conflict of interest.
Appendix A

Table A1.
Key variables.
| Variable | Source | Definition |
|---|---|---|
| Income per capita | World Development Indicators Database | GDP per capita (constant 2010) is gross domestic product divided by midyear population. |
| Agriculture value-added percent of GDP | World Development Indicators Database | The agriculture sector consists of activities in agriculture, hunting, forestry and fishing. Value added is the net output of a sector after adding up all outputs and subtracting intermediate inputs. |
| Manufacturing value-added percent of GDP | World Development Indicators Database | Manufactures value added comprises: chemicals, basic manufactures, machinery and transport equipment, miscellaneous manufactured goods, excluding non-ferrous metals. |
| Services value-added percent of GDP | World Development Indicators Database | Services include wholesale and retail trade, hotels and restaurants, transport, and government, financial, professional, and personal services such as education, health care, and real estate services. |
| Agriculture share of employment | World Development Indicators Database | Employment in agriculture percent of total employment. ILO estimate. |
| Manufacturing share of employment | African Development Bank Database | Employment in manufacturing percent of total employment. ILO estimate. |
| Services share of employment | World Development Indicators Database | Employment in services percent of total employment. ILO estimate. |
| Import Penetration | Authors’ computations | Imports percent of GDP plus imports minus exports |
| Foreign Direct Investment percent of GDP | World Development Indicators Database | Foreign direct investment are the net inflows of investment to acquire a lasting management interest (10 percent or more of voting stock) in an enterprise operating in an economy other than that of the investor. |
| Human Capital | Penn World Tables | The index of human capital per person is based on years of schooling and returns to education. |
| Economic Freedom Index | The Heritage Foundation, Washington | The economic freedom index used in this paper is an average of: business freedom, investment freedom, trade freedom, monetary freedom, financial freedom, and property rights. |
| ICT services export percent of service exports | World Development Indicators Database | Information and communication technology service exports include computer and communications services (telecommunications and postal and courier services) and information services (computer data and news-related service transactions). |
| International tourism, receipts percent of total exports | World Development Indicators Database | International tourism receipts are expenditures by international inbound visitors, including payments to national carriers for international transport. |
| Ores and metals exports percent of merchandise exports | World Development Indicators Database | Ores and metals comprise the commodities: crude fertilizer, minerals nes; metalliferous ores, scrap; and non-ferrous metals. |
Table A2.
Descriptive statistics (2000–2015).
| Variable | Mean | Standard Deviation | Minimum | Maximum | Observations | Countries |
|---|---|---|---|---|---|---|
| Income per capita | 1976.15 | 2470 | 193.86 | 10137 | 464 | 29 |
| Agriculture share of employment | 55.23 | 23.68 | 4.6 | 92.25 | 464 | 29 |
| Manufacturing share of employment | 6.40 | 4.92 | 0.43 | 24.74 | 464 | 29 |
| Services share of employment | 31.76 | 17.21 | 5.51 | 71.72 | 464 | 29 |
| Agriculture value-added percent of GDP | 23.92 | 14.22 | 2.03 | 60.50 | 464 | 29 |
| Manufacturing value-added percent of GDP | 10.75 | 6.19 | 1.53 | 35.21 | 464 | 29 |
| Services value-added percent of GDP | 48.42 | 10.86 | 13.25 | 74.74 | 464 | 29 |
| Import Penetration | 0.37 | 0.14 | 0.10 | 0.84 | 446 | 29 |
| Foreign Direct Investment percent of GDP | 4.37 | 5.68 | -4.84 | 41.80 | 461 | 29 |
| Human Capital | 1.74 | 0.41 | 1.06 | 2.80 | 464 | 29 |
| Economic Freedom Index | 56.33 | 6.51 | 40.6 | 77 | 442 | 29 |
| ICT services export percent of service exports | 19.43 | 16.61 | 0.052 | 88.62 | 403 | 29 |
| International tourism, receipts percent of total exports | 12.12 | 10.40 | 0.128 | 46.09 | 417 | 29 |
| Ores and metals exports percent of merchandise exports |
Table A3.
(a,b) Pairwise correlation coefficients, (c) Pairwise correlation variables.
| ECTERM | ECOLA | STRUC | AGGDP | MAGDP | SEGDP | EMAGR | EMMAN | EMSEV | IMPORT | FDI | HCAP | EFREE | |
| ECTERM | 1 | ||||||||||||
| ECOLA | −0.047 | 1 | |||||||||||
| STRUC | 0.977 *** | −0.0651 | 1 | ||||||||||
| AGGDP | −0.70 9 *** | 0.051 | −0.676 *** | 1 | |||||||||
| MAGDP | 0.321 *** | 0.055 | 0.337 *** | −0.400 *** | 1 | ||||||||
| SEGDP | 0.136 *** | 0.159 *** | 0.129 *** | −0.431 *** | 0.295 *** | 1 | |||||||
| EMAGR | −0.629 *** | −0.052 | −0.525 *** | 0.644 *** | −0.094 ** | −0.402 *** | 1 | ||||||
| EMMAN | 0.524 *** | 0.103 ** | 0.463 *** | −0.572 *** | 0.366 *** | 0.108 ** | −0.515 *** | 1 | |||||
| EMSEV | 0.617 ** | 0.033 | 0.523 *** | −0.601 *** | 0.024 | 0.394 *** | −0.967 *** | 0.389 *** | 1 | ||||
| IMPORT | 0.375 *** | −0.020 | 0.331 *** | −0.539 *** | 0.240 *** | −0.027 | −0.376 *** | 0.499 *** | 0.285 *** | 1 | |||
| FDI | 0.018 | −0.015 | 0.012 | −0.024 | −0.222 *** | −0.194 *** | 0.055 | −0.022 | −0.050 | 0.359 *** | 1 | ||
| HCAP | 0.679 *** | −0.024 | 0.0653 *** | −0.750 *** | 0.122 *** | 0.330 *** | −0.665 *** | 0.408 *** | 0.672 *** | 0.367 *** | −0.041 | 1 | |
| EFREE | 0.423 *** | 0.102 ** | 0.438 *** | −0.453 *** | 0.246 *** | 0.627 ** | −0.366 *** | 0.195 | 0.414 *** | 0.033 | −0.115 ** | 0.469 *** | 1 |
| *** significant at 1 percent; ** significant at 5 percent. | |||||||||||||
| (a) | |||||||||||||
| ECTERM | STRUC | AGEXP | MAXEP | OREXP | ICTEXP | TOEXP | |||||||
| ECTERM | 1 | ||||||||||||
| STRUC | 0.977 *** | 1 | |||||||||||
| AGEXP | −0.175 *** | −0.203 *** | 1 | ||||||||||
| MAEXP | 0.358 *** | 0.314 *** | −0.223 *** | 1 | |||||||||
| OREXP | −0.081 | −0.040 | −0.257 *** | −0.198 *** | 1 | ||||||||
| ICTEXP | 0.030 | 0.003 | 0.016 | −0.007 | −0.100 *** | 1 | |||||||
| TOEXP | −0.157 | −0.178 | −0.004 | 0.099 * | −0.142 *** | −0.305 *** | 1 | ||||||
| *** significant at 1 percent; ** significant at 5 percent; * significant at 10 percent. | |||||||||||||
| (b) | |||||||||||||
| ECTERM: economy-wide productivity term | SEGDP: Services value-added percent of GDP | FDI: foreign direct investment | |||||||||||
| ECOLA: labor productivity term | EMAGR: agriculture share of employment | HCAP: human capital | |||||||||||
| STRUC: Structural change term | EMMAN: manufacturing share of employment | EFREE: economic freedom | |||||||||||
| AGGDP: Agriculture value-added percent of GDP | EMSER: services share of employment | AGEXP: agriculture raw material exports | |||||||||||
| MANGDP: manufacture value-added percent of GDP | IMPEN: import penetration | MAEXP: manufacturing exports | |||||||||||
| OREXP: ores and metals export | ICTEXP: ICT services exports | TOEXP: international tourism export | |||||||||||
| (c) | |||||||||||||
References
- Abramovitz, Moses. 1986. Catching-up, Forging Ahead and Falling Behind. The Journal of Economic History 46: 385–406. [Google Scholar] [CrossRef]
- African Development Report. 2015. Growth, Poverty and Inequality Nexus: Overcoming Barriers to Sustainable Development. Available online: https://ideas.repec.org/b/adb/adbade/2342.html (accessed on 5 September 2019).
- Aghion, Philippe, Eve Caroli, and Cecilia Garcia-Penalosa. 1999. Inequality and economic growth: The perspective of the new growth theories. Journal of Economic Literature 37: 1615–60. [Google Scholar] [CrossRef]
- Akpan, Nseabasi S. 2012. From agriculture to petroleum oil production: What has changed about Nigeria’s rural development? International Journal of Developing Societies 1: 97–106. [Google Scholar]
- Arellano, Manuel, and Stephen Bond. 1991. Some tests of specification for panel data: Monte Carlo evidence and an application to employment equations. The Review of Economic Studies 58: 277–97. [Google Scholar] [CrossRef]
- Arellano, Manuel, and Olympia Bover. 1995. Another look at the instrumental variable estimation of error-components models. Journal of Econometrics 68: 29–51. [Google Scholar] [CrossRef] [Green Version]
- Badiane, Ousmane. 2014. Agriculture and structural transformation in Africa. In Frontiers in Food Policy: Perspectives on Sub-Saharan Africa. Edited by Walter P. Falcon and Rosamond L. Naylor. Stanford: Center on Food Security and the Environment (FSE), pp. 1–43, chp. 1. [Google Scholar]
- Banerjee, Abhijit V., and Andrew F. Newman. 1993. Occupational choice and the process of development. Journal of Political Economy 101: 274–98. [Google Scholar] [CrossRef]
- Binswanger-Mkhize, Hans P., Alex F. McCalla, and Praful Patel. 2010. Structural Transformation and African Agriculture. Global Journal of Emerging Market Economies 2: 113–52. [Google Scholar] [CrossRef]
- Borensztein, Eduardo, Jose De Gregorio, and Jong-Wha Lee. 1998. How does foreign direct investment affect economic growth? Journal of International Economics 45: 115–35. [Google Scholar] [CrossRef]
- Blundell, Richard, and Stephen Bond. 1998. Initial conditions and moment restrictions in dynamic panel data models. Journal of Econometrics 87: 115–43. [Google Scholar] [CrossRef]
- Busse, Matthias, Ceren Erdogan, and Henning Mühlen. 2019. Structural Transformation and its Relevance for Economic Growth in Sub-Saharan Africa. Review of Development Economics 23: 33–53. [Google Scholar] [CrossRef]
- Catrinescu, Natalia, Miguel Leon-Ledesma, Matloob Piracha, and Bryce Quillin. 2009. Remittances, institutions, and economic growth. World Development 37: 81–92. [Google Scholar] [CrossRef]
- Chenery, Hollis B., and Lance Taylor. 1968. Development Patterns among Countries and over Time. Review of Economics and Statistics 50: 391–416. [Google Scholar] [CrossRef]
- Collier, Paul. 2007. The Bottom Billion: Why the Poorest Countries Are Failing and What Can Be Done about It. Oxford: Oxford University Press. [Google Scholar]
- Conde, Carlos, Philipp Heinrigs, and Anthony O’Sullivan. 2015. Tapping the Potential of Global Value Chains for Africa. In The Africa Competitiveness Report 2015. Geneva: World Economic Forum. [Google Scholar]
- De Brauw, Alan, Valerie Mueller, and Hak Lim Lee. 2014. The Role of Rural–Urban Migration in the Structural Transformation of Sub-Saharan Africa. World Development 63: 33–42. [Google Scholar] [CrossRef]
- De Vries, Gaaitzen, Marcel Timmer, and Klaas De Vries. 2015. Structural Transformation in Africa: Static Gains, Dynamic Losses. The Journal of Development Studies 51: 674–88. [Google Scholar] [CrossRef]
- Dercon, Stefan. 2009. Rural poverty: Old challenges in new contexts. The World Bank Research Observer 24: 1–28. [Google Scholar] [CrossRef]
- Dethier, Jean-Jacques, and Alexandra Effenberger. 2012. Agriculture and Development: A Brief Review of the Literature. Economic Systems 36: 175–205. [Google Scholar] [CrossRef]
- Diao, Xinshen, Josaphat Kweka, and Margaret McMillan. 2018. Small firms, structural change and labor productivity growth in Africa: Evidence from Tanzania. World Development 105: 400–15. [Google Scholar] [CrossRef]
- Dieleman, Joseph L., Casey M. Graves, and Michael Hanlon. 2013. The fungibility of health aid: Reconsidering the reconsidered. Journal of Development Studies 49: 1755–62. [Google Scholar] [CrossRef]
- Dieleman, Joseph L., and Michael Hanlon. 2014. Measuring the displacement and replacement of government health expenditure. Health Economics 23: 129–40. [Google Scholar] [CrossRef]
- Enache, Maria, Ejaz Ghani, and Stephen O’Connell. 2016. Structural Transformation in Africa: A Historical View. Policy Research Working Paper No. 7743. Washington, DC: World Bank, Available online: https://openknowledge.worldbank.org/handle/10986/24824 (accessed on 5 November 2019).
- Fei, John C. H., and Gustav Ranis. 1964. Development of the Labor Surplus Economy: Theory and Policy. Homewood: Richard A. Irwin, Inc. [Google Scholar]
- Felipe, Jesus, and Aashish Mehta. 2016. Deindustrialization? A Global Perspective. Economics Letters 149: 148–51. [Google Scholar] [CrossRef]
- Gereffi, Gary, and Raphael Kaplinsky. 2001. The Value of Value Chains: Spreading the Gains from Globalization. Brighton: Institute of Development Studies. [Google Scholar]
- Gollin, Douglas. 2010. Agricultural productivity and economic growth. In Handbook of Agricultural Economics. Edited by Evenson Robert and Pingali Prabhu. Amsterdam: Elsevier, pp. 3825–66. [Google Scholar]
- Grossman, Gene M., and Elhanan Helpman. 1991. Innovation and Growth in the Global Economy. Cambridge: MIT Press. [Google Scholar]
- Haraguchi, Nobuya, Charles Fang Chin Cheng, and Eveline Smeets. 2017. The Importance of Manufacturing in Economic Development: Has This Changed? World Development 93: 293–315. [Google Scholar] [CrossRef]
- Harchaoui, Tarek M., and Murat Üngör. 2018. The Lion on the Move Towards the World Frontier: Catching Up or Remaining Stuck? Journal of African Economies 27: 251–73. [Google Scholar] [CrossRef]
- Harttgen, Kenneth, and Margaret McMillan. 2015. What Is Driving the African Growth Miracle? Annual Conference 2015 (Muenster): Economic Development—Theory and Policy 112839. Boston: German Economic Association. [Google Scholar]
- Hayakawa, Kazuhiko. 2009a. First difference or forward orthogonal deviations—Which transformation should be used in dynamic panel data models?: A simulation study. Economics Bulletin 29: 2008–17. [Google Scholar]
- Hayakawa, Kazuhiko. 2009b. A simple efficient instrumental variable estimator for panel AR(p) models when both N and T are large. Econometric Theory 25: 873–90. [Google Scholar] [CrossRef]
- Jedwab, Rémi. 2011. Why Is African Urbanization Different? Evidence from Resource Exports in Ghana and Ivory Coast. Mimeo. Available online: http://home.gwu.edu/~jedwab/JEDWAB_JMP_14112011.pdf (accessed on 5 November 2019).
- John Baffes, By, and Xiaoli L. Etienne. 2016. Analyzing food price trends in the context of Engel’s Law and the Prebisch-Singer hypothesis. Oxford Economic Papers 68: 688–713. [Google Scholar] [CrossRef]
- McMillan, Margaret S., Dani Rodrik, and Íñigo Verduzco-Gallo. 2014. Globalization, Structural Change, and Productivity Growth, with an Update on Africa. World Development 63: 11–32. [Google Scholar] [CrossRef]
- Lewis, W. Arthur. 1954. Economic Development with Unlimited Supplies of Labor. The Manchester School 22: 139–91. [Google Scholar] [CrossRef]
- Lucas, Robert E., Jr. 1988. On the mechanics of economic development. Journal of Monetary Economics 22: 3–42. [Google Scholar] [CrossRef]
- Lundvall, Bengt-Åke, and Rasmus Lema. 2014. Technology, Innovation and Development, Growth and structural change in Africa: Development strategies for the learning economy. African Journal of Science 6: 455–66. [Google Scholar]
- Mensah, Justice Tei, George Adu, Anthony Amoah, Kennedy Kwabena Abrokwa, and Joseph Adu. 2016. What drives structural transformation in Sub-Saharan Africa? African Development Review 28: 157–69. [Google Scholar] [CrossRef]
- Mijiyawa, Abdoul’Ganiou. 2017. Drivers of Structural Transformation: The Case of the Manufacturing Sector in Africa. World Development 99: 141–59. [Google Scholar] [CrossRef]
- Neilson, Jeffrey, Bill Pritchard, and Henry Wai-chung Yeung. 2014. Global value chains and global production networks in the changing international political economy: An introduction. Review of International Political Economy 21: 1–8. [Google Scholar] [CrossRef] [Green Version]
- Paulson, Anna L., and Robert Townsend. 2004. Entrepreneurship and financial constraints in Thailand. Journal of Corporate Finance 10: 229–62. [Google Scholar] [CrossRef]
- Perkins, Dhea, Steven Radelet, David Lindauer, and Steven Block. 2013. Economics of Development. New York: W.W. Norton & Company. [Google Scholar]
- Ricardo, David. 1821. On the Principles of Political Economy and Taxation, 3rd ed. Cambridge: Cambridge University Press. [Google Scholar]
- Rodrik, Dani. 2016a. An African Growth Miracle? Journal of African Economies 111: 1–23. [Google Scholar] [CrossRef]
- Rodrik, Dani. 2016b. Premature Deindustrialization. Journal of Economic Growth 21: 1–33. [Google Scholar] [CrossRef]
- Romer, Paul M. 1986. Increasing returns and long-run growth. Journal of Political Economy 94: 1001–37. [Google Scholar] [CrossRef]
- Romer, Paul M. 1990. Endogenous technological change. Journal of Political Economy 98: 71–102. [Google Scholar] [CrossRef]
- Roodman, David. 2009a. How to do xtabond2: An introduction to difference and system GMM in Stata. The Stata Journal 9: 86–136. [Google Scholar] [CrossRef]
- Roodman, David. 2009b. A note on the theme of too many instruments. Oxford Bulletin of Economics and Statistics 71: 135–158. [Google Scholar] [CrossRef]
- Schmidt, Torben Dall, Peter Sandholt Jensen, and Amber Naz. 2018. Agricultural productivity and economic development: The contribution of clover to structural transformation in Denmark. Journal of Economic Growth 23: 387–426. [Google Scholar] [CrossRef]
- Stokey, Nancy. 2015. Catching up and falling behind. Journal of Economic Growth 20: 1–36. [Google Scholar] [CrossRef]
- Thirlwall, Anthony P., and Penélope Pacheco-López. 2017. Economics of Development. London: Palgrave. [Google Scholar]
- United Nations Economic Commission for Africa. 2014. Dynamic Industrial Policy in Africa: Economic Report on Africa. Addis Ababa: United Nations Economic Commission for Africa. [Google Scholar]
- Vivarelli, Marco. 2018. Globalization, Structural Change and Innovation in Emerging Economies: The Impact on Employment and Skills. IZA Institute of Labor Economics, Discussion Papers No. 11849. Available online: https://ssrn.com/abstract=3261708 (accessed on 5 November 2019).
- Wan, Henry. 2004. Economic Development in a Globalized Environment: East Asian Evidences. New York: Springer Science Business + Media Inc. [Google Scholar]
- World Bank. 2014. The World Bank Annual Report 2014: Main Report (English). Washington, DC: World Bank Group. [Google Scholar]
Figure 1.
Average values 29 Sub-Saharan American Countries.
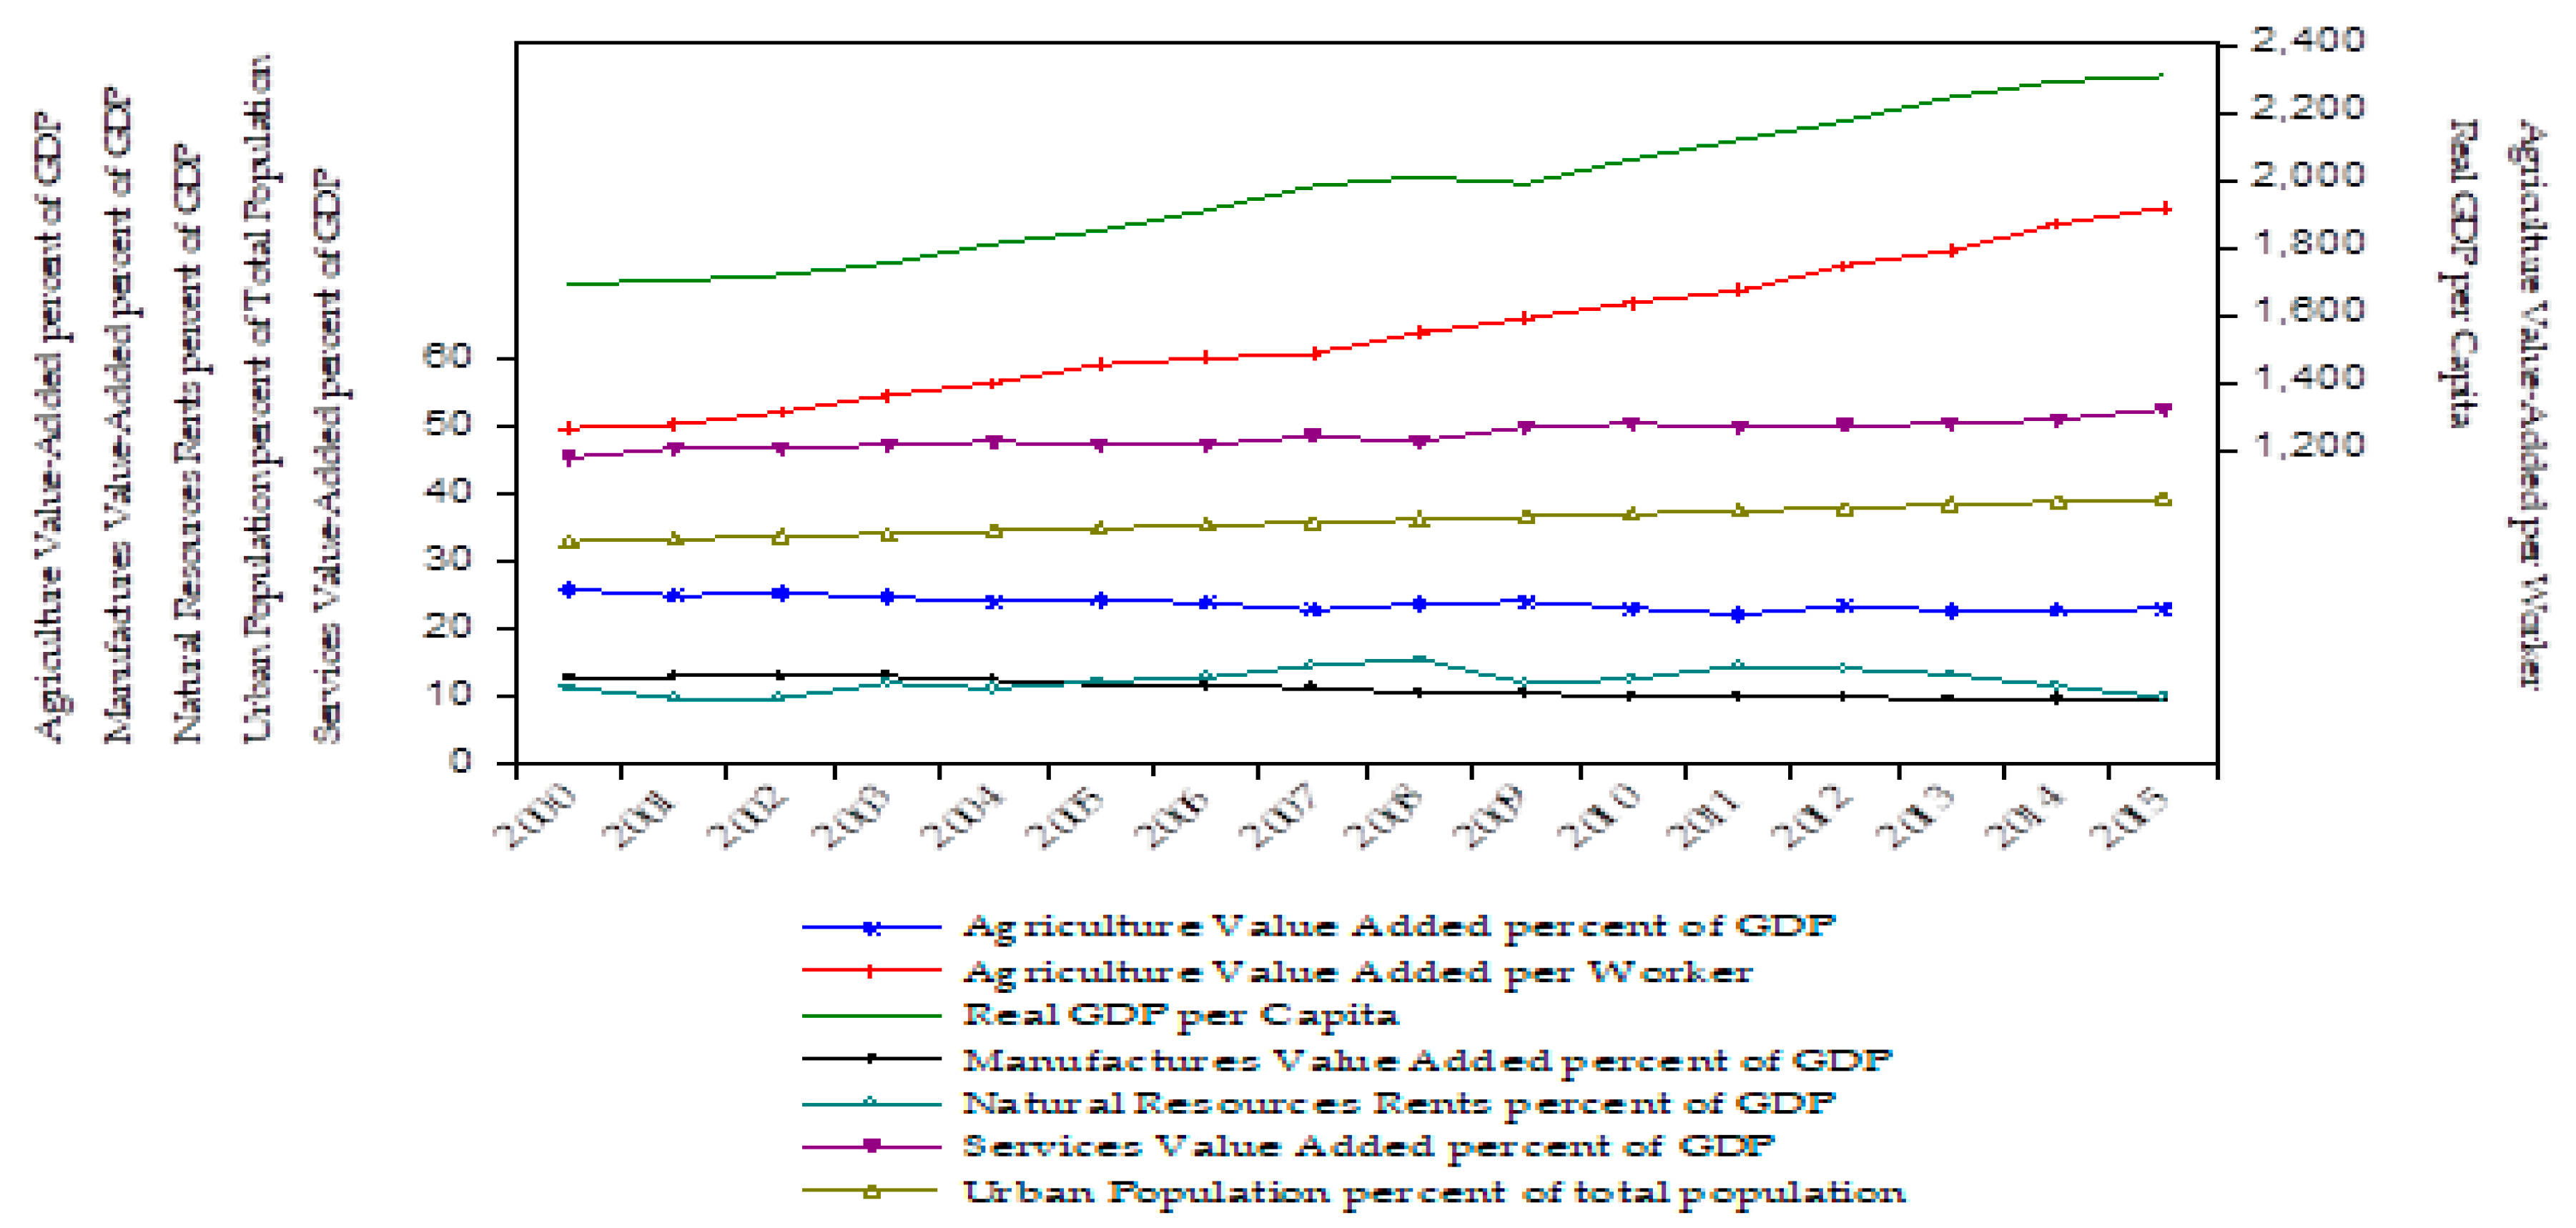
Figure 2.
Average Values for 29 Sub-Saharan American countries.
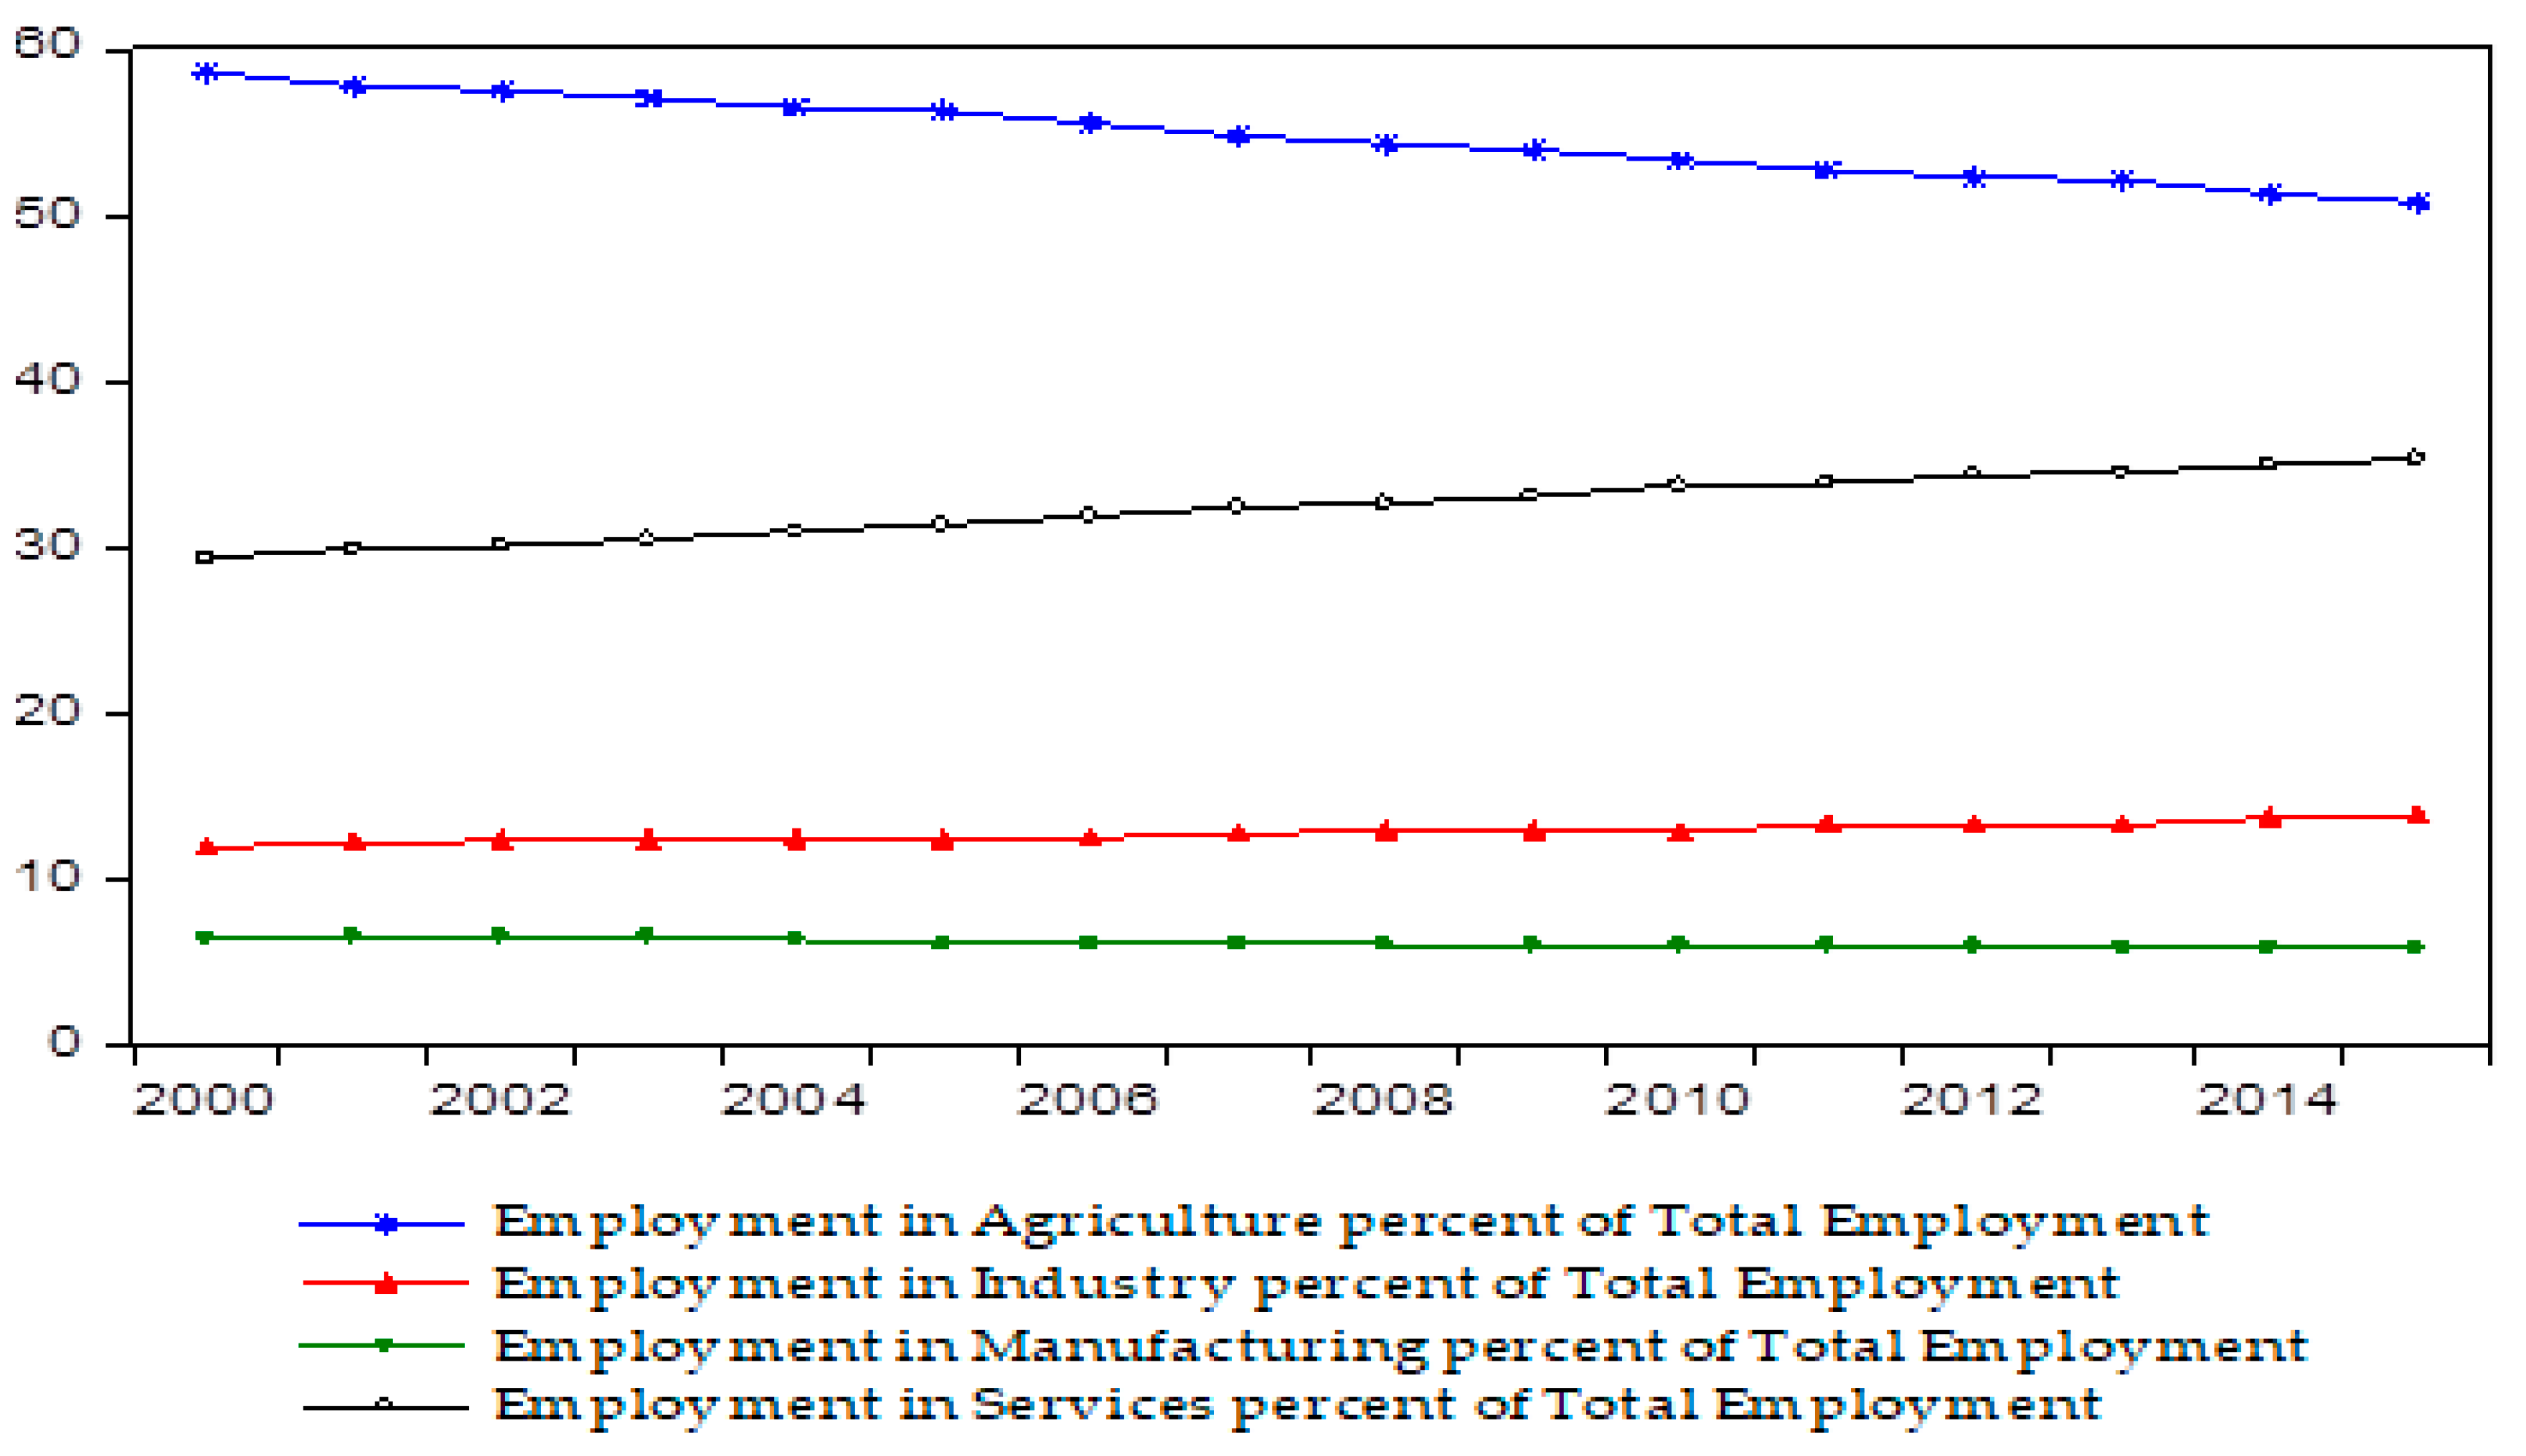
Table 1.
Change in employment and value-added per worker 2000–2015 (unweighted averages).
| Country | Change in Employment Share of Agriculture | Change in Employment Share of Industry | Change in Employment Share of Services | Change in Agriculture Value-Added Per Worker | Change in Industry Value-Added Per Worker | Change in Services Value-Added Per Worker |
|---|---|---|---|---|---|---|
| Benin | −0.453 | 0.330 | 0.123 | 0.108 | −0.836 | 0.420 |
| Botswana | 0.442 | −0.421 | −0.020 | −0.723 | 1.531 | 3.569 |
| Burkina Faso | −3.546 | 1.741 | 1.805 | 0.765 | −3.197 | −1.184 |
| Burundi | −0.045 | 0.008 | 0.037 | −0.097 | −1.466 | 0.871 |
| Cameroon | −0.306 | −0.032 | 0.339 | 0.074 | 1.412 | 0.135 |
| Congo Rep | −0.302 | 0.135 | 0.167 | 0.200 | −5.287 | 1.135 |
| Ethiopia | −1.038 | 0.322 | 0.715 | 0.149 | 0.276 | 0.391 |
| Gabon | −0.080 | 0.119 | −0.038 | −0.574 | −10.640 | 3.958 |
| Gambia, The | −0.318 | 0.031 | 0.287 | −0.256 | 0.018 | −0.001 |
| Kenya | −0.493 | 0.088 | 0.405 | 0.278 | 0.538 | 0.344 |
| Lesotho | −3.831 | 1.907 | 1.924 | 1.033 | −2.996 | −1.673 |
| Madagascar | −0.225 | 0.190 | 0.035 | −0.056 | −0.362 | −0.538 |
| Malawi | −0.011 | −0.047 | 0.058 | −0.053 | 0.310 | 0.347 |
| Mauritania | −0.208 | −0.013 | 0.222 | −0.020 | 3.172 | 0.899 |
| Mauritius | −0.253 | −0.090 | 1.154 | 3.255 | 4.623 | 4.389 |
| Mozambique | −0.520 | 0.038 | 0.481 | 0.118 | 2.442 | 0.857 |
| Namibia | −0.578 | 0.280 | 0.297 | −0.413 | 0.657 | 3.926 |
| Niger | −0.055 | 0.045 | 0.010 | 0.056 | 0.882 | −0.451 |
| Nigeria | −1.419 | 0.195 | 1.224 | 2.479 | −0.340 | 2.440 |
| Rwanda | −1.338 | 0.337 | 1.001 | 0.160 | −0.250 | −0.078 |
| Senegal | 0.592 | 0.214 | −0.807 | −0.259 | −0.271 | 1.820 |
| Sierra Leone | −0.382 | 0.021 | 0.361 | 0.189 | 0.340 | 0.505 |
| South Africa | −0.649 | −0.028 | 0.677 | 4.472 | 0.057 | 1.735 |
| Sudan | −0.442 | −0.039 | 0.481 | 0.369 | 5.045 | 2.100 |
| Swaziland | −0.106 | −0.156 | 0.263 | 0.016 | 7.146 | −3.835 |
| Tanzania | −0.615 | 0.086 | 0.529 | 0.101 | 1.750 | 0.322 |
| Togo | −0.116 | 0.030 | 0.086 | −0.108 | 0.072 | 0.095 |
| Uganda | 0.004 | −0.072 | 0.067 | −0.084 | 1.689 | 0.761 |
| Zambia | −1.133 | 0.358 | 0.775 | −0.172 | 0.441 | 1.270 |
| AVERAGE | −0.601 | 0.192 | 0.436 | 0.380 | 0.233 | 0.846 |
Table 2.
Decomposition of productivity growth 2000–2015 (unweighted averages).
| Country | Component Due to Structural Change between | Component Due to Labor Productivity Growth within | Economy-Wide Productivity Growth | ||||||
|---|---|---|---|---|---|---|---|---|---|
| Agriculture | Industry | Service | Total between | Agriculture | Industry | Service | Total within | ||
| Benin | −1.013 | 1.253 | 0.221 | 0.461 | 1.190 | 0.253 | 0.308 | 1.751 | 2.212 |
| Botswana | 0.475 | −3.100 | −0.077 | −2.702 | −0.694 | −0.024 | 0.598 | −0.119 | −2.821 |
| Burkina Faso | −7.237 | 11.382 | 8.100 | 12.245 | 4.507 | 1.698 | 3.099 | 9.304 | 21.549 |
| Burundi | −0.050 | 0.291 | 0.618 | 0.860 | −3.010 | 0.002 | 0.142 | −2.867 | −2.007 |
| Cameroon | −0.475 | −0.391 | 1.306 | 0.439 | 0.622 | −0.001 | 0.817 | 1.437 | 1.876 |
| Congo Rep | −0.784 | 0.543 | 0.445 | 0.204 | 0.413 | 0.017 | −0.063 | 0.367 | 0.571 |
| Ethiopia | −1.344 | 5.389 | 4.612 | 8.657 | 2.481 | 0.148 | 1.578 | 4.207 | 12.864 |
| Gabon | −0.199 | 0.992 | −0.093 | 0.700 | −1.098 | 0.001 | −0.895 | −1.992 | −1.292 |
| Gambia, The | −1.066 | 0.152 | 0.522 | −0.391 | −0.460 | 0.002 | 0.871 | 0.414 | 0.022 |
| Kenya | −1.211 | 0.602 | 0.898 | 0.289 | 0.668 | 0.036 | 1.140 | 1.843 | 2.132 |
| Lesotho | −13.054 | 8.184 | 5.619 | 0.749 | 1.336 | 1.158 | 1.563 | 4.057 | 4.806 |
| Madagascar | −0.324 | 1.296 | −0.068 | 0.904 | −1.292 | 0.066 | 0.623 | −0.603 | 0.301 |
| Malawi | −0.015 | −0.662 | 0.897 | 0.221 | −0.529 | −0.013 | 0.041 | −0.501 | −0.281 |
| Mauritania | −0.270 | −0.487 | 1.459 | 0.702 | −0.070 | 0.001 | 0.387 | 0.319 | 1.021 |
| Mauritius | −2.781 | −2.899 | 1.984 | −3.695 | 0.319 | −0.248 | 2.326 | 2.397 | −1.298 |
| Mozambique | −0.673 | 0.906 | 2.628 | 2.861 | 2.349 | 0.005 | 2.217 | 4.571 | 7.432 |
| Namibia | −3.196 | 1.238 | 0.376 | −1.583 | −0.219 | −0.001 | 0.828 | 0.608 | −0.974 |
| Niger | −0.073 | 0.622 | 0.047 | 0.596 | 1.462 | 0.023 | −0.076 | 1.409 | 2.005 |
| Nigeria | −3.477 | 1.546 | 2.757 | 0.827 | 3.580 | 0.013 | 4.349 | 7.942 | 8.769 |
| Rwanda | −1.755 | 6.532 | 6.294 | 11.071 | 3.499 | 0.053 | 2.309 | 5.860 | 16.931 |
| Senegal | 1.124 | 1.139 | −2.714 | −0.450 | −1.240 | 0.111 | −1.295 | −2.424 | −2.874 |
| Sierra Leone | −0.625 | 0.310 | 1.102 | 0.787 | 1.325 | 0.005 | 2.783 | 4.113 | 4.900 |
| South Africa | −8.473 | −0.152 | 1.010 | −7.615 | 0.821 | −0.006 | 2.049 | 2.864 | −4.751 |
| Sudan | −0.815 | −0.286 | 1.945 | 0.844 | 0.375 | 0.003 | 0.505 | 0.883 | 1.727 |
| Swaziland | −0.157 | −1.184 | 1.554 | 0.213 | 0.244 | −0.007 | 0.314 | 0.551 | 0.764 |
| Tanzania | −0.855 | 1.533 | 2.402 | 3.079 | 1.343 | 0.007 | 1.994 | 3.344 | 6.423 |
| Togo | −0.369 | 0.147 | 0.135 | −0.086 | −0.441 | 0.147 | −0.059 | −0.353 | −0.439 |
| Uganda | −0.044 | −1.281 | −0.040 | −1.365 | −0.803 | −0.009 | −0.382 | −1.193 | −2.558 |
| Zambia | −1.873 | 4.182 | 2.555 | 4.864 | −1.215 | 0.018 | 2.003 | 0.807 | 5.670 |
| AVERAGE | −1.984 | 1.089 | 1.576 | 0.680 | 0.533 | 0.119 | 1.037 | 1.689 | 2.370 |
Table 3.
Characteristics of Structural Economic Transformation in SSA.
| Dependent Variable | Ln(Structural Change Term) | Ln(Agriculture Value-Added/GDP) | Ln(Manufacturing Value-Added/GDP) | Ln(Services Value-Added/GDP) | ||||
|---|---|---|---|---|---|---|---|---|
| Fixed-Effects (within) | Two-Step GMM | Fixed-Effects (within) | Two-Step GMM | Fixed-Effects (within) | Two-Step GMM | Fixed-Effects (within) | Two-step GMM | |
| Dependent variable (−1) | 0.951 *** (0.000) | 0.678 *** (0.000) | 0.985 *** (0.000) | 0.369 *** (0.000) | ||||
| Ln(GDP per capita) | 3.064 * (0.083) | 3.951 *** (0.000) | 1.845 *** (0.000) | 1.133 *** (0.003) | −0.323 (0.465) | −0.652 ** (0.025) | −1.074 *** (0.000) | −0.971 *** (0.000) |
| (Ln(GDP per capita))_squared | −0.189 (0.142) | −0.262 *** (0.000) | −0.145 *** (0.000) | −0.095 *** (0.003) | −0.047 (0.141) | 0.044 ** (0.031) | 0.093 *** (0.000) | 0.070 *** (0.000) |
| Constant | −1.965 (0.753) | −13.921 *** (0.000) | −2.622 ** (0.012) | −2.250 * (0.088) | 6.746 *** (0.000) | 2.371 ** (0.026) | 6.637 *** (0.000) | 5.710 *** (0.000) |
| R-squared | 0.173 | 0.333 | 0.228 | 0.207 | ||||
| Observations | 464 | 435 | 464 | 435 | 464 | 435 | 464 | 435 |
| Countries | 29 | 29 | 29 | 29 | 29 | 29 | 29 | 29 |
| Instruments | 21 | 21 | 21 | 21 | ||||
| AR(1) [p-value] | 0.227 | 0.000 | 0.065 | 0.021 | ||||
| AR(2) [p-value] | 0.921 | 0.241 | 0.874 | 0.788 | ||||
| Hansen-test [p-value] | 0.300 | 0.259 | 0.312 | 0.605 | ||||
| Time year effects are included in all the regressions | ||||||||
*** significant at 1 percent; ** significant at 5 percent; * significant at 10 percent; p-values are in parenthesis.
Table 4.
Catch-up determinants of structural economic transformation in SSA.
| Dependent Variable | Ln(Structural Change Term) | Ln(Agriculture Share of Employment) | Ln(Manufacturing Share of Employment) | Ln(Services Share of Employment) | ||||
| Fixed-Effects (within) | Two-Step GMM | Fixed-Effects (within) | Two-Step GMM | Fixed-Effects (within) | Two-Step GMM | Fixed-Effects (within) | Two-Step GMM | |
| Dependent variable (−1) | 0.924 *** (0.000) | 1.002 *** (0.000) | 0.998 *** (0.000) | 0.995 *** (0.000) | ||||
| ln(import penetration) | 0.295 (0.305) | 0.051 (0.588) | −0.012 (0.788) | −0.043 (0.131) | 0.076 (0.231) | 0.015 (0.291) | 0.089 * (0.059) | 0.037 * (0.052) |
| ln(FDI/GDP) | 0.211 *** (0.000) | −0.064 *** (0.000) | −0.002 (0.673) | −0.002 (0.564) | −0.022 ** (0.040) | 0.004 (0.243) | 0.006 (0.403) | −0.029 * (0.029) |
| ln(human capital) | −4.848 *** (0.003) | 0.320 * (0.075) | −1.073 *** (0.000) | −0.188 ** (0.011) | 0.694 * (0.057) | 0.114 ** (0.021) | 0.585 ** (0.029) | 0.105 *** (0.004) |
| ln(economic freedom) | −0.542 (0.287) | 0.161 (0. 362) | 0.045 (0.585) | 0.504 *** (0.000) | −0.179 (0.115) | −0.073 (0.216) | 0.249 *** (0.003) | 0.001 (0.986) |
| Constant | 13.075 *** (0.000) | −0.098 (0.857) | 4.291 *** (0.000) | −1.789 *** (0.000) | 1.753 *** (0.000) | 0.169 (0.469) | 1.622 (0.000) | −0.155 (0.406) |
| R-squared | 0.240 | 0.196 | 0.086 | 0.305 | ||||
| Observations | 411 | 386 | 411 | 386 | 411 | 386 | 411 | 386 |
| Countries | 29 | 29 | 29 | 29 | 29 | 29 | 29 | 29 |
| Instruments | 25 | 25 | 25 | 25 | ||||
| AR(1) [p-value] | 0.222 | 0.153 | 0.189 | 0.003 | ||||
| AR(2) [p-value] | 0.881 | 0.105 | 0.317 | 0.131 | ||||
| Hansen-test [p-value] | 0.654 | 0.572 | 0.516 | 0.123 | ||||
| Time year effects are included in all the regressions | ||||||||
| (a) | ||||||||
| Dependent Variable | ln(Agriculture Percent of GDP) | ln(Manufacturing Percent of GDP) | ln(Services Percent of GDP) | |||||
| Fixed-Effects (within) | Two-Step GMM | Fixed-Effects (within) | Two-Step GMM | Fixed-Effects (within) | Two-Step GMM | |||
| Dependent variable (−1) | 0.807 *** (0.000) | 0.945 *** (0.000) | 0.953 *** (0.000) | |||||
| ln(import penetration) | 0.137 *** (004) | −0.119 *** (0.084) | −0.140 * (0.061) | −0.070 *** (0.001) | −0311 *** (0.000) | 0.032 * (0.070) | ||
| ln(FDI/GDP) | 0.008 (0.277) | 0.003 (0.523) | 0.013 (0.309) | −0.002 (0.993) | −0.010 (0.105) | −0.014 *** (0.001) | ||
| ln(human capital) | −1.041 *** (0.000) | −0.342 ** (0.041) | 1.267 *** (0.003) | −0.043 (0.423) | 0.812 *** (0.000) | 0.128 *** (0.010) | ||
| ln(economic freedom) | −0.138 * (0.099) | 0.182) (0.223) | −0.054 (0.683) | 0.018 (0.772) | 0.064 (0.354) | 0.003 (0.928) | ||
| Constant | 3.520 *** (0.000) | 0.403 (0.451) | 2.0401 *** (0.000) | 0.316 (0.308) | 4.206 *** (0.000) | −0.002 (0.993) | ||
| R-squared | 0.319 | 0.099 | 4.206 | |||||
| Observations | 411 | 386 | 411 | 386 | 411 | 386 | ||
| Countries | 29 | 29 | 29 | 29 | 29 | 29 | ||
| Instruments | 25 | 25 | 25 | |||||
| AR(1) [p-value] | 0.000 | 0.103 | 0.005 | |||||
| AR(2) [p-value] | 0.320 | 0.733 | 0.875 | |||||
| Hansen-test [p-value] | 0.219 | 0.313 | 0.509 | |||||
| Time year effects are included in all the regressions | ||||||||
| (b) | ||||||||
*** significant at 1 percent; ** significant at 5 percent; * significant at 10 percent; p-values are in parenthesis.
Table 5.
Effects of structural economic transformation on productivity in SSA (two-step system GMM).
Table 5.
Effects of structural economic transformation on productivity in SSA (two-step system GMM).
| Panel (a) | Panel (b) | Panel (c) | |||||||
|---|---|---|---|---|---|---|---|---|---|
| Dependent Variable | Economy-Wide Productivity Term | ln(GDP Per Worker) | Economy-Wide Productivity Term | ln(GDP Per Worker) | Economy-Wide Productivity Term | ln(GDP Per Worker) | Structural Change Term | ||
| Dependent variable (−1) | 0.832 *** (0.000) | 0.980 *** (0.000) | Dependent variable (−1) | 0.829 *** (0.000) | 0.965 *** (0.000) | Dependent variable (−1) | 0.810 *** (0.000) | 0.936 *** (0.000) | 0.786 *** (0.000) |
| Within component of productivity | 0.063 *** (0.000) | 0.022 *** (0.000) | ln(import penetration) | −0.040 (0.797) | −0.020 *** (0.012) | ln(agriculture raw material exports) | −0.088 *** (0.005) | −0.016 *** (0.003) | 0.033 (0.229) |
| Ln(agriculture share of employment) | 0.015 (0.790) | 0.029 (0.257) | ln(FDI/GDP) | −0.058 (0.159) | 0.002 * (0.098) | ln(manufacturing exports) | −0.038 (0.279) | 0.002 (0.574) | 0.037 (0.152) |
| Ln(manufacturing share of employment) | 0.282 *** (0.000) | −0.011 (0.112) | ln(human capital) | 1.409 *** (0.008) | −0.002 (0.964) | ln(ores and metals exports) | 0.045 * (0.061) | 0.008 ** (0.017) | −0.081 *** (0.000) |
| Ln(services share of employment) | 0.415 *** (0.001) | 0.031 * (0.057) | ln(economic freedom) | 0.177 (0.708) | 0.069 *** (0.008) | ln(ICT services exports) | 0.207 *** (0.000) | 0.008 (0.122) | 0.257 *** (0.000) |
| ln(international tourism export) | −0.044 (0.639) | 0.013 * (0.070) | 0.086 (0.186) | ||||||
| Constant | 1.377 *** (0.009) | −0.018 (0.742) | Constant | 2.164 (0.315) | 0.121 (0.323) | Constant | 3.552 *** (0.000) | 0.550 *** (0.000) | 1.366 *** (0.000) |
| Observations | 272 | 272 | Observations | 386 | 386 | Observations | 335 | 335 | 335 |
| Countries | 29 | 29 | Countries | 29 | 29 | Countries | 29 | 29 | 29 |
| Instruments | 25 | 25 | Instruments | 25 | 25 | Instruments | 27 | 27 | 27 |
| AR(1) [p-value] | 0.006 | 0.055 | AR(1) [p-value] | 0.104 | 0.009 | AR(1) [p-value] | 0.113 | 0.012 | 0.248 |
| AR(1) [p-value] | 0.959 | 0.659 | AR(1) [p-value] | 0.112 | 0.408 | AR(1) [p-value] | 0.133 | 0.300 | 0.869 |
| Hansen-test [p-value] | 0.605 | 0.590 | Hansen-test [p-value] | 0.497 | 0.411 | Hansen-test [p-value] | 0.781 | 0.219 | 0.771 |
| Time year effects are included in all the regressions | |||||||||
*** significant at 1 percent; ** significant at 5 percent; * significant at 10 percent; p-values are in parenthesis.
Table 6.
Testing Kaldor’s third law of growth.
| GDP Per Worker Growth(Overall Productivity Growth): 5-Year Averages | ||||||
|---|---|---|---|---|---|---|
| Pooled OLS | Fixed Effects (within) | Two-Step System GMM | ||||
| GDP per worker growth(−1) | 0.221 *** (0.009) | 0.205 ** (0.020) | ||||
| Growth of Manufacturing value added | 0143 *** (0.000) | 0.104 *** (0.003) | 0.106 *** (0.005) | 0.078 ** (0.031) | 0.112 ** (0.024) | 0.119 *** (0.003) |
| Growth of employment outside industry and manufacturing. | 0.300 ** (0.039) | 0.084 (0.578) | 0.142 (0.660) | |||
| Growth of employment in services | 0.402 *** (0.000) | 0.248 *** (0.005) | 0.439 *** (0.000) | |||
| Growth of employment in agriculture | 0.002 (0.975) | −0.054 (0.464) | 0.151 (0.190) | |||
| Constant | −0785 * (0.074) | −0.859 ** (0.029) | −0.756 * (0.053) | −0.805 ** (0.028) | 0.773 *** (0.004) | 0.360 (0.160) |
| R-squared (within) | 0.289 | 0.412 | 0.337 | 0.424 | ||
| Observations | 140 | 140 | 140 | 140 | 113 | 113 |
| Countries | 29 | 29 | 29 | 29 | 29 | 29 |
| Instruments | 10 | 12 | ||||
| AR(1) [p-value] | 0.045 | 0.011 | ||||
| AR(2) [p-value] | 0.909 | 0.611 | ||||
| Hansen-test [p-value] | 0.132 | 0.299 | ||||
| Time year effects are included in all the regressions | ||||||
*** significant at 1 percent; ** significant at 5 percent; * significant at 10 percent; p-values are in parenthesis.
© 2019 by the authors. Licensee MDPI, Basel, Switzerland. This article is an open access article distributed under the terms and conditions of the Creative Commons Attribution (CC BY) license (http://creativecommons.org/licenses/by/4.0/).
Share and Cite
MDPI and ACS Style
Ssozi, J.; Bbaale, E. The Effects of the Catch-Up Mechanism on the Structural Transformation of Sub-Saharan Africa. Economies 2019, 7, 111. https://doi.org/10.3390/economies7040111
AMA Style
Ssozi J, Bbaale E. The Effects of the Catch-Up Mechanism on the Structural Transformation of Sub-Saharan Africa. Economies. 2019; 7(4):111. https://doi.org/10.3390/economies7040111
Chicago/Turabian StyleSsozi, John, and Edward Bbaale. 2019. "The Effects of the Catch-Up Mechanism on the Structural Transformation of Sub-Saharan Africa" Economies 7, no. 4: 111. https://doi.org/10.3390/economies7040111
Note that from the first issue of 2016, this journal uses article numbers instead of page numbers. See further details here.