Migration, Labor Mobility and Household Poverty in Nigeria: A Gender Analysis
by
 ,
,
Mistura Rufai
1, 
Adebayo Ogunniyi
2,*,
Kabir Kayode Salman
3,
Motunrayo Oyeyemi
2 and
Mutiat Salawu
4 1
World Bank Group, Abuja P.O. Box 2826, Nigeria
2
International Food Policy Research Institute (IFPRI), O
Oro-Ago Crescent Garki II, Abuja 901101, Nigeria
3
University of Ibadan, Ibadan P.O. Box 22133, Nigeria
4
Federal College of Animal Health and Production Technology, Ibadan P.O. Box 5029, Nigeria
*
Author to whom correspondence should be addressed.
Economies 2019, 7(4), 101; https://doi.org/10.3390/economies7040101
Submission received: 26 June 2019
/
Revised: 20 September 2019
/
Accepted: 24 September 2019
/
Published: 2 October 2019
(This article belongs to the Special Issue Structural transformation, poverty and income inequality)
Abstract
:The increase in the geographical mobility of labour as a result of poverty, unemployment and unstable economic conditions, among other factors, especially among professionals, has been associated with a brain drain in Nigeria. Despite the high level of migration and subsequent remittances from migrants, a large proportion of Nigerians still live in poverty. The increased participation of women in migration in the country also brings to the fore the existence of gender-specific migration experiences and how this has in turn affected their households. Based on gender, this study assesses the extent of labour mobility, its determinants and how it influences remittance inflows and household poverty using the logit regression model Propensity Score Matching and Linear Regression with Endogenous Treatment Effect Approach. Results reveal that while more males travelled for employment purposes, more females travelled due to marriage arrangements. More of the migrants that were working after migration had worked before migration and had the highest average amount of remittance sent to households. The study shows that labour mobility increases the amount of remittance sent to households. However, the increase was higher among male migrants than female migrants. More than half of the migrants had poor households; meanwhile, labour mobility was found to reduce the extent of poverty. The study recommended that policies that improve the welfare of labour and reduce the brain drain, unemployment and closures of enterprises in the country should be put in place. Also, effective policies and interventions that promote the use of remittances to achieve maximum reductions in poverty should be pursued.
1. Background
Labour mobility through migration has been identified as one of the pathways out of poverty by poor people from the developing countries, especially from Sub-Saharan Africa (SSA) countries (Bhatt 2009; ILO et al. 2015; Ogunniyi et al. 2018; Ghebru et al. 2018; Olagunju et al. 2019). The growth rate of net migration in the region has been identified as the highest in the world (Adepoju 2006; Naudé 2008, 2010; Darkwah and Verter 2014; Ogunniyi et al. 2017). Labour mobility is a factor that impacts the welfare of the household, the home community, and in the end, the whole economy in various ways (Azam and Gubert 2006; Fonta et al. 2011; Nwaru et al. 2011). Meanwhile, the welfare effects of labour migration on the origin community or country are most often, though not always, sizable and positive. Studies (Omelaniuk 2005; Naudé 2008; Haar 2009; Shimeles 2010; Siddiqui 2012; World Bank 2019) have shown that the majority of migrants move from one area to another within the same country seeking economic opportunities, but that the role of international migration cannot be neglected in policy agenda. For instance, Siddiqui (2012) explained that both internal and international migrations can have major development implications for origin and destination areas.
Interestingly, Nigeria remains a major contributor to the net migration in SSA. According to the WDI, the country was responsible for about 17% of the net migration in the region in 2017 (ILO 2019). Various factors (push and pull) are often responsible for the movement of people away from their usual places of residence. In Nigeria, high levels of unemployment, migrant remittances, population growth (Darkwah and Verter 2014), unstable politics, ethno-religious conflicts and poverty (Adepoju 2009; Young 2013) are the major factors promoting the massive movement of both men and women across and outside the country (Darkwah and Verter 2014). Poor economic conditions and high levels of poverty also force people to move as they search for better living conditions, especially the youth and young adults (Bezu and Holden 2014; Ghebru et al. 2018). The existence of inequalities between rural and urban areas in Nigeria in terms of access to economic resources and development also promotes both internal and international migration (Chand 2012; Ogunniyi et al. 2018; Ghebru et al. 2018; Bisseleua et al. 2018). Migration in most cases does not only empower the migrant, but is also known for its relationship with the geographical and occupational mobility of labour, as the probability of moving within occupations is often higher with migration (Van Ham 2001; ILO et al. 2015; Ghebru et al. 2018; Basso et al. 2018).
Our studies contribute to the existing literature in several important ways. Firstly, this study is motivated by the dearth of empirical evidence on the nexus of labour mobility and the poverty status of Nigeria migrants who contribute massively to net migration growth around the world. To the best of the authors’ knowledge, very few studies (Olowa 2009; Fonta et al. 2011; Nwaru et al. 2011) have been undertaken to understand how the geographical movement of labour influences remittances and household poverty. This study therefore differs from existing evidence, as it takes a broader outlook and focuses on the differences in the relationship among these variables that could arise as a result of the gender of the migrant. This becomes increasingly important as there is an increase in the number of female migrants which gives more women the opportunity to be economically independent and act as economic actors among their family members. Several studies (Adepoju 2006; Regassa and Yusufe 2009; Adebayo et al. 2016; ILO 2019). Studies (Omelaniuk 2005; Haar 2009) have emphasised the importance of including gender differences when studying internal and international migration. According to Omelaniuk (2005), understanding the differences between the causes, processes and impacts of migration as a result of gender and how they influence the living standards of their households is important for policy options promoting gender equality and empowering women as a way of enhancing economic growth and reducing poverty.
Secondly, in this contribution, we not only highlighted the impact of labour mobility on the poverty of Nigeria population; this paper also adds to the debate on the geographical mobility of labour and type of employment in which migrants engage while also showing key policy-oriented reasons for migrating based on gender. Unlike earlier studies (Olowa 2009; Fonta et al. 2011; Nwaru et al. 2011) on Nigeria, we base our analysis on counterfactual per capita expenditures derived from Propensity Score Matching (PSM). Our main aim is to quantify the expenditure-related outcomes of labour mobility. We used this approach because the majority of the literature on migration acknowledges the existence of selection bias (De La Garza 2010; Mberu 2010; ILO et al. 2015; Ghebru et al. 2018); to resolve this, PSM was applied in order to capture the impact of labour mobility on remittance received and poverty. Furthermore, this study further shows methodological advantages by correcting for possible endogeneity and hidden biases which Ordinary Least Square (OLS) and PSM may failed to efficiently handle, by using an instrumental variable approach through linear regression with an endogenous treatment effect model. This model also serves as a robustness check on propensity score matching. In addition to changes in poverty indicators, we also explore factors that inform decisions related to labour mobility.
Thirdly, this study is motivated by the premise that understanding gender differences in labour movements and how they affect remittance inflows, as well as their impacts on household poverty, is important in the formulation of effective policies to promote the maximum use of remittances to reduce the extent of poverty in a country like Nigeria, which is facing series of economic issues. This study is of policy relevance, as most of the policies on poverty have been formed based on ideas of the feminization of poverty, while migration over the years has been attributed mainly to males, and policies have been formed accordingly. The roles played by males and females in reducing poverty and promoting economic development differ, and as such, effective poverty reduction policies can only be formulated by considering such roles. Despite the poverty reducing potentials of remittances and the country’s top position among the remittance destination countries in the world, about 112,519 million people, i.e., 69 percent of the estimated population (163 million) in Nigeria, live in poverty (NBS 2012). To understand the role and impact of labour migration on wellbeing, it is important to understand the motivations for migrations (De La Garza 2010; Mberu 2010; ILO et al. 2015; Ghebru et al. 2018).
Finally, according to Omelaniuk (2005) understanding the differences between the causes, processes and impacts of migration as a result of gender and how they influence the living standards of their households is important for promoting gender equality and empowering women as a way of enhancing economic growth and reducing poverty. The hypothesis in this paper is therefore to test whether labour mobility will affect remittances and poverty headcounts in the migrant households. The remaining sections of the paper are structured as follows. The next section presents the relationship between geographical movements of labour, remittances and household poverty. Section 2 details the empirical specification and estimation techniques used in the analysis, while Section 3 describes the data. Section 4 presents the empirical results. The last section offers concluding remarks.
2. The Nexus of Labour Mobility, Remittances and Household Poverty
On the supply side, the motivation for the movement of labour across time and space could be associated with the desire to earn more. Even though people migrate for other reasons, such as to join other family members and to study, Shimeles (2010), ILO (2014) and FAO (2017) revealed that the availability of work opportunities is a significant factor which attracts migrants. Countries and regions with higher emigration rates are usually characterised by high incidences of working poverty and low levels of social protection coverage (ILO et al. 2015).
Labour mobility could generate massive differences in wages for people with the same marginal productivity. Pritchett (2018) explained that the productivity of a person might not be due to their own efforts or assets or choices, but to the productivity of the place in which they utilise those assets, as moving from a low wage place to high wage place changes incomes by factor multiples. The mobility of labour does not only improve the efficiency and productivity of workers; it also increases their incomes as they move from low paid jobs to high paid jobs (Chand 2012; Salawu et al. 2018). Young (2013) explains that the variations between rural and urban areas in terms of capital and technological advancement push low-skilled workers to rural areas and high skilled workers to urban areas. According to Van Ham (2001), job-related migration, especially among those who are skilled and highly skilled, is associated with upward occupational mobility. Labour mobility could be “temporary”, i.e., where a migrant moves between his/her home and destination country, or “permanent”. While temporary migration is becoming more common (ILO 2019), the movement of labour to areas where migrants work and spend long periods, usually more than a year away from their home countries, often translates to more earnings and the remittance of more money to their families (De Haas 2005). In SSA, most of the movement of labour, especially among the poor, takes place within and between developing countries in the region (Shimeles 2010; Naudé 2008). Shaw (2007) explains that even though migrants’ remittances have been identified as a means by which to reduce poverty, the majority of the poor often cannot migrate as they do not have access to the resources they need to move.
Market imperfections and household characteristics such as the human capital endowments influence decisions on labour allocation to income-generating activities (Ahituv and Kimhi 2002) such as migration. According to Sapkota (2018), labour migration is used by households as a livelihood diversification strategy to fight poverty and improve living standards. Sunam (2015) explained that the migration of labour was a major means by which households in Nepal escaped poverty, as the remittances received were used to acquire basic needs. Households may use migrant remittances primarily to supplement income, or conversely, to invest in productive activities. The remittance from migrant workers create variations in the household’s sources of income and provide extra income for their recurrent expenses (De La Garza 2010). Remittances do not only increase and stabilise household income, but also contribute to cash inflows into the reserves of any nation. However, despite the benefits, labour migration could translate into reduced labour supplies and human capital resources in the place of origin, particularly among agricultural households that depend on family labour for their production activities. Developing countries like Nigeria often suffer from deficits of trained workers, especially in sectors such as health and technology, as they tend to move to countries where they are attracted by better employment conditions and training opportunities. According to Azam and Gubert (2006), labour supply response of the remittance-recipient households tends to find that remittances lower work efforts, and hence, reduce long-term growth.
The amount of remittance sent and what it is used for are often not only dependent on individual motives, but, according to authors such as Stark and Lucas (1988) and Rapoport and Docquier (2005), they are also dependent on the relationship between the migrant and the receivers. The increased involvement of women in migration further brings to the fore the importance of this relationship. Traditionally, women were often assumed to be passive in the migration process due to their assigned roles of homemaking and childcare. However, professional women, particularly those in the health sector from SSA countries like Nigeria and Ghana, leave their homelands to work abroad and in other SSA countries while their husbands look after the home. Women are more active in the informal sector, and are more susceptible to harassment; these factors have changed the venture from being a masculine one to one in which both males and females participate actively.
3. Data Source and Descriptive Statistics
Data from the 2009 World Bank Household Surveys for the African Migration Project in Nigeria were used for this study. The data contains information about the socio-economic characteristics of the respondents, household remittance income, expenditure on food and non-food, asset possession, individual characteristics of the migrant before and after migration, type of migration and other important household characteristics. The data contains adequate information to allow the researcher to answer key questions associated with this research.
A descriptive summary of the selected variables used in the regression analysis are presented in Table 1. The result shows that both the head of the migrant household (83.3 percent) and migrants in general (74.2 percent) are male. The average age of the migrant’s household head is approximately 52 years for the pooled and male-migrant households, but a little difference was observed in female migrant households (50 years). Meanwhile, the result shows that the average age of migrants is approximately 30 years for the pooled sample. However, the average age is similar among male migrants, but female migrants are younger. This finding further supports the assertion of ILO (2014) and Ghebru et al. (2018) that migration is a youth and male phenomenon, as most young people have several pull and push factors to migrate out of the country of origin to a new destination. The involvement of both the migrants and migrants’ household heads are considerably low. This is not surprising, as more than half of the sample population are from urban areas (see Table 1).
In term of education, the average years of education of the household head is approximately 9 years, except for female-headed households, for which it is approximately 10 years. Going by the Nigeriaa education system, this implies that most of the household heads have at least a junior secondary school certificate. Meanwhile, the average years of schooling for migrants is 12 years in the considered scenario. This implies that the lowest level of education among migrants is a senior secondary school certificate. This supports studies (Mberu 2010; ILO et al. 2015; Ghebru et al. 2018; Ogunniyi et al. 2018) that have suggested that education plays significant role in the reasons for migrating. Table 1 further reveals that less than half of male migrants are married, while more than half of their female counterparts are married, despite their being younger than male migrants. The probable reason for this may not be disconnected from the fact that male migrants are aware of the responsibility involved in marriage and are possibly looking forward to a “comfortable time“ in which to settle down before proposing marriage.
The result shows that there is high level of accessibility and ownership of mass media (radio and television) and communication (mobile phone) elements among the sampled population (see Table 1). The treatment variable used is labour mobility, captured as the employment situation of the migrant after migration. We proxied labour migration to be a dummy in which the migrant takes the value of 1 if employed and 0 otherwise. The result shows that more than half of the migrants are employed. The outcome variables used in this study are remittance income and poverty headcount. The average remittances received were ₦130,000 [$88.351]. The poverty headcount for all the population, male and female was 67 percent, 67.1 percent and 66.9 percent respectively.
Additionally, we used descriptive statistics to assess the factors that influence the decision to move among migrants. This makes possible the identification of the proportion of migrants that migrated especially for employment purposes. The extent of the geographical mobility of labour among migrants was also assessed using descriptive statistics. Migrants were placed into 3 groups: those working before and after migration, those working after migration and those not working after migration. The type of occupation of migrants was also considered (see Table 2).
3.1. Empirical Model
3.1.1. Logit Model for Drivers of Labour Mobility
This study attempts to increase the understanding of how migration, international migration specifically, provides improved and more productive employment opportunities for migrants. More importantly, we examined essential drivers that may affect the likelihood of labour mobility, conditional on migration decisions. We hypothesised that labour mobility () is a function of the migrant’s household characteristics () such as household size, ownership of (non) agriculture land etc., migrant characteristics () such as age, years of education, access to media () such as radio, television, ownership of mobile phone, location dummies () such as region and area of residence and indicators of the wealth of the household () proxied with per capita household expenditure; µ is the error term. Following on from previous studies (Amare et al. 2012; Mukhtar et al. 2018), we modelled labour mobility as: 1, if migrant is working after migration and 0 if otherwise.
The equation representing labour mobility is specified as follows:
3.1.2. Propensity Score Matching [PSM]
The impact of labour mobility on remittances and household poverty based on gender was analysed using the PSM. The PSM involves the generation of a control group (non-mobility labour group) which is paired with a treatment group (labour mobility group). The treatment (labour mobility group) and control (non-mobility labour group) units should have similar values as units which are not matched are removed. PSM is based on the idea of comparing the two groups differentiated by their participation in the program or activity of interest. The difference between the two groups is hence attributed to their participation and non-participation in the activity of interest. The estimated propensity score, for subject e{xi}, {i = 1, …, N} is the conditional probability of being assigned to a particular treatment given a vector of observed covariates xi (Rosenbaum and Rubin 1983):
where zi = 1 for treatment, zi = 0 for control and xi = the vector of observed covariates for the ith subject. The propensity score is a probability; it ranges from 0 to 1.
The Matching Procedure:
The Mahalanobis metric matching procedure was used in this study to match the treatment (labour mobility) and control (non-mobility labour) groups. This approach involves randomly ordering migrants and then calculating the distance between the first treated units and the controls. The distance is given as:
where U and V = values of the matching treatment and control units and C = Covariance matrix of matching units from the complete set of control units.
This approach is beneficial as it helps to deal with unobservable effects that might affect the matching procedure. The stratification brings together observations which are similar and reduces the effects of variations which might occur as a result of unobservable effects.
3.1.3. Linear Regression with Endogenous Treatment Effects (LRETE)
To offer a robustness check and provide a possible consistent estimate of the impact of labour mobility on remittances and poverty, we used the linear regression with endogenous treatment effect to account for possible endogeneity between labour mobility and outcomes of interest (remittances and poverty) with other biases related to unobservable characteristics of the migrants which cannot be controlled using the ordinary least square or propensity score matching alone. The endogenous treatment-regression model is a linear potential outcome model that allows for a specific correlation structure to be established between the unobservable that affects the treatment and the unobservable that affects the potential outcomes. Following Heckman et al. (2003), we tried to unite the treatment effect literature with the classical selection-bias literature by considering a model of potential outcomes of the type attributed to Roy (1951):
Equations (5) and (6) are the two potential outcomes equations in the two possible states of the migrants (if the migrant is working after migration and 0 if otherwise).
where T(Z) represents the observed labour mobility; T(Z) = 1 if migrant is working after migration and 0 if otherwise.
The T* is a latent variable which generates T (Z) as follows:
The following counterfactual choice variables are also defined. For any z which is a potential realization of Z, we define the variable T(z) = 1[≥], which shows whether or not migrant is working after migration, the value of Z been externally set to z, holding constant the unobserved . This requires an exclusive restriction; some element of Z which is not in X is denoted by Zn; in this way, it is possible for us to manipulate an individual migrant’s probability of labour mobility without tampering with the potential poverty incidence and remittances. Finally, we used a dummy variable, international migration, as the instrumental variable for labour mobility. It can be argued that labour mobility is conditional upon migration decisions. If the migrant did not migrate out of the origin to new destination, the supply of labour will be immobile. Additionally, the correlation coefficient showed that there is a strong correlation between migration decisions and labour mobility, but not between poverty incidence and amount of remittances received.
3.1.4. Measurement of Poverty
We adopted the expenditure approach to poverty which is a relative measurement of poverty. Our primary measure of poverty is total household expenditure. We begin the measurement of poverty by the derivation of the threshold (poverty line). Households below the poverty line can be adjudged to be poor. In the absence of a national poverty line, coupled with the fact that the use of the absolute poverty line of $1 dollar a day does not fit this kind of study, following (Oyekale et al. 2012) and (Ogundipe et al. 2019), we calculated a relative poverty line, defined as two-thirds of the mean per capita expenditure (PCE).
Several measurements of poverty have been developed and are used in the literature (Sen 1976; Foster et al. 2010, (FGT)); Observably, the FGT (2010), often called the p-alpha (Pα) class of poverty measure, is the most popular because the α is a policy parameter that can be varied to approximately reflect poverty “aversion”, and also, the Pα class of the poverty indices is decomposable subgroup. Hence, this paper used the standard FGT (2010) to generate the poverty profile of the selected cassava farming households. FGT takes the following form:
where Z = the relative poverty line
- n = number of households below the poverty line
- N = total households used for the study
- = estimated per capita household expenditure of the th household
- Z − Yi = poverty gap of the th household
- = poverty gap ratio
- = poverty aversion parameter, with values: 0, 1, 2
- = 0, Equation (1) gives the poverty headcount
- = 1, Equation (1) gives the poverty depth
- = 2, Equation (1) gives the poverty severity index.
For this study, we used the poverty headcount or incidence (0) as the outcome variable to estimate the impact of labour mobility.
4. Results and Discussion
In this section, the results from data analyses are presented and discussed. The reasons for migration were examined first. The extent of geographical and occupational mobility of labour was then assessed and the determinants of labour mobility were examined. Finally, the impact of labour mobility on household poverty was examined.
4.1. Reasons for Migration among Male and Female Migrants
The main reasons for migration identified in the study are education, employment and marriage. Table 2 reveals that while about 28% of male migrants had travelled to further their education, less than a quarter of female migrants had travelled to study. About 35% and 28% of male migrants travelled in search of work and as a result of job transfer/job opportunities respectively, while only 14.01% and about 11% of female migrants had travelled for the same purposes respectively. Almost 40% of the females migrated as a result of marriage arrangements, while only about 3% of males travelled for such purposes. These results indicate that for male migrants, education and employment were the major reasons for migrating, while most of the females migrated because of marriage and education. The findings in this study are supported by (George et al. 2017) and (Ortensi and di Belgiojoso 2018), that stated that education is a key driver of migration, especially among youth and male migrants, while marriage plays a key role in the migration decision of females.
4.2. Labour Mobility
Just as expected, more than half of the migrants were working after migration compared to 40.21% that were working beforehand. For male migrants, about 41% of migrants were working before migration while almost 75% were working afterwards. For females, less than 40% were working before migration while about 60% were working afterwards. Comparing the results shown in Table 3 with the reasons most migrants moved, the results reveal that even though most of the females migrated for reasons other than employment (i.e., marriage and education), most still became employed after migration. This could be associated with the need to support their households financially.
As suggested by Briggs (1994) and Sutcliffe (2001), we captured geographical labour mobility as the movement of labour from one location to another. Table 3 shows that more of those who had experienced geographical mobility were working before migration. This could be associated with the results in Table 2 which reveal that about a quarter of the migrants moved as a result of job transfers or the availability of job opportunities in other locations. Male migrants had a slightly higher proportion of migrants who worked before and after migration (about 39%), compared to the 35% among female migrants.
Labour mobility is often accompanied by occupational mobility i.e., when people switch from one occupation to another. Due to data constraints, only the forms of employment (i.e., paid employment, self-employment and military employment) could be considered in this aspect. Before migration, about 43% and 48% of the migrants that had worked before and after migration were employed in full-time, paid employment and self-employment, respectively. However, after migration, more than half were employed in full-time paid employment, while the proportion of those that were self-employed dropped to about 40%. This implies that there was a shift to paid employment from self-employment after migration. This shift is more pronounced among male migrants, as the proportion of those in paid employment rose to about 55% from 42% after migration, while the proportion of those in self-employment dropped to about 39% from 48.40% after migration. Among female migrants who worked before and after migration, the slight increase in those occupied in full-time, paid employment after migration was attributed to a decrease in the proportion of those that were working part time, as the proportion of those in self-employment before and after migration remained the same. The majority of the migrants who worked only after migration were occupied with full-time, paid employment after migration. The female migrants in this category had higher proportions of full- and part-time, paid employment when compared to males. However, a higher proportion of males were self-employed compared to females.
4.3. Determinants of Labour Mobility
We modelled the drivers of labour mobility of migrant conditions to migration decisions by demographic, household and migrant characteristicss using a logit regression model. The selected independent variables were subjected to a variance inflation factor (VIF) test to check for multicollinearity among the variables. A mean VIF of 1.23, which is less than 10, indicates the absence of any significant multicollinearity (see Appendix B).
Demographic characteristics: The results shown in Table 4 reveal that an increase in the number of migrants from the southern zones would raise the extent of labour mobility by 16.6 percent and 50.6 percent among male and female migrants respectively. This result support the trend recorded in previous studies (Abbass 2012; Ghebru et al. 2018; ILO 2019) that stated that migration is higher in southern Nigeria than it is in the north. Meanwhile, Mberu (2005) stated the migration which leads to labour migration is more of a female phenomenon in southern Nigeria. However, Olowa (2009) suggested that rural-urban migration (internal migration) is more common in Nigeria. Meanwhile, Naudé (2008) opined that urban dwellers are more likely to be involved in international migration than rural household members. Consistent with this, our finding shows that labour mobility is more likely to occur in urban Nigeria. However, males in urban areas have a higher likelihood of labour mobility than female counterpart (21.6 percent vs. 9.6 percent).
Household characteristics: The results show that the age of the household head and participation of the head in farming as a primary occupation had a negative relationship with labour mobility among males. The probable reason for this may be connected to the transgenerational nature of agriculture as an occupation in Nigeria, especially in rural households. Hence, as the head grows older, the less likely he/she will be to allow the members (especially male youth) of the household, which are likely to provide labour, to migrate for another job outside their country of origin. The marginal effects from this study show that the probability of labour mobility among male migrants would be reduced by 23.9 percent and 13.9 percent with an increase in the age of household heads and heads employed in farming/trading respectively. However, the likelihood of male labour mobility would also rise by 2.78 percent with an increase in the mean per capita expenditure of households. This agrees with previous studies (Young 2013; Ghebru et al. 2018; Mukhtar et al. 2018) that opined that migration comes with a cost, and household wealth status influences mobility.
The results also reveal that the probability of labour migration will increase with the number of years of education of the household head and ownership of non-agricultural land. Specifically, female labour migration would increase by 59.6 percent and 17.9 percent with an increase in the years of education of household heads and the possession of non-agricultural land among households. Labour mobility among females would, however, reduce with an increase in the number of households with agricultural land. This could be an indication that female labour migration was low among agricultural households and household heads that were uneducated.
Migrant characteristics: Labour mobility would increase with an increase in the age for both male and female migrants. A rise in the level of education also increases the likelihood of labour mobility for both male and female migrants respectively, while being married would reduce the likelihood among them respectively. These results imply that labour mobility was higher among older, educated and unmarried male and female migrants in Nigeria. However, the influence of all these aforementioned variables, with the exception of marriage, are higher among males than females. This is perhaps partly because these categories of individuals have higher chances of gaining financial independence in a new destination or environment. In global cities, the labour market structure is bifurcated with high demands for labour at both extreme ends of worker skill levels (low and high), but fewer opportunities are available for those in the middle (Massey et al. 1993). Higher levels of education have often been associated with higher paying job opportunities for migrants (Rapoport and Docquier 2005).
4.4. Remittance and Labour Mobility
Generally, more than half of the migrants had sent remittances to their households in the past year. However, the gender analysis in Table 5 shows that a higher proportion (54.76%) of male migrants had sent remittances compared to female migrants (39.29%). The significant result of the t-test 2.28 (p < 0.05) also showed that male migrants send more than their female counterparts.
For migrants who worked before and after migration, more than half of both males and females had sent remittances to their households. The amount sent by males and females was also significantly different. Even though more than half of the migrants who worked only after migration had also sent remittances home, there was no significant difference in the amount sent among males and females. The result also shows that migrants who had worked before and after migration had sent more remittances compared to those who worked only after migration, while the males who were not working had sent a higher amount of remittances compared to those who had only worked after migration. There was also no significant difference in the amount of remittances sent home by non-working male and female migrants.
4.5. Impact of Labour Mobility on Remittance
To confirm the relationship between labour mobility and the amount of funds sent home by migrants, an impact assessment was done using propensity score matching. Meanwhile, the dependability of the Propensity Score Matching estimates depends solely on the feature and quality of the matching procedure. This study provides relevant details on the inclusive covariate balancing and common support through the common support graph. We presented the overall covariate balancing test before and after matching in Table 6. The results reveal that the standardised mean difference for all covariates used in the PSM is reduced from 26.9% pre-matching to 7.9% post-matching. This result shows that matching reduces bias by about 68%. In addition, we rejected the joint significance of covariates post-matching (p-value = 0.600), while the joint significance of covariates was not rejected before matching (p-value = 0.0000). Moreover, due to matching, the pseudo-R2 declined from 24.5% to 3.3%. The high total bias reduction, the insignificant p-values of the likelihood ratio test after matching, low pseudo-R2 and significant reduction in the mean standardised bias are indicative of successful balancing of the distribution of covariates between labour mobility and otherwise.
The common support region is presented in Figure 1. A visual representation of the distribution of the estimated propensity scores indicates that the common support condition is satisfied, as there is substantial overlap in the distribution of the propensity scores of both participants and non-participants in labour mobility.
In Table 7, the results of the average treatment effect on the treated (ATT) show that labour mobility had a significant and positive effect on the amount remittance sent home by migrants. The results revealed that with labour mobility, the amount of remittance increases by ₦190,552.73; however, the increase was higher among male migrants (₦240,729.93) than female migrants (₦95,502.34). The average treatment effect (ATE) on any household selected at random was lower for the entire population (₦122,391.79) and male migrants (₦98,240.53), while it was higher female migrants (₦212,545.11) when compared with the ATT.
The average treatment effect on untreated (ATU) reveals the treatment on a randomly selected household before treatment (i.e., the counterfactual outcome if they were not treated); the results were also positive. These results confirm that labour mobility had an increasing effect on the amount of remittance sent home by migrants. We further use an endogenous treatment effect model to correct for possible endogeneity between labour mobility and remittances. Using migration decision as an instrument, the consistency and robustness of the estimate was tested (see Table 8 and Appendix D). The estimate suggests that labour mobility significantly increase the amount of remittances received by the migrant household. Therefore, the hypothesis of this study that labour mobility has a relationship with remittances among the migrant households will be accepted.
4.6. Household Poverty and Labour Mobility
The poverty status of the households of migrants was assessed using their total expenditure on food, cooking fuel, transportation, health, rent and other expenses in one year. The mean per capita expenditure of all the households was ₦140,166.10. For male migrants, the average was ₦142,308.10, while the households of female migrants spent an average of ₦134,040.10 (see Appendix C). Two thirds of the mean per capital expenditure was ₦93,444, and this was set as the poverty line. As shown in Table 9, overall, 54.95% were poor, as their household per capital expenditure was below the poverty line. For male migrants, 53.70% of households were poor, while 54.95% of the households of female migrants were poor. This is consistent with the findings of (Ogundipe et al. 2019) and (Ogunniyi et al. 2017) that poverty is higher among the female-headed households. Generally, migrants who worked only after migration seem to have the highest proportion of poor households (58.13%). About 60.31% and 58.15% of male and female migrants respectively in this category had poor households. This could imply that one of major reasons for migrating among those who work only after migration is to work in order to assist their households in meeting their daily needs.
4.7. Impact of Labour Mobility on Household Poverty
An impact assessment was also done to identify the impact of labour mobility on household poverty. The results in Table 10 show that labour mobility had a significant and negative relationship with household poverty. This implies that labour mobility reduces the extent of poverty among the households of migrants. The average treatment effect (ATT) shows that labour mobility had a significant and negative effect on the amount remittance sent home by migrants. The results of the average treatment effect (ATT) shows that labour mobility reduces poverty by 22.1 percent; however, the reduction was lower among male migrants, i.e., 20.1 percent, while the it was insignificant among female migrants, i.e., 0.188 percent.
As revealed in Table 11, the endogenous treatment effect model also shows a reducing effect of labour mobility on poverty headcount. Meanwhile, the correction of endogeneity can be obviously observed in the value of reduction of poverty headcount. The result from the endogenous treatment effect model shows a higher impact than the result from the PSM, especially for males (39.5 percent vs. 22.1 percent). Therefore, irrespective of the model used, these results confirm that labour mobility had a reducing effect on the poverty status of households, especially among male migrants. As in the case of remittances, we therefore conclude that the hypothesis of this study in relation to poverty headcount, i.e., that labour mobility have a relationship and affects poverty among the migrant households, will be accepted.
5. Conclusions and Recommendations
To improve the impact of migration and remittances sent home on the living standards of households in Nigeria, it is important to understand the variations in labour movements across gender and how such movements influence the amount of remittance sent and reduce the poverty levels among households. This study assessed the extent of labour mobility and identified its relationship with remittance inflows and household poverty. The results revealed that while a significant proportion of males travelled in search of work or due to job opportunities, about 40% of females travelled as a result of marriage arrangements. More of the migrants who had experienced geographical mobility were working before they migrated, and there was a shift to paid employment from self-employment after migration, especially among males. It is important to note that this study did not analyse the drivers of migration; rather, we focused on factors that provide a better integration in the host countries in economic terms (in the labour market). Hence, the study shows that labour mobility increased significantly with migrants from the southern zones of the country, aged and educated migrants, while it reduced with migrants from rural areas, aged household heads and married migrants. The probability of labour mobility also increased among males with the per capita expenditure of their households and reduced with migrants who had heads employed in farming/trading. For females, employment after migration increased with educated household heads and reduced with households that had agricultural land.
The amount of remittance sent home by migrants was significantly different across gender. Migrants that were working before and after migration sent the highest average amount of remittance. Labour mobility was found to have an increasing effect on the amount of remittance inflow. More than half of the migrants were from poor households. The proportion of the poor was found to be highest among households with migrants who worked only after migration. Labour mobility was also found to have a reducing effect on household poverty, especially among male migrants. About 40% of migrants were working before migration. The high level of geographical mobility of labour in Nigeria leads to a significant brain drain in the country. To reduce this, it is necessary to improve the welfare and living conditions of labourers and their households. This could be achieved by creating standard and conducive working environments for workers, providing up-to-date working equipment and giving workers timely and adequate remuneration to meet their needs. Working incentives such as free medicals and transportation should also be provided to reduce their dependence on their salaries.
More than half of the migrants were not working before migration. The high level of unemployment in the country also needs to be addressed through the development of sectors such as agriculture, processing and manufacturing, that could generate the need for manpower and create jobs. The effort of the current government to develop these sectors needs to be intensified. A considerable proportion of the migrants that were working before migration were self-employed. Self-employed individuals, especially those with medium- and small-scale enterprises, should also be encouraged to grow their businesses through the provision credit facilities, the development of the power sector to ensure the availability of electricity and the provision of other infrastructure such as good roads and markets, while other incentives such as the provision of land and low taxation are also given to them.
More than half of the migrants came from poor households. Remittance has the potential to reduce the high level of poverty among households in Nigeria if properly harnessed. This could be achieved through the regulation of the financial sector which deals with the transfer of remittances to the recipient household and provisions of infrastructures such as good roads, banks and transportation facilities, that would encourage the timely receipt of remittances. Recipient households, especially in rural areas, should also be trained to make proper investments so as to improve their welfare. While we are not in doubt of the result from this study, its limitation was the unavailability of recent data that directly captured issues of migration and remittances on Nigeria.
Author Contributions
Conceptualization, M.R. and A.O.; Methodology, M.R. and A.O.; Software, A.O.; Validation, M.R., A.O. and K.K.S.; Formal Analysis, M.R. and A.O.; Data Curation, M.R., A.O. and K.K.S.; Writing-Original Draft Preparation, M.R., A.O., K.K.S., M.O., and M.S.; Writing-Review & Editing, M.R., A.O., K.K.S., M.O., and M.S.; Supervision, M.R., A.O., and K.K.S.
Funding
This research received no external funding.
Conflicts of Interest
The authors declare no conflict of interest.
Appendix A

Table A1.
Socio economic characteristics of migrants by gender.
| Characteristics | Pooled | Male | Female | |||
|---|---|---|---|---|---|---|
| Demographic characteristics | ||||||
| Region | ||||||
| Urban | 731 | 52.03 | 527 | 50.62 | 204 | 56.04 |
| Rural | 674 | 47.97 | 514 | 49.38 | 160 | 43.96 |
| Zones | ||||||
| North | 170 | 12.10 | 133 | 12.78 | 37 | 10.16 |
| South | 1235 | 87.90 | 908 | 87.22 | 327 | 89.84 |
| Household characteristics | ||||||
| Age of household head | ||||||
| 17–30 | 103 | 7.33 | 78 | 7.49 | 25 | 6.87 |
| 31–45 | 352 | 25.05 | 247 | 23.73 | 105 | 28.85 |
| 46–60 | 598 | 42.56 | 431 | 41.40 | 167 | 45.88 |
| >60 | 352 | 25.05 | 285 | 27.38 | 67 | 18.41 |
| Education of household head | ||||||
| No education | 271 | 19.29 | 213 | 20.46 | 58 | 15.93 |
| Primary | 343 | 24.41 | 251 | 24.11 | 92 | 25.57 |
| Secondary | 771 | 54.88 | 563 | 54.08 | 208 | 57.14 |
| Higher | 20 | 1.42 | 14 | 1.65 | 6 | 1.65 |
| Household size | ||||||
| 1–2 | 138 | 9.82 | 94 | 9.03 | 44 | 12.09 |
| 3–6 | 794 | 56.51 | 609 | 58.50 | 185 | 50.82 |
| 7–10 | 342 | 24.34 | 250 | 24.02 | 92 | 25.27 |
| 11–15 | 107 | 7.62 | 69 | 6.63 | 38 | 10.44 |
| >15 | 24 | 1.71 | 19 | 1.83 | 5 | 1.37 |
| Has agric land | ||||||
| Yes | 999 | 71.10 | 750 | 72.05 | 249 | 68.41 |
| No | 406 | 28.90 | 291 | 27.95 | 115 | 31.59 |
| Has non-agric land | ||||||
| Yes | 585 | 41.64 | 437 | 41.98 | 148 | 40.66 |
| No | 820 | 58.36 | 604 | 58.02 | 216 | 59.34 |
| Migrants characteristics | ||||||
| Age | ||||||
| 15–30 | 831 | 59.15 | 577 | 55.43 | 254 | 69.78 |
| 31–40 | 399 | 28.40 | 315 | 30.26 | 84 | 23.08 |
| 41–50 | 112 | 7.97 | 98 | 9.41 | 14 | 3.85 |
| >50 | 63 | 4.48 | 51 | 4.90 | 12 | 3.30 |
| Highest level of education before migration | ||||||
| No formal education | 104 | 7.40 | 68 | 6.53 | 36 | 9.89 |
| Primary | 192 | 13.67 | 141 | 13.54 | 51 | 14.01 |
| Secondary | 605 | 43.06 | 435 | 41.79 | 170 | 46.70 |
| Higher | 504 | 35.87 | 397 | 38.14 | 107 | 29.40 |
| Marital status | ||||||
| Single/divorced/widow | 784 | 55.80 | 542 | 52.07 | 242 | 52.07 |
| Married | 621 | 44.20 | 499 | 47.93 | 122 | 33.52 |
Appendix B
Table A2.
Variance inflation factor (VIF) test.
| VIF | Tolerance | R-Squared | |
|---|---|---|---|
| Urban/rural | 1.20 | 0.8312 | 0.1688 |
| Zones | 1.26 | 0.7949 | 0.2051 |
| Education of household head | 1.24 | 0.8034 | 0.1966 |
| Age of household head | 1.25 | 0.7999 | 0.2001 |
| Sex of household head | 1.13 | 0.8826 | 0.1174 |
| Occupation of household head | 1.20 | 0.8322 | 0.1678 |
| Household size | 1.21 | 0.8281 | 0.1719 |
| Agric land | 1.09 | 0.9192 | 0.0808 |
| Non-agric land | 1.07 | 0.9366 | 0.0634 |
| Age of migrant | 1.52 | 0.6576 | 0.3424 |
| Education of migrant | 1.27 | 0.7897 | 0.2103 |
| Marital status of migrant | 1.38 | 0.7252 | 0.2748 |
| Mean VIF | 1.23 |
Appendix C
Table A3.
Poverty, labour mobility and gender.
| Male | Female | t-Test | |
|---|---|---|---|
| Mean per capital expenditure (₦) | 142,308.10 | 134,040.10 | 0.76 |
| Mean per capital expenditure of households with mobile labour (₦) | 145,958.90 | 138,051.70 | 0.38 |
| Mean per capital expenditure of households with non-mobile labour (₦) | 139,983.40 | 131,890.40 | 0.65 |
| Proportion of households that are poor (%) | 53.70 | 54.94 | - |
| Mean per capital expenditure of non-poor households (₦) | 250,389.60 | 238,319.10 | |
| Mean per capital expenditure of poor households (₦) | 49,114.46 | 48,531.32 |
Appendix D
Table A4.
Impact of Labour Mobility on Remittances: Endogenous Treatment Effects.
| Variables | (1) | (1) | (5) |
|---|---|---|---|
| Pooled Households | Male Households | FeMale Households | |
| region_dummy | −0.137 | −0.230 | 0.255 |
| (0.254) | (0.306) | (1.078) | |
| rural | 0.343 *** | 0.427 *** | 0.776 |
| (0.128) | (0.152) | (0.543) | |
| age | 0.00362 | 0.00207 | 0.0685 *** |
| (0.00483) | (0.00613) | (0.0216) | |
| sex | −0.148 | −0.0732 | −0.856 |
| (0.168) | (0.194) | (0.695) | |
| schoolingyears | 0.0131 | 0.0160 | −0.0406 |
| (0.0110) | (0.0124) | (0.0512) | |
| noinhh | −0.00972 | −0.00348 | −0.0654 |
| (0.0197) | (0.0235) | (0.0943) | |
| agricland | 0.0318 | −0.107 | 0.932 * |
| (0.141) | (0.172) | (0.534) | |
| nonagricland | 0.152 | 0.193 | −0.261 |
| (0.119) | (0.143) | (0.522) | |
| Age | 0.00863 * | 0.0114 | 0.0281 |
| (0.00522) | (0.00806) | (0.0236) | |
| Schoolyrsbeforeleaving | 0.0330 * | 0.0205 | 0.405 *** |
| (0.0185) | (0.0221) | (0.0850) | |
| married | 0.319 ** | 0.187 | 1.314 ** |
| (0.146) | (0.208) | (0.556) | |
| occuption_mig | −1.078 *** | −1.242 *** | 0.938 |
| (0.224) | (0.265) | (0.696) | |
| occuption_head | 0.0135 | 0.0417 | −0.0282 |
| (0.200) | (0.233) | (0.807) | |
| radio | −0.143 | −0.0943 | 0.288 |
| (0.217) | (0.255) | (1.049) | |
| tv | 0.342 | 0.568 * | 1.631 * |
| (0.260) | (0.343) | (0.840) | |
| mobilephone | −0.0585 | −0.116 | 0.580 |
| (0.231) | (0.281) | (0.974) | |
| 1.mob | 14.89 *** | 15.19 *** | 1.650 *** |
| (0.167) | (0.218) | (0.166) | |
| Constant | −5.847 *** | −6.247 *** | −7.650 *** |
| (0.484) | (0.589) | (2.013) | |
| Observations | 1429 | 1060 | 369 |
Standard errors in parentheses; *** p < 0.01, ** p < 0.05, * p < 0.1.
Appendix E
Table A5.
Impact of Labour Mobility on Poverty: Endogenous Treatment Effects.
| Variables | (1) | (2) | (3) |
|---|---|---|---|
| Pooled Households | Male Households | Female Households | |
| region_dummy | −0.0363 | −0.0309 | −0.0320 |
| (0.0333) | (0.0369) | (0.0768) | |
| rural | 0.0736 *** | 0.0787 ** | 0.0463 |
| (0.0264) | (0.0314) | (0.0493) | |
| age | −0.00435 *** | −0.00495 *** | −0.00176 |
| (0.000941) | (0.00105) | (0.00207) | |
| sex | 0.0106 | 0.0223 | −0.00493 |
| (0.0336) | (0.0385) | (0.0680) | |
| schoolingyears | −0.0147 *** | −0.0162 *** | −0.00965 ** |
| (0.00231) | (0.00266) | (0.00461) | |
| noinhh | 0.0190 *** | 0.0152 *** | 0.0350 *** |
| (0.00405) | (0.00461) | (0.00796) | |
| agricland | 0.0284 | 0.0323 | 0.0204 |
| (0.0284) | (0.0343) | (0.0520) | |
| nonagricland | −0.0234 | −0.0164 | −0.0625 |
| (0.0238) | (0.0271) | (0.0496) | |
| Age | −0.00194 | −0.00158 | −0.00435 ** |
| (0.00120) | (0.00147) | (0.00218) | |
| Schoolyrsbeforeleaving | −0.00434 | −0.00414 | −0.00511 |
| (0.00374) | (0.00428) | (0.00781) | |
| married | 0.0726 ** | 0.104 *** | 0.00380 |
| (0.0282) | (0.0344) | (0.0540) | |
| occuption_mig | 0.0528 * | 0.0472 | 0.0840 |
| (0.0301) | (0.0345) | (0.0628) | |
| occuption_head | 0.0969 *** | 0.0929 *** | 0.0746 |
| (0.0271) | (0.0308) | (0.0623) | |
| radio | 0.0962 *** | 0.0850 ** | 0.149 |
| (0.0342) | (0.0358) | (0.0948) | |
| tv | −0.0878 ** | −0.0903 ** | −0.0890 |
| (0.0344) | (0.0399) | (0.0689) | |
| mobilephone | −0.0780 ** | −0.0851 ** | −0.0381 |
| (0.0310) | (0.0355) | (0.0669) | |
| 1.mob | −0.287 *** | −0.395 *** | 0.219 |
| (0.110) | (0.105) | (0.227) | |
| Constant | 1.205 *** | 1.331 *** | 0.675 *** |
| (0.0962) | (0.105) | (0.201) | |
| Observations | 1429 | 1060 | 369 |
Standard errors in parentheses; *** p < 0.01, ** p < 0.05, * p < 0.1.
References
- Abbass, Isah Mohammed. 2012. Trends of rural-urban migration in Nigeria. European Scientific Journal 8: 97–125. [Google Scholar]
- Adebayo, Ogunniyi, Kehinde Olagunju, Salman K. Kabir, and Ogundipe Adeyemi. 2016. Social crisis, terrorism and food poverty dynamics: evidence from Northern Nigeria. International Journal of Economics and Financial Issues 6: 1865–72. [Google Scholar]
- Adepoju, Aderanti. 2006. Internal and international migration within Africa. In Migration in South and Southern Africa: Dynamics and Determinants. Edited by Pieter Kok, Derik Gelderblom, John Oucho and Johan van Zyl. Cape Town: Human Sciences Research Council. [Google Scholar]
- Adepoju, Aderanti. 2009. Migration management in West Africa within the context of ECOWAS Protocol on Free Movement of Persons and the Common Approach on Migration. In Regional Challenges of West African Migration. Paris: Organisation for Economic Co-operation and Development, pp. 17–47. [Google Scholar]
- Ahituv, Avner, and Ayal Kimhi. 2002. Off-farm work and capital accumulation decisions of farmers over the life cycle: The role of heterogeneity and state dependence. Journal of Development Economics 68: 329–53. [Google Scholar] [CrossRef]
- Amare, Reda Mulubrhan, Lena Hohfeld, Somchai Jitsuchon, and Hermann Waibel. 2012. Rural-Urban Migration and Employment Quality: A Case Study from Thailand. Asian Development Bank Economics Working Paper Series, No. 309; Mandaluyong City: Asian Development Bank. [Google Scholar]
- Azam, Jean-Paul, and Flore Gubert. 2006. Migrants’ remittances and the household in Africa: A review of evidence. Journal of African Economies 15 S2: 426–62. [Google Scholar] [CrossRef]
- Basso, Gaetano, Francesco D’Amuri, and Giovanni Peri. 2018. Immigrants, Labor Market Dynamics and Adjustment to Shocks in the Euro Area (No. w25091). Cambridge: National Bureau of Economic Research. [Google Scholar]
- Bhatt, Wasudha. 2009. The gender dimension of migration in India: The politics of contemporary space in Orissa and Rajasthan. Development in Practice 19: 87–93. [Google Scholar] [CrossRef]
- Bisseleua, Herve, Latifou Idrissou, Adebayo Ogunniyi, and Kwesi Atta-Krah. 2018. Diversification and livelihood strategies in the cocoa belt of West Africa: The need for fundamental change. World Development Perspectives 10: 73–79. [Google Scholar] [CrossRef]
- Bezu, Sosina, and Stein Holden. 2014. Are rural youth in Ethiopia abandoning agriculture? World Development 64: 259–72. [Google Scholar] [CrossRef]
- Briggs, Vernon M., Jr. 1994. International Migration and Labor Mobility: The Receiving Countries. CAHRS Working Paper Series; Ithaca: CAHRS, p. 243. [Google Scholar]
- Chand, Masud. 2012. Diasporas, migration, and trade: the Indian diaspora in North America. Journal of Enterprising Communities: People and Places in the Global Economy 6: 383–96. [Google Scholar] [CrossRef]
- Darkwah, Samuel Antwi, and Nahanga Verter. 2014. Determinants of International Migration: The Nigerian Experience. Acta Universitatis Agriculturae et Silviculturae Mendelianae Brunensis 62: 321–27. [Google Scholar] [CrossRef]
- De Haas, Hein. 2005. International migration, remittances and development: Myths and facts. Third World Quarterly 26: 1269–84. [Google Scholar] [CrossRef]
- De La Garza, Rodolfo. 2010. Migration, Development and Children Left Behind: A Multidimensional Perspective. Social and Economic Policy Working Paper. New York: Division of Policy and Practice, United Nation Childrens’ Fund (UNICEF), Policy, Advocacy and Knowledge Management. [Google Scholar]
- Food and Agriculture Organization (FAO). 2017. Available online: http://www.fao.org/faostat/en/#home (accessed on 23 May 2019).
- Fonta, William, Onyukwu Onyukwu, and Emmanuel O. Nwosu. 2011. International Remittance inflows and household welfare: Empirical Evidence from Nigeria. Research Journal of Finance and Accounting 2. Available online: https://ssrn.com/abstract=2125040 (accessed on 24 May 2019).
- Foster, James, Joel Greer, and Erik Thorbecke. 2010. The Foster–Greer–Thorbecke (FGT) poverty measures: 25 years later. The Journal of Economic Inequality 8: 491–524. [Google Scholar] [CrossRef]
- George, Tayo, Mercy Ozoya, and Emmanuel Amoo. 2017. Women in informal cross-border trading along Nigeria and Benin republic border: Challenges and coping strategies. International Journal of Applied Business and Economic Research 15: 155–63. [Google Scholar]
- Ghebru, Hosaena, Mulubrhan Amare, George Mavrotas, and Adebayo Ogunniyi. 2018. Role of Land Access in Youth Migration and Youth Employment Decisions: Empirical Evidence from Rural Nigeria (No. 58). Washington, DC: International Food Policy Research Institute (IFPRI). [Google Scholar]
- Haar, Caroline. 2009. Rural-Urban Migration, Gender and Welfare in Ghana; Who Gains and Who Does Not? Master’s thesis, Economics, Department of Economics, School of Business, Economics and Law, University of Gothenburg, Gothenburg, Sweden, November. [Google Scholar]
- Heckman, James J., Lance J. Lochner, and Petra E. Todd. 2003. Fifty Years of Mincer Earnings Regressions. No. w9732. Cambridge: National Bureau of Economic Research. [Google Scholar]
- ILO. 2014. World of Work Report: Developing with Jobs. Geneva: ILO, p. 181. [Google Scholar]
- ILO. 2019. Global and Continental Policy Frameworks Guiding Labour Migration and Labour Mobility in Africa. Abidjan: ILO Regional Office for Africa, Available online: www.ilo.org/africa (accessed on 22 April 2019).
- International Labour Organisation (ILO), Organisation for Economic Co-Operation and Development (OECD), and World Bank Group (WBG). 2015. The contribution of labour Mobility to Economic growth. Paper presented at G20 Labour and Employment Minister’s Meeting, Ankara, Turkey, September 3–4. [Google Scholar]
- Massey, Douglas S., Joaquin Arango, Graeme Hugo, Ali Kouaouci, Adela Pellegrino, and Edward Taylor. 1993. Theories of international migration: A review and appraisal. Population and Development Review 19: 431–66. [Google Scholar] [CrossRef]
- Mberu, Blessing Uchenna. 2005. Who moves and who stays? Rural out-migration in Nigeria. Journal of Population Research 22: 141–61. [Google Scholar] [CrossRef]
- Mberu, Blessing Uchenna. 2010. Multiple Forms of Mobility in Africa’s Demographic Giant. Migration Information Source. Available online: www.Migration policy.org (accessed on 30 June 2010).
- Mukhtar, Umar, Zhangbao Zhong, Beihai Tian, Amar Razzaq, Muhammad Naseer, and Tayyaba Hina. 2018. Does Rural–Urban Migration Improve Employment Quality and Household Welfare? Evidence from Pakistan. Sustainability 10: 4281. [Google Scholar] [CrossRef]
- Naudé, Wim. 2008. Conflicts, Disasters and No Jobs Reasons for International Migration from Sub-Saharan Africa. United Nations University and World Institute for Development–UNUWIDER Research Paper No. 2008/85. Helsinki: United Nations University and World Institute for Development, October. [Google Scholar]
- Naudé, Wim. 2010. The Determinants of Migration from Sub-Saharan African Countries. Journal of African Economies 19: 330–56. [Google Scholar] [CrossRef]
- National Bureau of Statistics (NBS). 2012. Annual Abstract of Statistics. Abuja: NBS Press. [Google Scholar]
- Nwaru, Jude Chukwudi, Onwuchekwa Raph Iheke, and Christian Ejike Onyenweaku. 2011. Impact of Migrant Remittances on the Welfare of Arable Crop Farm Households in Southeastern Nigeria. Human Ecology Review 18: 159–66. [Google Scholar]
- Ogundipe, Adeyemi A., Adebayo Ogunniyi, Kehinde Olagunju, and Abiola Asaleye. 2019. Poverty and Income Inequality in Rural Agrarian Household of Southwestern Nigeria: The Gender Perspective. The Open Agriculture Journal 13: 51–57. [Google Scholar] [CrossRef]
- Ogunniyi, Adebayo, Olagunju Kehinde Oluseyi, Ogundipe Adeyemi, Salman K. Kabir, and Francis Philips. 2017. Scaling up agricultural innovation for inclusive livelihood and productivity outcomes in sub-Saharan Africa: The case of Nigeria. African Development Review 29: 121–34. [Google Scholar] [CrossRef]
- Ogunniyi, Adebayo, George Mavrotas, Kehinde Olagunju, Olusegun Fadare, and Adedoyin Mistura Rufai. 2018. The Paradigm of Governance Quality, Migration and its Implication on Food and Nutritional Security in Sub-Saharan Africa: What does Dynamic Generalized Method of Moments estimation reveal? Paper presented at 2018 Conference International Association of Agricultural Economists, (No. 275994), Vancouver, BC, Canada, July 28–August 2. [Google Scholar]
- Olagunju, Kehinde Oluseyi, Adebayo Isaiah Ogunniyi, Kunle Francis Oguntegbe, Ibrahim Oluwole Raji, and Kolawole Ogundari. 2019. Welfare Impact of Globalization in Developing Countries: Examining the Mediating Role of Human Capital. Economies 7: 84. [Google Scholar] [CrossRef]
- Olowa, Olatomide. 2009. Impact of migrant remittance on poverty among rural households in Nigeria. The Social Sciences 4: 59–64. [Google Scholar]
- Omelaniuk, Irena. 2005. Gender, poverty reduction and migration. Paper presented at the International Conference for Women Leaders, Haifa, Israel, September 25–28. [Google Scholar]
- Ortensi, Livia Elisa, and Elisa Barbiano di Belgiojoso. 2018. Moving on? Gender, education, and citizenship as key factors among short-term onward migration planners. Population, Space and Place 24: e2135. [Google Scholar] [CrossRef]
- Oyekale, Abayomi Samuel, Abimbola Oluwayemisi Adepoju, and Adedayo M. Balogun. 2012. Determinants of poverty among riverine rural households in Ogun State, Nigeria. Studies of Tribes and Tribals 10: 99–105. [Google Scholar] [CrossRef]
- Pritchett, Lant. 2018. Alleviating Global Poverty: Labor Mobility, Direct Assistance, and Economic Growth. Center for Global Development, Working Paper 479. Washington, DC: Center for Global Development, Available online: www.cgdev.org (accessed on 30 May 2019).
- Rapoport, Hillel, and Frédéric Docquier. 2005. The Economics of Migrants’ Remittances. IZA Discussion Paper 1531. Bonn: Institute for the Study of Labour (IZA). [Google Scholar]
- Regassa, Nigatu, and Ansha Yusufe. 2009. Gender differentials in Migration Impacts in Southern Ethiopia. Anthropologist 11: 129–37. [Google Scholar] [CrossRef]
- Rosenbaum, Paul, and Donald Rubin. 1983. The Central Role of the Propensity Score in Observational Studies for Causal Effects. Biometrika 70: 41–55. [Google Scholar] [CrossRef]
- Roy, Andrew Donald. 1951. Some thoughts on the distribution of earnings. Oxford Economic Papers 3: 135–46. [Google Scholar] [CrossRef]
- Salawu, Mutiat Bukola, Saka Yusuff, Kabir Kayode Salman, Adebayo Isaiah Ogunniyi, and Adedoyin Mistura Rufai. 2018. Does Governance Influence Economic Growth in Sub-Saharan Africa? Global Journal of Human-Social Science Research 18: 2249–460. [Google Scholar]
- Sapkota, Kanhaiya. 2018. Seasonal labour migration and livelihood in the middle hill of Nepal: Reflections from arghakhanchi district research. Nepal Journal of Development Studies 1: 42–57. [Google Scholar] [CrossRef]
- Sen, Amartya. 1976. Poverty: An ordinal approach to measurement. Econometrica: Journal of the Econometric Society 44: 219–31. [Google Scholar] [CrossRef]
- Shaw, William. 2007. Migration in Africa: A Review of the Economic Literature on International Migration in 10 Countries. Washington, DC: Development Prospects Group, The World Bank, p. 20433. [Google Scholar]
- Shimeles, Abebe. 2010. Migration Patterns, Trends and Policy Issues in Africa. African Development Bank Working Paper Series No 119; Abidjan: African Development Bank Group. [Google Scholar]
- Siddiqui, Tasneem. 2012. Impact of Migration on Poverty and Development. Migrating out of Poverty Research Programme Consortium Working Paper 2. Brighton: Migrating out of Poverty Research Programme Consortium. [Google Scholar]
- Stark, Oded, and Robert E. B. Lucas. 1988. Migration, Remittances and the Family. Economic Development and Cultural Change 36: 465–81. [Google Scholar] [CrossRef]
- Sunam, Ramesh. 2015. The Significance of Foreign Labour Migration and Land for Poverty Reduction in Nepal. In Poverty Reduction Policies and Practices in Developing Asia. Economic Studies in Inequality, Social Exclusion and Well-Being. Edited by Heshmati Almas, Maasoumi Esfandiar and Wan Guanghua. Singapore: Springer. [Google Scholar]
- Sutcliffe, Bob. 2001. Migration and citizenship. In Migration and Mobility. London: Palgrave Macmillan, pp. 66–82. [Google Scholar]
- Van Ham, Maarten. 2001. Work Place Mobility and Occupational Achievement. International Journal of Population Geography 7: 295–306. [Google Scholar] [CrossRef]
- World Bank. 2009. Economic Implications of Remittances and Migration. Washington, DC: World Bank, 182p, ISBN 0-8213-6334-1. [Google Scholar]
- World Bank. 2019. Moving for Prosperity: Global Migration and Labor Markets. Available online: https://www.worldbank.org/en/research/publication/moving-for-prosperity (accessed on 22 April 2019).
- Young, Alwyn. 2013. Inequality, the rural–urban gap and migration. Quarterly Journal of Economics 128: 1727–85. [Google Scholar] [CrossRef]
| 1 | The exchange rate in 2009 was ₦147 to $1. |
Figure 1.
Distribution of propensity scores and common support region.
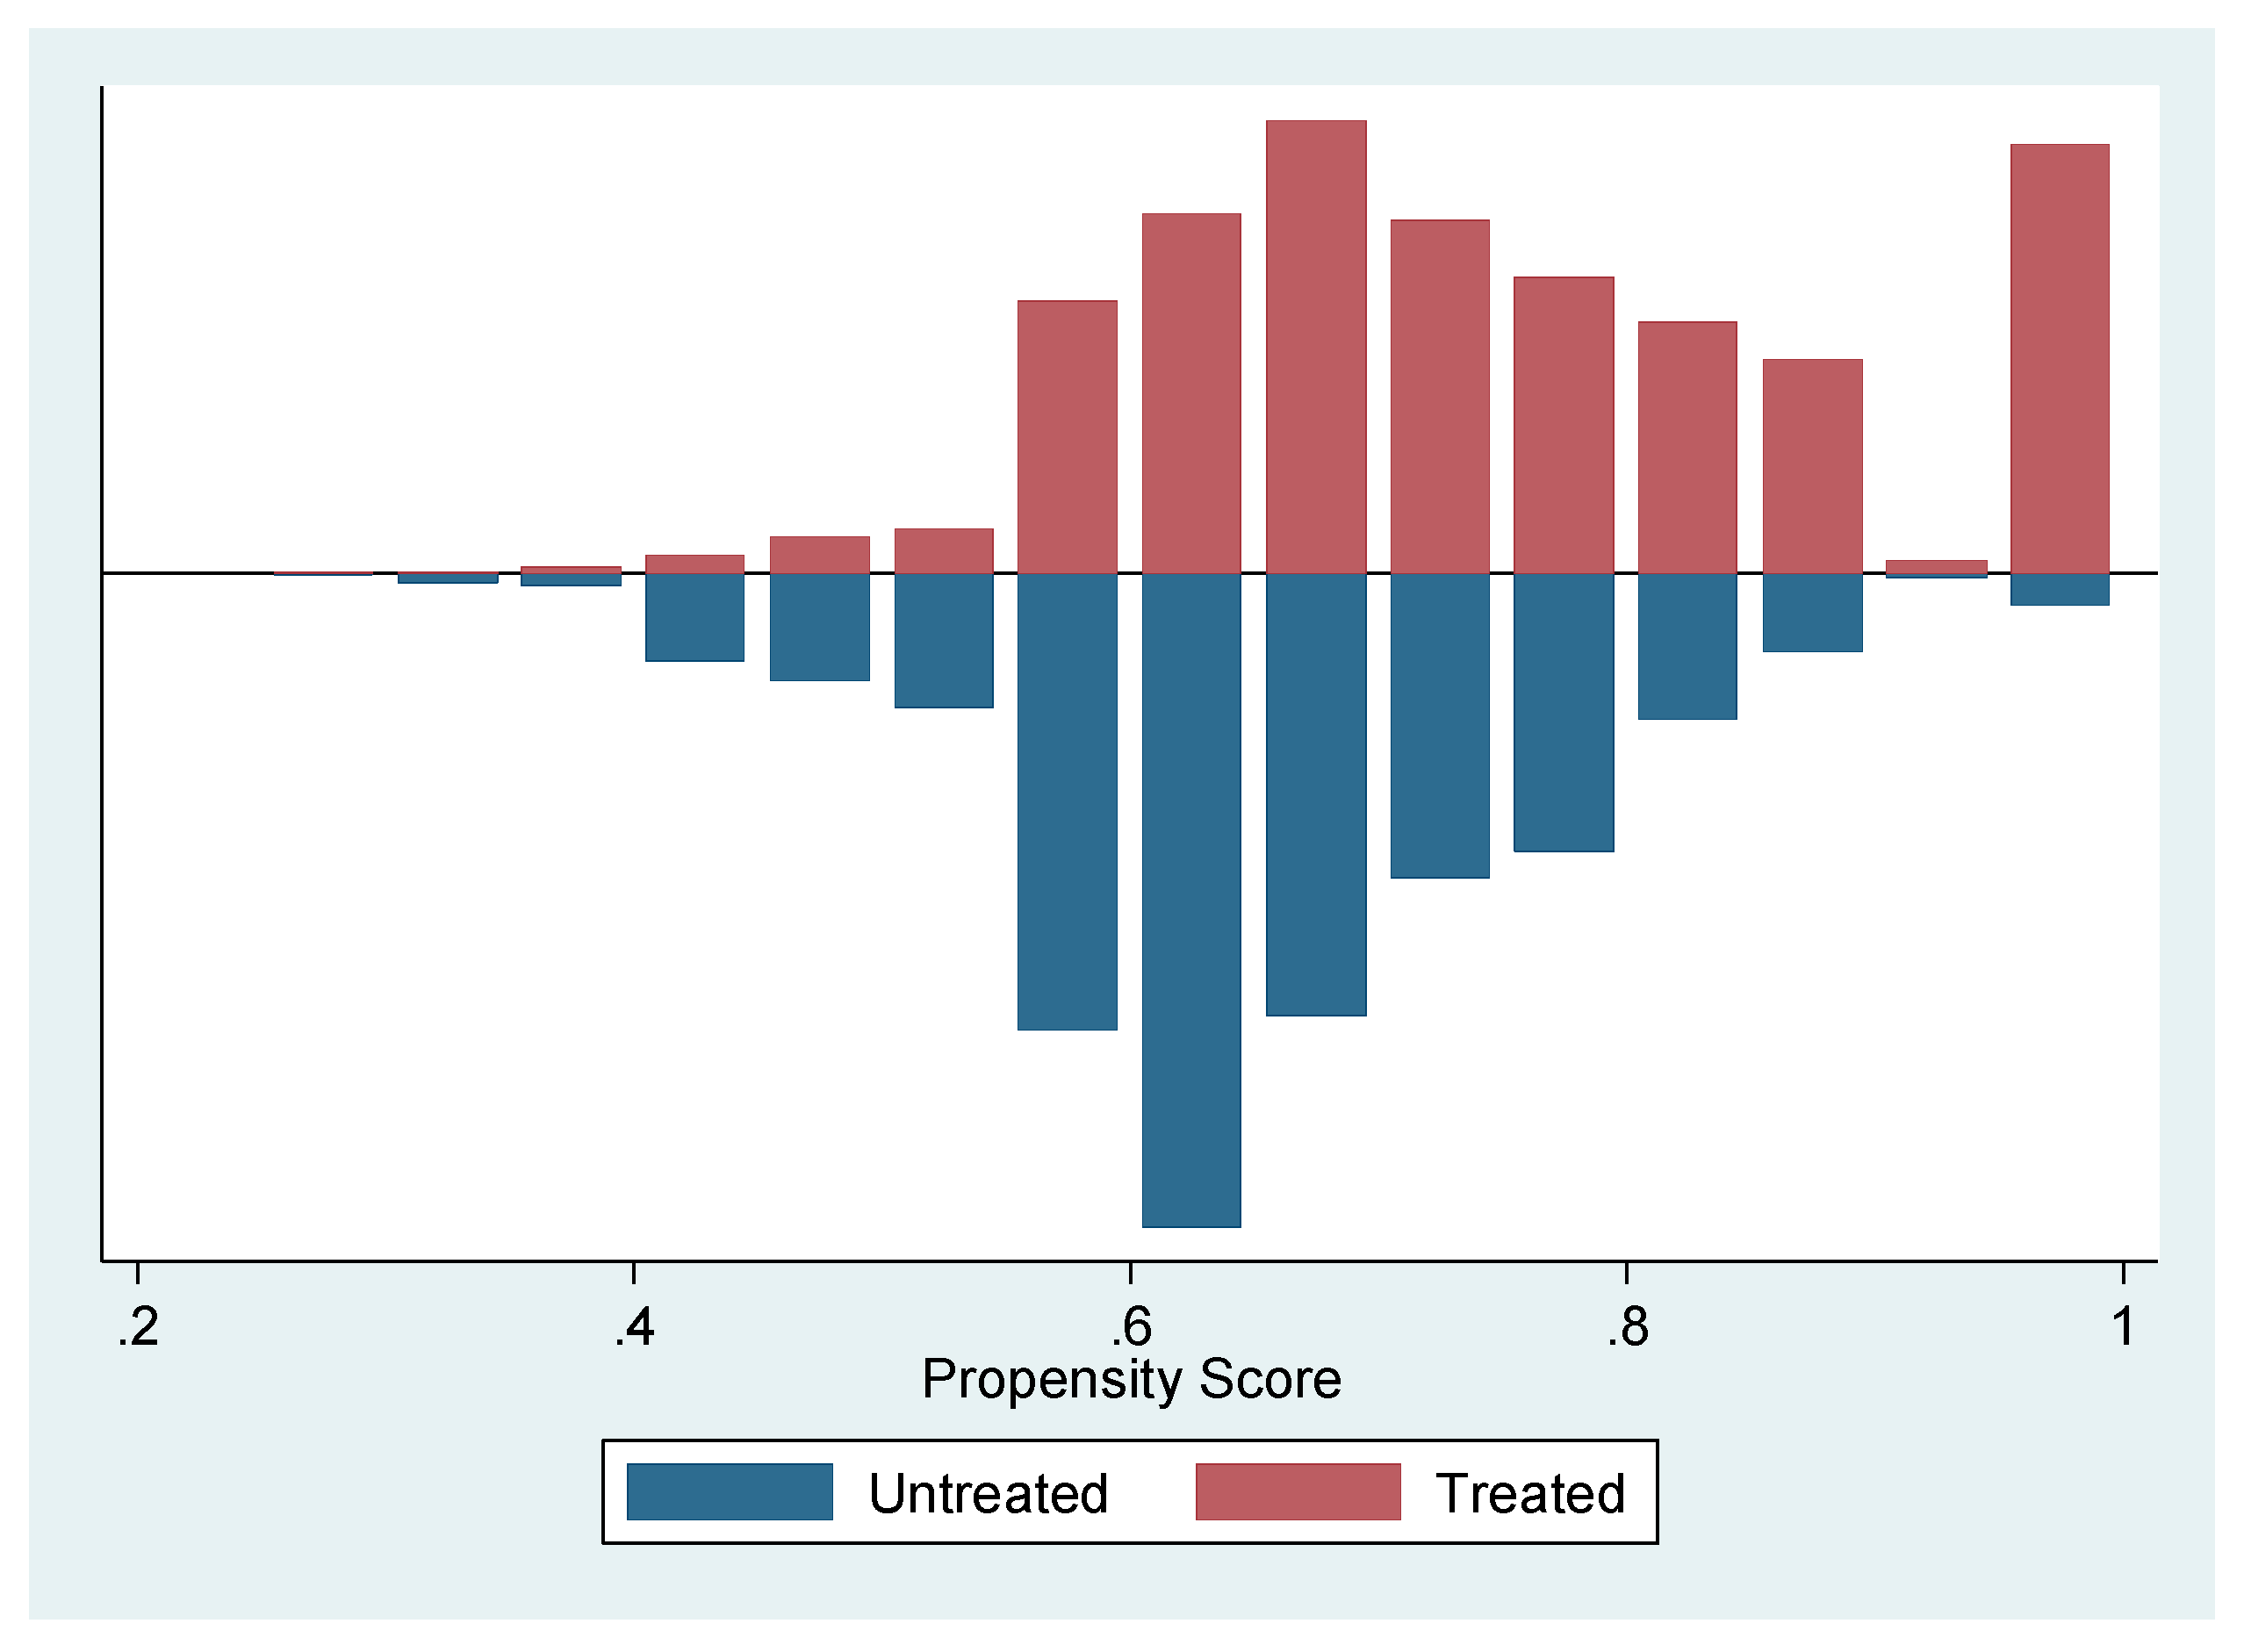
Table 1.
Descriptive Statistics of selected variables.
| Variables | Definition of Variables | Pooled | Male Migrant | Female Migrant | |||
|---|---|---|---|---|---|---|---|
| Mean | Std.De | Mean | Std.Dev. | Mean | Std.Dev. | ||
| region_dummy | 1 = if household is from the Southern part of Nigeria, 0 otherwise | 0.872 | 0.334 | 0.864 | 0.343 | 0.894 | 0.308 |
| rural | 1 if household is from the rural, 0 otherwise | 0.479 | 0.5 | 0.493 | 0.5 | 0.439 | 0.497 |
| Age_HH | Age of the household head in numbers | 52.066 | 13.599 | 52.567 | 13.89 | 50.626 | 12.635 |
| Sex_HH | 1 if household head is male, 0 otherwise | 0.836 | 0.37 | 0.831 | 0.375 | 0.851 | 0.357 |
| schoolingy~s | Number of years of schooling of the household head | 9.442 | 5.904 | 9.331 | 6.007 | 9.759 | 5.594 |
| noinhh | Number of the people in the household | 5.706 | 3.108 | 5.676 | 3.17 | 5.791 | 2.922 |
| occupation_~d | Occupation of the household head: 1 if farming, 0 otherwise | 0.183 | 0.387 | 0.206 | 0.404 | 0.119 | 0.325 |
| agricland | 1 if household owns agricultural land, 0 otherwise | 0.65 | 0.477 | 0.671 | 0.47 | 0.591 | 0.492 |
| nonagricland | 1 if household owns non-agricultural land, 0 otherwise | 0.404 | 0.491 | 0.413 | 0.493 | 0.379 | 0.486 |
| Sex_mig | Sex of the migrants: 1 if migrant is male, 0 otherwise | 0.742 | 0.438 | ||||
| Age_mig | Age of the migrant in completed years | 29.842 | 11.129 | 30.726 | 10.817 | 27.301 | 11.626 |
| Schoolyrsb~g | Number of years of schooling completed by migrant | 12.463 | 3.61 | 12.522 | 3.748 | 12.295 | 3.18 |
| married | 1 if migrant is married, 0 if otherwise | 0.467 | 0.499 | 0.447 | 0.497 | 0.526 | 0.5 |
| occupation_~g | Occupation of the migrant before migration: 1 if farming, 0 otherwise | 0.193 | 0.395 | 0.2 | 0.4 | 0.173 | 0.379 |
| radio | 1 if migrant owns radio, 0 otherwise | 0.908 | 0.29 | 0.897 | 0.304 | 0.938 | 0.242 |
| tv | 1 if migrant owns television, 0 otherwise | 0.81 | 0.392 | 0.802 | 0.399 | 0.835 | 0.372 |
| mobilephone | 1 if migrant owns mobile phone, 0 otherwise | 0.867 | 0.34 | 0.86 | 0.347 | 0.886 | 0.318 |
| mob | 1 if migrant is employed in the new destination, 0 otherwise | 0.684 | 0.465 | 0.724 | 0.447 | 0.569 | 0.496 |
| int_migrat~n | 1 if migration of migrant is international, 0 otherwise | 0.401 | 0.49 | 0.422 | 0.494 | 0.341 | 0.475 |
| poverty_cl~s | 1 if household is poor, 0 otherwise | 0.67 | 0.47 | 0.671 | 0.47 | 0.669 | 0.471 |
| PCE | Per capita expenditure in naira equivalent (₦) | 58,569.27 | 132,000 | 60,481.53 | 141,000 | 53,076.05 | 99,389.42 |
| rem_inco | Remittance received by the household in naira equivalent (₦) | 130,000 | 757,000 | 154,000 | 870,000 | 62,377.51 | 209,000 |
Table 2.
Reasons for migrating based on gender.
| Reason for Leaving | Pooled | Male Migrants | Female Migrants | |||
|---|---|---|---|---|---|---|
| Freq | % | Freq | % | Freq | % | |
| Education | 378 | 26.90 | 290 | 27.86 | 88 | 24.18 |
| Search for work | 410 | 29.18 | 359 | 34.49 | 51 | 14.01 |
| Job transfer/Job opportunity | 327 | 23.27 | 287 | 27.57 | 40 | 10.99 |
| Marriage arrangement | 168 | 11.96 | 27 | 2.59 | 141 | 38.74 |
| Move to join other family members | 46 | 3.27 | 29 | 2.79 | 17 | 4.67 |
| Return to original or previous home | 26 | 1.85 | 17 | 1.63 | 9 | 2.47 |
| Family problems | 17 | 1.21 | 10 | 0.96 | 7 | 1.92 |
| Others | 33 | 2.38 | 22 | 2.11 | 11 | 3.02 |
| Total | 1405 | 1041 | 364 | |||
Source: Author’s computation from (World Bank 2009) household surveys (Remittance and migration).
Table 3.
Geographical mobility of labour and type of employment.
| Variables | Pooled | Male | Female | |||
|---|---|---|---|---|---|---|
| N = 1405 | N= 1041 | N = 364 | ||||
| Freq. | % | Freq. | % | Freq. | % | |
| Work situation before migration | ||||||
| Working | 565 | 40.21 | 424 | 40.73 | 141 | 38.74 |
| Not working | 840 | 59.79 | 617 | 59.27 | 223 | 61.26 |
| Work situation after migration | ||||||
| Working | 993 | 70.68 | 773 | 74.26 | 220 | 60.44 |
| Not Working | 412 | 29.32 | 268 | 25.74 | 144 | 39.56 |
| Geographical labour mobility | ||||||
| Yes (working before and after migration) | 532 | 37.86 | 405 | 38.90 | 127 | 34.89 |
| Yes (working only after migration) | 461 | 32.82 | 368 | 35.36 | 93 | 25.55 |
| No (Not working after migration) | 412 | 29.32 | 268 | 25.74 | 144 | 39.56 |
| Type of employment | ||||||
| Migrants working before and after migration | N = 532 | N = 405 | N = 127 | |||
| Before migration | Freq. | % | Freq. | % | Freq. | % |
| Paid employment–full-time | 226 | 42.48 | 169 | 41.73 | 57 | 44.88 |
| Paid employment–part-time | 47 | 8.83 | 36 | 8.89 | 11 | 8.66 |
| Self-employment (full-/part-time) | 253 | 47.56 | 196 | 48.40 | 57 | 44.88 |
| Military service | 6 | 1.13 | 4 | 0.99 | 2 | 1.57 |
| After migration | ||||||
| Paid employment–full-time | 285 | 53.57 | 224 | 55.31 | 61 | 48.03 |
| Paid employment–part-time | 26 | 4.88 | 19 | 4.69 | 7 | 5.51 |
| Self-employment (full-/part-time) | 216 | 40.60 | 159 | 39.26 | 57 | 44.88 |
| Military service | 5 | 0.95 | 3 | 0.74 | 2 | 1.57 |
| Migrants working only after migration | N = 461 | N = 368 | N = 93 | |||
| Paid employment–full-time | 293 | 63.56 | 224 | 60.87 | 69 | 74.19 |
| Paid employment–part-time | 39 | 8.46 | 29 | 7.88 | 10 | 10.75 |
| Self-employment (full-/part-time) | 126 | 27.33 | 112 | 30.43 | 14 | 15.05 |
| Military service | 3 | 0.65 | 3 | 0.82 | - | |
Source: Author’s computation from (World Bank 2009) household surveys (Remittance and migration).
Table 4.
Determinants of labour mobility.
| Dependent Variable: Labour Mobility (1/0) | |||
|---|---|---|---|
| Variables | (1) | (2) | (3) |
| Pooled Households | Male-Migrant Households | Female-Migrant Households | |
| region_dummy(South) | 0.259 *** | 0.166 ** | 0.506 *** |
| (0.0679) | (0.0696) | (0.0996) | |
| Urban | 0.152 *** | 0.216 *** | 0.096 *** |
| (0.0304) | (0.0294) | (0.0034) | |
| Age_HH | −0.103 *** | −0.105 *** | 0.00121 |
| (0.00125) | (0.00120) | (0.00308) | |
| Sex_HH | 0.0462 | 0.0633 | 0.0308 |
| (0.0411) | (0.0420) | (0.0940) | |
| Schoolingyears_HH | 0.418 *** | 0.407 *** | 0.596 *** |
| (0.00290) | (0.00274) | (0.00787) | |
| occuption_head | −0.697 *** | −0.239 *** | 0.00693 |
| (0.0401) | (0.0405) | (0.108) | |
| noinhh | −0.00151 | 0.00240 | −0.0128 |
| (0.00502) | (0.00489) | (0.0144) | |
| agricland | −0.465 *** | −0.266 *** | −0.114 *** |
| (0.0312) | (0.0302) | (0.0719) | |
| nonagricland | 0.0654 ** | −0.0239 | 0.179 *** |
| (0.0275) | (0.0256) | (0.0674) | |
| Age_migrant | 0.0138 *** | 0.139 *** | 0.0112 *** |
| (0.00235) | (0.00211) | (0.00402) | |
| Sex_migrant(male) | 0.180 *** | ||
| (0.0357) | |||
| Schoolyrs_migrant | 0.0156 *** | 0.677 * | 0.0382 *** |
| (0.00408) | (0.00387) | (0.0110) | |
| Married_migrant | 0.276 *** | 0.262 *** | 0.280 *** |
| (0.0303) | (0.0294) | (0.0636) | |
| radio | −0.0356 | −0.0165 | −0.0559 |
| (0.0432) | (0.0435) | (0.129) | |
| tv | 0.0678 * | 0.0790 ** | 0.0333 |
| (0.0411) | (0.0363) | (0.122) | |
| mobilephone | 0.398 *** | 0.181 *** | 0.191 *** |
| (0.0506) | (0.0477) | (0.0145) | |
| cartruck | 0.0112 | 0.0124 | −0.00214 |
| (0.0315) | (0.0301) | (0.0749) | |
| ln_pce | 0.0264 ** | 0.0278 ** | 0.0158 |
| (0.0120) | (0.0126) | (0.0254) | |
Standard errors in parentheses (*** p < 0.01, ** p < 0.05, * p < 0.1). Source: Author’s computation from (World Bank 2009) household surveys (Remittance and migration).
Table 5.
Remittance, labour mobility and gender.
| Pooled | Male | Female | t-Test | |
|---|---|---|---|---|
| Migrants sent remittance (year) | ||||
| Both working and non-working | n = 1405 | n = 1041 | n = 364 | |
| Yes (%) | 50.75 | 54.76 | 39.29 | - |
| Migrants working before and after migration | n = 532 | n = 405 | n = 127 | |
| Yes (%) | 65.41 | 70.12 | 50.39 | - |
| Migrants working only after migration | n = 461 | n = 368 | n = 93 | |
| Yes (%) | 66.59 | 69.02 | 56.99 | - |
| Migrants not working | n = 412 | n = 268 | n = 144 | |
| Yes (%) | 14.08 | 18.06 | 11.94 | - |
| Average sum of remittance sent | ₦ | ₦ | ₦ | |
| Both working and non-working (year) | 223,568.10 | 245,871.80 | 134,665.40 | 2.28 ** |
| Migrants working before and after migration | 231,352.70 | 321,975.70 | 154,736.70 | 2.19 ** |
| Migrants working only after migration | 163,491.20 | 165,345.70 | 154,603.80 | 0.14 |
| Migrants not working | 135,655.20 | 209,625.00 | 44,615.38 | 1.06 |
Standard errors in parentheses (** p < 0.05). Source: Author’s computation from (World Bank 2009) household surveys (Remittance and migration).
Table 6.
Propensity score matching quality test.
| Sample | Ps R2 | LR chi2 | P > chi2 | MeanBias | MedBias |
|---|---|---|---|---|---|
| Before matching | 0.245 | 437.60 | 0.000 | 26.9 | 18.8 |
| After matching | 0.033 | 89.26 | 0.600 | 8.6 | 7.9 |
Table 7.
Average Impact Estimates of Propensity Score Matching of labour mobility on amount of remittance sent home by migrants.
Table 7.
Average Impact Estimates of Propensity Score Matching of labour mobility on amount of remittance sent home by migrants.
| Variable | Sample | Treated | Control | Difference | t-Stat |
|---|---|---|---|---|---|
| Pooled | |||||
| PCE{remittance} | Unmatched | 291,219.11 | 159,067.95 | 132,151.16 | 1.95 |
| ATT | 291,219.11 | 100,666.38 | 190,552.73 | 2.69 ** | |
| ATU | 159,067.95 | 216,473.43 | 57,405.48 | ||
| ATE | 122,391.79 | ||||
| Male | |||||
| PCE{remittance} | Unmatched | 321,975.70 | 170,300.00 | 151,675.70 | 1.81 |
| ATT | 321,975.70 | 81,245.78 | 240,729.93 | 3.25 *** | |
| ATU | 170,300.00 | 127,047.55 | −43,252.45 | ||
| ATE | 98,240.53 | ||||
| Female | |||||
| PCE{remittance} | Unmatched | 154,736.72 | 118,405.06 | 36,331.66 | 0.73 |
| ATT | 154,736.72 | 59,234.37 | 95,502.34 | 2.28 *** | |
| ATU | 118,405.06 | 425,769.62 | 307,364.56 | ||
| ATE | 212,545.11 |
*** p < 0.01, ** p < 0.05. Source: Author’s computation from (World Bank 2009) household surveys (Remittance and migration). Mahalanobis.
Table 8.
Impact of Labour Mobility on Remittances: Endogenous Treatment Effects.
| (1) | (2) | (3) | |
|---|---|---|---|
| ATT | Pooled Households | Male Households | Female Households |
| 1.mob | 223,667 *** | 257,850 ** | 88,901 * |
| (84,335) | (115,658) | (46,988) |
Standard errors in parentheses; *** p < 0.01, ** p < 0.05, * p < 0.1.
Table 9.
Level of poverty among household with mobile and non-mobile labour.
| Pooled | Males | Females | ||||
|---|---|---|---|---|---|---|
| Freq. | % | Freq. | % | Freq. | % | |
| Poor households | 759 | 54.95 | 559 | 53.70 | 200 | 54.95 |
| Non-poor households | 646 | 45.98 | 482 | 46.30 | 164 | 45.05 |
| Poor households with migrants working before and after migration | 275 | 51.96 | 203 | 50.12 | 72 | 56.69 |
| Non-poor households with migrants working before and after migration | 257 | 48.31 | 202 | 49.88 | 55 | 43.31 |
| Poor households with migrants working only after migration | 268 | 58.13 | 231 | 60.31 | 214 | 58.15 |
| Non-poor households with migrants working only after migration | 193 | 41.87 | 152 | 39.69 | 154 | 41.85 |
| Poor households with migrants not working | 216 | 52.43 | 142 | 52.99 | 74 | 51.39 |
| Non-poor households with migrants not working | 196 | 47.57 | 126 | 47.01 | 70 | 48.61 |
Source: Author’s computation from (World Bank 2009) household surveys (Remittance and migration).
Table 10.
Average Impact Estimates of Propensity Score Matching of labour mobility on poverty status of households.
Table 10.
Average Impact Estimates of Propensity Score Matching of labour mobility on poverty status of households.
| Variable | Sample | Treated | Control | Difference | t-Stat |
|---|---|---|---|---|---|
| Pooled | |||||
| PCE{remittance} | Unmatched | 0.506 | 0.584 | −0.078 | −2.09 |
| ATT | 0.506 | 0.727 | −0.221 | −2.06 ** | |
| ATU | 0.584 | 0.271 | −0.312 | ||
| ATE | −0.268 | ||||
| Male | |||||
| PCE{remittance} | Unmatched | 0.504 | 0.580 | −0.077 | −1.84 |
| ATT | 0.504 | 0.704 | −0.201 | −1.79 * | |
| ATU | 0.580 | 0.608 | 0.028 | ||
| ATE | −0.086 | ||||
| Female | |||||
| PCE{remittance} | Unmatched | 0.516 | 0.595 | −0.079 | −0.95 |
| ATT | 0.516 | 0.703 | −0.188 | −1.05 | |
| ATU | 0.595 | 0.367 | −0.228 | ||
| ATE | −0.209 |
** p < 0.05; * p < 0.1. Source: Author’s computation from World Bank 2009 household surveys (Remittance and migration). Mahalanobis.
Table 11.
Impact of Labour Mobility on Poverty: Endogenous Treatment Effects.
| Variables | (1) | (2) | (3) |
|---|---|---|---|
| Pooled Households | Male Households | Female Households | |
| 1.mob | −0.287 *** | −0.395 *** | 0.219 |
| (0.110) | (0.105) | (0.227) |
Robust standard errors in parentheses; *** p < 0.01.
© 2019 by the authors. Licensee MDPI, Basel, Switzerland. This article is an open access article distributed under the terms and conditions of the Creative Commons Attribution (CC BY) license (http://creativecommons.org/licenses/by/4.0/).
Share and Cite
MDPI and ACS Style
Rufai, M.; Ogunniyi, A.; Salman, K.K.; Oyeyemi, M.; Salawu, M. Migration, Labor Mobility and Household Poverty in Nigeria: A Gender Analysis. Economies 2019, 7, 101. https://doi.org/10.3390/economies7040101
AMA Style
Rufai M, Ogunniyi A, Salman KK, Oyeyemi M, Salawu M. Migration, Labor Mobility and Household Poverty in Nigeria: A Gender Analysis. Economies. 2019; 7(4):101. https://doi.org/10.3390/economies7040101
Chicago/Turabian StyleRufai, Mistura, Adebayo Ogunniyi, Kabir Kayode Salman, Motunrayo Oyeyemi, and Mutiat Salawu. 2019. "Migration, Labor Mobility and Household Poverty in Nigeria: A Gender Analysis" Economies 7, no. 4: 101. https://doi.org/10.3390/economies7040101
Note that from the first issue of 2016, this journal uses article numbers instead of page numbers. See further details here.