A Nonparametric Evaluation of the Optimality of German Export and Import Growth Forecasts under Flexible Loss


Department of Economics, Helmut Schmidt University, Holstenhofweg 85, 22043 Hamburg, Germany
Economies 2019, 7(3), 93; https://doi.org/10.3390/economies7030093
Submission received: 28 June 2019
/
Revised: 4 September 2019
/
Accepted: 5 September 2019
/
Published: 9 September 2019
Abstract
:This study contributes to research on the nonparametric evaluation of German trade forecasts. To this end, I compute random classification and regression forests to analyze the optimality of annual German export and import growth forecasts from 1970 to 2017. A forecast is considered as optimal if a set of predictors, which models the information set of a forecaster at the time of forecast formation, has no explanatory power for the corresponding (sign of the) forecast error. I analyze trade forecasts of four major German economic research institutes, a collaboration of German economic research institutes, and one international forecaster. For trade forecasts with a horizon of half-a-year, I cannot reject forecast optimality for all but one forecaster. In the case of a forecast horizon of one year, forecast optimality is rejected in more cases if the underlying loss function is assumed to be quadratic. Allowing for a flexible loss function results in more favorable assessment of forecast optimality.
Keywords:
trade forecasts; German economic research institutes; forecast optimality; flexible loss; random forestsJEL Classification:
C53; F17; F471. Introduction
As one of the world’s main exporters, Germany’s trade policy has received much attention in recent years. Professional forecasts play a crucial role in this context, as economic agents rely on such forecasts, when shaping economic expectations (Carroll 2003). In order to make accurate policy and investment decisions, it is, therefore, necessary to correctly predict trade developments, as these dynamics greatly influence output growth and price levels through inflationary pressures from import prices (D’Agostino et al. 2017). Additionally, optimal trade forecasts are an essential part of GDP forecasts as macroeconomic forecasters tend to implement a so-called disaggregated approach when forming such forecast. In that case, economic research institutes individually predict all components of the GDP and combine these predictions to a forecast of total output (see, among others, (Angelini et al. 2010; Heinisch and Scheufele 2018) for a comparison of direct and disaggregated forecasting approaches). Research on predictions of single GDP components mostly focuses on forecasts of private consumption (see, for instance, Vosen and Schmidt 2011). In the case of trade developments, a study by Ito (1990) reports behavioral biases of importers and exporters when forming expectations about exchange rate changes, hinting that also macroeconomic trade forecasts might not be optimal.
Even though trade developments play a prominent role in the formation of macroeconomic forecasts, their evaluation has not been extensively studied. The focus of the research on trade forecasts lies on their formation. Here, studies either implement structural models of economic environments and simulate trade dynamics (Hervé et al. 2011; Riad et al. 2012) or other authors aim at optimizing the forecasting performance of time series models (Frale et al. 2010; Jakaitiene and Dées 2012; Keck et al. 2009; Yu et al. 2008). Studying German trade is especially interesting because of the country’s dependence on exports and its large trade surplus, which has been at the center of public attention in recent years. However, studies analyzing German trade forecasts are scarce. The existing studies concentrate on forecasting a single trade aggregate, i.e., German exports (Elstner et al. 2013; Grossmann and Scheufele 2019; Jannsen and Richter 2012), or imports (Grimme et al. 2019; Hetemäki and Mikkola 2005). However, despite the fact that suboptimal trade forecasts can potentially be costly if, for instance, a protectionist trade policy is pursued due to such forecasts, the evaluation of trade forecasts has not received much attention.
The research on macroeconomic forecasts published by German economic research institutes has a long tradition in the scientific community with early analyses by Neumann and Buscher (1980) and Kirchgässner (1984). Today, the research topics in this field are manifold, including studies on forecast revisions (Kirchgässner and Müller 2006), forecast accuracy (Heilemann and Stekler 2013), external assumptions of forecasts (Engelke et al. 2019), forecaster rankings (Kirchgässner 1993; Sinclair et al. 2016), or the economic value of forecasts (Döpke et al. 2018). Most of these studies focus on the analysis of GDP and inflation forecasts by means of panel-based models (Döpke and Fritsche 2006; Müller et al. 2019) or time series models (Kirchgässner and Savioz 2001). A fairly novel approach introduced by Behrens et al. (2018b, 2018a) utilizes nonparametric tree-based models to analyze German GDP growth and inflation forecasts. Behrens (2019) has recently adapted this nonparametric approach to an analysis of the joint efficiency of German trade forecasts in a multivariate setting under quadratic loss. I extend this branch of research by analyzing the optimality of German export growth and import growth forecasts under both quadratic and flexible loss.
To this end, I build on research by Elliott et al. (2005, 2008), who study optimal forecasts under asymmetric loss. The seminal work in this field by Granger (1969), Varian (1974), and Zellner (1986) as well as early applications (Christoffersen and Diebold 1996, 1997) have recently been applied in several fields such as financial forecasting (Aretz et al. 2011; Fritsche et al. 2015), fiscal forecasting (Artis and Marcellino 2001; Elliott et al. 2005), central banking (e.g., Capistrán 2008; Pierdzioch et al. 2016a), as well as GDP and inflation forecasting (Christodoulakis and Mamatzakis 2008; Pierdzioch et al. 2016b; Sun et al. 2018). The basic assumption in this field of research is an asymmetric loss function. In other words, researchers assume that a forecaster’s loss function is not symmetric, which allows for the possibility that forecasters prefer, e.g., underestimating economic growth over overestimating. A possible scenario could be that forecasters fear unfavorable media coverage in the case of an unforeseen recession, whereas an upward correction of the forecast in economically good times might not have such ramifications. In case of trade forecasts, especially in the case of Germany, a motivation for forecasters to prefer underestimating export growth over overestimating, might be the recently increasing protectionist tendencies in international trade (see, among others, Durusoy et al. 2015; Park 2018; Pelagidis 2018). An inflated export growth forecast for Germany could add into the spirit of protectionism of some of its trading partners. Patton and Timmermann (2007), for instance, find for GDP forecasts that, in times of low economic growth, overpredictions of output growth are costlier to the Federal Reserve Bank than underpredictions. The authors introduce the concept of a flexible loss function. The advantage of this concept is that no restrictions need to be imposed on the forecasters loss function; however, as a trade-off, restrictions need to be imposed on the data-generating process (for details on the concept of flexible loss and its implementation, see Section 2). When analyzing the optimality of forecasts, it can be crucial to consider a flexible loss function as results can be misleading if a researcher assumes a certain type of loss function, which, in fact, is misspecified Pierdzioch and Rülke (2013). I, therefore, extend the Behrens et al. (2018c) approach to testing forecast optimality by estimating random regression forests with a quadratic, i.e., symmetric, loss function as well as random classification forests with a flexible loss function to analyze whether or not German trade forecasts are best described by a symmetric loss function. Tree-based models are powerful nonparametric modeling instruments, for which no model specifications regarding the linkage of predictor and response variables need to be imposed a priori and that can deal with datasets with a small number of observations relative to the number of predictor variables. I study export and import growth forecasts for Germany from 1970 to 2017 formed by four major German economic research institutes, a collaboration of German economic research institutes, and an international forecaster.
2. The Model
In their study of the Federal Reserve’s economic growth forecasts, Patton and Timmermann (2007) introduce a method to analyze the optimality of a forecast when the type of a forecaster’s loss function is unknown. This concept of a flexible loss function requires a trade-off regarding the underlying data generating process. That is, if (a) the loss function depends only on the forecast error and the data generating process only has dynamics in the conditional mean, or (b) the loss function is homogeneous in the forecast error and the data generating process has dynamics in the conditional mean and variance, a forecast is considered as optimal if the sequence, , is independent of the forecaster’s information set at the time of forecast formation (see proposition 3, Patton and Timmermann 2007, pp. 1175f). Here, is an indicator function and denotes a forecast error. Given the data at hand (see Section 3 for details), there are no issues regarding dynamics of higher-order moments, as the analyzed forecasts are only available midyear and at the turn of a given year. Patton and Timmermann (2007) further show that forecast optimality can, hence, be tested by estimating a logit or probit model of the form:
where is a matrix containing a forecaster’s information set in period of time t, denotes a vector of coefficients, and is an error term. A forecast is considered as optimal if the null hypothesis, which states that the set of predictors does not have predictive value for the sign of the forecast error, i.e., , cannot be rejected.
However, such a linear approach to testing forecast optimality runs into problems if, for instance, the number of observed forecast errors is relatively small, such that a large set of predictors causes a problem regarding the degrees of freedom of the model. In this case, one could reduce the number of predictors, which are contained in . However, choosing the omitted predictors is arbitrary at least to some degree. Another problem arises when modeling the link between the sign of the forecast error and the predictor variables. A priori, the researcher needs to define the nature of said link, i.e., if it is, for instance, linear, quadratic, or cubic. Furthermore, the predictor variables can be interdependent, such that this relationship also needs to enter the predefined estimation equation. When using a linear approach to testing forecast optimality, there are several sources of possible model misspecifications, which in turn result in biased results. I follow Behrens et al. (2018c), who propose a nonparametric tree-based model, implementing the Patton and Timmermann (2007) test of forecast optimality, to overcome these drawbacks. Tree-based models have first been introduced by Breiman et al. (1984) and have an advantage in, loosely speaking, letting the data decide on an appropriate form of the estimated model. No predefined linkages between predictor variables and the response variable or among the predictor variables need to be imposed by the researcher. Behrens et al. (2018c) implement Equation (1) by means of random classification forests, which pool a large number of classification trees, such that forecast optimality under flexible loss can be studied by the following model (for an introduction to random forests, see (Breiman 2001)):
where is a single classification tree. I extend their model by reestimating Equation (2) by means of random regression forests, , in order to analyze forecast optimality of German export and import growth forecasts under quadratic and flexible loss.
Generally speaking, regression trees analyze the effects of predictors on a continuous response variable and classification trees do so on a discrete response variable. Both types of trees work along the same process, as they aim at structuring the feature space, i.e., the space set up by the analyzed n predictors, , into several non-overlapping regions, , in which a simple model is fit (for a comprehensive introduction to tree-based methods, see (James et al. 2015), whose notation I roughly follow, dropping the time index, t, for simplification). These rectangles, or partitions, are generated by recursive, binary splits at the so-called interior nodes of each tree. Figure 1 depicts this tree-building process. An exemplary tree is depicted in the left panel and the respectively divided feature space is shown on the right. The dataset is split into two subsequent regions at each node. The first split occurs at the root of the tree and observations with partitioning predictors less than or equal to cutpoint are sent down the left branch of the tree, where they reach a terminal node and are assigned to region . For observations with partitioning predictors greater than cutpoint , another split occurs at the following node. Here, observations which satisfy , are sent down this node’s left branch and observations with partitioning predictors are sent down the right branch. At each following node, another split occurs with regard to partitioning predictor , such that, at the first subsequent node, observations with partitioning predictors and are assigned to region and those observations with and are assigned to region . At the second subsequent node, i.e., for , observations which satisfy are assigned to region , whereas observations with partitioning predictors greater than cutpoint are assigned to region . The right panel of Figure 1 depicts how a single tree divides the thusly obtained two-dimensional feature space into the respective regions. The same logic of recursive binary splitting can be analogously applied to a multi-dimensional feature space consisting of various predictor variables. Once the whole feature space is divided into regions, the same prediction is made for all observations, which fall into one region. In the case of a regression tree, the prediction is the mean response of all observations, i.e., forecast errors, in said region. For a classification tree, the response is the sign of the forecast error, which is determined by a majority vote of all observations in the respective region.
Regression and classification trees differ in the way of searching for optimal nodes. For both types of trees, a partitioning predictor and a cutpoint are chosen at each node in order to minimize a so-called node impurity measure. For regression trees, the residual sum of squares, , measures node impurity under quadratic loss. For every pair of predictor variables, z, and cutpoints, c, the following equation is minimized:
where denotes the mean forecast error response for observations falling into the left subsequent region of a given node and denotes the mean forecast error response for observations falling into the right subsequent region of said node. In other words, for every possible split, the emerging regions are chosen such that they minimize the RSS of observations which they contain vis-à-vis the mean response of that region.
Analogous to the linear logit/probit Patton and Timmermann (2007) approach to testing forecast optimality, classification trees are a nonparametric way to implement a flexible loss function. Here, node impurity is measured by means of a Gini index, G:
where is the share of positive/negative () forecast errors in the subsequent left/right region of a given node. A small Gini index indicates nude purity, i.e., that a region mostly contains forecast errors with the same sign.
The advantage of this recursive binary splitting process is that no restrictions regarding the linkages of the response variable and the predictor variables or among the predictor variables need to be imposed beforehand. These possibly complex linkages can easily be modeled by regression and classification trees. However, the prediction of a single tree suffers from high variance. Therefore, it is reasonable to combine a large number of trees to a so-called random forest (for an introduction, see Breiman 2001) in order to model the response variable. To this end, it is necessary to use bootstrap resampling to estimate a random regression or classification tree on every bootstrapped dataset (for an introduction to bootstrap resampling, see James et al. 2015). Random trees have the distinct specification that they only use a subset of the set of predictors, . This decorrelates the predictions of the single classification or regression trees and minimizes computation time. For every bootstrapped dataset, two thirds of the data are used to model a classification or regression tree and for the remaining third of the data out of bag predictions are made (for an introduction to out of bag error estimation using tree based models, see Hastie et al. 2009). By means of these out of bag predictions, the predictive performance of a tree can be measured. In the case of a classification problem, predictive performance is measured by the out of bag misclassification rate, whereas, for regression trees, the share of the explained out of bag variance of the forecast errors, which is a pseudo -statistic, serves as a performance metric.
Following Behrens et al. (2018c) and Murphy et al. (2010), I implement permutation tests to measure the statistical significance of the predictive power of a random classification or regression forest. By drawing hundreds of samples without replacement of the forecast errors and estimating random forests on every purely random sample, a benchmark model, which should have no predictive value for the (signs of the) forecast errors, is established. The implied pseudo -statistics and misclassification rates vary by chance. Hence, the respective metrics obtained by means of the original model should, under the null hypothesis of forecast optimality, not perform significantly better than the formerly described metrics obtained by permuting the data. In other words, if trade forecasts are optimal, the pseudo -statistic computed for the original random forest must not exceed, for instance, the 95th percentile of the permuted sampling distribution for random regression forests. On the other hand, for random classification forests, the misclassification error rate of the original model must not be smaller than the 5th percentile of the permuted sampling distribution. In summary, the permutation test is carried out along the following steps:
- Fit a random classification/regression forest on the original data by means of bootstrap resampling and compute the respective out of bag performance metric (misclassification error rate/pseudo -statistic), .
- Fit a random classification/regression forest on the permuted, i.e., randomized, data by drawing a sample without replacement and compute the respective out of bag performance metric, .
- Repeat Step 2 1000 times and average over the respective performance metrics.
- Compute p-value = , where is an indicator function.
The underlying concept is similar to the one of a standard F-test. If the set of predictors has joint predictive power with respect to the sign of the forecast error (classification problem under flexible loss) or the forecast error (regression problem under quadratic loss), the null hypothesis of forecast optimality can be rejected.
3. The Data
I collected data on annual export and import growth forecasts for Germany from 1970 to 2017 by six economic research institutes. Among the forecasters are four German economic research institutes (alphabetical order): Deutsches Institut für Wirtschaftsforschung Berlin (DIW), Hamburgisches Weltwirtschaftsarchiv/-institut (HWWI), ifo Institut für Wirtschaftsforschung Munich (ifo), Institut für Weltwirtschaft Kiel (IfW); a collaboration of German economic research institutes: Gemeinschaftsdiagnose (GD); and the Organisation for Economic Co-operation and Development (OECD). The latter is included as an international forecaster to see if German forecast institutes have a possible advantage because of geographical proximity (see, e.g., Bae et al. 2008; Berger et al. 2009; Malloy 2005). Due to data availability, which varies across forecasters and decades, I focus on annual forecasts with a forecast horizon of one year and half-a-year, which are published at the turn of the year and mid-year, respectively. In order to minimize data revision effects in computing forecast errors, I use initial release data from the German statistical office to measure realized values of export and import growth (see (Statistisches Bundesamt 2018), data taken from “Wirtschaft und Statistik” publications). These realizations for the previous year are published by the German statistical office within the first months of a given year. Forecast errors are computed by subtracting these realized values for export or import growth from the forecast for the respective year (see also, Behrens et al. 2018a):
where denotes the annual forecast formed by forecaster i in year t (1970–2017), h is the forecast horizon (half-a-year, one year), j denotes the forecasted trade aggregate (export growth, import growth), and y denotes the realization of the respective trade aggregate. Shortly after the German reunification (i.e., between 1992 and 1993), the economic research institutes form forecasts for reunified Germany instead of only West-Germany. I, therefore, adapt the corresponding time series for realized export or import growth for each economic research institute.
Table 1 summarizes the descriptive statistics for the forecast errors of all forecasters in the sample. Most observations (N = 48) are available for the longer-term export and import growth forecasts of DIW and GD, whereas HWWI contributes the fewest observations (N = 31) for their shorter-term forecasts. For the majority of forecasters, the mean forecast errors are close to zero. It is, however, striking that the reported mean forecast errors are generally larger than the ones usually obtained in the standard analyses of German inflation and economic growth forecasts (see, among others, Behrens et al. 2018c; Döpke et al. 2017). The relatively high mean trade forecast errors are in line with recent research (Behrens 2019) and can be explained by the fact that exports and imports are among the most volatile GDP components (Döhrn and Schmidt 2011). Regarding the standard deviations, the results are, as one could have anticipated, generally larger for the longer-term forecasts. It is noteworthy that GD’s standard deviation is the highest for all but one forecasting scenario, in which it is second highest. This might be explained by the fact that GD is the only collaboration of forecasters in the sample and hence possible controversies among the participating forecasters regarding economic theory or estimation techniques might arise. However, it also needs to be taken into account that the GD forecasts are published on average two months before the other forecasts, resulting in a longer forecast horizon. In addition, I report coefficients of first-order autocorrelation, which hint at weak efficiency of the trade forecasts, as the coefficients are relatively small (see Section 4 for an in-depth analysis. Finally, the share of negative forecast errors is shown as an indicator of the symmetry of the forecasters’ loss functions. In case of symmetric loss, the -statistic should equal 0.5. For most forecasters, the share of negative forecast errors is close to the 0.5-benchmark.
The predictor variables I use to model a forecaster’s information set at the time of forecast formation are shown in Table 2. Recent studies on trade forecasts (D’Agostino et al. 2017) and their evaluation (Behrens 2019) show that typical trade variables as well as other macroeconomic variables are essential to accurately and efficiently predict future trade developments. My set of predictors, therefore, comprises, in addition to trade variables, several macroeconomic variables.
- As trade variables I include (following Behrens 2019; D’Agostino et al. 2017): Export and import prices for Germany as well as German export and import volumes lagged one year and the German real effective exchange rate as a measure of international price competitiveness (Grimme et al. 2019; Lehmann 2015). I also include lags for the last four periods of the real effective exchange rate for Germany to account for a possible J-curve effect (see e.g., Hacker and Hatemi-J 2004).
- As other macroeconomic variables, I include (following (Behrens et al. 2018b, 2018c, 2019; Döpke et al. 2017), who study German GDP and inflation forecasts): German industrial orders, German consumer and producer price indices, industrial production for Germany, the United States, France, the United Kingdom, Italy, and the Netherlands as leading indicators for Germany’s main trading partners (Guichard and Rusticelli 2011), as well as the oil price, German business tendency surveys for manufacturing (current and future tendency; on macroeconomic survey data as predictors, see (Frale et al. 2010; Lehmann 2015)), finally, I include the OECD leading indicator for Germany as a composite indicator.
Following Behrens et al. (2018a), predictor variables are lagged by one period to account for a publication lag of the forecasts. That is, I assume that a forecast which was published, for instance, in July is formed by means of information available in June. I furthermore account for different publication lags of the predictors based on research by Drechsel and Scheufele (2012). As real time data are not available at a monthly frequency for the examined time period, I minimize data revision effects of the affected variables by means of a backward looking moving-average of order 12 for the CPI, PPI, the real effective exchange rate, industrial productions, orders, and trade variables (following Behrens et al. 2018b; Pesaran and Timmermann 1995), in order to proxy the information set which was available to a forecaster when a given forecast was formed.
4. Empirical Results
The following empirical results were obtained by means of the R programming environment for statistical computing (R Core Team 2019) as well as the add-on packages “randomForest” (Liaw andWiener 2002) for estimating random trees and “rfUtilities” (Murphy et al. 2010; Evans and Murphy 2017) for computing permutation tests. Regarding the hyper-parameters of the random forests, I follow the common approach in the literature in setting the maximum number of terminal nodes of a given tree to five and setting the number of predictors used for growing a random forest to the square root of the total number of predictors (see, e.g., Behrens 2019; Hastie et al. 2009). For robustness checks, I report results for random forests, consisting of 250, 500, and 750 trees. Numbers in bold indicate a significantly (at the 5%-level) smaller out of bag misclassification error (classification problem) or a significantly larger pseudo (regression problem) of the original model compared to the model estimated by means of the permuted data. In other words, cases in which I reject forecast optimality are printed in bold.
The results for the basic specification of the model are reported in Table 3. The null hypothesis of forecast optimality cannot be rejected for DIW for all but one specification (longer-term import growth forecasts under quadratic loss, 750 trees). Regarding HWWI and ifo, the results are very interesting. Assuming a quadratic loss function for the forecasters results in the rejection of forecast optimality for both longer-term export and import growth forecasts, whereas, under flexible loss, forecast optimality cannot be rejected for these forecasts. Here, when evaluating the forecasting performance, the underlying loss function plays a crucial role. For IfW, I reject forecast optimality for their shorter-term export forecasts (500 and 750 trees) for both types of loss function. Forecast optimality for IfW’s longer-term export forecasts and all import forecasts cannot be rejected. The same applies to all trade forecasts of GD under quadratic as well as flexible loss. For OECD, the results are mixed. Under quadratic loss, I reject forecast optimality only for OECD’s longer-term import growth forecasts, whereas, under flexible loss, forecast optimality is rejected only for two cases (250, 750 trees) of their longer-term export growth forecasts. Overall, forecast optimality is rejected in more cases if the underlying loss function is assumed to be quadratic. Allowing for a flexible loss function results in a more favorable assessment of forecast optimality with respect to the forecasters. Additionally, for the forecasters’ shorter-term forecasts, optimality cannot be rejected even under quadratic loss, except for IfW’s export growth forecasts.
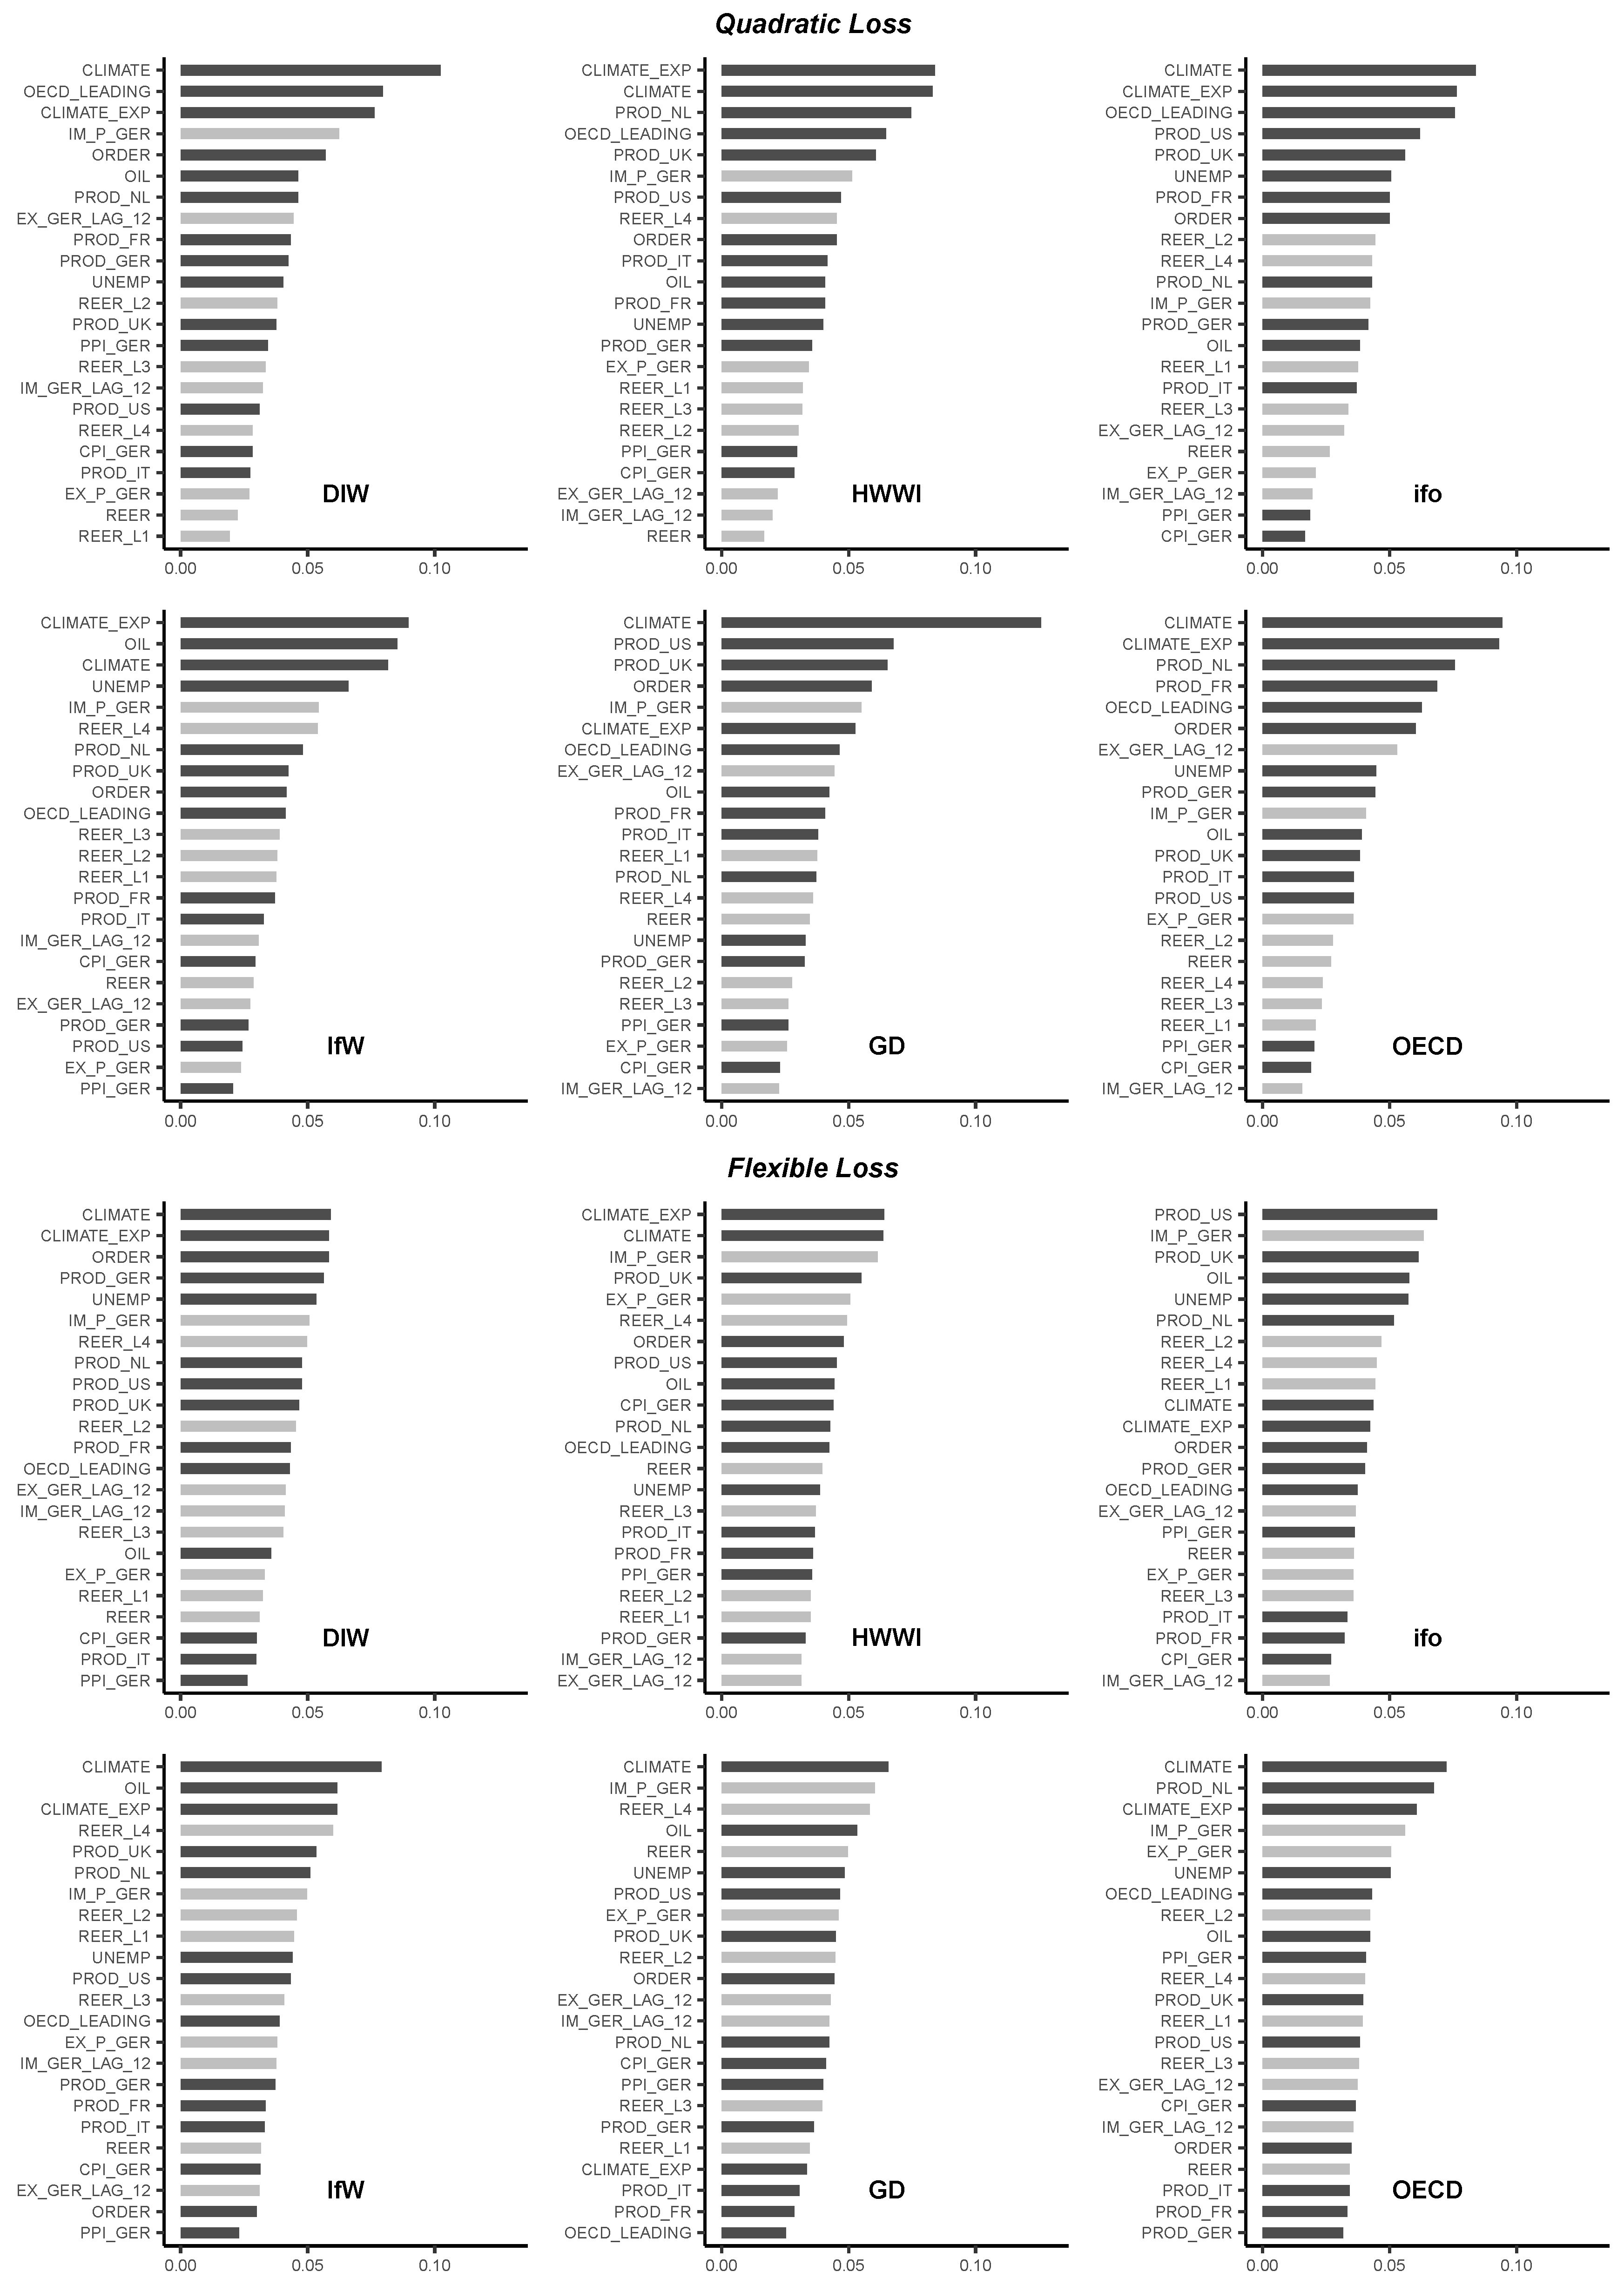
It is interesting to find out which predictors have explanatory power for the (sign of the) forecast error. I, therefore, report variable importance plots for the export growth forecast evaluation in Figure 2 and for the import growth forecast evaluation in Figure 3. Variable importance is computed by counting the times a predictor is chosen as splitting variable in the construction of a regression/classification tree. These measures are summed up over all trees and the share of each predictor as a splitting variable is computed by dividing by the number of trees in a forest, here 750. Hence, a large share indicates that this predictor has explanatory power for the (sign of the) forecast error. It is, therefore, not optimally incorporated into the respective forecast. On the other hand, if the share of a predictor variable is small, the predictor mentioned does not have explanatory power for the (sign of the) forecast error. It is, therefore, either optimally incorporated in the respective forecast or it does not have any explanatory power for the trade forecast. It is striking that, under quadratic loss, macroeconomic predictors other than typical trade aggregates (depicted in dark grey) are among the top splitting variables. In particular, macroeconomic survey indicators, such as the ifo business climate survey, are top splitting variables. Both findings are in line with recent research (Behrens 2019; D’Agostino et al. 2017). For most scenarios, lags of the German real effective exchange rate are among the top trade predictors (depicted in light grey), possibly hinting at a J-curve effect, which is not optimally incorporated in the analyzed trade forecasts. Another interesting observation is that, under flexible loss, the shares of the predictor variables as splitting variables are more evenly distributed. This is possibly due to the fact that the node impurity measure for regression trees (Equation (3)) punishes outliers more severely. Regression trees, therefore, split the feature space more often than classification trees, in order to minimize the effects of outliers on the RSS. Thus, top predictors are chosen as splitting variables multiple times when growing a regression tree and their overall share as splitting variables increases.
As further robustness checks, I report results estimated by means of random forest models with different hyperparameters in Table 4, Table 5 and Table 6. First, the maximum number of terminal nodes per tree is set to ten (Table 4). Second, I halve the number of predictors that are randomly chosen at each node in building a tree and report the results in Table 5. Finally, Table 6 shows results for a scenario in which the minimum number of observations at each terminal node is set to five. There are minor changes in the statistical significance of the permutation tests for most institutes, as can be expected when changing the model’s hyperparameters. For HWWI and ifo, I still observe that forecast optimality is rejected under quadratic loss for their longer-term export and import growth forecasts, whereas, when assuming flexible loss, I cannot reject forecast optimality in these cases. There are two exceptions for HWWI’s forecasts in scenario two—Table 5. For their longer-term import forecast computed with 500 trees and a quadratic loss function, the permutation test yields insignificant results, whereas the p-value for their shorter-term export forecast computed by means of 500 trees under flexible loss becomes significant compared to the basic specification. In scenario one (Table 4), there remains no evidence against the optimality of DIW’s longer-term import forecasts. For GD, the p-value for one of their shorter-term import forecasts under flexible loss (250 trees) becomes significant. The same is true for GD in scenario two (Table 5), in which also the p-value for one of their longer-term import growth forecasts under quadratic loss (750 trees) becomes significant. Overall, however, the main findings from the basic specification do not change qualitatively for all robustness scenarios. An underlying flexible loss function continues to result in more favorable assessments of the trade forecasts with respect to forecast optimality.
Recently, the effects of uncertainty and trade policy uncertainty in particular on the economy and on international trade have been analyzed by several studies (see, among others, Baker et al. 2016; Fernández-Villaverde et al. 2015; Hassan et al. 2017). Caldara et al. (2019) have developed a trade policy uncertainty index, which measures monthly media attention to news related to trade policy uncertainty. Electronic archives of seven leading U.S. newspapers are analyzed by means of automated text-search in order to construct the index (The list of newspapers comprises Boston Globe, Chicago Tribune, Guardian, Los Angeles Times, New York Times, Wall Street Journal, and Washington Post; for the data and further details on the construction of the index, see Caldara et al. (2019)). As U.S. trade policy uncertainty likely affects international as well as German trade, I add the trade policy uncertainty measure by Caldara et al. (2019) as well as a tariff volatility measure by the same authors to the list of predictors to proxy uncertainty regarding international trade and report the results in Table 7 (quarterly tariff volatility is estimated by a stochastic volatility model by Caldara et al. (2019)). The results mostly do not change qualitatively. An exception is IfW, for which shorter-term export growth forecasts under flexible loss are no longer significant. For ifo, the shorter-term import growth forecast under flexible loss computed by means of 250 trees is now significant compared to the basic specification. For the most part, the trade uncertainty measures do not seem to add further explanatory power for the forecast errors.
Next, I check if the forecasters form weakly efficient forecasts, where weak efficiency holds if a forecaster’s current forecast error cannot be explained by its preceding forecast error (see, among others, Behrens et al. 2018c; Öller and Barot 2000; Timmermann 2007). In other words, adding the lagged forecast error to the list of predictors should not lead to more efficient forecasts under the assumption of weak forecast efficiency. The results of the permutation tests reported in Table 8, hence, should not be more significant than in the basic specification. Here, I observe only minor changes for single specifications of DIW, HWWI, and OECD, suggesting that, for all forecasters, the lagged forecast errors do not seem to have further predictive value, such that the forecasts are in line with the concept of weak efficiency.
As one of the world’s largest exporters and due to interwoven transnational production chains, Germany’s exports and imports are interdependent. I, therefore, add each forecaster’s import growth forecast to the list of predictors for their export growth forecast and vice versa, in order to study if the respective trade forecast has predictive value for the other trade forecast and report the results in Table 9. Again, the results do not change qualitatively with respect to the basic specification. There are, however, three exceptions, where insignificant p-values in the basic specification become significant when adding the respective other trade forecast to the forecasters’ information set, namely IfW’s and GD’s import forecasts as well as OECD’s export forecasts all under flexible loss.
Based on work by Andrade and Le Bihan (2013) who find evidence on rational inattention of professional forecasters, I extend the forecasters’ information set by adding the lagged realizations of the predictor variables (see also (Behrens et al. 2018b), for an application to German GDP growth and inflation forecasts). The results presented in Table 10 show only minor changes in the magnitude of the permutation tests’ p-values. For two forecasters, results of one permutation test scenario become significant compared to the basic specification, namely DIW’s longer-term export forecasts (750 trees) and OECD’s shorter-term import forecasts (250 trees) both under quadratic loss. Forecast optimality continues to be rejected in more cases if the underlying loss function is assumed to be quadratic.
Recent research in the forecasting area has focused on possible effects of the 2007/2008 financial crisis on macroeconomic forecasting (see, for instance, Drechsel and Scheufele 2012; Frenkel et al. 2011; Müller et al. 2019). Table 11 reports results for a scenario, in which forecasts from the years 2007 and 2008 are deleted from the sample (I follow Behrens et al. 2018c, in this approach). In doing so, I check whether severe forecast errors made in these years affect the results of the entire sample. However, there are no qualitative changes in the results of the permutation tests. Only for OECD, one specification (250 trees) of their longer-term import growth forecasts under flexible loss, for which I cannot reject forecast optimality in the basic specification, now becomes significant.
In the same vein, I delete forecasts for the years 1992 and 1993 to check for possible biases due to large forecast errors in the time of German reunification (see also (Behrens 2019), the German statistical office changed national accounts statistics from west Germany to reunified Germany in 1992). The results documented in Table 12 are especially interesting for ifo, as forecast optimality for both longer-term trade forecasts under quadratic loss cannot be rejected anymore. This result documents the high volatility of results obtained from a scenario under the assumption of a quadratic loss function.
Finally, I report results for a scenario, in which I pool the data across forecast institutes, in order to enlarge the sample size. However, a disadvantage of this approach is that it is no longer possible to study the heterogeneity of the forecast institutes. Table 13 shows results for a pooled version of the basic specification computed by means of random forests consisting of 500 trees. In this scenario I add dummy variables for each institute to the list of predictors. In case of a classification problem, I report results for an alternative dependent variable, , since it is possible that some forecast errors are exactly equal to zero, as the institutes’ forecasts and the realizations of export and import growth are published as rounded two-digit numbers. I strongly reject forecast optimality for both trade aggregates, forecast horizons, types of loss function, and dependent variables.
5. Conclusions
I build on research by Behrens (2019) on the nonparametric evaluation of German trade forecasts. I extend the Behrens et al. (2018c) nonparametric adaption of the Patton and Timmermann (2007) approach to testing forecast optimality when the forecaster’s loss function is unknown. By means of random forests, I evaluate the optimality of German export growth and import growth forecasts, both under flexible and quadratic loss. To this end, I study annual trade forecasts from 1970 to 2017 published by four major German economic research institutes, one collaboration of German economic research institutes, and one international forecaster. A forecast is considered as optimal if a set of predictors, which models the information set of a forecaster at the time of forecast formation, has no explanatory power of the corresponding forecast error, in case of a regression problem under quadratic loss. For a classification problem, under flexible loss, the set of predictors should not have explanatory power for the sign of the forecast error, if the forecast is optimal.
For all but one forecaster, I cannot reject the optimality of export or import growth forecasts, neither under quadratic nor under flexible loss, at a forecast horizon of half-a-year. For longer-term forecasts, at a forecast horizon of one year, the results are more heterogeneous. For two forecasters, optimality of their longer-term trade forecasts is rejected under quadratic loss, whereas under flexible loss, forecast optimality cannot be rejected for these forecasters. Hence, the loss function plays a crucial role in the evaluation of these forecasters. Overall, an underlying flexible loss function results in a more favorable assessment of the trade forecasts with respect to forecast optimality. This analysis lends support to the study of Behrens (2019), who finds that macroeconomic predictors, other than typical trade aggregates, are not optimally incorporated in multivariate trade forecasts under quadratic loss. Variable importance plots show that, under quadratic loss, top predictors for the (sign of the) forecast error are not typical trade aggregates; however, under flexible loss, this finding cannot be confirmed. For these plots, the shares of predictors as splitting variables are more evenly distributed. Possibly, this is because, under quadratic loss, outliers are punished more severely, which in turn causes regression trees to split the feature space more often. Thus, top predictors are chosen more often as splitting variables than under flexible loss.
It needs to be mentioned that the results computed under flexible loss only hold if the assumptions underlying the Patton and Timmermann (2007) test for forecast optimality are fulfilled. It is, for instance, possible that the forecasters’ loss functions depend on other variables than the forecast error or that the loss functions are not homogeneous in the forecast error. It is, therefore, interesting for future research to see if these results hold for a multivariate analysis of both export and import growth forecasts under flexible loss. A multivariate analysis combining export and import growth forecasts would also be interesting when analyzing forecasts of a country’s trade balance, since this aggregate is often the subject of political debates. Furthermore, the nonparametric application of the Patton and Timmermann (2007) test of forecast optimality, brought forward by Behrens et al. (2018c), could be applied to other macroeconomic forecasts and/or countries.
Funding
This research was funded by the German Research Foundation (Exploring the experience expectation nexus in macroeconomic forecasting using computational text analysis and machine learning; Grant No.: 275693836).
Acknowledgments
I thank Christian Pierdzioch for very valuable and supportive feedback. I thank three anonymous reviewers for helpful and constructive comments. Furthermore, I thank the German Research Foundation for financial support. The usual disclaimer applies.
Conflicts of Interest
The author declares no conflict of interest.
References
- Andrade, Philippe, and Hervé Le Bihan. 2013. Inattentive professional forecasters. Journal of Monetary Economics 60: 967–82. [Google Scholar] [CrossRef]
- Angelini, Elena, Marta Bańbura, and Gerhard Rünstler. 2010. Estimating and forecasting the Euro Area monthly national accounts from a dynamic factor model. OECD Journal: Journal of Business Cycle Management and Analysis 1: 5–26. [Google Scholar] [CrossRef]
- Aretz, Kevin, Söhnke M. Bartram, and Peter F. Pope. 2011. Asymmetric loss functions and the rationality of expected stock returns. International Journal of Forecasting 27: 413–37. [Google Scholar] [CrossRef]
- Artis, Michael, and Massimiliano Marcellino. 2001. Fiscal forecasting: The track record of the IMF and OECD and EC. Econometrics Journal 4: 20–36. [Google Scholar] [CrossRef]
- Bae, Kee-Hong, René M. Stulz, and Hongping Tan. 2008. Do local analysts know more? A cross-country study of the performance of local analysts and foreign analysts. Journal of Financial Economics 88: 581–606. [Google Scholar] [CrossRef] [Green Version]
- Baker, Scott R., Nicholas Bloom, and Steven J. Davis. 2016. Measuring economic policy uncertainty. Quarterly Journal of Economics 131: 1593–636. [Google Scholar] [CrossRef]
- Behrens, Christoph. 2019. Evaluating the Joint Efficiency of German Trade Forecasts—A Nonparametric Multivariate Approach. Working Papers of the Priority Programme 1859, Experience and Expectation. Historical Foundations of Economic Behaviour. No. 9 (March). Berlin: Documentation and Publication Service of the Humboldt University. [Google Scholar]
- Behrens, Christoph, Christian Pierdzioch, and Marian Risse. 2018a. Do German economic research institutes publish efficient growth and inflation forecasts? A Bayesian analysis. Journal of Applied Statistics. forthcoming. [Google Scholar] [CrossRef]
- Behrens, Christoph, Christian Pierdzioch, and Marian Risse. 2018b. A test of the joint efficiency of macroeconomic forecasts using multivariate random forests. Journal of Forecasting 37: 560–72. [Google Scholar] [CrossRef]
- Behrens, Christoph, Christian Pierdzioch, and Marian Risse. 2018c. Testing the optimality of inflation forecasts under flexible loss with random forests. Economic Modelling 72: 270–77. [Google Scholar] [CrossRef]
- Berger, Helge, Michael Ehrmann, and Marcel Fratzscher. 2009. Forecasting ECB monetary policy: Accuracy is a matter of geography. European Economic Review 53: 1028–41. [Google Scholar] [CrossRef]
- Breiman, Leo. 2001. Random forests. Machine Learning 45: 5–32. [Google Scholar] [CrossRef]
- Breiman, Leo, Jerome Friedman, Charles J. Stone, and Richard A. Olshen. 1984. Classification and Regression Trees. New York: CRC Press. [Google Scholar]
- Caldara, Dario, Matteo Iacoviello, Patrick Molligo, Andrea Prestipino, and Andrea Raffo. 2019. The economic effects of trade policy uncertainty. Manuscript presented at the 91st meeting of the Carnegie-Rochester-NYU Conference on Public Policy, held at New York University, April 12–13. [Google Scholar]
- Capistrán, Carlos. 2008. Bias in Federal Reserve inflation forecasts: Is the Federal Reserve irrational or just cautious? Journal of Monetary Economics 55: 1415–27. [Google Scholar] [CrossRef]
- Carroll, Christopher D. 2003. Macroeconomic expectations of households and professional forecasters. The Quarterly Journal of Economics 118: 269–98. [Google Scholar] [CrossRef]
- Christodoulakis, George A., and Emmanuel C. Mamatzakis. 2008. An assessment of the EU growth forecasts under asymmetric preferences. Journal of Forecasting 27: 483–92. [Google Scholar] [CrossRef]
- Christoffersen, Peter F., and Francis X. Diebold. 1996. Further results on forecasting and model selection under asymmetric loss. Journal of Applied Econometrics 11: 561–71. [Google Scholar] [CrossRef]
- Christoffersen, Peter F., and Francis X. Diebold. 1997. Optimal prediction under asymmetric loss. Econometric Theory 13: 808–17. [Google Scholar] [CrossRef]
- D’Agostino, Antonello, Michele Modugno, and Chiara Osbat. 2017. A global trade model for the Euro Area. International Journal of Central Banking 13: 1–34. [Google Scholar]
- Drechsel, Katja, and Rolf Scheufele. 2012. The performance of short-term forecasts of the German economy before and during the 2008/2009 recession. International Journal of Forecasting 28: 428–45. [Google Scholar] [CrossRef]
- Döhrn, Roland, and Christoph M. Schmidt. 2011. Information or institution? On the determinants of forecast accuracy. Journal of Economics and Statistics 231: 9–27. [Google Scholar]
- Döpke, Jörg, and Ulrich Fritsche. 2006. Growth and inflation forecasts for Germany—A panel-based assessment of accuracy and efficiency. Empirical Economics 31: 777–98. [Google Scholar] [CrossRef]
- Döpke, Jörg, Ulrich Fritsche, and Christian Pierdzioch. 2017. Predicting recession with boosted regression trees. International Journal of Forecasting 33: 745–59. [Google Scholar] [CrossRef]
- Döpke, Jörg, Karsten Müller, and Lars Tegtmeier. 2018. The economic value of business cycle forecasts for potential investors—Evidence from Germany. Research in International Business and Finance 46: 445–61. [Google Scholar] [CrossRef]
- Durusoy, Serap, Edgardo Sica, and Zeynep Beyhan. 2015. Economic crisis and protectionism policies: The case of the EU countries. International Journal of Humanities and Social Science 5: 57–68. [Google Scholar]
- Elliott, Graham, Ivana Komunjer, and Allan Timmermann. 2005. Estimation and testing of forecast rationality under flexible loss. Review of Economic Studies 72: 1107–25. [Google Scholar] [CrossRef]
- Elliott, Graham, Ivana Komunjer, and Allan Timmermann. 2008. Biases in macroeconomic forecasts: Irrationality or asymmetric loss? Journal of the European Economic Association 6: 122–57. [Google Scholar] [CrossRef]
- Elstner, Steffen, Christian Grimme, and Ulrich Haskamp. 2013. Das ifo Exportklima - ein Frühindikator für die deutsche Exportprognose. ifo Schnelldienst 66: 36–43. [Google Scholar]
- Engelke, Carola, Katja Heinisch, and Christoph Schult. 2019. Effects of External Assumptions on Forecast Errors. IWH Discussion Paper. Halle: Halle Institute for Economic Research, forthcoming. [Google Scholar]
- Evans, Jeffrey S., and Melanie A. Murphy. 2017. rfutilities. R Package Version 2.1-0. Available online: https://cran.r-project.org/package=rfUtilities (accessed on 28 March 2018).
- Fernández-Villaverde, Jesús, Pablo Guerrón-Quintana, Keith Kuester, and Juan Rubio-Ramírez. 2015. Fiscal volatility shocks and economic activity. American Economic Review 105: 3352–84. [Google Scholar] [CrossRef]
- Frale, Cecilia, Massimiliano Marcellino, Gian Luigi Mazzi, and Tommaso Proietti. 2010. Survey data as coincident or leading indicators. Journal of Forecasting 29: 109–31. [Google Scholar] [CrossRef]
- Frenkel, Michael, Eliza M. Lis, and Jan-Christoph Rülke. 2011. Has the economic crisis of 2007–2009 changed the expectation formation process in the euro area? Economic Modelling 28: 1808–14. [Google Scholar] [CrossRef]
- Fritsche, Ulrich, Christian Pierdzioch, Jan-Christoph Rülke, and Georg Stadtmann. 2015. Forecasting the Brazilian real and the Mexican peso: Asymmetric loss, forecast rationality, and forecaster herding. International Journal of Forecasting 31: 130–39. [Google Scholar] [CrossRef]
- Granger, Clive W. J. 1969. Prediction with a generalized cost of error function. Operational Research Society 20: 199–207. [Google Scholar] [CrossRef]
- Grimme, Christian, Robert Lehmann, and Marvin Noeller. 2019. Forecasting Imports with Information from Abroad. Ifo Working Paper No. 7079. Munich: Ifo Institute - Leibniz Institute for Economic Research at the University of Munich. [Google Scholar]
- Grossmann, Sandra Hanslin, and Rolf Scheufele. 2019. PMIs: Reliable indicators for exports? Review of International Economics. forthcoming. [Google Scholar] [CrossRef]
- Guichard, Steéphanie, and Elena Rusticelli. 2011. A dynamic factor model for world trade growth. OECD Economics Department Working Papers No. 874. [Google Scholar]
- Hacker, R. Scott, and Abdulnasser Hatemi-J. 2004. The effect of exchange rate changes on trade balances in the short and long run—Evidence from German trade with transitional Central European economies. Economics of Transition 12: 777–79. [Google Scholar] [CrossRef]
- Hassan, Tarek A., Stephan Hollander, Laurence van Lent, and Ahmed Tahoun. 2017. Firm-Level Political Risk: Measurement and Effects. National Bureau of Economic Research Working Paper 24029. Cambridge: National Bureau of Economic Research. [Google Scholar]
- Hastie, Trevor, Robert Tibshirani, and Jerome Friedman. 2009. The Elements of Statistical Learning. Data Mining, Inference, and Prediction, 2nd ed. New York: Springer. [Google Scholar]
- Heilemann, Ulrich, and Herman O. Stekler. 2013. Has the accuracy of German macroeconomic forecasts improved? German Economic Review 14: 235–53. [Google Scholar] [CrossRef]
- Heinisch, Katja, and Rolf Scheufele. 2018. Bottom-up or direct? Forecasting German GDP in a data-rich environment. Empirical Economics 54: 705–45. [Google Scholar] [CrossRef]
- Hervé, Karine, Nigel Pain, Pete Richardson, Franck Sédillot, and Pierre-Olivier Beffy. 2011. The OECD’s new global model. Economic Modelling 28: 289–601. [Google Scholar] [CrossRef]
- Hetemäki, Lauri, and Jarmo Mikkola. 2005. Forecasting Germany’s printing and writing paper imports. Forest Science 51: 483–97. [Google Scholar]
- Ito, Takatoshi. 1990. Foreign exchange rate expectations: Micro survey data. The American Economic Review 80: 434–49. [Google Scholar]
- Jakaitiene, Audrone, and Stéphane Dées. 2012. Forecasting the world economy in the short term. The World Economy 35: 331–50. [Google Scholar] [CrossRef]
- James, Gareth, Daniela Witten, Trevor Hastie, and Robert Tibshirani. 2015. An Introduction to Statistical Learning. New York and Heidelberg: Springer. [Google Scholar]
- Jannsen, Nils, and Julia Richter. 2012. Foreign capacity utilisation and German exports of capital goods. Wirtschaftsdienst 92: 833–37. [Google Scholar] [CrossRef]
- Keck, Alexander, Alexander Raubold, and Alessandro Truppia. 2009. Forecasting international trade: A time series approach. OECD Journal. Journal of Business Cycle Measurement and Analysis 2: 157–76. [Google Scholar] [CrossRef]
- Kirchgässner, Gebhard. 1984. Wie gut sind die Prognosen der Arbeitsgemeinschaft wirtschaftswissenschaftlicher Forschungsinstitute in der Bundesrepublik Deutschland? Review of World Economics 120: 279–300. [Google Scholar] [CrossRef]
- Kirchgässner, Gebhard. 1993. Testing weak rationality of forecasts with different time horizons. Journal of Forecasting 12: 541–58. [Google Scholar] [CrossRef]
- Kirchgässner, Gebhard, and Ulrich K. Müller. 2006. Are forecasters reluctant to revise their predictions? Some German evidence. Journal of Forecasting 25: 401–23. [Google Scholar] [CrossRef]
- Kirchgässner, Gebhard, and Marcel Savioz. 2001. Monetary policy forecasts for real GDP growth—An empirical investigation for the Federal Republic of Germany. German Economic Review 2: 339–65. [Google Scholar] [CrossRef]
- Lehmann, Robert. 2015. Survey-Based Indicators vs. Hard Data: What Improves Export Forecasts in Europe? ifo Working Paper No. 196. Munich: Ifo Institute - Leibniz Institute for Economic Research at the University of Munich. [Google Scholar]
- Liaw, Andy, and Matthew Wiener. 2002. Classification and regression by randomforest. R News 2: 18–22. [Google Scholar]
- Malloy, Christopher J. 2005. The geography of equity analysis. Journal of Finance 60: 719–55. [Google Scholar] [CrossRef]
- Müller, Karsten, Ulrich Fritsche, and Jörg Döpke. 2019. Has macroeconomic forecasting chnaged after the Great Recession? Panel-based evidence on forecast accuracy and forecaster behaviour from Germany. Journal of Macroeconomics. forthcoming. [Google Scholar]
- Murphy, Melanie A, Jeffrey S. Evans, and Andrew Storfer. 2010. Quantifying Bufo boreas connectivity in Yellowstone National Park with landscape genetics. Ecology 91: 252–61. [Google Scholar] [CrossRef]
- Neumann, Manfred J. M., and Herbert S. Buscher. 1980. Die Inflationsprognosen der Arbeitsgemeinschaft deutscher wirtschaftswissenschaftlicher Forschungsinstitute: Sind sie “rational”? Review of World Economics 116: 533–50. [Google Scholar] [CrossRef]
- Öller, Lars-Erik, and Bharat Barot. 2000. The accuracy of european growth and inflation forecasts. International Journal of Forecasting 16: 293–315. [Google Scholar] [CrossRef]
- Park, Sang-Chul. 2018. U.S. protectionism and trade imbalance between the U.S. and northeast asian countries. International Organisations Research Journal 13: 76–100. [Google Scholar] [CrossRef]
- Patton, Andrew J., and Allan Timmermann. 2007. Testing forecasting optimality under unknown loss. Journal of the American Statistical Association 102: 1172–84. [Google Scholar] [CrossRef]
- Pelagidis, Theodore. 2018. Free trade, protectionism, and the global economy. World Economics 19: 121–28. [Google Scholar]
- Pesaran, Hashem M., and Allan Timmermann. 1995. Predictability of stock returns: Robustness and economic significance. Journal of Finance 50: 1201–28. [Google Scholar] [CrossRef]
- Pierdzioch, Christian, and Jan-Christoph Rülke. 2013. A note on forecasting the rate of change fo the price of oil: Asymmetric loss and forecast rationality. Economies 1: 6–13. [Google Scholar] [CrossRef]
- Pierdzioch, Christian, Monique B. Reid, and Rangan Gupta. 2016a. Forecasting the South African inflation rate: On asymmetric loss and forecast rationality. Economic Systems 40: 82–92. [Google Scholar] [CrossRef]
- Pierdzioch, Christian, Jan-Christoph Rülke, and Peter Tillman. 2016b. Using forecasts to uncover the loss function of federal open market committee members. Macroeconomic Dynamics 20: 791–818. [Google Scholar] [CrossRef]
- R Core Team. 2019. R: A Language and Environment for Statistical Computing, R: Version 3.6.0. Vienna: R Foundation for Statistical Computing. [Google Scholar]
- Riad, Nagwa, Luca Errico, Christian Henn, Christian Saborowski, Mika Saito, and Jarkko Turunen. 2012. Changing Patterns of Global Trade. Washington: International Monetary Fund. [Google Scholar]
- Sinclair, Tara, Herman O. Stekler, and Hans Christian Müller-Dröge. 2016. Evaluating forecasts of a vector of variables: A German forecasting competition. Journal of Forecasting 35: 493–503. [Google Scholar] [CrossRef]
- Statistisches Bundesamt. 2018. Wirtschaft und Statistik. Available online: https://www.destatis.de/GPStatistik/receive/DESerie_serie_00000012?list=all (accessed on 28 March 2018).
- Sun, Yuying, Shouyang Wang, and Xun Zhang. 2018. How efficient are china’s macroeconomic forecasts? evidences from a new forecasting evaluation approach. Economic Modelling 68: 506–13. [Google Scholar] [CrossRef]
- Timmermann, Allan. 2007. An evaluation of the World Economic Outlook forecasts. IMF Staff Papers 54: 1–33. [Google Scholar] [CrossRef]
- Varian, Hal R. 1974. A Bayesian approach to real estate assessment. In Studies in Bayesian Econometrics and Statistics—In Honor of Leonard J. Savage. Edited by Arnold Zellner and Stephen E. Fienberg. Amsterdam: Nort-Holland, vol. 1, pp. 195–208. [Google Scholar]
- Vosen, Simeon, and Torsten Schmidt. 2011. Forecasting private consumption: Survey-based indicators vs. Google Trends. Journal of Forecasting 30: 565–78. [Google Scholar] [CrossRef]
- Yu, Lean, Shouyang Wang, and Kin Keung Lai. 2008. Forecasting China’s foreign trade volume with a kernel-based hybrid econometric-AI ensemble learning approach. Journal of Systems and Complexity 21: 1–19. [Google Scholar] [CrossRef]
- Zellner, Arnold. 1986. Bayesian estimation and prediction using asymmetric loss functions. Journal of the American Statistical Association 81: 446–51. [Google Scholar] [CrossRef]
Figure 1.
Data Segmentation of an Exemplary Classification or Regression Tree—Left panel: Exemplary classification/regression tree with partitioning predictors, , cutpoints, , and regions, . With . Right panel: Partitioned feature space with the respective regions. Example based on Hastie et al. (2009, Figure 9.2).

Figure 2.
Variable importanceplots for random forests evaluating export growth forecasts—variable importance is measured by counting the times a predictor is selected as splitting variable in a regression or classification tree. Variable importance measures of the respective trees are summed up and the share of each predictor as a splitting variable in a random forest is computed by dividing by the number of trees in the random forest, here 750. Light grey bars indicate trade variables, dark grey bars indicate other macroeconomic variables.
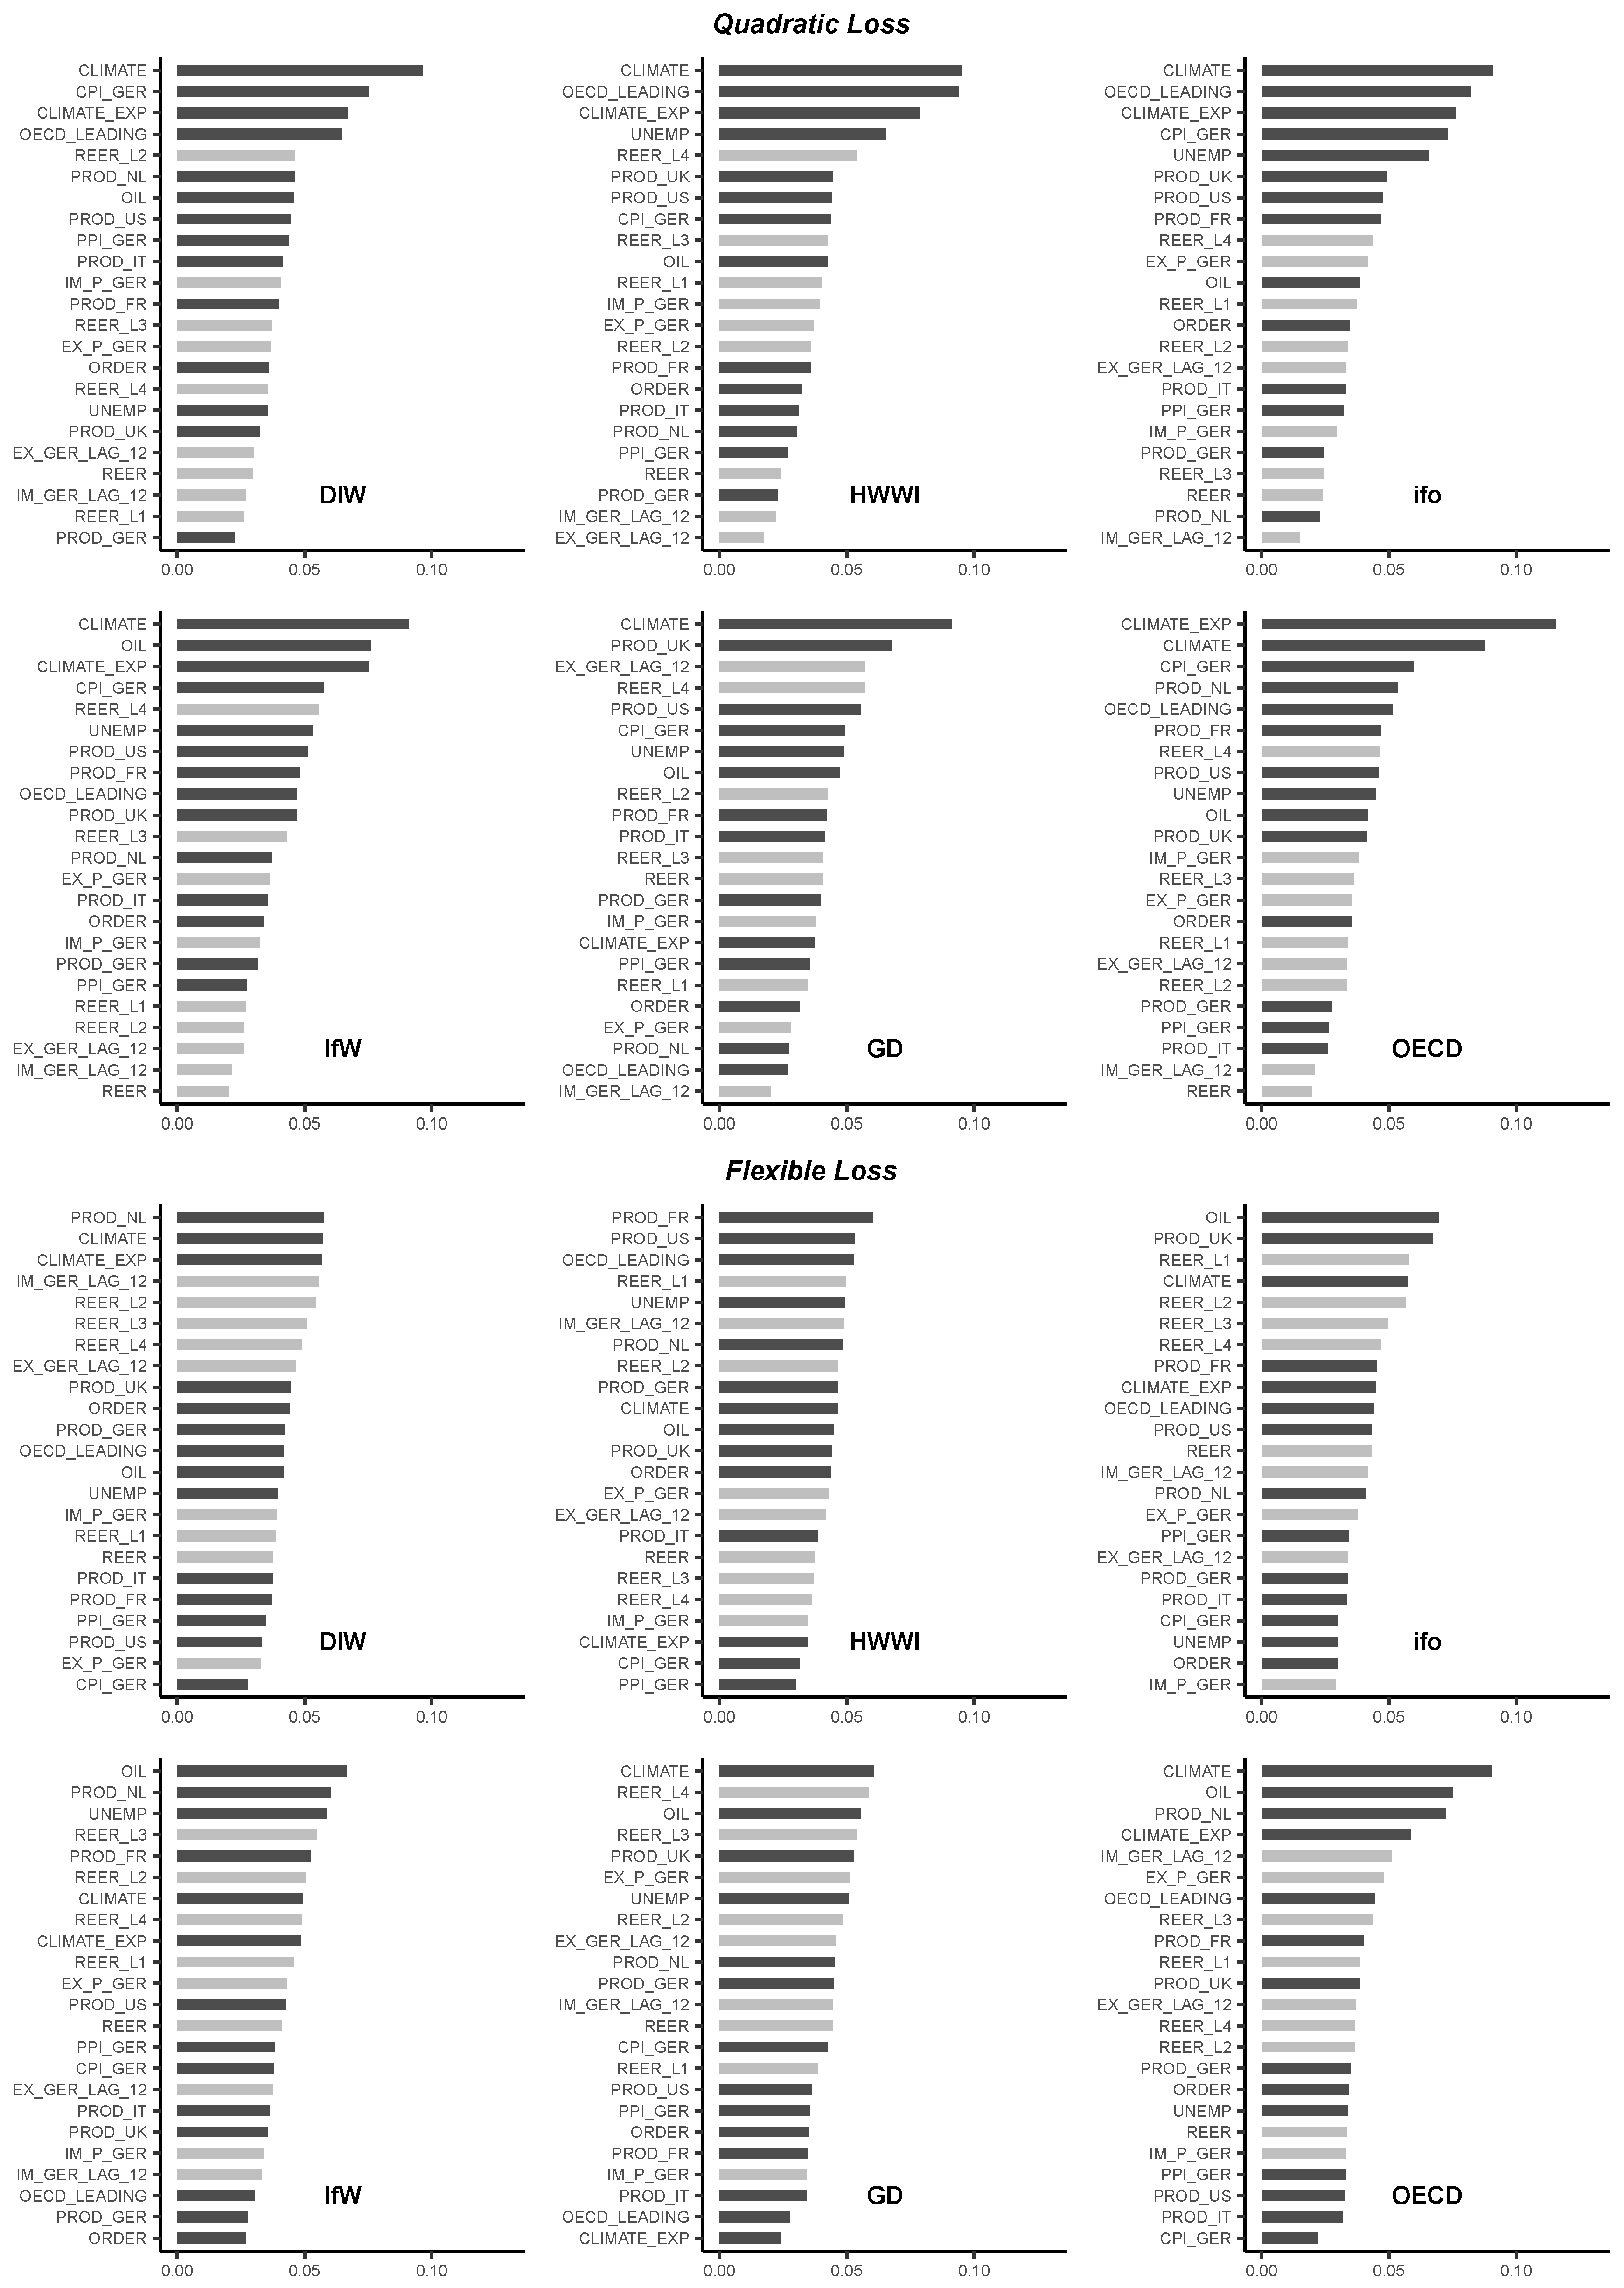
Figure 3.
Variable importance plots for random forests evaluating import growth forecasts—Variable importance is measured by counting the times a predictor is selected as splitting a variable in a regression or classification tree. Variable importance measures of the respective trees are summed up and the share of each predictor as a splitting variable in a random forest is computed by dividing by the number of trees in the random forest, here 750. Light grey bars indicate trade variables; dark grey bars indicate other macroeconomic variables.

Table 1.
Descriptive statistics of forecast errors.
| Forecaster | Horizon | N | MEAN | SD | AC | N | MEAN | SD | AC | ||
|---|---|---|---|---|---|---|---|---|---|---|---|
| Exports | Imports | ||||||||||
| DIW | Shorter-term | 36 | 0.20 | 2.35 | 0.03 | 0.47 | 36 | 0.71 | 2.85 | 0.10 | 0.42 |
| Longer-term | 48 | −0.78 | 5.05 | −0.15 | 0.62 | 48 | −0.28 | 3.98 | −0.06 | 0.56 | |
| HWWI | Shorter-term | 31 | −0.11 | 2.44 | −0.01 | 0.58 | 31 | 0.24 | 2.79 | −0.10 | 0.39 |
| Longer-term | 43 | −0.14 | 5.04 | −0.31 | 0.51 | 42 | 0.35 | 4.01 | −0.26 | 0.45 | |
| ifo | Shorter-term | 41 | −0.06 | 2.40 | −0.08 | 0.54 | 41 | 0.02 | 2.29 | −0.20 | 0.41 |
| Longer-term | 44 | −0.50 | 4.73 | −0.16 | 0.61 | 44 | −0.09 | 3.52 | −0.15 | 0.50 | |
| IfW | Shorter-term | 39 | 0.26 | 2.76 | −0.07 | 0.41 | 39 | 0.57 | 2.40 | −0.09 | 0.38 |
| Longer-term | 47 | −0.84 | 4.28 | 0.08 | 0.60 | 47 | 0.08 | 3.47 | 0.10 | 0.53 | |
| GD | Shorter-term | 46 | −0.58 | 3.77 | −0.09 | 0.57 | 47 | −0.10 | 3.19 | −0.09 | 0.49 |
| Longer-term | 48 | −0.16 | 5.35 | −0.12 | 0.56 | 48 | 0.13 | 4.25 | −0.03 | 0.50 | |
| OECD | Shorter-term | 46 | 0.38 | 3.21 | −0.07 | 0.43 | 46 | 0.29 | 3.54 | −0.25 | 0.43 |
| Longer-term | 46 | 0.09 | 5.53 | −0.28 | 0.50 | 46 | 0.29 | 4.20 | −0.19 | 0.48 | |
Notes: N: Number of observations, MEAN: Arithmetic mean, SD: Standard deviation, AC: First, order autocorrelation, : Share of negative forecast errors.
Table 2.
Predictor variables.
| Predictors | Group | ln | Lag | Description | Source |
|---|---|---|---|---|---|
| Production Germany | M - Real | Y | 1 | Year-on-year rate of change of the monthly | OECD |
| German total manufacturing output. | |||||
| Production United States | M - Real | Y | 1 | Year-on-year rate of change of the monthly | OECD |
| U.S. total manufacturing output. | |||||
| Production France | M - Real | Y | 1 | Year-on-year rate of change of the monthly | OECD |
| French total manufacturing output. | |||||
| Production United Kingdom | M - Real | Y | 1 | Year-on-year rate of change of the monthly | OECD |
| U.K. total manufacturing output. | |||||
| Production Italy | M - Real | Y | 1 | Year-on-year rate of change of the monthly | OECD |
| Italian total manufacturing output. | |||||
| Production Netherlands | M - Real | Y | 1 | Year-on-year rate of change of the monthly | OECD |
| Dutch total manufacturing output. | |||||
| Order inflow | M - Real | Y | 1 | Year-on-year rate of change of the industrial orders | BUBA |
| received for Germany; calendar and seasonally adjusted. | |||||
| Unemployment | M - Real | N | 1 | Monthly unemployment rate (in percent of civilian | BUBA |
| labor) for Germany; calendar and seasonally adjusted. | |||||
| Oil price | M - Prices | Y | 0 | Year-on-year rate of change of the monthly | FRED |
| crude oil price (WTI); dollars per barrel. | |||||
| Climate | M - Survey | N | 0 | Monthly ifo business tendency survey for manufacturing for | FRED |
| Germany; half-a-year-ahead tendency, seasonally adjusted. | |||||
| Climate (expectations) | M - Survey | N | 0 | Monthly ifo business tendency survey for manufacturing for | FRED |
| Germany; situation in six months; seasonally adjusted. | |||||
| OECD leading (normalized) | M - Composite | N | 2 | Monthly normalized OECD composite | OECD |
| leading indicator for Germany. | |||||
| Real effective exchange rate | T - Prices | Y | 1 | Year-on-year rate of change of the monthly narrow | BIS |
| effective exchange rate for Germany; CPI-based. | |||||
| Exports | T - Real | Y | 12 | 12-months-lag of the year-on-year rate of change of | FRED |
| German value goods exports; seasonally adjusted. | |||||
| Imports | T - Real | Y | 12 | 12-months-lag of the year-on-year rate of change of | FRED |
| German value goods imports; seasonally adjusted. | |||||
| Export Prices | T - Prices | Y | 1 | Year-on-year rate of change of the monthly index of German | DESTATIS |
| export prices; standard international trade classification. | |||||
| Import Prices | T - Prices | Y | 1 | Year-on-year rate of change of the monthly index of German | DESTATIS |
| import prices; standard international trade classification. | |||||
| Consumer Prices | M - Prices | Y | 0 | Year-on-year rate of change of the monthly German | BUBA |
| consumer price index; calendar and seasonally adjusted. | |||||
| Producer Prices | M - Prices | Y | 0 | Year-on-year rate of change of the monthly German | FRED |
| domestic producer price index for manufacturing. |
Notes: BIS - Bank for International Settlements, https://www.bis.org/statistics/index.htm; BUBA - German Central Bank, http://www.bundesbank.de/Navigation/EN/Statistics/statistics.html; DESTATIS - Federal Statistical Office of Germany, https://www.destatis.de/EN/FactsFigures/FactsFigures.html; FRED - Federal Reserve Bank of St. Louis, https://fred.stlouisfed.org/; OECD - Organisation for Economic Co-operation and Development, http://stats.oecd.org/. ln: natural logarithmic transformation, Y - yes, N - no, M - Macroeconomic variable, T - Trade variable. − Lag: Publication lags in months added where necessary (Drechsel and Scheufele 2012, Table 3).
Table 3.
Basic specification.
| Trees | 250 | 500 | 750 | 250 | 500 | 750 | 250 | 500 | 750 | 250 | 500 | 750 | ||||
|---|---|---|---|---|---|---|---|---|---|---|---|---|---|---|---|---|
| Loss Function | Quadratic | Flexible | ||||||||||||||
| DIW | ||||||||||||||||
| Forecast | Exports | Imports | Exports | Imports | ||||||||||||
| Shorter-term | 0.801 | 0.765 | 0.804 | 0.146 | 0.215 | 0.166 | 0.852 | 0.813 | 0.565 | 0.381 | 0.515 | 0.415 | ||||
| Longer-term | 0.105 | 0.549 | 0.196 | 0.093 | 0.057 | 0.003 | 0.338 | 0.451 | 0.484 | 0.358 | 0.130 | 0.178 | ||||
| HWWI | ||||||||||||||||
| Forecast | Exports | Imports | Exports | Imports | ||||||||||||
| Shorter-term | 0.164 | 0.261 | 0.275 | 0.309 | 0.326 | 0.232 | 0.102 | 0.091 | 0.244 | 0.318 | 0.289 | 0.400 | ||||
| Longer-term | 0.026 | 0.011 | 0.018 | 0.018 | 0.006 | 0.009 | 0.913 | 0.691 | 0.854 | 0.424 | 0.240 | 0.184 | ||||
| ifo | ||||||||||||||||
| Forecast | Exports | Imports | Exports | Imports | ||||||||||||
| Shorter-term | 0.792 | 0.745 | 0.837 | 0.945 | 0.992 | 0.966 | 0.819 | 0.886 | 0.830 | 0.313 | 0.421 | 0.302 | ||||
| Longer-term | 0.001 | 0.003 | 0.018 | 0.003 | 0.001 | 0.005 | 0.260 | 0.190 | 0.183 | 0.810 | 0.819 | 0.800 | ||||
| IfW | ||||||||||||||||
| Forecast | Exports | Imports | Exports | Imports | ||||||||||||
| Shorter-term | 0.054 | 0.046 | 0.048 | 0.477 | 0.448 | 0.454 | 0.182 | 0.017 | 0.019 | 0.656 | 0.552 | 0.304 | ||||
| Longer-term | 0.109 | 0.141 | 0.116 | 0.162 | 0.140 | 0.120 | 0.444 | 0.265 | 0.620 | 0.087 | 0.060 | 0.146 | ||||
| GD | ||||||||||||||||
| Forecast | Exports | Imports | Exports | Imports | ||||||||||||
| Shorter-term | 0.346 | 0.298 | 0.533 | 0.587 | 0.794 | 0.591 | 0.819 | 0.773 | 0.542 | 0.064 | 0.178 | 0.091 | ||||
| Longer-term | 0.551 | 0.386 | 0.343 | 0.079 | 0.064 | 0.079 | 0.841 | 0.621 | 0.622 | 0.556 | 0.715 | 0.370 | ||||
| OECD | ||||||||||||||||
| Forecast | Exports | Imports | Exports | Imports | ||||||||||||
| Shorter-term | 0.508 | 0.498 | 0.342 | 0.191 | 0.309 | 0.160 | 0.169 | 0.106 | 0.158 | 0.426 | 0.317 | 0.107 | ||||
| Longer-term | 0.109 | 0.079 | 0.113 | 0.002 | 0.001 | 0.002 | 0.039 | 0.091 | 0.035 | 0.202 | 0.216 | 0.145 | ||||
Notes: Reported p-values are obtained by a permutation test with 1000 replications. Bold numbers indicate significance at the 5%-level.
Table 4.
Alternative hyperparameters—Maximum number of terminal nodes.
| Trees | 250 | 500 | 750 | 250 | 500 | 750 | 250 | 500 | 750 | 250 | 500 | 750 | ||||
|---|---|---|---|---|---|---|---|---|---|---|---|---|---|---|---|---|
| Loss Function | Quadratic | Flexible | ||||||||||||||
| DIW | ||||||||||||||||
| Forecast | Exports | Imports | Exports | Imports | ||||||||||||
| Shorter-term | 0.939 | 0.936 | 0.864 | 0.206 | 0.159 | 0.190 | 0.549 | 0.792 | 0.800 | 0.397 | 0.282 | 0.587 | ||||
| Longer-term | 0.308 | 0.293 | 0.228 | 0.259 | 0.104 | 0.091 | 0.217 | 0.450 | 0.228 | 0.065 | 0.105 | 0.181 | ||||
| HWWI | ||||||||||||||||
| Forecast | Exports | Imports | Exports | Imports | ||||||||||||
| Shorter-term | 0.385 | 0.289 | 0.334 | 0.333 | 0.283 | 0.296 | 0.502 | 0.165 | 0.250 | 0.660 | 0.528 | 0.426 | ||||
| Longer-term | 0.020 | 0.019 | 0.009 | 0.020 | 0.028 | 0.018 | 0.900 | 0.694 | 0.684 | 0.345 | 0.204 | 0.263 | ||||
| ifo | ||||||||||||||||
| Forecast | Exports | Imports | Exports | Imports | ||||||||||||
| Shorter-term | 0.939 | 0.793 | 0.830 | 0.945 | 0.901 | 0.927 | 0.835 | 0.980 | 0.978 | 0.169 | 0.159 | 0.278 | ||||
| Longer-term | 0.011 | 0.015 | 0.010 | 0.021 | 0.009 | 0.006 | 0.187 | 0.387 | 0.375 | 0.790 | 0.539 | 0.848 | ||||
| IfW | ||||||||||||||||
| Forecast | Exports | Imports | Exports | Imports | ||||||||||||
| Shorter-term | 0.044 | 0.053 | 0.040 | 0.461 | 0.495 | 0.500 | 0.197 | 0.049 | 0.015 | 0.639 | 0.536 | 0.769 | ||||
| Longer-term | 0.220 | 0.152 | 0.181 | 0.121 | 0.204 | 0.214 | 0.577 | 0.593 | 0.366 | 0.146 | 0.279 | 0.090 | ||||
| GD | ||||||||||||||||
| Forecast | Exports | Imports | Exports | Imports | ||||||||||||
| Shorter-term | 0.296 | 0.537 | 0.423 | 0.571 | 0.927 | 0.732 | 0.867 | 0.882 | 0.701 | 0.046 | 0.084 | 0.182 | ||||
| Longer-term | 0.389 | 0.453 | 0.336 | 0.145 | 0.065 | 0.067 | 0.511 | 0.512 | 0.601 | 0.437 | 0.641 | 0.639 | ||||
| OECD | ||||||||||||||||
| Forecast | Exports | Imports | Exports | Imports | ||||||||||||
| Shorter-term | 0.364 | 0.334 | 0.413 | 0.208 | 0.098 | 0.164 | 0.066 | 0.222 | 0.108 | 0.175 | 0.458 | 0.251 | ||||
| Longer-term | 0.042 | 0.141 | 0.100 | 0.001 | 0.001 | 0.001 | 0.085 | 0.025 | 0.015 | 0.084 | 0.211 | 0.086 | ||||
Notes: Reported p-values are obtained by a permutation test with 1000 replications. Bold numbers indicate significance at the 5%-level.
Table 5.
Alternative hyperparameters—Half of the chosen predictors.
| Trees | 250 | 500 | 750 | 250 | 500 | 750 | 250 | 500 | 750 | 250 | 500 | 750 | ||||
|---|---|---|---|---|---|---|---|---|---|---|---|---|---|---|---|---|
| Loss Function | Quadratic | Flexible | ||||||||||||||
| DIW | ||||||||||||||||
| Forecast | Exports | Imports | Exports | Imports | ||||||||||||
| Shorter-term | 0.961 | 0.907 | 0.910 | 0.188 | 0.147 | 0.218 | 0.813 | 0.880 | 0.548 | 0.514 | 0.394 | 0.282 | ||||
| Longer-term | 0.330 | 0.078 | 0.185 | 0.056 | 0.049 | 0.064 | 0.145 | 0.212 | 0.363 | 0.190 | 0.354 | 0.183 | ||||
| HWWI | ||||||||||||||||
| Forecast | Exports | Imports | Exports | Imports | ||||||||||||
| Shorter-term | 0.294 | 0.216 | 0.227 | 0.631 | 0.323 | 0.313 | 0.108 | 0.046 | 0.088 | 0.646 | 0.529 | 0.408 | ||||
| Longer-term | 0.017 | 0.017 | 0.008 | 0.039 | 0.055 | 0.009 | 0.888 | 0.894 | 0.746 | 0.279 | 0.355 | 0.257 | ||||
| ifo | ||||||||||||||||
| Forecast | Exports | Imports | Exports | Imports | ||||||||||||
| Shorter-term | 0.930 | 0.939 | 0.892 | 0.976 | 0.988 | 0.994 | 0.973 | 0.761 | 0.929 | 0.428 | 0.248 | 0.229 | ||||
| Longer-term | 0.009 | 0.013 | 0.013 | 0.043 | 0.009 | 0.007 | 0.363 | 0.468 | 0.252 | 0.713 | 0.713 | 0.623 | ||||
| IfW | ||||||||||||||||
| Forecast | Exports | Imports | Exports | Imports | ||||||||||||
| Shorter-term | 0.026 | 0.069 | 0.012 | 0.594 | 0.498 | 0.478 | 0.044 | 0.039 | 0.007 | 0.787 | 0.770 | 0.539 | ||||
| Longer-term | 0.371 | 0.157 | 0.290 | 0.290 | 0.241 | 0.230 | 0.688 | 0.761 | 0.812 | 0.181 | 0.133 | 0.218 | ||||
| GD | ||||||||||||||||
| Forecast | Exports | Imports | Exports | Imports | ||||||||||||
| Shorter-term | 0.693 | 0.367 | 0.449 | 0.900 | 0.809 | 0.786 | 0.719 | 0.895 | 0.794 | 0.029 | 0.110 | 0.067 | ||||
| Longer-term | 0.531 | 0.450 | 0.303 | 0.081 | 0.066 | 0.039 | 0.694 | 0.795 | 0.532 | 0.458 | 0.636 | 0.686 | ||||
| OECD | ||||||||||||||||
| Forecast | Exports | Imports | Exports | Imports | ||||||||||||
| Shorter-term | 0.211 | 0.402 | 0.322 | 0.041 | 0.081 | 0.072 | 0.081 | 0.146 | 0.103 | 0.078 | 0.114 | 0.079 | ||||
| Longer-term | 0.085 | 0.060 | 0.059 | 0.003 | 0.003 | 0.001 | 0.037 | 0.026 | 0.019 | 0.142 | 0.142 | 0.144 | ||||
Notes: Reported p-values are obtained by a permutation test with 1000 replications. Bold numbers indicate significance at the 5%-level.
Table 6.
Alternative hyperparameters—Minimum number of observations at terminal nodes.
| Trees | 250 | 500 | 750 | 250 | 500 | 750 | 250 | 500 | 750 | 250 | 500 | 750 | ||||
|---|---|---|---|---|---|---|---|---|---|---|---|---|---|---|---|---|
| Loss Function | Quadratic | Flexible | ||||||||||||||
| DIW | ||||||||||||||||
| Forecast | Exports | Imports | Exports | Imports | ||||||||||||
| Shorter-term | 0.996 | 0.899 | 0.882 | 0.374 | 0.176 | 0.198 | 0.537 | 0.609 | 0.565 | 0.266 | 0.607 | 0.494 | ||||
| Longer-term | 0.290 | 0.188 | 0.294 | 0.104 | 0.088 | 0.046 | 0.322 | 0.138 | 0.148 | 0.273 | 0.129 | 0.071 | ||||
| HWWI | ||||||||||||||||
| Forecast | Exports | Imports | Exports | Imports | ||||||||||||
| Shorter-term | 0.317 | 0.313 | 0.288 | 0.573 | 0.380 | 0.357 | 0.342 | 0.361 | 0.095 | 0.438 | 0.312 | 0.543 | ||||
| Longer-term | 0.028 | 0.013 | 0.030 | 0.011 | 0.011 | 0.009 | 0.826 | 0.883 | 0.888 | 0.256 | 0.080 | 0.218 | ||||
| ifo | ||||||||||||||||
| Forecast | Exports | Imports | Exports | Imports | ||||||||||||
| Shorter-term | 0.849 | 0.940 | 0.910 | 0.931 | 0.943 | 0.971 | 0.968 | 0.969 | 0.936 | 0.428 | 0.248 | 0.229 | ||||
| Longer-term | 0.016 | 0.010 | 0.022 | 0.024 | 0.009 | 0.007 | 0.612 | 0.469 | 0.500 | 0.793 | 0.721 | 0.777 | ||||
| IfW | ||||||||||||||||
| Forecast | Exports | Imports | Exports | Imports | ||||||||||||
| Shorter-term | 0.030 | 0.021 | 0.032 | 0.599 | 0.594 | 0.556 | 0.094 | 0.069 | 0.041 | 0.512 | 0.419 | 0.520 | ||||
| Longer-term | 0.187 | 0.234 | 0.180 | 0.308 | 0.157 | 0.185 | 0.770 | 0.740 | 0.699 | 0.095 | 0.218 | 0.137 | ||||
| GD | ||||||||||||||||
| Forecast | Exports | Imports | Exports | Imports | ||||||||||||
| Shorter-term | 0.221 | 0.528 | 0.523 | 0.726 | 0.761 | 0.834 | 0.852 | 0.853 | 0.869 | 0.223 | 0.131 | 0.102 | ||||
| Longer-term | 0.359 | 0.606 | 0.331 | 0.113 | 0.109 | 0.118 | 0.715 | 0.688 | 0.443 | 0.609 | 0.717 | 0.628 | ||||
| OECD | ||||||||||||||||
| Forecast | Exports | Imports | Exports | Imports | ||||||||||||
| Shorter-term | 0.446 | 0.404 | 0.348 | 0.241 | 0.101 | 0.206 | 0.185 | 0.215 | 0.170 | 0.733 | 0.067 | 0.509 | ||||
| Longer-term | 0.160 | 0.092 | 0.081 | 0.002 | 0.002 | 0.002 | 0.021 | 0.030 | 0.038 | 0.368 | 0.080 | 0.155 | ||||
Notes: Reported p-values are obtained by a permutation test with 1000 replications. Bold numbers indicate significance at the 5%-level.
Table 7.
Including trade uncertainty measures.
| Trees | 250 | 500 | 750 | 250 | 500 | 750 | 250 | 500 | 750 | 250 | 500 | 750 | ||||
|---|---|---|---|---|---|---|---|---|---|---|---|---|---|---|---|---|
| Loss Function | Quadratic | Flexible | ||||||||||||||
| DIW | ||||||||||||||||
| Forecast | Exports | Imports | Exports | Imports | ||||||||||||
| Shorter-term | 0.959 | 0.954 | 0.835 | 0.150 | 0.178 | 0.140 | 0.457 | 0.733 | 0.737 | 0.404 | 0.581 | 0.693 | ||||
| Longer-term | 0.132 | 0.194 | 0.197 | 0.116 | 0.011 | 0.025 | 0.339 | 0.350 | 0.224 | 0.143 | 0.193 | 0.088 | ||||
| HWWI | ||||||||||||||||
| Forecast | Exports | Imports | Exports | Imports | ||||||||||||
| Shorter-term | 0.289 | 0.254 | 0.299 | 0.375 | 0.331 | 0.374 | 0.255 | 0.159 | 0.103 | 0.395 | 0.409 | 0.537 | ||||
| Longer-term | 0.015 | 0.029 | 0.023 | 0.022 | 0.020 | 0.019 | 0.748 | 0.685 | 0.884 | 0.238 | 0.268 | 0.245 | ||||
| ifo | ||||||||||||||||
| Forecast | Exports | Imports | Exports | Imports | ||||||||||||
| Shorter-term | 0.858 | 0.920 | 0.818 | 0.952 | 0.958 | 0.949 | 0.855 | 0.897 | 0.819 | 0.039 | 0.069 | 0.111 | ||||
| Longer-term | 0.007 | 0.005 | 0.010 | 0.007 | 0.006 | 0.012 | 0.276 | 0.514 | 0.375 | 0.242 | 0.307 | 0.620 | ||||
| IfW | ||||||||||||||||
| Forecast | Exports | Imports | Exports | Imports | ||||||||||||
| Shorter-term | 0.038 | 0.019 | 0.049 | 0.346 | 0.292 | 0.314 | 0.185 | 0.070 | 0.079 | 0.403 | 0.392 | 0.407 | ||||
| Longer-term | 0.184 | 0.111 | 0.149 | 0.202 | 0.163 | 0.178 | 0.397 | 0.483 | 0.371 | 0.100 | 0.135 | 0.185 | ||||
| GD | ||||||||||||||||
| Forecast | Exports | Imports | Exports | Imports | ||||||||||||
| Shorter-term | 0.457 | 0.340 | 0.224 | 0.780 | 0.697 | 0.621 | 0.858 | 0.766 | 0.803 | 0.180 | 0.068 | 0.185 | ||||
| Longer-term | 0.769 | 0.554 | 0.762 | 0.070 | 0.094 | 0.346 | 0.404 | 0.869 | 0.702 | 0.565 | 0.718 | 0.782 | ||||
| OECD | ||||||||||||||||
| Forecast | Exports | Imports | Exports | Imports | ||||||||||||
| Shorter-term | 0.505 | 0.404 | 0.503 | 0.055 | 0.271 | 0.294 | 0.135 | 0.179 | 0.400 | 0.648 | 0.359 | 0.392 | ||||
| Longer-term | 0.067 | 0.077 | 0.080 | 0.001 | 0.001 | 0.001 | 0.006 | 0.069 | 0.015 | 0.088 | 0.198 | 0.145 | ||||
Notes: Reported p-values are obtained by a permutation test with 1000 replications. Bold numbers indicate significance at the 5%-level.
Table 8.
Including the lagged forecast error.
| Trees | 250 | 500 | 750 | 250 | 500 | 750 | 250 | 500 | 750 | 250 | 500 | 750 | ||||
|---|---|---|---|---|---|---|---|---|---|---|---|---|---|---|---|---|
| Loss Function | Quadratic | Flexible | ||||||||||||||
| DIW | ||||||||||||||||
| Forecast | Exports | Imports | Exports | Imports | ||||||||||||
| Short-term | 0.936 | 0.933 | 0.866 | 0.270 | 0.285 | 0.162 | 0.774 | 0.877 | 0.843 | 0.497 | 0.605 | 0.359 | ||||
| Long-term | 0.322 | 0.420 | 0.265 | 0.010 | 0.033 | 0.055 | 0.246 | 0.351 | 0.465 | 0.176 | 0.255 | 0.256 | ||||
| HWWI | ||||||||||||||||
| Forecast | Exports | Imports | Exports | Imports | ||||||||||||
| Short-term | 0.158 | 0.151 | 0.236 | 0.455 | 0.436 | 0.403 | 0.144 | 0.077 | 0.034 | 0.316 | 0.432 | 0.440 | ||||
| Long-term | 0.013 | 0.009 | 0.008 | 0.009 | 0.016 | 0.016 | 0.631 | 0.845 | 0.774 | 0.159 | 0.194 | 0.276 | ||||
| ifo | ||||||||||||||||
| Forecast | Exports | Imports | Exports | Imports | ||||||||||||
| Short-term | 0.759 | 0.730 | 0.807 | 0.932 | 0.885 | 0.834 | 0.774 | 0.864 | 0.855 | 0.512 | 0.351 | 0.215 | ||||
| Long-term | 0.008 | 0.069 | 0.017 | 0.007 | 0.009 | 0.007 | 0.116 | 0.504 | 0.503 | 0.856 | 0.712 | 0.843 | ||||
| IfW | ||||||||||||||||
| Forecast | Exports | Imports | Exports | Imports | ||||||||||||
| Short-term | 0.402 | 0.140 | 0.113 | 0.460 | 0.411 | 0.470 | 0.159 | 0.090 | 0.108 | 0.278 | 0.289 | 0.184 | ||||
| Long-term | 0.279 | 0.285 | 0.213 | 0.080 | 0.107 | 0.121 | 0.298 | 0.527 | 0.604 | 0.171 | 0.054 | 0.047 | ||||
| GD | ||||||||||||||||
| Forecast | Exports | Imports | Exports | Imports | ||||||||||||
| Short-term | 0.504 | 0.511 | 0.492 | 0.612 | 0.718 | 0.821 | 0.444 | 0.535 | 0.668 | 0.297 | 0.222 | 0.034 | ||||
| Long-term | 0.492 | 0.396 | 0.426 | 0.083 | 0.078 | 0.068 | 0.856 | 0.817 | 0.866 | 0.544 | 0.452 | 0.426 | ||||
| OECD | ||||||||||||||||
| Forecast | Exports | Imports | Exports | Imports | ||||||||||||
| Short-term | 0.212 | 0.396 | 0.333 | 0.183 | 0.192 | 0.227 | 0.136 | 0.075 | 0.189 | 0.063 | 0.242 | 0.244 | ||||
| Long-term | 0.045 | 0.072 | 0.517 | 0.005 | 0.005 | 0.004 | 0.017 | 0.043 | 0.018 | 0.080 | 0.088 | 0.133 | ||||
Notes: Reported p-values are obtained by a permutation test with 1000 replications. Bold numbers indicate significance at the 5%-level.
Table 9.
Including the other trade forecast.
| Trees | 250 | 500 | 750 | 250 | 500 | 750 | 250 | 500 | 750 | 250 | 500 | 750 | ||||
|---|---|---|---|---|---|---|---|---|---|---|---|---|---|---|---|---|
| Loss Function | Quadratic | Flexible | ||||||||||||||
| DIW | ||||||||||||||||
| Forecast | Exports | Imports | Exports | Imports | ||||||||||||
| Short-term | 0.775 | 0.741 | 0.624 | 0.292 | 0.268 | 0.173 | 0.652 | 0.742 | 0.811 | 0.497 | 0.605 | 0.359 | ||||
| Long-term | 0.214 | 0.183 | 0.314 | 0.015 | 0.051 | 0.016 | 0.477 | 0.329 | 0.222 | 0.176 | 0.255 | 0.256 | ||||
| HWWI | ||||||||||||||||
| Forecast | Exports | Imports | Exports | Imports | ||||||||||||
| Short-term | 0.291 | 0.200 | 0.284 | 0.305 | 0.407 | 0.456 | 0.343 | 0.095 | 0.336 | 0.316 | 0.432 | 0.440 | ||||
| Long-term | 0.015 | 0.021 | 0.026 | 0.005 | 0.008 | 0.006 | 0.553 | 0.612 | 0.537 | 0.159 | 0.194 | 0.276 | ||||
| ifo | ||||||||||||||||
| Forecast | Exports | Imports | Exports | Imports | ||||||||||||
| Short-term | 0.919 | 0.927 | 0.806 | 0.964 | 0.942 | 0.966 | 0.922 | 0.960 | 0.830 | 0.512 | 0.351 | 0.215 | ||||
| Long-term | 0.019 | 0.011 | 0.002 | 0.010 | 0.011 | 0.019 | 0.252 | 0.636 | 0.378 | 0.856 | 0.712 | 0.843 | ||||
| IfW | ||||||||||||||||
| Forecast | Exports | Imports | Exports | Imports | ||||||||||||
| Short-term | 0.077 | 0.042 | 0.037 | 0.474 | 0.479 | 0.413 | 0.189 | 0.016 | 0.038 | 0.278 | 0.289 | 0.184 | ||||
| Long-term | 0.179 | 0.218 | 0.152 | 0.120 | 0.165 | 0.142 | 0.613 | 0.463 | 0.380 | 0.171 | 0.054 | 0.047 | ||||
| GD | ||||||||||||||||
| Forecast | Exports | Imports | Exports | Imports | ||||||||||||
| Short-term | 0.681 | 0.461 | 0.581 | 0.841 | 0.795 | 0.902 | 0.742 | 0.873 | 0.789 | 0.297 | 0.222 | 0.034 | ||||
| Long-term | 0.536 | 0.409 | 0.569 | 0.085 | 0.085 | 0.084 | 0.618 | 0.527 | 0.338 | 0.544 | 0.452 | 0.426 | ||||
| OECD | ||||||||||||||||
| Forecast | Exports | Imports | Exports | Imports | ||||||||||||
| Short-term | 0.547 | 0.243 | 0.450 | 0.143 | 0.186 | 0.065 | 0.154 | 0.021 | 0.109 | 0.063 | 0.242 | 0.244 | ||||
| Long-term | 0.149 | 0.149 | 0.189 | 0.001 | 0.001 | 0.001 | 0.081 | 0.025 | 0.021 | 0.080 | 0.088 | 0.133 | ||||
Notes: Reported p-values are obtained by a permutation test with 1000 replications. Bold numbers indicate significance at the 5%-level.
Table 10.
Including additional lagged predictors.
| Trees | 250 | 500 | 750 | 250 | 500 | 750 | 250 | 500 | 750 | 250 | 500 | 750 | ||||
|---|---|---|---|---|---|---|---|---|---|---|---|---|---|---|---|---|
| Loss Function | Quadratic | Flexible | ||||||||||||||
| DIW | ||||||||||||||||
| Forecast | Exports | Imports | Exports | Imports | ||||||||||||
| Short-term | 0.903 | 0.866 | 0.819 | 0.323 | 0.339 | 0.292 | 0.736 | 0.929 | 0.614 | 0.487 | 0.373 | 0.231 | ||||
| Long-term | 0.079 | 0.069 | 0.023 | 0.008 | 0.011 | 0.008 | 0.310 | 0.132 | 0.454 | 0.356 | 0.195 | 0.292 | ||||
| HWWI | ||||||||||||||||
| Forecast | Exports | Imports | Exports | Imports | ||||||||||||
| Short-term | 0.477 | 0.193 | 0.247 | 0.287 | 0.360 | 0.321 | 0.469 | 0.478 | 0.256 | 0.421 | 0.544 | 0.628 | ||||
| Long-term | 0.037 | 0.034 | 0.016 | 0.020 | 0.027 | 0.013 | 0.688 | 0.747 | 0.674 | 0.365 | 0.198 | 0.220 | ||||
| ifo | ||||||||||||||||
| Forecast | Exports | Imports | Exports | Imports | ||||||||||||
| Short-term | 0.655 | 0.875 | 0.864 | 0.985 | 0.983 | 0.994 | 0.828 | 0.929 | 0.979 | 0.174 | 0.352 | 0.327 | ||||
| Long-term | 0.020 | 0.016 | 0.012 | 0.014 | 0.019 | 0.014 | 0.357 | 0.266 | 0.372 | 0.893 | 0.532 | 0.645 | ||||
| IfW | ||||||||||||||||
| Forecast | Exports | Imports | Exports | Imports | ||||||||||||
| Short-term | 0.021 | 0.010 | 0.026 | 0.457 | 0.534 | 0.552 | 0.268 | 0.044 | 0.072 | 0.280 | 0.205 | 0.203 | ||||
| Long-term | 0.082 | 0.086 | 0.056 | 0.196 | 0.078 | 0.092 | 0.463 | 0.587 | 0.569 | 0.198 | 0.277 | 0.145 | ||||
| GD | ||||||||||||||||
| Forecast | Exports | Imports | Exports | Imports | ||||||||||||
| Short-term | 0.608 | 0.656 | 0.663 | 0.860 | 0.887 | 0.882 | 0.938 | 0.720 | 0.797 | 0.244 | 0.172 | 0.124 | ||||
| Long-term | 0.279 | 0.282 | 0.356 | 0.086 | 0.155 | 0.133 | 0.417 | 0.596 | 0.530 | 0.544 | 0.703 | 0.651 | ||||
| OECD | ||||||||||||||||
| Forecast | Exports | Imports | Exports | Imports | ||||||||||||
| Short-term | 0.509 | 0.320 | 0.492 | 0.045 | 0.103 | 0.086 | 0.065 | 0.060 | 0.142 | 0.290 | 0.442 | 0.247 | ||||
| Long-term | 0.091 | 0.158 | 0.145 | 0.002 | 0.001 | 0.001 | 0.056 | 0.019 | 0.038 | 0.357 | 0.204 | 0.129 | ||||
Notes: Reported p-values are obtained by a permutation test with 1000 replications. Bold numbers indicate significance at the 5%-level.
Table 11.
Excluding the years of the financial crisis.
| Trees | 250 | 500 | 750 | 250 | 500 | 750 | 250 | 500 | 750 | 250 | 500 | 750 | ||||
|---|---|---|---|---|---|---|---|---|---|---|---|---|---|---|---|---|
| Loss Function | Quadratic | Flexible | ||||||||||||||
| DIW | ||||||||||||||||
| Forecast | Exports | Imports | Exports | Imports | ||||||||||||
| Short-term | 0.881 | 0.891 | 0.916 | 0.136 | 0.245 | 0.165 | 0.701 | 0.781 | 0.908 | 0.433 | 0.402 | 0.411 | ||||
| Long-term | 0.326 | 0.130 | 0.184 | 0.022 | 0.038 | 0.054 | 0.151 | 0.308 | 0.265 | 0.126 | 0.259 | 0.185 | ||||
| HWWI | ||||||||||||||||
| Forecast | Exports | Imports | Exports | Imports | ||||||||||||
| Short-term | 0.283 | 0.443 | 0.539 | 0.365 | 0.408 | 0.349 | 0.269 | 0.289 | 0.278 | 0.342 | 0.496 | 0.450 | ||||
| Long-term | 0.019 | 0.024 | 0.020 | 0.019 | 0.011 | 0.025 | 0.806 | 0.490 | 0.670 | 0.182 | 0.119 | 0.141 | ||||
| ifo | ||||||||||||||||
| Forecast | Exports | Imports | Exports | Imports | ||||||||||||
| Short-term | 0.880 | 0.755 | 0.835 | 0.952 | 0.935 | 0.963 | 0.790 | 0.884 | 0.855 | 0.635 | 0.443 | 0.087 | ||||
| Long-term | 0.036 | 0.019 | 0.024 | 0.002 | 0.009 | 0.004 | 0.196 | 0.286 | 0.175 | 0.360 | 0.195 | 0.281 | ||||
| IfW | ||||||||||||||||
| Forecast | Exports | Imports | Exports | Imports | ||||||||||||
| Short-term | 0.010 | 0.048 | 0.040 | 0.367 | 0.459 | 0.495 | 0.034 | 0.029 | 0.035 | 0.557 | 0.215 | 0.301 | ||||
| Long-term | 0.246 | 0.260 | 0.080 | 0.235 | 0.185 | 0.163 | 0.610 | 0.374 | 0.493 | 0.066 | 0.218 | 0.052 | ||||
| GD | ||||||||||||||||
| Forecast | Exports | Imports | Exports | Imports | ||||||||||||
| Short-term | 0.502 | 0.463 | 0.391 | 0.571 | 0.517 | 0.820 | 0.635 | 0.932 | 0.950 | 0.196 | 0.160 | 0.158 | ||||
| Long-term | 0.283 | 0.391 | 0.409 | 0.095 | 0.060 | 0.070 | 0.782 | 0.429 | 0.531 | 0.200 | 0.354 | 0.628 | ||||
| OECD | ||||||||||||||||
| Forecast | Exports | Imports | Exports | Imports | ||||||||||||
| Short-term | 0.339 | 0.281 | 0.348 | 0.229 | 0.286 | 0.145 | 0.071 | 0.077 | 0.127 | 0.356 | 0.362 | 0.262 | ||||
| Long-term | 0.094 | 0.062 | 0.053 | 0.001 | 0.002 | 0.001 | 0.170 | 0.081 | 0.044 | 0.042 | 0.089 | 0.075 | ||||
Notes: Reported p-values are obtained by a permutation test with 1000 replications. Bold numbers indicate significance at the 5%-level.
Table 12.
Excluding the years of German reunification.
| Trees | 250 | 500 | 750 | 250 | 500 | 750 | 250 | 500 | 750 | 250 | 500 | 750 | ||||
|---|---|---|---|---|---|---|---|---|---|---|---|---|---|---|---|---|
| Loss Function | Quadratic | Flexible | ||||||||||||||
| DIW | ||||||||||||||||
| Forecast | Exports | Imports | Exports | Imports | ||||||||||||
| Short-term | 0.983 | 0.953 | 0.956 | 0.486 | 0.222 | 0.375 | 0.836 | 0.488 | 0.375 | 0.136 | 0.334 | 0.137 | ||||
| Long-term | 0.255 | 0.137 | 0.070 | 0.079 | 0.042 | 0.032 | 0.227 | 0.243 | 0.208 | 0.099 | 0.116 | 0.205 | ||||
| HWWI | ||||||||||||||||
| Forecast | Exports | Imports | Exports | Imports | ||||||||||||
| Short-term | 0.303 | 0.242 | 0.298 | 0.609 | 0.382 | 0.386 | 0.074 | 0.334 | 0.475 | 0.550 | 0.546 | 0.487 | ||||
| Long-term | 0.010 | 0.034 | 0.056 | 0.012 | 0.008 | 0.008 | 0.902 | 0.455 | 0.848 | 0.239 | 0.164 | 0.142 | ||||
| ifo | ||||||||||||||||
| Forecast | Exports | Imports | Exports | Imports | ||||||||||||
| Short-term | 0.869 | 0.738 | 0.822 | 0.970 | 0.885 | 0.824 | 0.740 | 0.821 | 0.542 | 0.445 | 0.248 | 0.371 | ||||
| Long-term | 0.477 | 0.547 | 0.383 | 0.255 | 0.380 | 0.399 | 0.251 | 0.237 | 0.167 | 0.653 | 0.858 | 0.751 | ||||
| IfW | ||||||||||||||||
| Forecast | Exports | Imports | Exports | Imports | ||||||||||||
| Short-term | 0.005 | 0.010 | 0.003 | 0.104 | 0.137 | 0.145 | 0.116 | 0.128 | 0.178 | 0.423 | 0.421 | 0.324 | ||||
| Long-term | 0.781 | 0.530 | 0.610 | 0.367 | 0.234 | 0.303 | 0.742 | 0.616 | 0.589 | 0.050 | 0.024 | 0.057 | ||||
| GD | ||||||||||||||||
| Forecast | Exports | Imports | Exports | Imports | ||||||||||||
| Short-term | 0.274 | 0.335 | 0.312 | 0.241 | 0.079 | 0.131 | 0.392 | 0.607 | 0.391 | 0.141 | 0.076 | 0.129 | ||||
| Long-term | 0.430 | 0.516 | 0.600 | 0.148 | 0.108 | 0.158 | 0.495 | 0.385 | 0.297 | 0.493 | 0.215 | 0.293 | ||||
| OECD | ||||||||||||||||
| Forecast | Exports | Imports | Exports | Imports | ||||||||||||
| Short-term | 0.534 | 0.545 | 0.656 | 0.050 | 0.156 | 0.104 | 0.208 | 0.274 | 0.266 | 0.379 | 0.291 | 0.383 | ||||
| Long-term | 0.435 | 0.525 | 0.488 | 0.013 | 0.006 | 0.001 | 0.107 | 0.033 | 0.030 | 0.215 | 0.138 | 0.080 | ||||
Notes: Reported p-values are obtained by a permutation test with 1000 replications. Bold numbers indicate significance at the 5%-level.
Table 13.
Data pooled across forecasters.
| Specification | - | |||||||||
|---|---|---|---|---|---|---|---|---|---|---|
| Loss Function | Quadratic | Flexible | ||||||||
| Forecast | Exports | Imports | Exports | Imports | ||||||
| Short-term | 0.001 | 0.001 | <0.001 | <0.001 | <0.001 | <0.001 | ||||
| Long-term | 0.001 | 0.001 | <0.001 | <0.001 | <0.001 | <0.001 | ||||
Notes: Reported p-values are obtained by a permutation test with 1000 replications. Bold numbers indicate significance at the 5%-level.
© 2019 by the author. Licensee MDPI, Basel, Switzerland. This article is an open access article distributed under the terms and conditions of the Creative Commons Attribution (CC BY) license (http://creativecommons.org/licenses/by/4.0/).
Share and Cite
MDPI and ACS Style
Behrens, C. A Nonparametric Evaluation of the Optimality of German Export and Import Growth Forecasts under Flexible Loss. Economies 2019, 7, 93. https://doi.org/10.3390/economies7030093
AMA Style
Behrens C. A Nonparametric Evaluation of the Optimality of German Export and Import Growth Forecasts under Flexible Loss. Economies. 2019; 7(3):93. https://doi.org/10.3390/economies7030093
Chicago/Turabian StyleBehrens, Christoph. 2019. "A Nonparametric Evaluation of the Optimality of German Export and Import Growth Forecasts under Flexible Loss" Economies 7, no. 3: 93. https://doi.org/10.3390/economies7030093
Note that from the first issue of 2016, this journal uses article numbers instead of page numbers. See further details here.