Localization of SDGs through Disaggregation of KPIs


Abstract
:1. Introduction
2. Background
- Tier 1: metadata are fully developed and data are available,
- Tier 2: metadata are developed but data is not readily available or sparse,
- Tier 3: methodological work is necessary to further develop the indicator metadata.
Disaggregation is the breakdown of observations within a common branch of a hierarchy to a more detailed level to that at which detailed observations are taken. With standard hierarchical classifications […] categories can be split (disaggregated) when finer details are required and made possible by the codes given to the primary observations.9
3. Case Study
- Understand SDG metadata by tier,
- Derive criteria and variables,
- Understand IAEG-SDGs Indicator Custodian metadata for SDG,
- ○
- Additional global/regional standards related to SDG if possible,
- Understand secondary SDG metadata to identify common criteria and variables,
- Develop common KPI for primary/secondary SDG for disaggregation analysis.
4. Discussion
5. Conclusions
Recommendations
Conflicts of Interest
Appendix A

| Sustainable Development Goal 6. Ensure Availability and Sustainable Management of Water and Sanitation for All | |||
|---|---|---|---|
| Target | Indicator | Tier | Custodian |
| 6.1 By 2030, achieve universal and equitable access to safe and affordable drinking water for all | 6.1.1 Proportion of population using safely managed drinking water services | I | WHO UNICEF |
| 6.2 By 2030, achieve access to adequate and equitable sanitation and hygiene for all and end open defecation, paying special attention to the needs of women and girls and those in vulnerable situations | 6.2.1 Proportion of population using safely managed sanitation services, including a hand-washing facility with soap and water | I | WHO UNICEF |
| 6.3 By 2030, improve water quality by reducing pollution, eliminating dumping and minimizing release of hazardous chemicals and materials, halving the proportion of untreated wastewater and substantially increasing recycling and safe reuse globally | 6.3.1 Proportion of wastewater safely treated | II | WHO UN-Habitat UNSD |
| 6.3.2 Proportion of bodies of water with good ambient water quality | III | UN Environment | |
| 6.4 By 2030, substantially increase water-use efficiency across all sectors and ensure sustainable withdrawals and supply of freshwater to address water scarcity and substantially reduce the number of people suffering from water scarcity | 6.4.1 Change in water-use efficiency over time | III | FAO |
| 6.4.2 Level of water stress: freshwater withdrawal as a proportion of available freshwater resources | II | FAO | |
| 6.5 By 2030, implement integrated water resources management at all levels, including through transboundary cooperation as appropriate | 6.5.1 Degree of integrated water resources management implementation (0–100) | II | UN Environment |
| 6.5.2 Proportion of transboundary basin area with an operational arrangement for water cooperation | II | UNESCO UNECE | |
| 6.6 By 2020, protect and restore water-related ecosystems, including mountains, forests, wetlands, rivers, aquifers and lakes | 6.6.1 Change in the extent of water-related ecosystems over time | III | UN Environment |
| 6.a By 2030, expand international cooperation and capacity-building support to developing countries in water- and sanitation-related activities and programmes, including water harvesting, desalination, water efficiency, wastewater treatment, recycling and reuse technologies | 6.a.1 Amount of water- and sanitation-related official development assistance that is part of a government-coordinated spending plan | I | WHO UN Environment OECD |
| 6.b Support and strengthen the participation of local communities in improving water and sanitation management | 6.b.1 Proportion of local administrative units with established and operational policies and procedures for participation of local communities in water and sanitation management | I | WHO UN Environment OECD |
Appendix B
| Disaggregated SDG 6 | |
|---|---|
| SDG 6 Target | Related SDG Target |
| 6.1 By 2030, achieve universal and equitable access to safe and affordable drinking water for all | 1.4 By 2030, ensure that all men and women, in particular the poor and the vulnerable, have equal rights to economic resources, as well as access to basic services, ownership and control over land and other forms of property, inheritance, natural resources, appropriate new technology and financial services, including microfinance |
| 2.2 By 2030, end all forms of malnutrition, including achieving, by 2025, the internationally agreed targets on stunting and wasting in children under 5 years of age, and address the nutritional needs of adolescent girls, pregnant and lactating women and older persons | |
| 3.2 By 2030, end preventable deaths of newborns and children under 5 years of age, with all countries aiming to reduce neonatal mortality to at least as low as 12 per 1000 live births and under-5 mortality to at least as low as 25 per 1000 live births | |
| 3.3 By 2030, end the epidemics of AIDS, tuberculosis, malaria and neglected tropical diseases and combat hepatitis, water-borne diseases and other communicable diseases | |
| 3.8 Achieve universal health coverage, including financial risk protection, access to quality essential health-care services and access to safe, effective, quality and affordable essential medicines and vaccines for all | |
| 4.1 By 2030, ensure that all girls and boys complete free, equitable and quality primary and secondary education leading to relevant and effective learning outcomes | |
| 4.5 By 2030, eliminate gender disparities in education and ensure equal access to all levels of education and vocational training for the vulnerable, including persons with disabilities, indigenous peoples and children in vulnerable situations | |
| 5.4 Recognize and value unpaid care and domestic work through the provision of public services, infrastructure and social protection policies and the promotion of shared responsibility within the household and the family as nationally appropriate | |
| 10.3 Ensure equal opportunity and reduce inequalities of outcome, including by eliminating discriminatory laws, policies and practices and promoting appropriate legislation, policies and action in this regard | |
| 11.1 By 2030, ensure access for all to adequate, safe and affordable housing and basic services and upgrade slums | |
| 6.2 By 2030, achieve access to adequate and equitable sanitation and hygiene for all and end open defecation, paying special attention to the needs of women and girls and those in vulnerable situations | 1.4 By 2030, ensure that all men and women, in particular the poor and the vulnerable, have equal rights to economic resources, as well as access to basic services, ownership and control over land and other forms of property, inheritance, natural resources, appropriate new technology and financial services, including microfinance |
| 2.2 By 2030, end all forms of malnutrition, including achieving, by 2025, the internationally agreed targets on stunting and wasting in children under 5 years of age, and address the nutritional needs of adolescent girls, pregnant and lactating women and older persons | |
| 3.2 By 2030, end preventable deaths of newborns and children under 5 years of age, with all countries aiming to reduce neonatal mortality to at least as low as 12 per 1000 live births and under-5 mortality to at least as low as 25 per 1000 live births | |
| 3.3 By 2030, end the epidemics of AIDS, tuberculosis, malaria and neglected tropical diseases and combat hepatitis, water-borne diseases and other communicable diseases | |
| 3.8 Achieve universal health coverage, including financial risk protection, access to quality essential health-care services and access to safe, effective, quality and affordable essential medicines and vaccines for all | |
| 4.a Build and upgrade education facilities that are child, disability and gender sensitive and provide safe, non-violent, inclusive and effective learning environments for all | |
| 4.1 By 2030, ensure that all girls and boys complete free, equitable and quality primary and secondary education leading to relevant and effective learning outcomes | |
| 4.5 By 2030, eliminate gender disparities in education and ensure equal access to all levels of education and vocational training for the vulnerable, including persons with disabilities, indigenous peoples and children in vulnerable situations | |
| 5.2 Eliminate all forms of violence against all women and girls in the public and private spheres, including trafficking and sexual and other types of exploitation | |
| 8.8 Protect labour rights and promote safe and secure working environments for all workers, including migrant workers, in particular women migrants, and those in precarious employment | |
| 10.3 Ensure equal opportunity and reduce inequalities of outcome, including by eliminating discriminatory laws, policies and practices and promoting appropriate legislation, policies and action in this regard | |
| 11.1 By 2030, ensure access for all to adequate, safe and affordable housing and basic services and upgrade slums | |
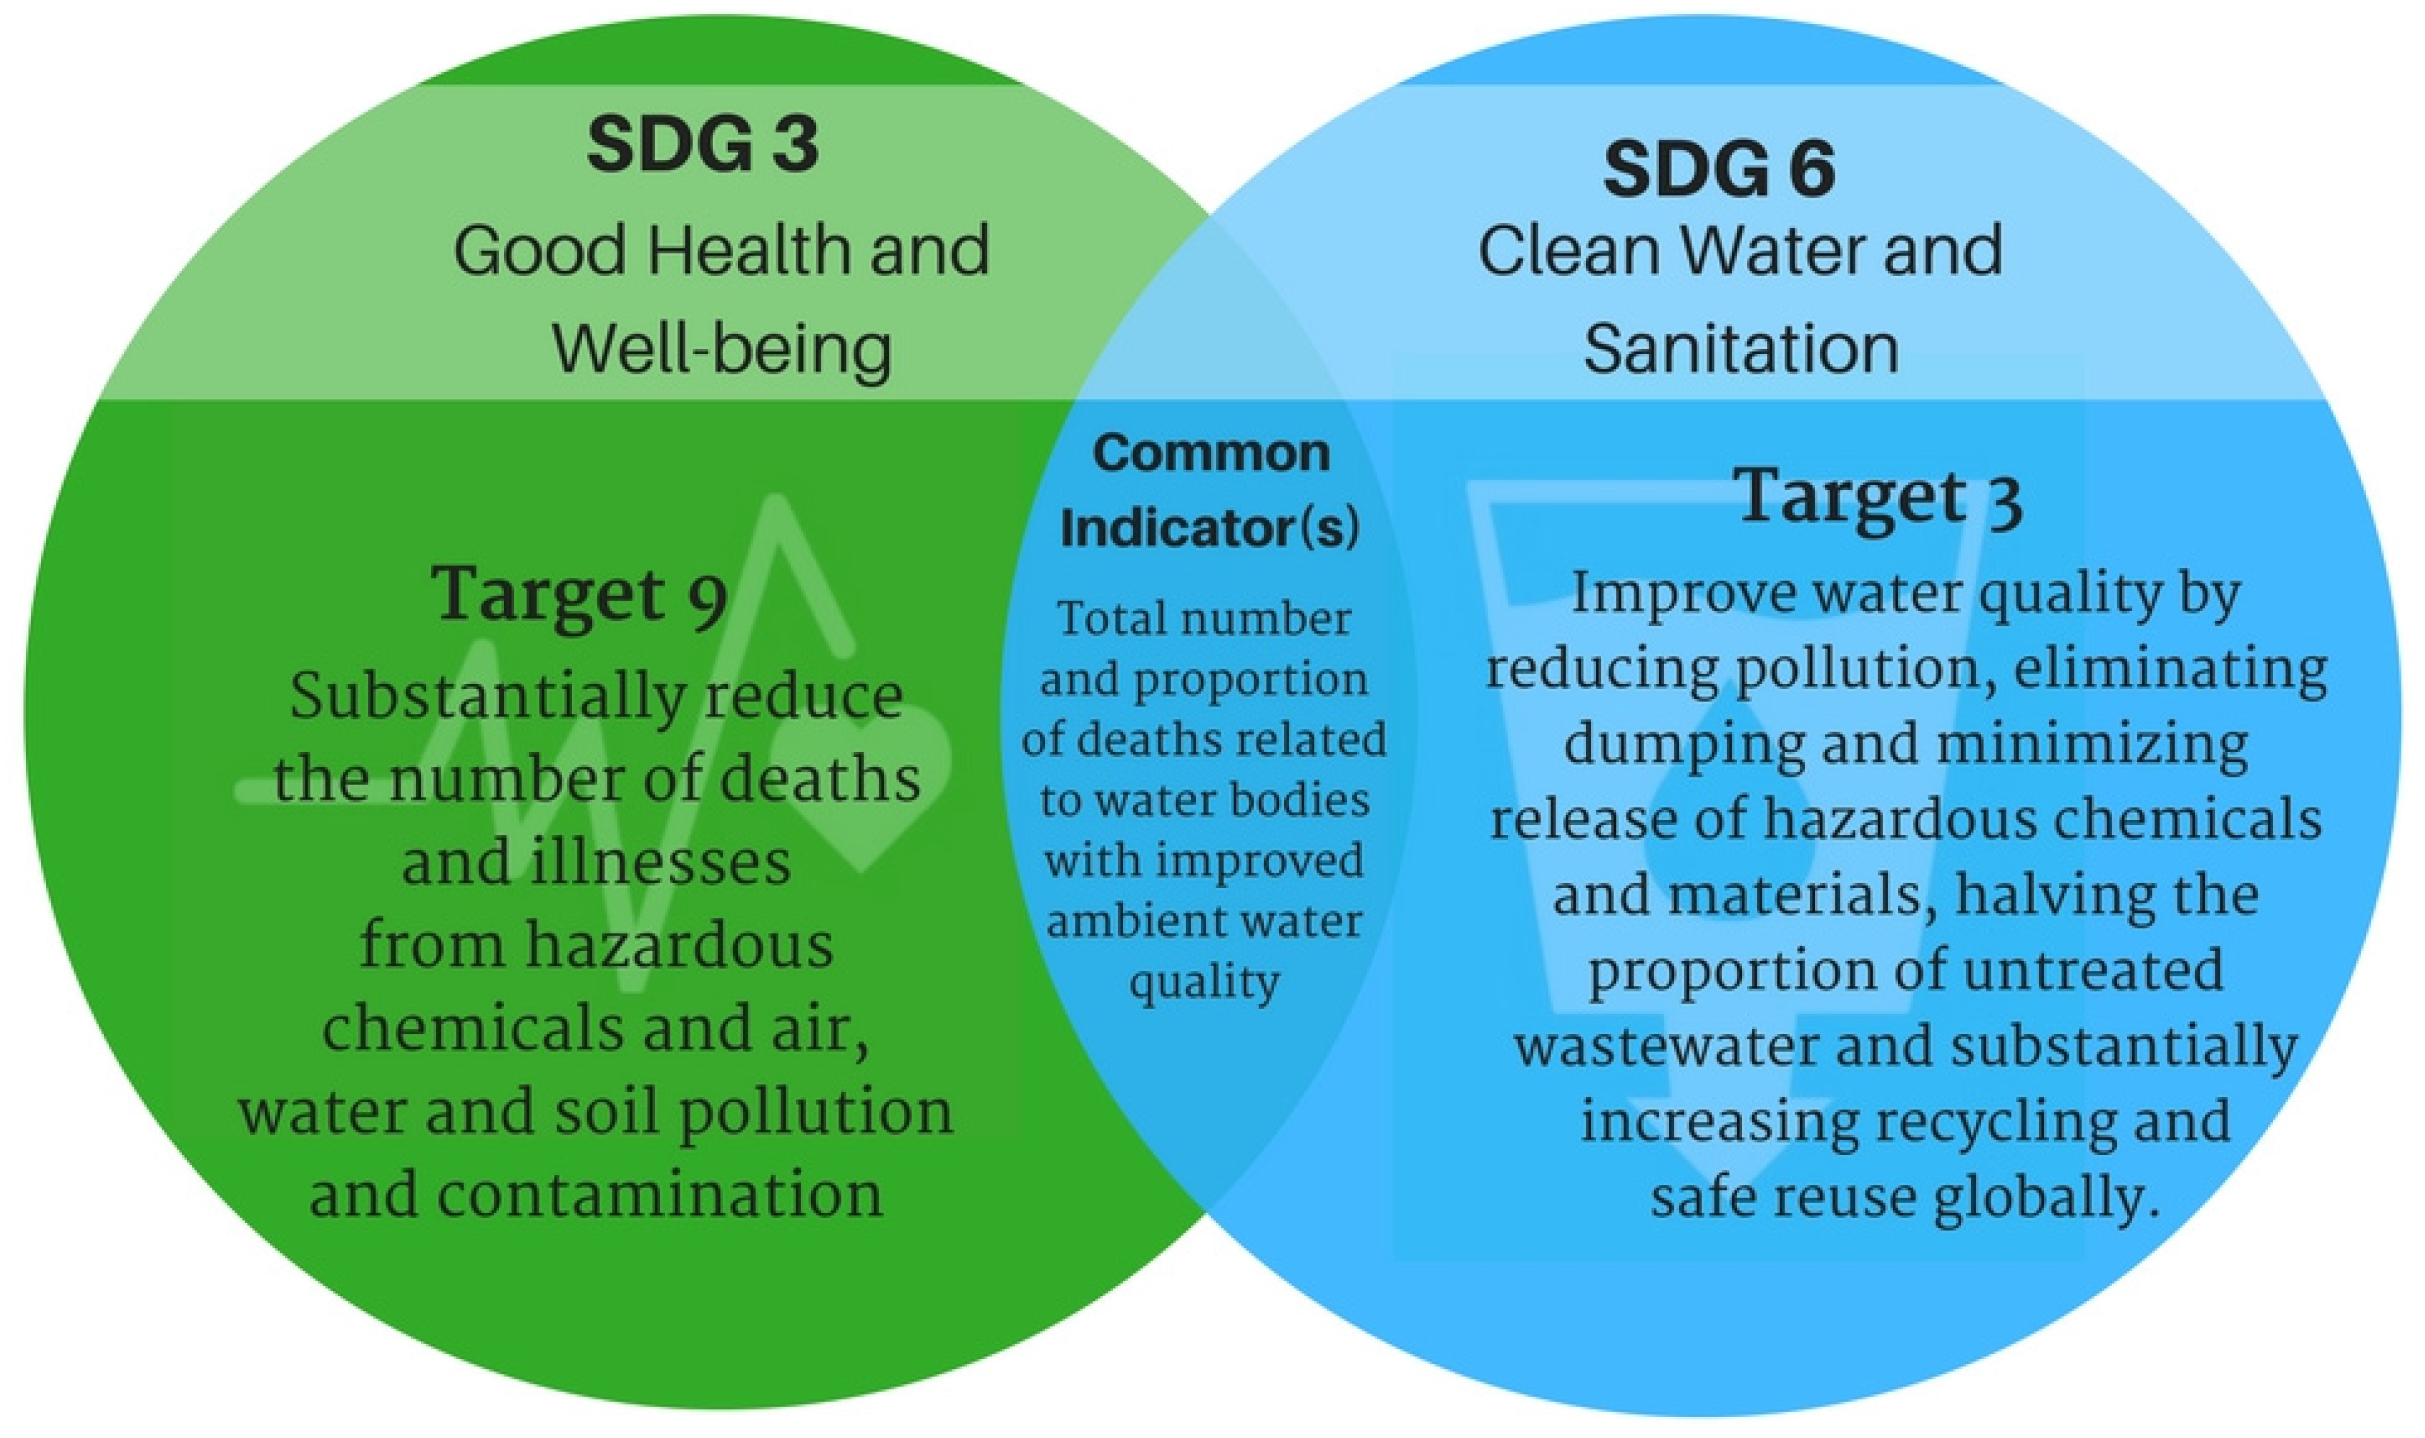
| 6.3 By 2030, improve water quality by reducing pollution, eliminating dumping and minimizing release of hazardous chemicals and materials, halving the proportion of untreated wastewater and substantially increasing recycling and safe reuse globally | 3.3 By 2030, end the epidemics of AIDS, tuberculosis, malaria and neglected tropical diseases and combat hepatitis, water-borne diseases and other communicable diseases |
| 3.9 By 2030, substantially reduce the number of deaths and illnesses from hazardous chemicals and air, water and soil pollution and contamination | |
| 9.4 By 2030, upgrade infrastructure and retrofit industries to make them sustainable, with increased resource-use efficiency and greater adoption of clean and environmentally sound technologies and industrial processes, with all countries taking action in accordance with their respective capabilities | |
| 11.6 By 2030, reduce the adverse per capita environmental impact of cities, including by paying special attention to air quality and municipal and other waste management | |
| 12.4 By 2020, achieve the environmentally sound management of chemicals and all wastes throughout their life cycle, in accordance with agreed international frameworks, and significantly reduce their release to air, water and soil in order to minimize their adverse impacts on human health and the environment | |
| 15.1 By 2020, ensure the conservation, restoration and sustainable use of terrestrial and inland freshwater ecosystems and their services, in particular forests, wetlands, mountains and drylands, in line with obligations under international agreements | |
| 6.4 By 2030, substantially increase water-use efficiency across all sectors and ensure sustainable withdrawals and supply of freshwater to address water scarcity and substantially reduce the number of people suffering from water scarcity | 1.4 By 2030, ensure that all men and women, in particular the poor and the vulnerable, have equal rights to economic resources, as well as access to basic services, ownership and control over land and other forms of property, inheritance, natural resources, appropriate new technology and financial services, including microfinance |
| 1.5 By 2030, build the resilience of the poor and those in vulnerable situations and reduce their exposure and vulnerability to climate-related extreme events and other economic, social and environmental shocks and disasters | |
| 2.4 By 2030, ensure sustainable food production systems and implement resilient agricultural practices that increase productivity and production, that help maintain ecosystems, that strengthen capacity for adaptation to climate change, extreme weather, drought, flooding and other disasters and that progressively improve land and soil quality | |
| 4.7 By 2030, ensure that all learners acquire the knowledge and skills needed to promote sustainable development, including, among others, through education for sustainable development and sustainable lifestyles, human rights, gender equality, promotion of a culture of peace and non-violence, global citizenship and appreciation of cultural diversity and of culture’s contribution to sustainable development | |
| 7.1 By 2030, ensure universal access to affordable, reliable and modern energy services | |
| 7.2 By 2030, increase substantially the share of renewable energy in the global energy mix | |
| 9.4 By 2030, upgrade infrastructure and retrofit industries to make them sustainable, with increased resource-use efficiency and greater adoption of clean and environmentally sound technologies and industrial processes, with all countries taking action in accordance with their respective capabilities | |
| 9.a Facilitate sustainable and resilient infrastructure development in developing countries through enhanced financial, technological and technical support to African countries, least developed countries, landlocked developing countries and small island developing States | |
| 12.2 By 2030, achieve the sustainable management and efficient use of natural resources | |
| 15.1 By 2020, ensure the conservation, restoration and sustainable use of terrestrial and inland freshwater ecosystems and their services, in particular forests, wetlands, mountains and drylands, in line with obligations under international agreements | |
| 6.5 By 2030, implement integrated water resources management at all levels, including through transboundary cooperation as appropriate | 9.1 Develop quality, reliable, sustainable and resilient infrastructure, including regional and trans-border infrastructure, to support economic development and human well-being, with a focus on affordable and equitable access for all |
| 9.4 By 2030, upgrade infrastructure and retrofit industries to make them sustainable, with increased resource-use efficiency and greater adoption of clean and environmentally sound technologies and industrial processes, with all countries taking action in accordance with their respective capabilities | |
| 11.a Support positive economic, social and environmental links between urban, peri-urban and rural areas by strengthening national and regional development planning | |
| 11.b By 2020, substantially increase the number of cities and human settlements adopting and implementing integrated policies and plans towards inclusion, resource efficiency, mitigation and adaptation to climate change, resilience to disasters, and develop and implement, in line with the Sendai Framework for Disaster Risk Reduction 2015–2030, holistic disaster risk management at all levels | |
| 11.5 By 2030, significantly reduce the number of deaths and the number of people affected and substantially decrease the direct economic losses relative to global gross domestic product caused by disasters, including water-related disasters, with a focus on protecting the poor and people in vulnerable situations | |
| 12.2 By 2030, achieve the sustainable management and efficient use of natural resources | |
| 16.1 Significantly reduce all forms of violence and related death rates everywhere | |
| 16.8 Broaden and strengthen the participation of developing countries in the institutions of global governance | |
| 17.6 Enhance North-South, South-South and triangular regional and international cooperation on and access to science, technology and innovation and enhance knowledge-sharing on mutually agreed terms, including through improved coordination among existing mechanisms, in particular at the United Nations level, and through a global technology facilitation mechanism | |
| 17.7 Promote the development, transfer, dissemination and diffusion of environmentally sound technologies to developing countries on favourable terms, including on concessional and preferential terms, as mutually agreed | |
| 17.8 Fully operationalize the technology bank and science, technology and innovation capacity-building mechanism for least developed countries by 2017 and enhance the use of enabling technology, in particular information and communications technology | |
| 6.6 By 2020, protect and restore water-related ecosystems, including mountains, forests, wetlands, rivers, aquifers and lakes | 9.4 By 2030, upgrade infrastructure and retrofit industries to make them sustainable, with increased resource-use efficiency and greater adoption of clean and environmentally sound technologies and industrial processes, with all countries taking action in accordance with their respective capabilities |
| 11.5 By 2030, significantly reduce the number of deaths and the number of people affected and substantially decrease the direct economic losses relative to global gross domestic product caused by disasters, including water-related disasters, with a focus on protecting the poor and people in vulnerable situations | |
| 12.2 By 2030, achieve the sustainable management and efficient use of natural resources | |
| 12.4 By 2020, achieve the environmentally sound management of chemicals and all wastes throughout their life cycle, in accordance with agreed international frameworks, and significantly reduce their release to air, water and soil in order to minimize their adverse impacts on human health and the environment | |
| 12.8 By 2030, ensure that people everywhere have the relevant information and awareness for sustainable development and lifestyles in harmony with nature | |
| 13.3 Improve education, awareness-raising and human and institutional capacity on climate change mitigation, adaptation, impact reduction and early warning | |
| 14.1 By 2025, prevent and significantly reduce marine pollution of all kinds, in particular from land-based activities, including marine debris and nutrient pollution | |
| 15.1 By 2020, ensure the conservation, restoration and sustainable use of terrestrial and inland freshwater ecosystems and their services, in particular forests, wetlands, mountains and drylands, in line with obligations under international agreements | |
| 15.3 By 2030, combat desertification, restore degraded land and soil, including land affected by desertification, drought and floods, and strive to achieve a land degradation-neutral world | |
| 15.8 By 2020, introduce measures to prevent the introduction and significantly reduce the impact of invasive alien species on land and water ecosystems and control or eradicate the priority species | |
| 15.9 By 2020, integrate ecosystem and biodiversity values into national and local planning, development processes, poverty reduction strategies and accounts | |
References
- Castells, Manuel. 2000. End of Millennium, The Information Age: Economy, Society and Culture. Malden: Wiley-Blackwell, vol. III. [Google Scholar]
- Hayashi, Chikio. 1998. What is Data Science? Fundamental Concepts and a Heuristic Example. In Data Science, Classification, and Related Methods. Studies in Classification, Data Analysis, and Knowledge Organization. Edited by Chikio Hayashi, Yajima Keiji, Bock Hans-Hermann, Ohsumi Noboru, Tanaka Yutaka and Baba Yasumasa. Tokyo: Springer, pp. 40–51. [Google Scholar]
- High-Level Group for Partnership, Coordination and Capacity-Building. 2017. Cape Town Global Action Plan for Sustainable Development Data. Available online: https://undataforum.org/WorldDataForum/wp-content/uploads/2017/01/Cape-Town-Action-Plan-For-Data-Jan2017.pdf (accessed on 25 December 2017).
- Hilbert, Martin. 2016. Big Data for Development: A Review of Promises and Challenges. Development Policy Review 34: 135–74. [Google Scholar] [CrossRef]
- IAEG-SDG. 2016. Compilation of Metadata for the Proposed Global Indicators for the Review of the 2030 Agenda for Sustainable Development. UN Statistics Division Inter-Agency Expert Group on SDG Indicators 4 March. Available online: https://unstats.un.org/sdgs/iaeg-sdgs/metadata-compilation/ (accessed on 4 November 2017).
- Kalow, Jared, and Megan O’Donnell. 2017. To Leave No One Behind, Data Disaggregation Needs to Catch Up. Center for Global Development. Available online: https://www.cgdev.org/ (accessed on 25 December 2017).
- Lucci, Paula. 2015. Localising the Post-2015 Agenda: What Does It Mean in Practice? London: Overseas Development Institute. [Google Scholar]
- Microsoft Developer Network. 2018. Globalization and Localization. Available online: https://msdn.microsoft.com/en-us/library/cc194762.aspx (accessed on 25 December 2017).
- Morten, Jerven. 2014. Benefits and Costs of the Data for Development Targets for the Post-2015 Development Agenda. Copenhagen Consensus Center. Available online: http://www.copenhagenconsensus.com/publication/post-2015-consensus-data-development-assessment-jerven (accessed on 25 December 2017).
- National Science Foundation. 2005. Long-Lived Digital Data Collections Enabling Research and Education in the 21st Century. Available online: https://www.nsf.gov/pubs/2005/nsb0540/ (accessed on 25 December 2017).
- Office of the High Commissioner on Human Rights. 2016. A HUMAN RIGHTS-BASED APPROACH TO DATA: Leaving No One Behind in the 2030 Development Agenda. Available online: http://www.ohchr.org/Documents/Issues/HRIndicators/GuidanceNoteonApproachtoData.pdf (accessed on 25 December 2017).
- Oxford English Dictionary. 2018. Available online: https://en.oxforddictionaries.com/definition/subsidiarity (accessed on 25 December 2017).
- Patole, M. 2010. The Effect of Water Services Reforms on Peri-Urban Water Supply in Developing Countries. Scotland: University of Dundee. [Google Scholar]
- Poku, Nana K., and Jim Whitman. 2011. The Millennium Development Goals and Development after 2015. Third World Quarterly 32: 181–98. [Google Scholar] [CrossRef]
- Press, Gil. 2013. A Very Short History of Data Science. Forbes. May 28. Available online: https://www.forbes.com/sites/gilpress/2013/05/28/a-very-short-history-of-data-science/#78ed70c455cf (accessed on 25 December 2017).
- Prüss-Üstün, Annette, Robert Bos, Fiona Gore, and Jamie Bartram. 2008. Safer Water, Better Health: Costs, Benefits and Sustainability of Interventions to Protect and Promote Health. Geneva: World Health Organization. [Google Scholar]
- Stuart, Elizabeth, Emma Samman, William Avis, and Tom Berliner. 2015. The Data Revolution: Finding the Missing Millions. ODI Research Report 3. London: Overseas Development Institute (ODI). [Google Scholar]
- The Glossary of Education Reform. 2015. Available online: http://edglossary.org (accessed on 25 December 2017).
- UN. 2015. Addis Ababa Action Agenda. Paper presented at Addis Ababa Action Agenda of the Third International Conference on Financing for Development, Financing for Development, Addis Ababa, Ethiopia, July 13–16. [Google Scholar]
- UN Development Program. 2016. Transitioning from the MDGs to the SDGs. Available online: http://www.undp.org/content/undp/en/home/librarypage/sustainable-development-goals/transitioning-from-the-mdgs-to-the-sdgs.html (accessed on 25 December 2017).
- UN Economic and Social Council. 2016. Report of the Inter-Agency and Expert Group on Sustainable Development Goal Indicators. New York: United Nations. [Google Scholar]
- UN General Assembly. 2015. Resolution Adopted by the General Assembly on 25 September 2015: 70/1. New York: United Nations. [Google Scholar]
- UN Millenium Development Goals. 2015. Available online: http://www.un.org/millenniumgoals/environ.shtml (accessed on 25 December 2017).
- UN Population Division. 2017. The 2017 Revision of World Population Prospects. Available online: https://esa.un.org/unpd/wpp/ (accessed on 25 December 2017).
- UN Statistics Division Inter-agency Expert Group on Sustainable Development Goal Indicators. 2015. Available online: https://unstats.un.org/sdgs/iaeg-sdgs/ (accessed on 25 December 2017).
- UN Sustainable Development Goals. 2015. Available online: http://www.un.org/sustainabledevelopment/sustainable-development-goals (accessed on 25 December 2017).
- Unwin, Tim. 2009. ICT4D: Information and Communication Technology for Development. Cambridge: Cambridge University Press, p. 9. [Google Scholar]
- World Bank. 2004. Marrakech Action Plan for Statistics. Available online: http://www.worldbank.org/en/data/statistical-capacity-building/marrakech-action-plan-for-statistics (accessed on 25 December 2017).
- World Health Organization (WHO) and the United Nations Children’s Fund (UNICEF). 2017. Progress on Drinking Water, Sanitation and Hygiene: 2017 Update and SDG Baselines. Available online: http://www.who.int/mediacentre/news/releases/2017/launch-version-report-jmp-water-sanitation-hygiene.pdf (accessed on 25 December 2017).
| 1 | “The principle that a central authority should have a subsidiary function, performing only those tasks which cannot be performed at a more local level” (Oxford English Dictionary 2018). |
| 2 | The initiative is supported by UN Habitat, UNDP, and the Global Taskforce of Local and Regional Governments. For more information: http://localizingthesdgs.org/about-us.php. |
| 3 | An exabyte (EB) is the equivalent of 1 billion gigabytes. |
| 4 | UN SDG 2015: Target 17.18, “By 2020, enhance capacity-building support to developing countries, including for least developed countries and small island developing States, to increase significantly the availability of high-quality, timely and reliable data disaggregated by income, gender, age, race, ethnicity, migratory status, disability, geographic location and other characteristics relevant in national contexts”. For more information, please see http://www.un.org/sustainabledevelopment/sustainable-development-goals/. |
| 5 | UN SDG 2015: Target 17.19, “By 2030, build on existing initiatives to develop measurements of progress on sustainable development that complement gross domestic product, and support statistical capacity building in developing countries”. For more information, please see http://www.un.org/sustainabledevelopment/sustainable-development-goals/. |
| 6 | For more information, please see the UN IAEG-SDG website at https://unstats.un.org/sdgs/iaeg-sdgs/. |
| 7 | For more information, please see the UN IAEG-SDG website at https://unstats.un.org/sdgs/iaeg-sdgs/. |
| 8 | For more information, please see https://unstats.un.org/sdgs/meetings/iaeg-sdgs-meeting-05/. |
| 9 | Ibid. |
| 10 | Supra 6. |
| 11 | Basic drinking water service is defined as Drinking water from an improved source, provided collection time is not more than 30 minutes for a round trip, including queuing. For more information, see http://www.who.int/water_sanitation_health/publications/jmp-2017/en/. |
| 12 | Supra 11. Basic sanitation services is defined as Use of improved facilities that are not shared with other households. |
| 13 | Supra 1. Indicator 3.9.2: Mortality rate attributed to unsafe water, unsafe sanitation and lack of hygiene (exposure to unsafe Water, Sanitation and Hygiene for All (WaSH) services). |
| 14 | Supra 1. Indicator 11.5.1: Number of deaths, missing persons and directly affected persons attributed to disasters per 100,000 population. |
| 15 | Supra 42. |
| 16 | For more information, please see the proceedings of the Sixth Meeting of the IAEG-SDGs at https://unstats.un.org/sdgs/meetings/iaeg-sdgs-meeting-06/. |


| Goal 6. Ensure Availability and Sustainable Management of Water and Sanitation for All | |||
|---|---|---|---|
| Target | Indicator | Tier | Custodian |
| 6.1 By 2030, achieve universal and equitable access to safe and affordable drinking water for all | 6.1.1 Proportion of population using safely managed drinking water services | I | WHO UNICEF |
| 6.2 By 2030, achieve access to adequate and equitable sanitation and hygiene for all and end open defecation, paying special attention to the needs of women and girls and those in vulnerable situations | 6.2.1 Proportion of population using safely managed sanitation services, including a hand-washing facility with soap and water | I | WHO UNICEF |
| 6.3 By 2030, improve water quality by reducing pollution, eliminating dumping and minimizing release of hazardous chemicals and materials, halving the proportion of untreated wastewater and substantially increasing recycling and safe reuse globally | 6.3.1 Proportion of wastewater safely treated | II | WHO UN-Habitat UNSD |
| 6.3.2 Proportion of bodies of water with good ambient water quality | III | UN Environment | |
| Disaggregated SDG 6 | ||
|---|---|---|
| SDG 6 Target | Related SDG Target | Potential Common Criteria and Variables |
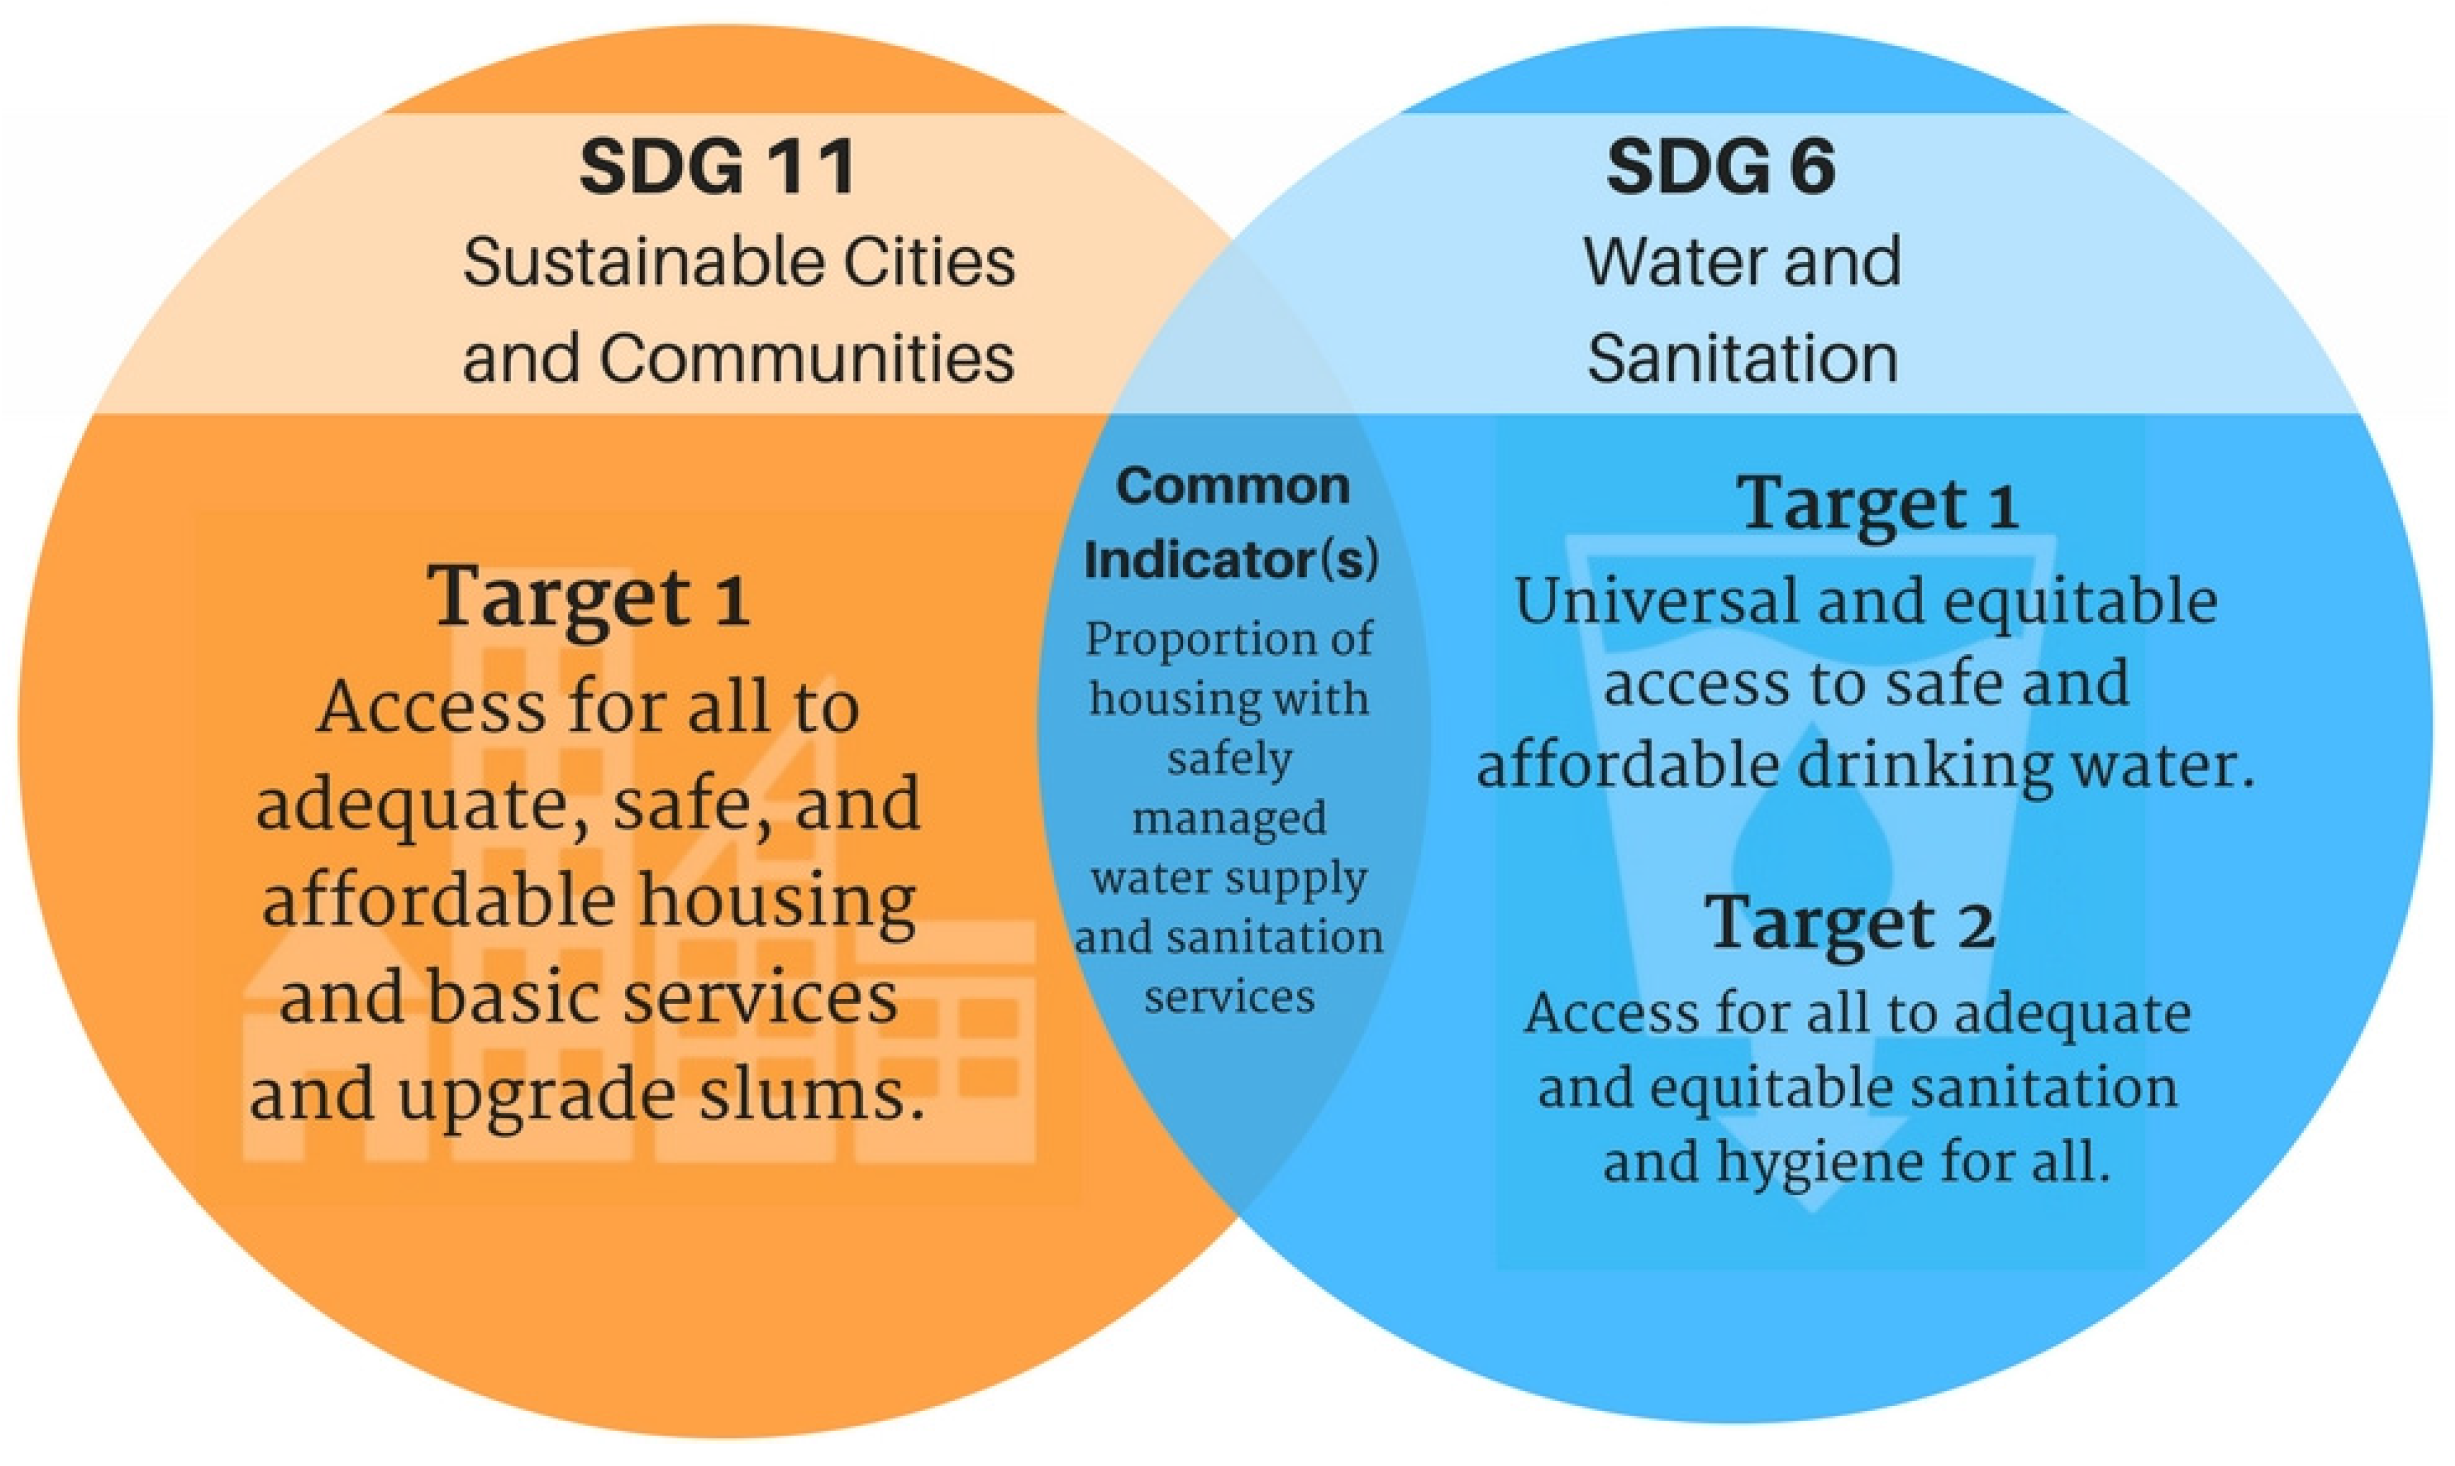
| 6.1 By 2030, achieve universal and equitable access to safe and affordable drinking water for all | 11.1 By 2030, ensure access for all to adequate, safe and affordable housing and basic services and upgrade slums | Criteria: Age, Sex, Income, Location, Vulnerable Population |
| Variable: Distance to drinking water point, Hours of drinking water service | ||
| 6.2 By 2030, achieve access to adequate and equitable sanitation and hygiene for all and end open defecation, paying special attention to the needs of women and girls and those in vulnerable situations | 11.1 By 2030, ensure access for all to adequate, safe and affordable housing and basic services and upgrade slums | Criteria: Age, Sex, Income, Location, Vulnerable Population |
| Variable: Distance from Domicile to Sanitary Facility | ||
| 6.3 By 2030, improve water quality by reducing pollution, eliminating dumping and minimizing release of hazardous chemicals and materials, halving the proportion of untreated wastewater and substantially increasing recycling and safe reuse globally | 3.9 By 2030, substantially reduce the number of deaths and illnesses from hazardous chemicals and air, water and soil pollution and contamination | Criteria: Mortality rate, Pollution type, |
| Variable: Percent water treated, water-related child mortality rate | ||
© 2018 by the author. Licensee MDPI, Basel, Switzerland. This article is an open access article distributed under the terms and conditions of the Creative Commons Attribution (CC BY) license (http://creativecommons.org/licenses/by/4.0/).
Share and Cite
Patole, M. Localization of SDGs through Disaggregation of KPIs. Economies 2018, 6, 15. https://doi.org/10.3390/economies6010015
Patole M. Localization of SDGs through Disaggregation of KPIs. Economies. 2018; 6(1):15. https://doi.org/10.3390/economies6010015
Chicago/Turabian StylePatole, Manohar. 2018. "Localization of SDGs through Disaggregation of KPIs" Economies 6, no. 1: 15. https://doi.org/10.3390/economies6010015
APA StylePatole, M. (2018). Localization of SDGs through Disaggregation of KPIs. Economies, 6(1), 15. https://doi.org/10.3390/economies6010015