Sets of Sustainable Development Indicators in Vietnam: Status and Solutions

Abstract
:1. Introduction
2. Methodology
3. Sustainable Development Indicators and Sustainable Development Goals Indicators in Vietnam
3.1. Sustainable Development Indicators
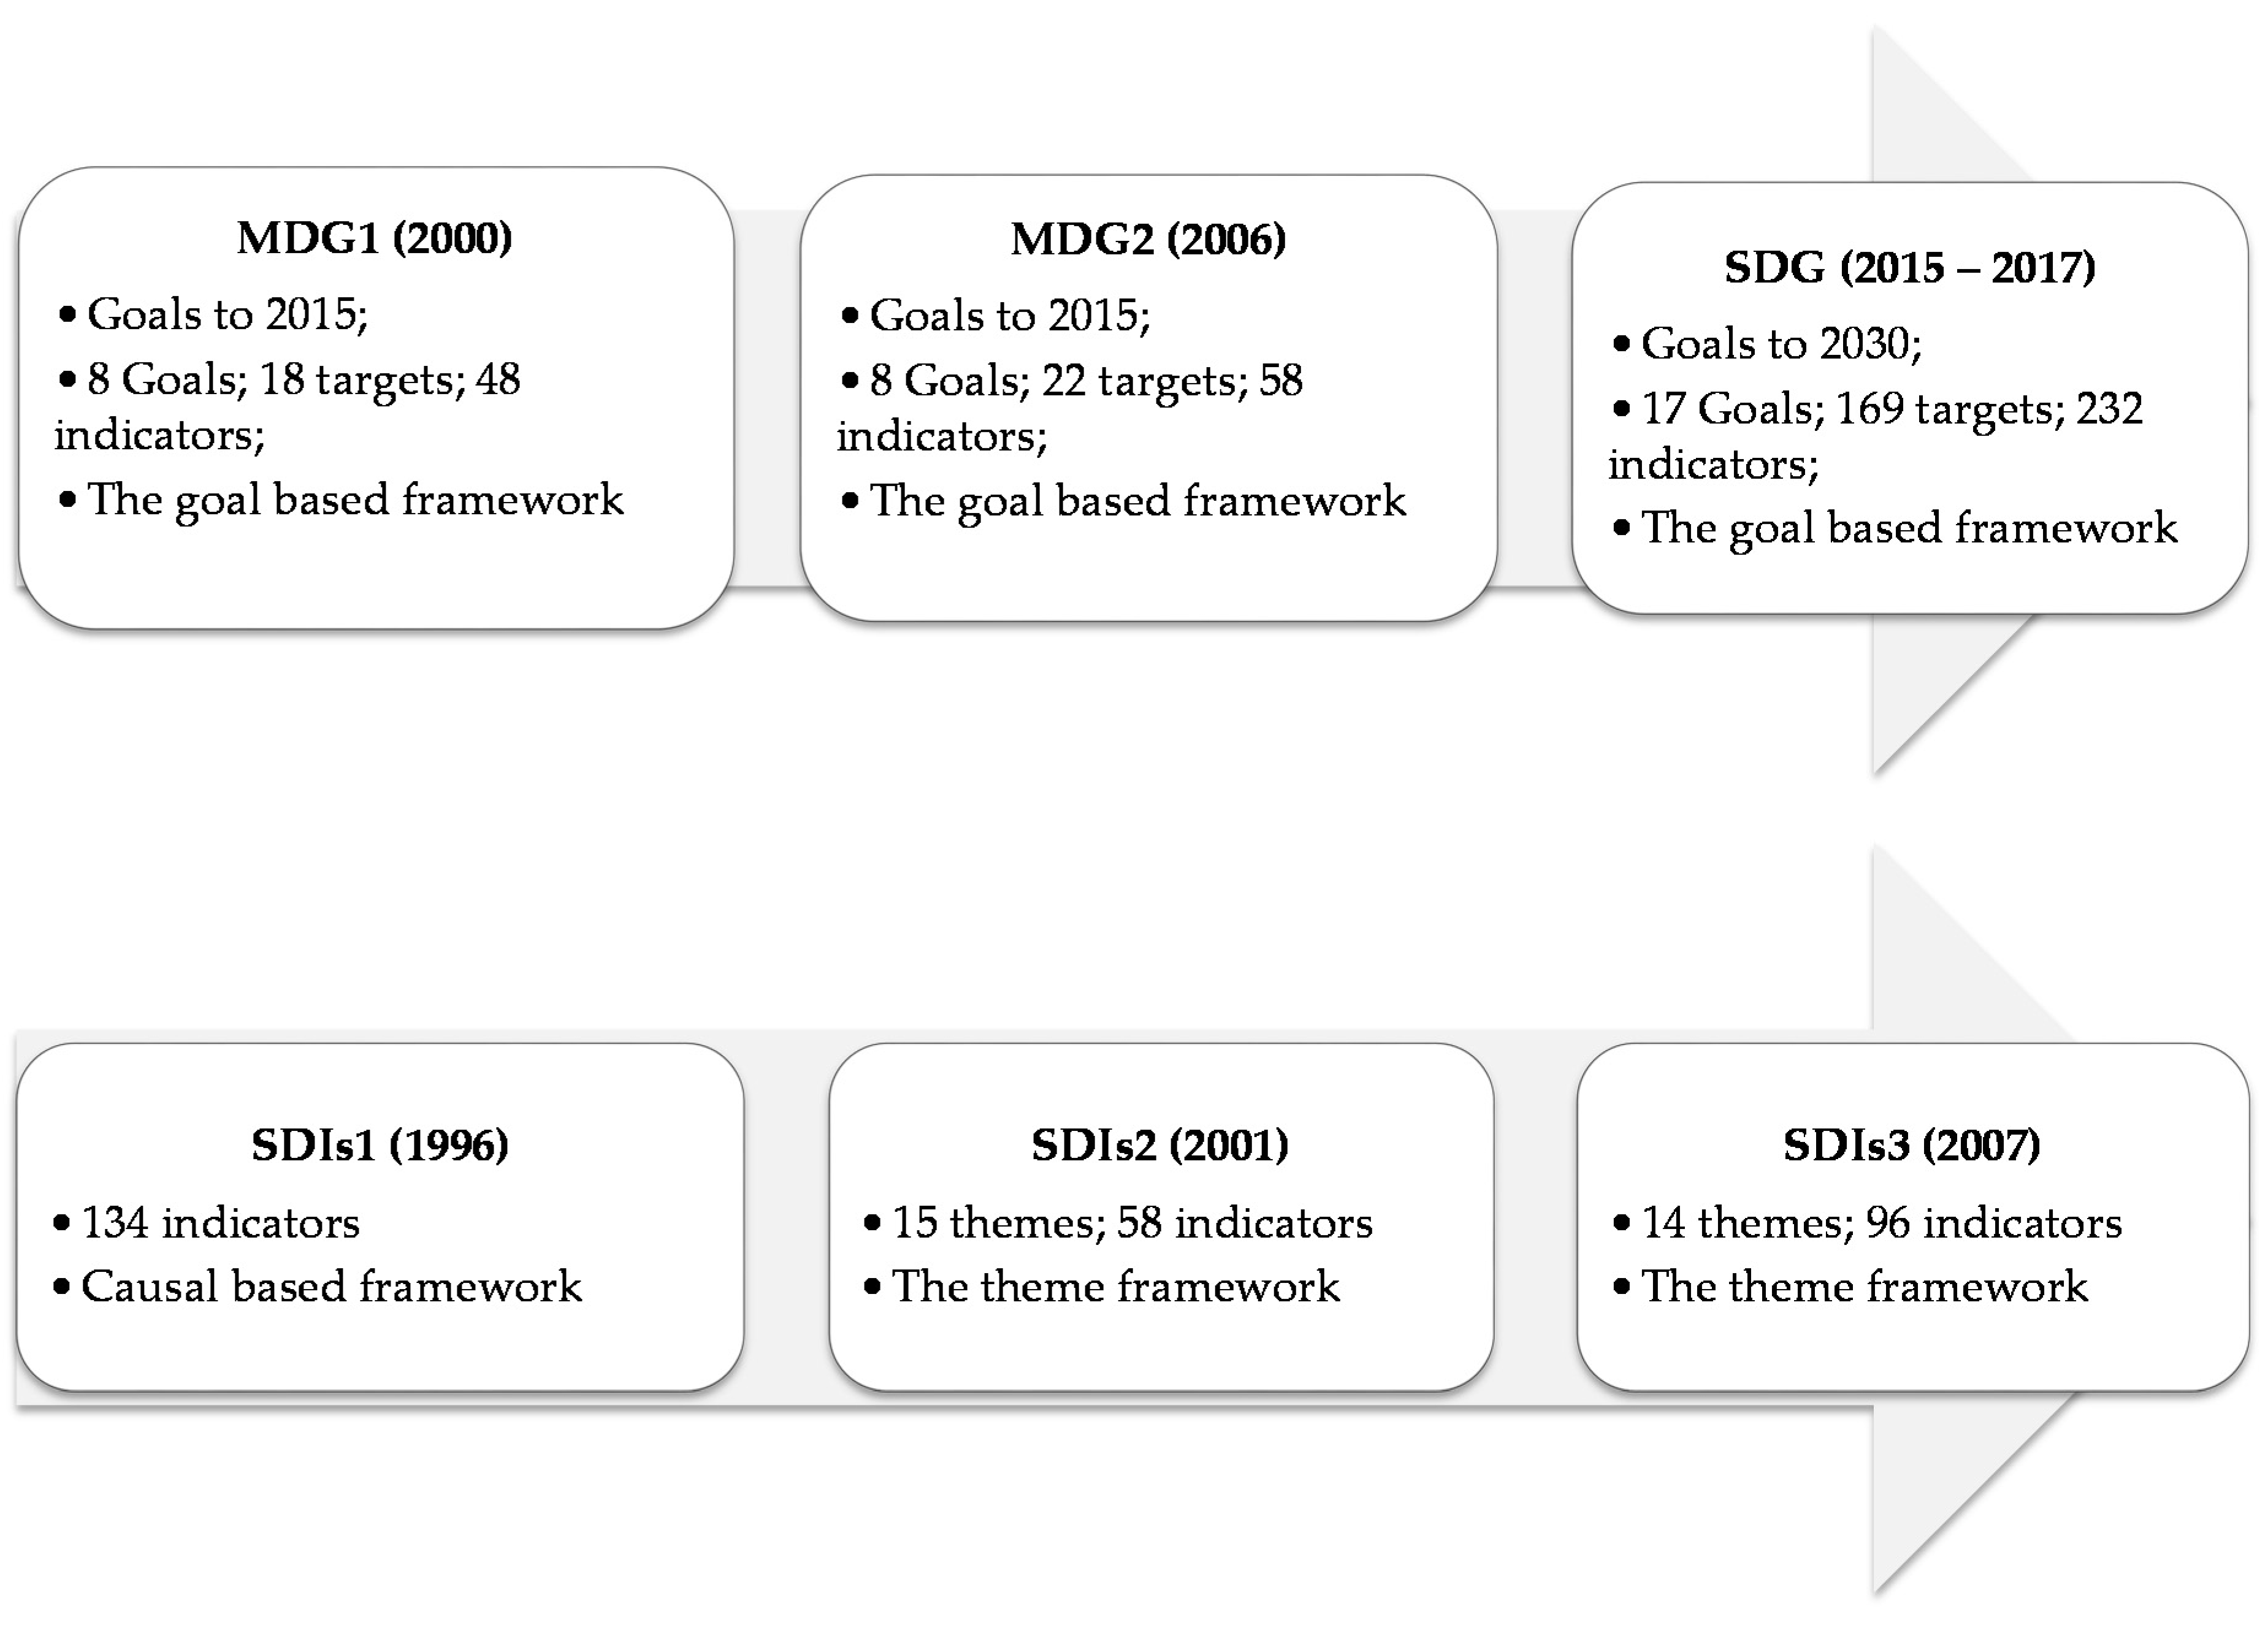
3.2. The Millennium Development Goals and Sustainable Development Goals Indicators
4. Discussion
5. Conclusions
Acknowledgments
Author Contributions
Conflicts of Interest
Appendix A

| Pillar | Indicator |
|---|---|
| Economic | GDP per capita (USD; VND) |
| GDP growth (%) | |
| The economic structure (%) | |
| Share of women employment in the agricultural sector (%) | |
| Investment share in GDP (%) | |
| ODA and FDI share in total investment (%) | |
| Gross domestic expenditure on R&D as a percent of GDP (%) | |
| Gross domestic expenditure on education as a percent of GDP (%) | |
| Balance import and export goods (USD; VND) | |
| Debt to GDP ratio (%) | |
| Annual energy consumption/GDP | |
| Ratio of waste recycle | |
| Social | Total population(millions population) |
| Proportion of population living below national poverty line (%) | |
| GINI index | |
| Ratio of man salary to woman (%) | |
| Maternal Mortality Rate (%) | |
| Under-five malnutrition rate (%) | |
| Unemployment ratio in urban (%) | |
| Average life expectancy (Year) | |
| Proportion of population using an improved water source (%) | |
| Adult literacy rate (%) | |
| Rate of Adult secondary schooling attainment level (%) | |
| College student per 1000 population (0/00) | |
| Rate of educated labor (%) | |
| Proportion of population assessing modern communication technologies (%) | |
| Average square of house per population(m2/người) | |
| Ratio of criminal per 100,000 population | |
| Ratio of traffic accident per 100,000 population | |
| Environmental | Ratio of land area covered by forests (%) |
| Portation of irrigate agriculture land (%) | |
| Portation of nature conservation forest (%) | |
| Rate of degaradation soil (%) | |
| Ratio of mine ores | |
| Ratio of industrial zone own waste treatment systems (%) | |
| Number of business achieved ISO 14001 (%) | |
| Emissions of greenhouse gases (tấn/năm) | |
| Ratio of urban area that pollution concentration in the air exceeds Vietnamese standards | |
| Number of threatened ecology systems and extinct species | |
| Product yield of fishery (1000 ton) | |
| Human and economic loss due to natural disasters | |
| Institutional | Number of provinces built Agenda 21 |
| Number of offices and number of employees activity in sustainable development field | |
| Mobilizing financial resources for hunger eradication and poverty reduction: The ODA invest to hunger elimination and poverty reduction |
Appendix B
| Indicators | 2015 | 2020 |
|---|---|---|
| COMPOSITE INDEX | ||
| Green GDP (VND or USD) | - | - |
| HDI (0–1) | Achievement of the world’s average | Achievement of the world’s high average |
| Sustainability Environment Index (0–1) | - | - |
| ECONOMIC | ||
| ICOR | <5.0 | <5.0 |
| Productivity of social labour (USD/employee) | 3900–4000 | 6100–6500 |
| Share of total factor productivity in growth rate | 30.0 | 35.0 |
| Reduction of energy consumption to produce one unit of gross domestic product | 2.5–3%/year | 2.5–3%/year |
| Share of renewable energy sources in total energy use (%) | 4 | 5 |
| CPI (% compare to last 12 months) | Average of 5 years < 10 | Average of 5 years < 5 |
| Drawing account (bilions USD) | −3.1 | <−3.0 |
| State budget deficit over GDP (%/GDP) | 4.5 | <4.0 |
| Government dept (%/GDP) | 60–65 | <55.0 |
| Foreign dept (%/GDP) | <50.0 | <50.0 |
| SOCIAL | ||
| Proportion of population living below national poverty line (%) | Average reduction 1.5–2%/year | Average reduction 1.5–2%/year |
| Ratio of unemployment to population in working age (%) | <3.00 | <3.00 |
| Proportion of educated employee (%) | 55 | >70 |
| GINI index | <5.0 | <5.0 |
| Sex ratio at birth (boys/100 girls) | 113 | 115 |
| Ratio of student per 10000 population | 300 | 450 |
| Internet users per 100 population | 8.5 (Big bandwidth) | 20 (Big bandwidth) |
| Proportion of people enjoying social insurance, health insurance and unemployment insurance (%) | Social: 38 Health: 75 Unemployment: 73 | Social: 51 Health: 80 Unemployment: 84.5 |
| Number of deaths due to traffic acidents per 100,000 population | 11 | 9 |
| Proportion of communes achieve the standart of new rural criteria | 20 | 50 |
| ENVIRONMENTAL | ||
| Proportion of land area covered by forests (%) | 42–43 | 45 |
| Proportion of protected land and maintained biodiversity land | - | - |
| Area of degradation land (milions ha) | - | - |
| Use of groundwater and surface water (m3/persion/year) | - | 1770 |
| Ratio of days which pollution concentration in the air exceeds Vietnamese standards in a year (%) | - | - |
| Ratio of industrial zone, manufacturing area own waste treatment systems that meets Vietnamese standards (%) | 60 | 70 |
| The ratio of solid waste collected and treated meets Vietnamese standard (%) | 85 | 90 |
Appendix C
| I. GENENERAL INDICATORS |
|---|
| Indicator name |
| COMPOSITE INDEX |
| Human Development Index |
| ECONOMIC |
| The ratio of investment for development to GDP (%) |
| ICOR |
| Productivity of social labour (milion VND per employee) |
| Ratio of budget revenue to budget expenditure (%) |
| Area of rice land is protected and maintained (ha) |
| Uncompulsory indicator * |
| Share of total factor productivity in growth rate (%) |
| Reduction of energy consumption to produce one unit of gross domestic product (%) |
| SOCIAL |
| Proportion of poverty household (%) |
| Ratio of unemployment to population in working age (%) |
| Proportion of educated employee (%) |
| GINI index |
| Sex ratio at birth (boys/100 girls) |
| Proportion of people paying social insurance, unemployment insurance and health insurance (%) |
| Ratio of budget expenditures for cultural and sport activities (%) |
| Proportion of communes achieve the standart of new rural criteria (%) |
| Under-five mortality rate (%) |
| Number of deaths due to traffic accidents per 100,000 population |
| Ratio of pupils attending high school at the age (%) |
| ENVIRONMENTAL |
| Proportion of population using an improved sanitation facility (%) |
| Proportion of protected land and maintained biodiversity land (%) |
| Area of degradation land (ha) |
| Ratio of urban, industrial zone, manufacturing area own waste treatment systems that meets Vietnamese standards (%) |
| Proportion of land area covered by forests (%) |
| The ratio of solid waste collected and treated (%) |
| Number of disasters and extent of damage (case, millions VND) |
| Uncompulsory indicators * |
| The proportion of mineral mining projects is performed environment recover (%) |
| Number of projects is built following Clean Development Mechanism (CDM) |
| II. REGION SPECIFIC LOCALIZATION INDICATOR |
| MIDLANDS AND MOUNTAINS AREAS |
| The number of cases and areas of forest are burnt and destroyed (case, ha) |
| DELTA AREAS |
| Ratio of annual crop area is irrigated (%) |
| Uncompulsory indicator * |
| Ratio of protected wetland and biodiversity land areas (%) |
| COASTAL AREA |
| Uncompulsory indicator * |
| The content of some organic substances in estuarine, seawater (mg/L) |
| Area of mangroves is protected and biodiversity maintained (ha) |
| CITIES UNDER THE CENTRAL GOVERNMENT |
| Housing area per capita (m2) |
| Use of groundwater and surface water (m3/persion/year) |
| Uncompulsory indicator * |
| Share of investment for renovation and maintenance of historical relics and tourist sites (%) |
| Area of urban greenery per capita (m2/population) |
| Ratio of days which pollution concentration in the air exceeds Vietnamese standards in a year (%) |
| RURAL AREAS |
| Product value per hectare of cultivated land and aquaculture (millions VND) |
| Proportion of rural population using hygienic water (%) |
| Ratio of solid waste is collected and treated (%) |
| Uncompulsory indicator * |
| The amount of chemical fertilizer, pesticides on average 1 hectare of arable land (kg/ha) |
| The rate of solid waste in traditional crafts village is collected and treated (%) |
Appendix D
| Theme | Subtheme | Indicators |
|---|---|---|
| 1. ECONOMIC | ||
| Economic development | Macroeconomic performance | GDP per capital (VND/person) |
| Green GDP per capita (VND/person) | ||
| Investment share in GDP (%) | ||
| Consumer Price Index (CPI) (% compare to last 12 months) | ||
| Sustainable public finance | Ratio of budget revenue to total budget (%) | |
| Employment | Ratio of unemployment to population to population (%) | |
| Ratio of minority unemployment to population to minority population (%) | ||
| Productivity of social labour (milion VND per employee) | ||
| Share of women in wage employment in the non-agricultural sector (%) | ||
| Information and communication technologies | Internet users per 10,000 population | |
| Tourism | Tourism contribution to GDP (%) | |
| Global economic partnership | External financing | Rate of ODA to GDP (%) |
| Rate of FDI to GDP (%) | ||
| Consumption and production patterns | Material consumption | Product values obtained from 1ha culitvating land per fertlizers weights used for the land (VND/ha/kg) |
| Energy use | Number of kwh electricity use for agriculture–forestry–fishery/GDP in agriculture–forestry–fishery (kw/millions VND) | |
| Number of kwh electricity use for industry–construction/GDP in industry–construction (kw/millions VND) | ||
| Number of kwh electricity use for trade–tourist–service/GDP in trade–tourist–service (kw/millions VND) | ||
| Waste generation and management | The proportion of treated hazardous wastes meets the Vietnamese standard (%) | |
| The proportion of collected, treated solid wastes meets the Vietnamese standar (%) | ||
| Transportation | Percentage of passengers transported by road / total passenger transport (%) | |
| Percentage of goods transported by road / total freight (%) | ||
| 2. SOCIAL | ||
| Poverty | Income poverty | Rate of poverty in rural (%) |
| Rate of poverty in Ethnic community (%) | ||
| Income inequality | GINI index | |
| Sanitation | Proportion of rural households having hygienic toilet (%) | |
| Drinking water | Proportion of urban population is provided clean water (%) | |
| Proportion of rural population is provided hygienic water (%) | ||
| Access to energy | Proportion of rural households using electricity for daily life (%) | |
| Living conditions | Proportion of urban households living at home is lacking in solidarity and simplicity (%) | |
| Governance | Corruption | Number of defendants who are officials, civil servan cadres and civil servants/1000 cadres and civil servants |
| Crime | Number of defendants/10,000 population | |
| Health | Mortality | Under-five mortality rate (%) |
| Under-five mortality rate in ethnic community (%) | ||
| Health care delivery | Proportion of hospital beds per 10,000 population | |
| Proportion of doctors per 10,000 populations (%) | ||
| Immunization against infectious childhood diseases (%) | ||
| Immunization against infectious childhood diseases in ethnic community (%) | ||
| Nutritional status | Under-five malnutrition rate (%) | |
| Under-five malnutrition rate in ethnic community (%) | ||
| Health status and risks | Malaria death rate per 10,000 populations (%) | |
| Malaria death rate per 10,000 population ethnic community (%) | ||
| Ratio of HIV infected people per 10,000 populations (%) | ||
| Average life expectancy (năm) | ||
| Education | Education level | Percentage of pupils completing primary school (%) |
| Ratio of enrolment rate in primary education (%) | ||
| Adult tertiary schooling attainment level (%) | ||
| Literacy | Adult literacy rate (%) | |
| Culture | Rate of villages achieve Vietnamese standard in culture (%) | |
| Demographics | Population | Natural population growth rate (%) |
| Net-emigration rate (%) | ||
| 3. ENVIRONMENTAL | ||
| Natural hazards | Vulnerability to natural hazards | Percentage of population living in hazard prone areas (%) |
| Disaster preparedness and response | Human loss due to natural disasters per 10,000 populations (%) | |
| Economic loss due to natural disasters/GDP(%) | ||
| Atmosphere | Climate change | Carbon dioxide emissions in industry area |
| Air quality | Sample rate of dust content in air at specific place exceeds Vietnamese standards (%) | |
| Sample rate of SO2 content in air at specific place exceeds Vietnamese standards (%) | ||
| Sample rate of NO2 content in air at specific place exceeds Vietnamese standards (%) | ||
| Sample rate of noise level in air at specific place exceeds Vietnamese standards (%) | ||
| Land | Land use and status | Rate of change of agricultural land (after 5 years) (%) |
| Rate of change of forest land (after 5 years) (%) | ||
| Erosion (ton/ha/year) | ||
| Desertification | Ratio of heavy drought area (SPI) <−1.5) (%) | |
| Agriculture | Proportion of annual agricultural land area / suitable cultivated area (%) | |
| Rate of irrigated agricultural land (%) | ||
| Forests | Proportion of natural forest area / land area to be protected (%) | |
| Percentage of plantaion forest and perennial industrial crops/area of land suitable for development of production forest (%) | ||
| Area of forest under sustainable forest management (%) | ||
| Freshwater | Water quantity | Proportion of total water resources used (%) |
| Water use intensity by economic activity /GDP (l/VNĐ) | ||
| Water quality | Sample rate of Feacal Coliform analysis in surface water at specific sites exceeds Vietnamese standards (%) | |
| Sample rate of BOD analysis in surface water at specific sites exceeds Vietnamese standards (%) | ||
| Biodiversity | Ecosystem | Proportion of conservation area/natural forest area (%) |
| Rate of change of Dipterocarp forest ecosystem (%) | ||
| Rate of change in area of evergreen broad-leaved forest ecosystem (%) | ||
| Fragmentation of habitats | ||
| Species | Rate of change in numbers of taxa on the threat level of these taxa in the Red Book (%) | |
| Rate of endemic species of Central Highlands/total species in Vietnam (%) | ||
| Proportion of exotic species entering the Central Highlands (%) | ||
References
- Côté, Amélie, and Dick McCollough. 2007. Comparative Analysis of Indicator Systems for Sustainable Development; Québec: The Office for the Coordination of Sustainable Development of the Ministry of Sustainable Development, Environment and Parks.
- Vietnam General Statistics Office (GSO). 2005. Vietnam Development Data 1990–2003; Ha Noi: GSO, 13 p.
- Hai, Le Trinh, Hai Pham Hoang, Khoa Nguyen Trương, and Hens Luc. 2009. Indicators set for sustainable development indicators: A case study in the province of Quang Tri, Vietnam. International Journal of Human Ecology 27: 217–27. [Google Scholar] [CrossRef]
- Hai, Le Trinh, Hai Pham Hoang, Ha Pham Thi Thu, Ha Nguyen Manh, Dai Ly Trong, Hoa Pham Viet, Huan Nguyen Cao, and Cam Lai Vinh. 2013. A system of sustainability indicators for the province of Thai Binh, VietNam. Social Indicators Research 116: 661–79. [Google Scholar] [CrossRef]
- ICLEI—Local Governments for Sustainability (ICLEI). 2015. From MDGs to SDGs: What are the Sustainable Development Goals? Available online: www.iclei.org/publications (accessed on 5 December 2017).
- International Institue for Sustainable Development (IISD). 2017. Compendium of Sustainable Development Indicator Initiatives and Publications [cited 4/2017]. Available online: http://www.iisd.org/measure/compendium/searchinitiatives.aspx (accessed on 15 April 2017).
- Lam, Nguyen Tung. 2015. International Lessons on Designing Environmental Performance Index and Applicability in Vietnam. Journal Science and Technology Policy and Management 4: 62–76. [Google Scholar]
- Lam Dong Provincial People’s Committee (Lam Dong). 2006. Sustainable Development Strategy of Lam Dong Province Period 2006–2010 and Vision 2020; Ha Noi: Publisher of Society and Labours.
- Lock, Graham. 2006. Experience in the Elaboration and Use of Sustainable Development Indicators for the European Union. Paprer Submitted to the Workshop on Sustainable Development Indicators at Université Laval, June. Laval: Université Laval. [Google Scholar]
- Maya, Fehling, Brett D. Nelson, and Sridhar Venkatapuram. 2013. Limitations of the Millennium Development Goals: A literature review. Global Public Health 8: 1109–22. [Google Scholar]
- Vietnam Ministry of Planning and Investment (MPI). 2005. The Circular Letter No 01/2005/TT-BKH on Implementation of Vietnam Prime Minister’s Decision on Vietnam Agenda 21; Ha Noi: MPI.
- Vietnam Ministry of Planning and Investment (MPI). 2013. The Circular Letter No 02/2013/TT-BKHĐT on Guidelines of Implementation Some Contents of Vietnam Sustainable Development Strategy Period 2011–2020; Ha Noi: MPI.
- Nathan, Hippu Salk Kristle, and B. Sudhakara Reddy. 2008. A Conceptual Framework for Development of Sustainable Development Indicators. Working Paper WP-2008-003. Maharashtra, India: Indira Gandhi Institute of Development Research (IGIDR). [Google Scholar]
- Ninh Binh Provincial People’s Committee (Ninh Binh). 2006. Sustainable Development Strategy of Yen Bai Province Period 2006–2010 and Vision 2020; Ha Noi: Con Duong Moi Limited Liability Company.
- Peterson, P. J. 1997. Indicators of Sustainable Development in Industrializing Countries. Hulu Langat District: Lestari Publishers. [Google Scholar]
- Quang Nam Provincial People’s Committee (Quang Nam). 2006. Sustainable Development Strategy of Quang Nam Province Period 2006–2010 and Vision 2020; Ha Noi: Con Duong Moi Limited Liability Company.
- Thai Nguyen Provincial People’s Committee (Thai Nguyen). 2006. Sustainable Development Strategy of Thai Nguyen Province Period 2006–2010 and Vision 2020; Ha Noi: Publisher of Society and Labours.
- Tran Van, Y, Thinh Nguyen Viet, Tuan Nguyen Thanh, Tri Ngo Dang, Chi Tran Thuy, Chinh Nguyen The, and Hau Nguyen Xuan. 2016. Tay Nguyen Sustainable Development: Assessment and Solutions. Ha Noi: Publisher of Vietnam Natural Science and Technology. [Google Scholar]
- Tuan, Vu Duy. 2015. Emphasizing Natural Capital in the Greater Mekong Subregion. Paper presented at International Conference on Sustainable Development, New York, NY, USA, September 23–24. [Google Scholar]
- United Nations Commission on Sustainable Development (UNCSD). 1996. Indicators of Sustainable Development Framework and Methodologies. New York: Division for Sustainable Development. [Google Scholar]
- United Nations Commission on Sustainable Development (UNCSD). 2001. Indicators of Sustainable Development: Framework and Methodologies. New York: Division for Sustainable Development. [Google Scholar]
- United Nations Commission on Sustainable Development (UNCSD). 2007. Indicators of Sustainable Development Framework and Methodologies. New York: Division for Sustainable Development. [Google Scholar]
- United Nations Development Programme (UNDP), and The Vietnam Ministry of Planning and Investment (MPI). 2006. Identification of a Sustainable Development Indicators Set and Mechanism for Building a Sustainable Development Database in Vietnam; Ha Noi: Publisher of Society and Labours.
- United Nations. 1992. Agenda 21. Paper presented at Conference on Environment and Development, Rio de Janerio, Brazil, June 3–14. [Google Scholar]
- United Nations Statistical Commission (UNSC). 2017. Report of the Inter-Agency and Expert Group on Sustainable Development Goal Indicators (E/CN.3/2017/2). New York: The United Nations. [Google Scholar]
- Socialist Republic of Vietnam (VN). 2012. Implementation of Sustainable Development—National Report at the United Nations Conference on Sustainable Development (RIO + 20); Ha Noi: Kimdo Trading and Marketing Co., Ltd.
- Socialist Republic of Vietnam (VN). 2015. The Country Report on 15 Years Achieving the Vietnam Millennium Development Goals; Ho Chi Minh: Joint Stock & Truong an Commercial Company, 148 p.
- Vietnam Prime Minister (VPM). 2005. Decision No 1032/QĐ-TTg of Vietnam Prime Minister on Foundation of the National Sustainable Development Council; Ha Noi: VPM.
- Vietnam Prime Minister (VPM). 2012. Decision No 432/QĐ-TTg of Vietnam Prime Minister on Promulgation of the Vietnam Sustainable Development Strategy Period 2011–2020; Ha Noi: VPM.
- Vietnam Prime Minister (VPM). 2013a. Decision No 2157/QĐ-TTg of Vietnam Prime Minister on Promulgation of Local Set of Sustainable Development Indicators; Ha Noi: VPM.
- Vietnam Prime Minister (VPM). 2013b. Decision No. 1755/QĐ-TTg on “Principles and Tasks for Reporting on the Implementation of MDGs”; Ha Noi: VPM.
- Vietnam Prime Minister (VPM). 2014. Resolution 05/NQ-CP on Accelerating the Implementation of the MDGs for the Health Sector; Ha Noi: VPM.
- Vietnam Prime Minister (VPM). 2017. Decision No 622/QĐ-TTg on National Action Plans to Implement the Agenda 2030 for the Sustainable Development; Ha Noi: VPM.
- Vietnam Agenda 21 Office (VPPTBV). 2013. The Workshop on Training of the Local Set of Sustainable Development Indicators. Available online: http://va21.gov.vn/baiviet.aspx?id=415 (accessed on 24 July 2013).
- Vietnam Agenda 21 Office (VPPTBV). 2014. Report on the Local Set of Sustainable Development Indicators period 2013–2020. Available online: http://va21.gov.vn/baiviet.html?id=436 (accessed on 24 July 2013).
- Vietnam Agenda 21 Office (VPPTBV). 2016. The Report on Studying, Reviewing 17 Goals and 169 Targets in the Agenda 30 for Sustainable Development in Vietnam, Providing Bases for Nationalization of Global SDGs; Ha Noi: The Vietnam Ministry of Planning and Investment.
- Vuong, Nguyen Van. 2016. Studying, Designing an Interdisciplinary Database System for Sustainable Development in the North West Region. National Science and Technology Program “Science and Technology for Sustainable Development in the North West Region”. Washington: National Academies Press. [Google Scholar]
- Yen Bai Provincial People’s Committee (Yen Bai). 2006. Agenda 21 on Sustainable Development of Yen Bai Province Yen Bai; Yen Bai City: Yen Bai Provincial People’s Committee.
© 2017 by the authors. Licensee MDPI, Basel, Switzerland. This article is an open access article distributed under the terms and conditions of the Creative Commons Attribution (CC BY) license (http://creativecommons.org/licenses/by/4.0/).
Share and Cite
Ngo Dang, T.; Tran Thuy, C.; Tran Van, Y.; Nguyen Thanh, T. Sets of Sustainable Development Indicators in Vietnam: Status and Solutions. Economies 2018, 6, 1. https://doi.org/10.3390/economies6010001
Ngo Dang T, Tran Thuy C, Tran Van Y, Nguyen Thanh T. Sets of Sustainable Development Indicators in Vietnam: Status and Solutions. Economies. 2018; 6(1):1. https://doi.org/10.3390/economies6010001
Chicago/Turabian StyleNgo Dang, Tri, Chi Tran Thuy, Y. Tran Van, and Tuan Nguyen Thanh. 2018. "Sets of Sustainable Development Indicators in Vietnam: Status and Solutions" Economies 6, no. 1: 1. https://doi.org/10.3390/economies6010001