
Natural Resources and Productivity: Can Banking Development Mitigate the Curse?


Abstract
:1. Introduction
2. Yemeni Economy: Stylized Facts
3. Literature Review
4. Data, Model and Methodology
4.1. Data and Variables
4.1.1. Productivity
4.1.2. Natural Resource Dependence
4.1.3. Banking Development
4.2. Model
4.3. Methodology
5. Empirical Findings and Discussion
6. Conclusions
Author Contributions
Conflicts of Interest
Appendix

| Model 1 | Model 2 | |
|---|---|---|
| BD → TFP | 3.5807 | 3.5648 |
| TFP → BD | 3.8897 | 3.1852 |
| NR → TFP | 1.4501 | 4.6169 * |
| TFP → NR | 2.6663 | 2.3135 |
References
- Abu-Bader, Suleiman, and Aamer S. Abu-Qarn. 2008. Financial Development and Economic Growth: The Egyptian Experience. Journal of Policy Modelling 30: 887–98. [Google Scholar] [CrossRef]
- Angelini, E., and M. Marcellino. 2011. Econometric Analysis with Backdated Data Unified Germany and the Euro Area. Economic Modelling 28: 1405–414. [Google Scholar] [CrossRef]
- Anwar, Sajid, and Sizhong Sun. 2011. Financial Development, Foreign Investment and Economic Growth in Malaysia. Journal of Asian Economics 22: 335–42. [Google Scholar] [CrossRef]
- Arezki, Rabah, and Frederick Van der Ploeg. 2011. Do Natural Resources Depress Income Per Capita? Review of Development Economics 15: 504–21. [Google Scholar] [CrossRef]
- Auty, Richard. 1993. Sustaining Development in Mineral Economies: The Resource Curse Thesis. London: Routledge. [Google Scholar]
- Badeeb, Ramez Abubakr, and Hooi Hooi Lean. 2017. Natural Resources, Financial Development and Sectoral Value Added in a Resource Based Economy. In Robustness in Econometrics. Edited by Vladik Kreinovich, Songsak Sriboonchitta and Van-Nam Huynh. Berlin: Springer, pp. 401–17. [Google Scholar]
- Badeeb, Ramez Abubakr, Hooi Hooi Lean, and Russell Smyth. 2016. Oil Curse and Finance–Growth Nexus in Malaysia: The Role of Investment. Energy Economics 57: 154–65. [Google Scholar] [CrossRef]
- Badeeb, Ramez Abubakr, Hooi Hooi Lean, and Jeremy Clark. 2017. The Evolution of the Natural Resource Curse Thesis: A Critical Literature Survey. Resources Policy 51: 123–34. [Google Scholar] [CrossRef]
- Banerjee, Pradeep. 2011. Microeconomic Policy Environment–An Analytical Guide for Managers. New York: Tata McGraw-Hill. [Google Scholar]
- Bencivenga, Valerie R., and Bruce D. Smith. 1991. Financial Intermediation and Endogenous Growth. The Review of Economic Studies 58: 195–209. [Google Scholar] [CrossRef]
- Benhabib, Jess, and Mark M. Spiegel. 1994. The Role of Human Capital in Economic Development Evidence from Aggregate Cross-Country Data. Journal of Monetary Economics 34: 143–73. [Google Scholar] [CrossRef]
- Buckle, Mike, and John L. Thompson. 1998. The UK Financial System: Theory and Practice. Manchester: Manchester University Press. [Google Scholar]
- Caprio, Gerard, and Stijn Claessens. 1997. The Importance of the Financial System for Development: Implications for Egypt. Distinguished Lecture Series 6: 1–49. [Google Scholar]
- Corden, Warner Max. 1984. Booming Sector and Dutch Disease Economics: Survey and Consolidation. Oxford Economic Papers 36: 359–80. [Google Scholar] [CrossRef]
- Corden, Warner Max, and J. Peter Neary. 1982. Booming Sector and De-Industrialisation in a Small Open Economy. The Economic Journal 92: 825–48. [Google Scholar] [CrossRef]
- Dasgupta, Dipak, Jennifer Keller, and T. G. Srinivasan. 2005. Reform and Elusive Growth in the Middle East-What Happened in the 1990s? Trade Policy and Economic Integration in the Middle East and North Africa: Economic Boundaries in Flux 1: 13. [Google Scholar]
- Dolado, J.J., and H. Lütkepohl. 1996. Making Wald Tests Work for Cointegrated VAR. Econometric Reviews 15: 369–86. [Google Scholar] [CrossRef]
- Easterly, William, and Ross Levine. 2000. It’s Not Factor Accumulation: Stylized Facts and Growth Models. World Bank Economic Review 15: 177–219. [Google Scholar] [CrossRef]
- Farhadi, Minoo, Md Rabiul Islam, and Solmaz Moslehi. 2015. Economic Freedom and Productivity Growth in Resource-rich Economies. World Development 72: 109–26. [Google Scholar] [CrossRef]
- Gylfason, Thorvaldur. 2001. Natural resources, education, and economic development. European Economic Review 45: 847–59. [Google Scholar] [CrossRef]
- Gylfason, Thorvaldur, and Gylfi Zoega. 2006. Natural Resources and Economic Growth: The Role of Investment. World Economy 29: 1091–115. [Google Scholar] [CrossRef]
- International Monetary Fund. 2001. Republic of Yemen: Selected Issues. IMF Country Report No. 0161. Washington: International Monetary Fund. [Google Scholar]
- Karl, T. L. 2005. Understanding the Resource Curse in S. Tsalik and A. Schiffrin (eds) Covering Oil: A Reporter’s Guide to Energy and Development. New York: Open Society Institute, pp. 21–30. [Google Scholar]
- Khan, Mohsin S., and Manmohan Kumar. 1993. Public and Private Investment and the Convergence of Per Capita Incomes in Developing Countries. IMF Working Paper 93/51. Washington: International Monetary Fund. [Google Scholar]
- Khan, Mohsin S., and Carmen M. Reinhart. 1990. Private Investment and Economic Growth in Developing Countries. World development 18: 19–27. [Google Scholar] [CrossRef]
- King, Robert G., and Ross Levine. 1993. Finance and Growth: Schumpeter Might be Right. Quarterly Journal of Economics 108: 717–38. [Google Scholar] [CrossRef]
- Kremers, Jeroen J. M., Neil R. Ericsson, and Juan J. Dolado. 1992. The Power of Cointegration Tests. Oxford Bulletin of Economics and Statistics 54: 325–48. [Google Scholar] [CrossRef]
- Levine, Oliver, and Missaka Warusawitharana. 2014. Finance and Productivity Growth: Firm-Level Evidence. Finance and Economics Discussion Series; Washington: Divisions of Research & Statistics and Monetary Affairs, Federal Reserve Board. [Google Scholar]
- McKinnon, R. I. 1973. Money and Capital in Economic Development. Washington: Brookings Institution. [Google Scholar]
- Mehlum, Halvor, Karl Moene, and Ragnar Torvik. 2006. Institutions and the Resource Curse. The Economic Journal 116: 1–20. [Google Scholar] [CrossRef]
- Narayan, Paresh Kumar. 2005. The Saving and Investment Nexus for China: Evidence from Cointegration Tests. Applied Economics 17: 1979–990. [Google Scholar] [CrossRef]
- Neumayer, Eric. 2004. Does the “Resource Curse” Hold for Growth in Genuine Income as Well? World Development 32: 1627–640. [Google Scholar] [CrossRef]
- Nili, Masoud, and Mahdi Rastad. 2007. Addressing the Growth Failure of the Oil Economies: The Role of Financial Development. The Quarterly Review of Economics and Finance 46: 726–40. [Google Scholar] [CrossRef]
- Pagano, Marco. 1993. Financial Markets and Growth: An Overview. European Economic Review 37: 613–22. [Google Scholar] [CrossRef]
- Papyrakis, Elissaios, and Reyer Gerlagh. 2004. The Resource Curse Hypothesis and Its Transmission Channels. Journal of Comparative Economics 32: 181–93. [Google Scholar] [CrossRef]
- Pesaran, M. Hashem, Yongcheol Shin, and Richard J. Smith. 2001. Bounds Testing Approaches to the Analysis of Level Relationships. Journal of Applied Econometrics 16: 289–326. [Google Scholar] [CrossRef]
- Rioja, Felix, and Neven Valev. 2004. Finance and the Sources of Growth at Various Stages of Economic Development. Economic Inquiry 42: 127–40. [Google Scholar] [CrossRef]
- Saborowski, Christian. 2009. Capital Inflows and the Real Exchange Rate: Can Financial Development Cure the Dutch Disease? IMF Working Papers 09/20. Washington: International Monetary Fund. [Google Scholar]
- Sachs, Jeffrey D., and Andrew M. Warner. 1995. Natural Resources Abundance and Economic Growth. NBER Working Paper No. 5398. Cambridge: National bureau for Economic Research. [Google Scholar]
- Sachs, Jeffrey D., and Andrew M. Warner. 2001. The Curse of Natural Resources. European Economic Review 45: 827–38. [Google Scholar] [CrossRef]
- Schoar, Antoinette. 2002. Effects of Corporate Diversification on Productivity. The Journal of Finance 57: 2379–403. [Google Scholar] [CrossRef]
- Serven, L., and A. Solimano. 1990. Private Investment and Macroeconomic Adjustment: Theory, Country Experience, and Policy Implication. In Macroeconomic Adjustment and Growth Division. Washington: World Bank. [Google Scholar]
- Shahbaz, Muhammad, and Hooi Hooi Lean. 2012. Does Financial Development Increase Energy Consumption? The Role of Industrialization and Urbanization in Tunisia. Energy Policy 40: 473–79. [Google Scholar] [CrossRef]
- Shaw, E. S. 1973. Financial Deepening and Economic Development. New York: Oxford University Press. [Google Scholar]
- Singer, H. W. 1950. The Distribution of Gains between Investing and Borrowing Countries. The American Economic Review 40: 473–85. [Google Scholar]
- Singh, Tarlok. 2008. Financial Development and Economic Growth nexus: A Time-Series Evidence from India. Applied Economics 40: 1615–627. [Google Scholar] [CrossRef]
- Stevens, Paul, and Evelyn Dietsche. 2008. Resource Curse: An Analysis of Causes, Experiences and Possible Ways Forward. Energy Policy 36: 56–65. [Google Scholar] [CrossRef]
- Toda, H. Y., and T. Yamamoto. 1995. Statistical Inference in Vector Autoregressions with Possibly Integrated Processes. Journal of Econometrics 66: 225–50. [Google Scholar] [CrossRef]
- Van der Ploeg, Frederick, and Steven Poelhekke. 2009. Volatility and the Natural Resource Curse. Oxford Economic Papers 61: 727–60. [Google Scholar] [CrossRef]
- Van Wijnbergen, Sweder. 1984. The Dutch Disease’: A Disease after all? The Economic Journal 94: 41–55. [Google Scholar] [CrossRef]
- Vetlov, I., and T. Warmedinger. 2006. The German Block of the ESCB Multi-Country Model. Working Paper Series No. 654; Frankfurt am Main: European Central Bank. [Google Scholar]
- World Bank. 2002. Economic Growth in the Republic of Yemen: Sources, Constraints, and Potentials. A World Bank Country Study, Report No: 24976. Washington: World Bank. [Google Scholar]
- World Bank. 2013. Project Appraisal Document on A Proposed Grant to the Republic of Yemen. Finance and Private Sector Development Department Middle East and North Africa Region. Report No: 78624-YE. Washington: World Bank. [Google Scholar]
- World Bank. 2015. Republic of Yemen: Unlocking the Potential for Economic Growth. Washington: World Bank. [Google Scholar]
| 1 | Although we lack a universally accepted theory of the natural resources curse, most explanations of the curse have a crowding-out logic. When natural resources crowd-out activity x, and activity x drives growth, natural resources harm growth (Sachs and Warner 2001). |
| 2 | The reason for focusing on banking development rather than all financial development is that most natural resource-based economies have limited development on the stock market, and banks are the main source of finance. The financial sector in Yemen is also dominated by the banking sector, with no existence of a stock market. |
| 3 | See Badeeb et al. (2017) for a comprehensive literature survey on natural resource curse hypothesis. |
| 4 | Angelini and Marcellino (2011) argued that this simple treatment of the unification problem has been used widely in empirical macroeconomic analyses in Europe. It is based on the economic reasoning that East Germany’s economy represented a very small portion of the unified Germany economy in real GDP terms in 1991. |
| 5 | Evidence of the validity of this treatment comes from the fact that the economy of former Southern Yemen accounted for only 17.3 percent of real GDP of united Yemen. Additionally, the economy of united Yemen is largely based on the market system, which was followed by the Northern part before unification. |
| 6 | Natural resource revenues in Yemen include the concession commissions that the government receives from natural resource production companies, tax charges on foreign oil companies that operate in Yemen, and grants that the government receives from oil companies after signing contracts (Yemeni Ministry of Finance). |
| 7 | Yemeni unification took place in 1990, when the area of the People’s Democratic Republic of Yemen (also known as South Yemen) was united with the Yemen Arab Republic (also known as North Yemen), forming the Republic of Yemen (known simply as Yemen). |
| 8 | The same approach is applied to Equation (6). |
| 9 | During the oil decades, the contribution of the manufacturing sector to the GDP declined from 16.5% to 7%. |
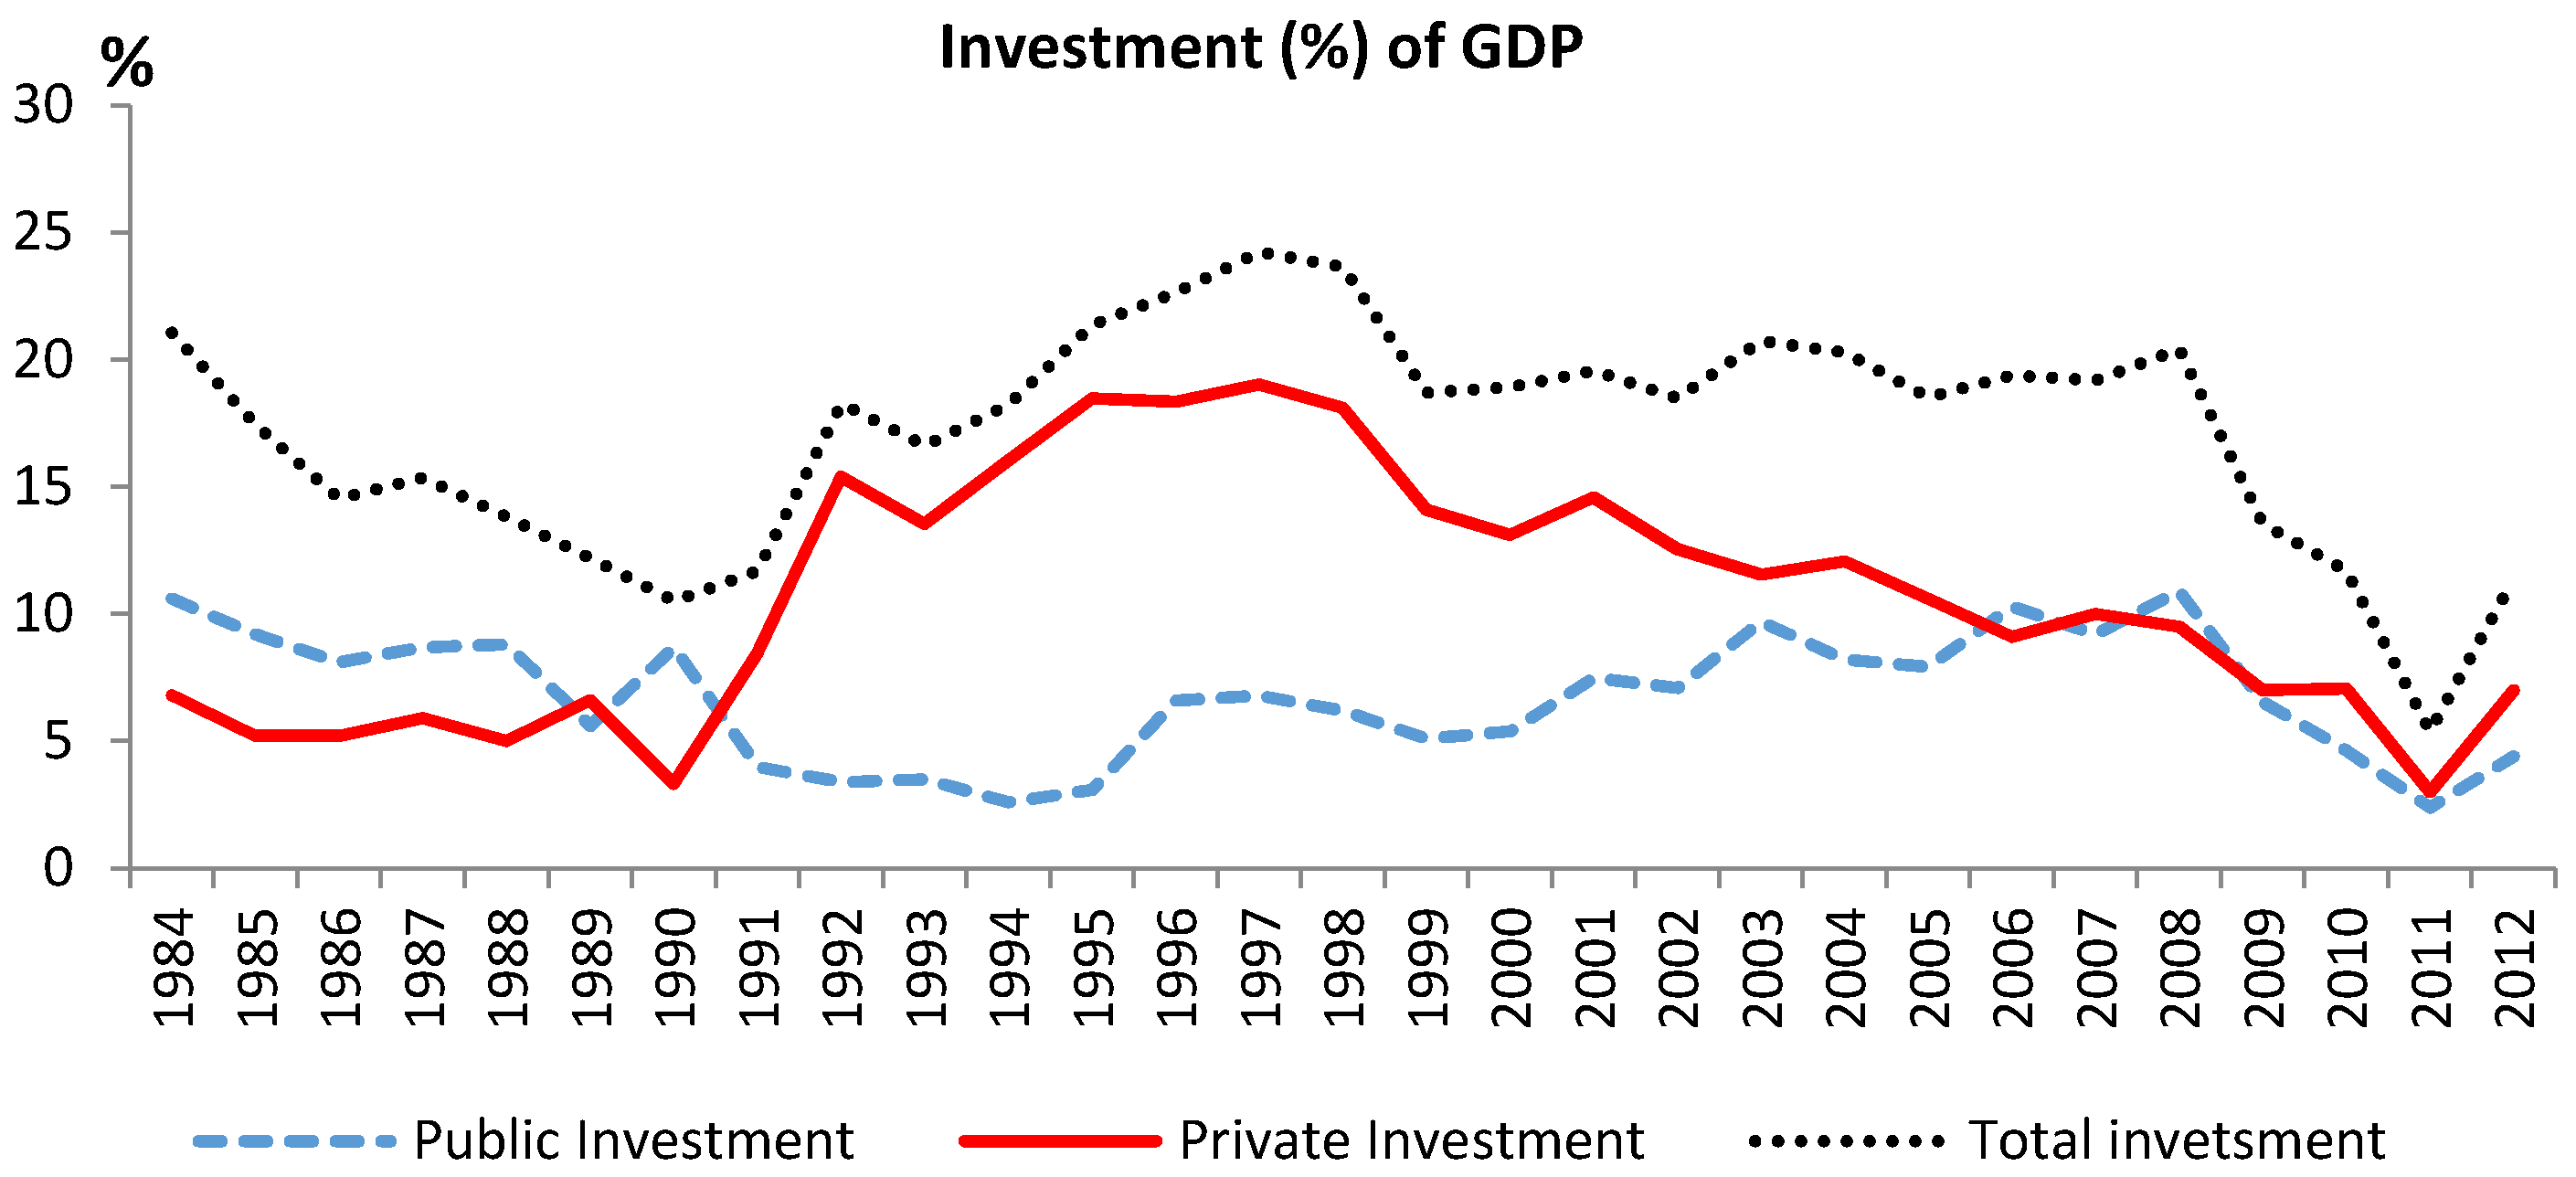
| 10 | A number of studies have been conducted on developing countries and concluded that public investment has a smaller impact on growth than private investment (Serven and Solimano 1990; Khan and Kumar 1993). Others maintain that this effect may even be negative (Khan and Reinhart 1990). |
| 11 | Toda and Yamamoto (1995) and Dolado and Lütkepohl (1996) causality test has been employed to verify the causal relationship among the variables that are studied in this paper (see Appendix). We thank an anonymous reviewer for this suggestion. |


| Augmented Dicky Fuller (ADF) Test Statistics | Phillip-Perron (PP) Test Statistic | |||||||
|---|---|---|---|---|---|---|---|---|
| Intercept | Intercept and Trend | Intercept | Intercept and Trend | |||||
| Level | 1st difference | Level | 1st difference | Level | 1st difference | Level | 1st difference | |
| TFP | −2.1374 | −5.4634 *** | −2.4077 | −5.4275 *** | −2.3824 | −5.6446 *** | −2.6331 | −5.8161 *** |
| NR | −1.7358 | −4.3134 *** | −0.9943 | −4.0589 ** | −1.7673 | −4.18211 *** | −0.9614 | −5.5148 *** |
| M2 | −1.3453 | −6.7195 *** | −1.8500 | −6.7130 *** | −1.3453 | −6.7195 *** | −1.8046 | −6.8787 *** |
| PRV | −1.3950 | −5.7898 *** | −1.48591 | −5.6970 *** | −1.4062 | −5.7856 *** | −1.5902 | −5.6953 *** |
| EDU | −2.0049 | −6.8516 *** | −3.3675* | −6.8107 *** | −2.0049 | −8.3342 *** | −3.1187 | −8.9505 *** |
| Model | SBC Optimum Lag | F-Statistics | ECTt-1 (t-Ratio) | Result | ||
| 1 | (1,1,1,0,0) | 5.6164 ** | −0.6342 *** (−4.5996) | Cointegration | ||
| 2 | (1,1,0,2,0) | 3.4179 | −0.4266 ** (−2.4160) | Cointegration | ||
| Critical Values for F-Statistics | Lower I (0) | Upper I (1) | ||||
| 1% | 4.590 | 6.368 | ||||
| 5% | 3.276 | 4.630 | ||||
| 10% | 2.696 | 3.898 | ||||
| Panel A: Long-Run Analysis | ||
| Model 1 | Model 2 | |
| C | −0.1031 (−0.0840) | 4.6432 (9.4425) |
| M2 | −1.2247 (−1.3975) | - |
| PRV | - | −0.4370 (−0.2702) |
| NR | −1.0573 *** (−5.3397) | −0.1932 * (−1.9500) |
| NR*M2 | 0.2152 (1.0947) | |
| NR*PRV | - | 0.1171 * (2.0526) |
| EDU | 0.0702 (1.3139) | −0.0957 (−0.6483) |
| Dum | 0.2830 *** (3.5182) | 0.5098 ** (2.0904) |
| Panel B: Short-Run Analysis | ||
| ΔM2 | −0.5026 (−0.9047) | - |
| ΔPRV | - | −0.0995 (−1.3333) |
| ΔNR | −0.6024 (−1.5324) | −0.0824 * (−1.7954) |
| Δ(NR*M2) | 0.1365 (0.7859) | - |
| Δ(NR*PRV) | - | 0.0519 *** (3.7962) |
| ΔEDU | 0.0445 (1.2561) | 0.0408 (0.7433) |
| Dum | 0.17951 *** (5.1798) | 0.2175 *** (3.6248) |
| ECTt-1 | −0.6342 *** (−4.5996) | −0.4266 ** (−2.416) |
| Panel C: Diagnostic Test | ||
| Serial Correlation | 1.0956 [0.295] | 0.16280 [0.687] |
| Functional Form | 0.7973 [0.372] | 0.5388 [0.463] |
| Normality | 6.9991 [0.030] | 5.0126 [0.094] |
| Heteroscedasticity | 0.2201 [0.639] | 0.1619 [0.687] |
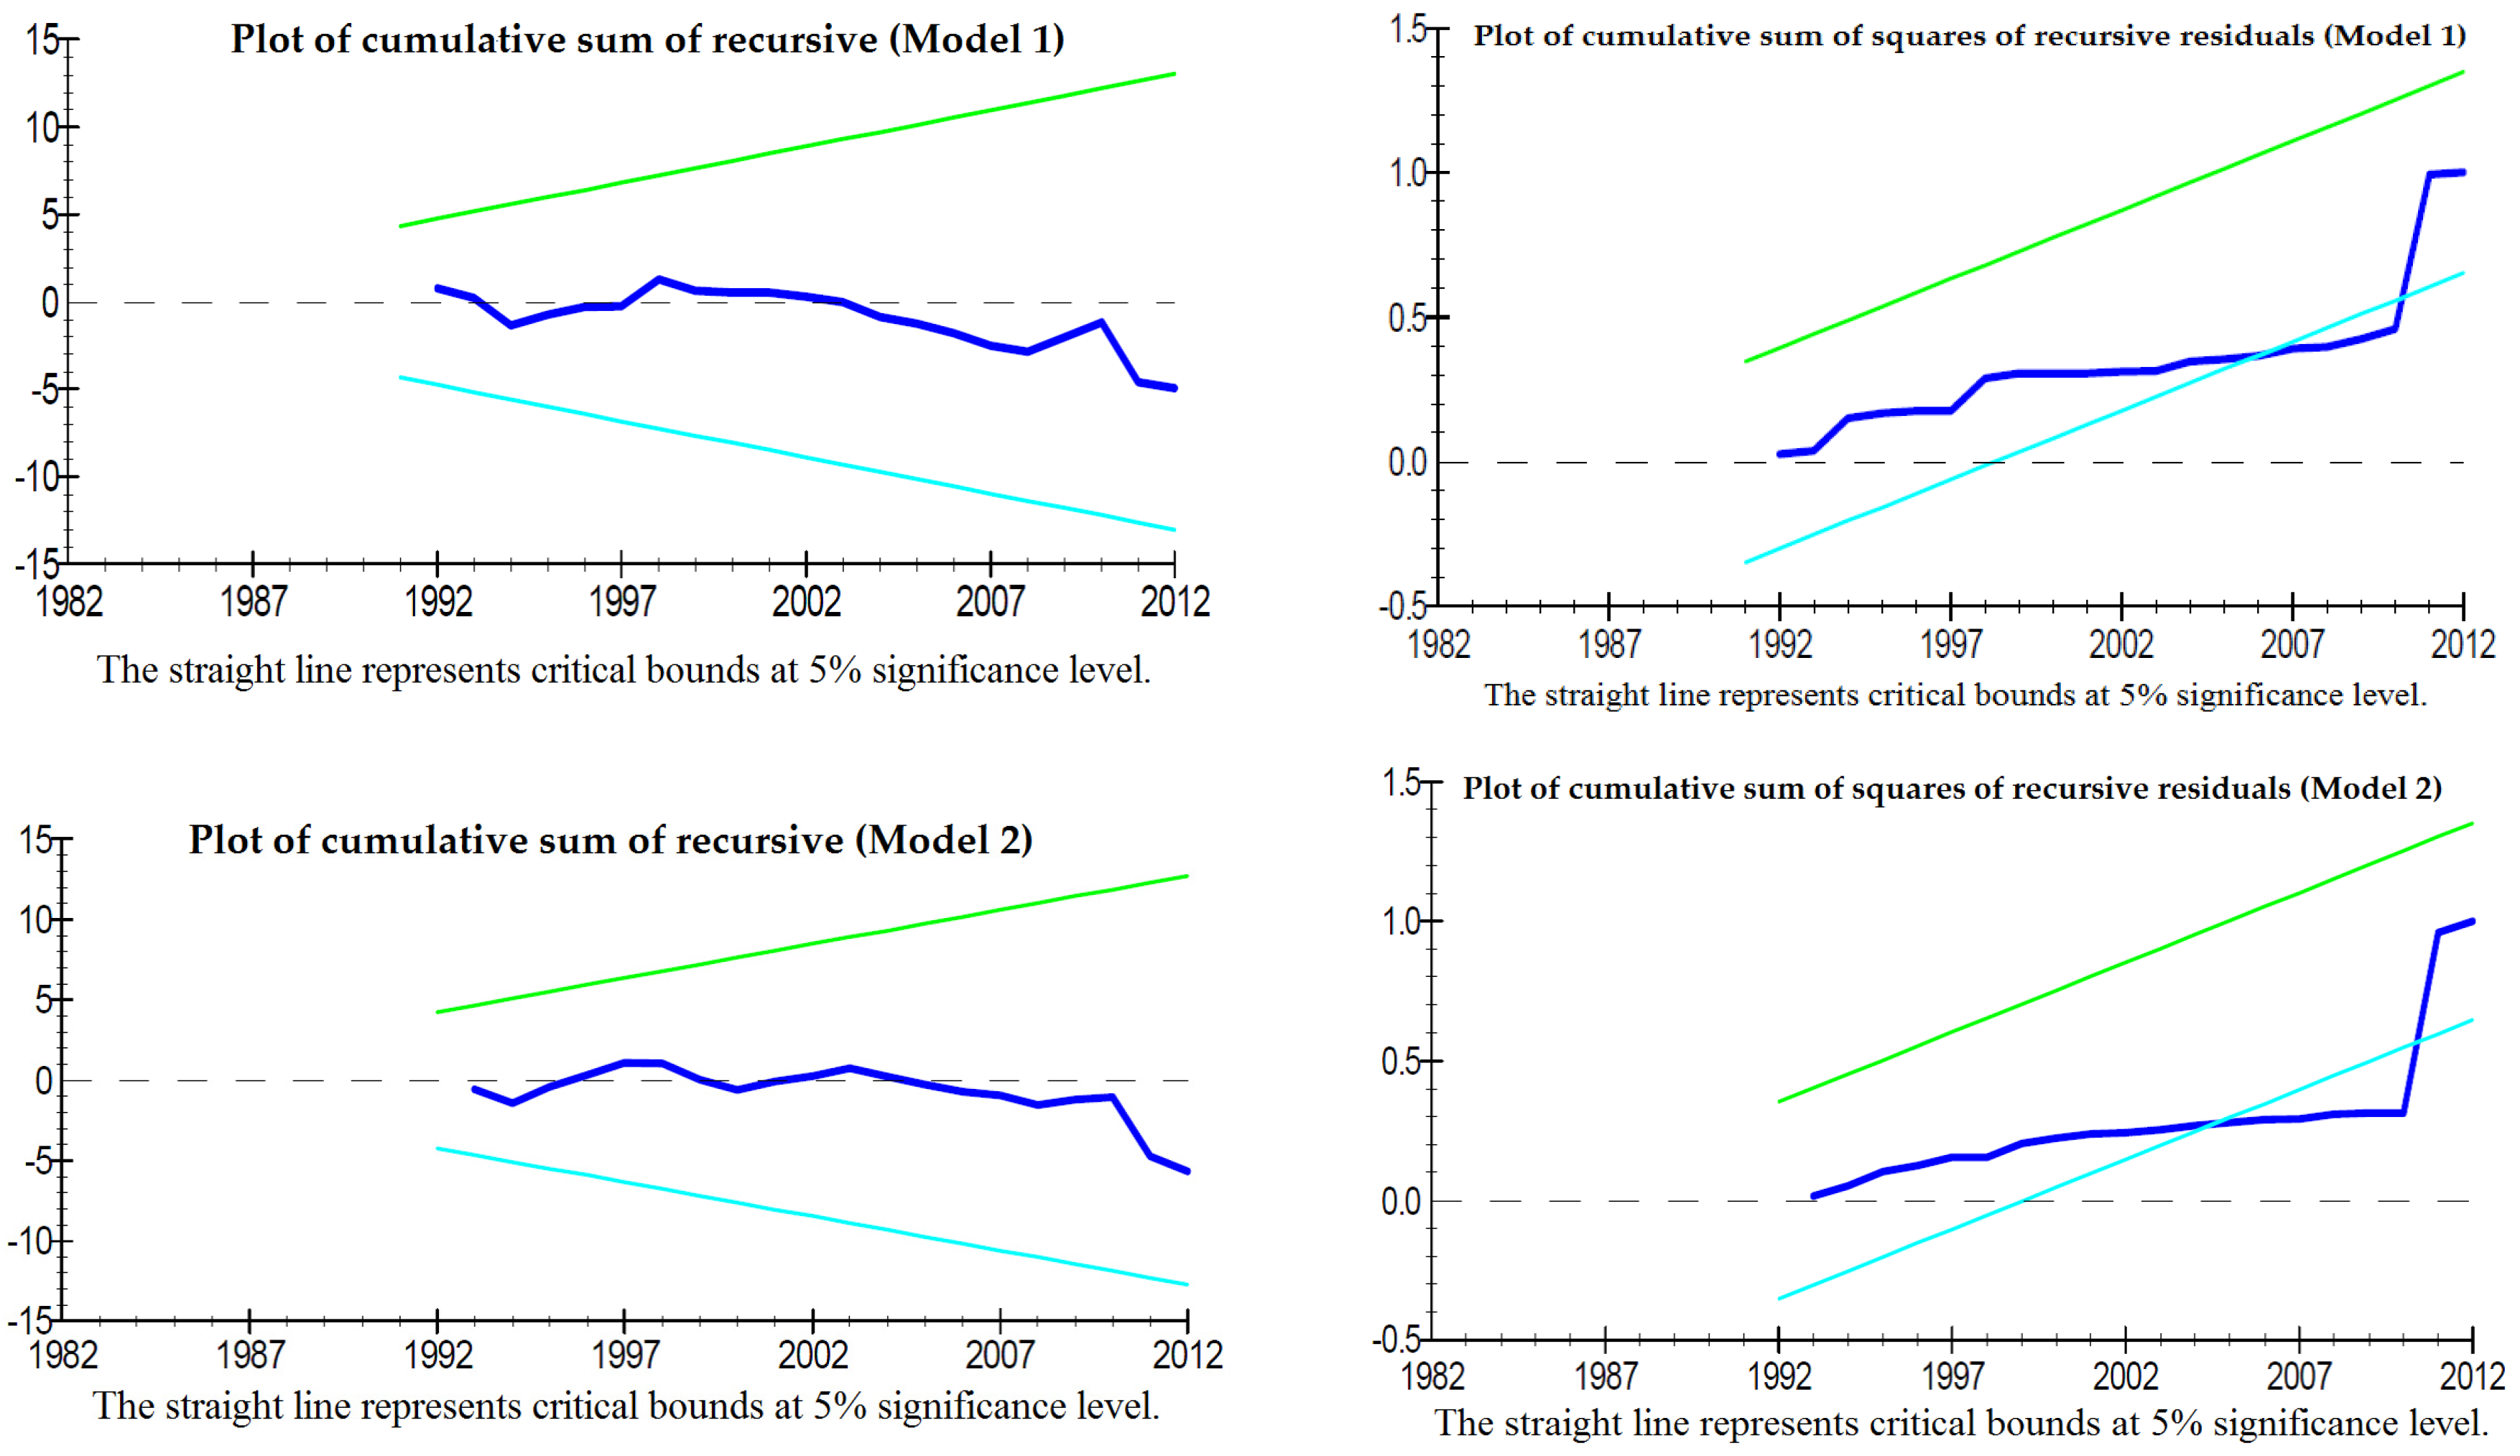
| CUSUM | S | S |
| CUSUMQ | S | S |
| Adjusted R2 | 0.8725 | 0.7833 |
© 2017 by the authors. Licensee MDPI, Basel, Switzerland. This article is an open access article distributed under the terms and conditions of the Creative Commons Attribution (CC BY) license (http://creativecommons.org/licenses/by/4.0/).
Share and Cite
Badeeb, R.A.; Lean, H.H. Natural Resources and Productivity: Can Banking Development Mitigate the Curse? Economies 2017, 5, 11. https://doi.org/10.3390/economies5020011
Badeeb RA, Lean HH. Natural Resources and Productivity: Can Banking Development Mitigate the Curse? Economies. 2017; 5(2):11. https://doi.org/10.3390/economies5020011
Chicago/Turabian StyleBadeeb, Ramez Abubakr, and Hooi Hooi Lean. 2017. "Natural Resources and Productivity: Can Banking Development Mitigate the Curse?" Economies 5, no. 2: 11. https://doi.org/10.3390/economies5020011
APA StyleBadeeb, R. A., & Lean, H. H. (2017). Natural Resources and Productivity: Can Banking Development Mitigate the Curse? Economies, 5(2), 11. https://doi.org/10.3390/economies5020011