1. Introduction
Social responsibility is a valuation of an enterprise that influenced on improvement of the financial and non-financial performance indicators of the enterprise activity. The key advantage of implementing social responsibility programs is a creation of the long- and medium-term positive enterprise reputation for some internal and external business stakeholders.
The objective of this paper is an improvement of the theoretical approaches, scientific and methodological fundamentals, and practical recommendations for a determination of an influence of the social responsibilities to ensuring of the enterprise activity productivity, which has planned to realize as steps’ sequence (algorithm). It is forming main scientific and research study problem.
Social responsibility is defined as one of the main factors from which company performance is determined by the current economic conditions. A socially responsible enterprise is an integrated system, which creates loyalty and prefer customers, is attractive for investment, increased the confidence level to the enterprise, promoted commitment from the state and the local community. Due to the advantages, the enterprise developers in all activity areas (economic, ecological, social, legal, etc.) and in the medium term this enterprise can obtain an opportunity to increase the effectiveness of itself an activity that hence the relevance of this research.
In this area, some scientists were carried out some research. For example, Carroll and Shabana [
1] in their review, the primary subject was the ‘business case’ for corporate social responsibility. The business case has referred to the underlying arguments or rationales supporting or documenting why the business community should accept and advance the CSR ‘cause’. The business case is concerned with the primary question: What did the business community and organizations get out of CSR? That is, how did they benefit tangibly from engaging in CSR policies, activities and practices? The business case has referred to the bottom-line financial and other reasons for businesses pursuing CSR strategies and policies. In developing the business case, this paper first provides some historical background and perspective. In addition, it provides a brief discussion of the evolving understandings of CSR and some of the long-established, traditional arguments that have been made both for and against the idea of a business assuming any responsibility to society beyond profit-seeking and maximizing its own financial well-being. Finally, the paper has addressed the business case in more detail. The goal was been described and summarized, what the business case means and to review some of the concepts, research and practice that have come to characterize that developing idea.
Society’s demands on individual and corporate social responsibility as alternative responses to market and distributive failures are becoming increasingly prominent. Some scientists [
2] have drawn on recent developments in the psychology and economics of prosocial behaviour to shed light on this trend and the underlying mix of motivations. They then have linked individual concerns to corporate social responsibility, contrasting three possible understandings of the term: the firms’ adoption of a more long-term perspective, the delegated exercise of prosocial behaviour on behalf of stakeholders, and insider-initiated corporate philanthropy. They have discussed the benefits, costs, and limits of socially responsible behaviour as a means to further societal goals.
Some other scientists [
3] have explored the impact of corporate social responsibility ratings on sell-side analysts’ assessments of firms’ future financial performance. They have suggested that when analysts perceive CSR as an agency cost, due to the prevalence of an agency logic, they have produced pessimistic recommendations for firms with high CSR ratings. Moreover, they have theorized that over time, the emergence of a stakeholder focus, and the gradual weakening of the agency logic, shifts the analysts’ perceptions of CSR ratings and results in increasingly less pessimistic recommendations. Using a large sample of publicly traded US firms over 15 years, they have confirmed that in the early 1990s, analysts issue more pessimistic recommendations for firms with high CSR ratings. However, in subsequent years up to 2007, analysts progressively have assessed these firms less pessimistically, and eventually they have assessed them optimistically. Furthermore, they have found that more experienced analysts and higher-status brokerage houses are the first to shift the relation between CSR ratings and investment recommendation optimism. They have found no significant link between firms’ CSR ratings and analysts’ forecast errors, indicating that learning was unlikely to account for the observed shifts in recommendations. They have discussed implications for both for future research and practice.
In any industry, enterprises are continually forced to face market changes and, at the same time, to reach a high level of productivity to be efficient [
4]. For that purpose, the managers are always in search of tools or methods to assist in improving productivity. However, in order to improve the productivity, these researchers have had to take into account a number of key issues. Besides, it was essential to calculate the business’s productivity through various methods and it was necessary to take into account the qualitative factors affecting the productivity level, factors that cannot be included in any calculation method. Many literature studies have investigated quantitative or qualitative parts of the problem. A research, which has taken into account both aspects was very difficult and required a high volume of work and information. That research has aimed to combine the two issues to encompass a broader range of issues that were related to the enterprise productivity. Thus, using their studies so far, we have been proposed a way to determine the level of productivity for the qualitative and quantitative factors. For that purpose, they have been developing a framework to help improve product performance in terms of productivity. That framework was a guide to best practices and recommendations for large enterprise managers in mechanical engineering. The proposed framework has included a set of steps leading to the identification of five productivity levels of quantitative and qualitative factors, which was reached by the DMUs (Decision Making Units). That level of productivity could be compared to the levels attained by direct market competitors. Improving the productivity of machine building industry enterprises could be done following the reverse path proposed by the developed framework. That reverse path has helped identify, systematically, the unproductivity sources that have existed within the studied firms.
The basic scientific problem of this paper is a consideration of the possibility of using of the well-known and new mathematical apparatus, particularly, in this research area. This aggregation was not practiced earlier, especially, in this sphere. For example, a new theory of interpretation by one of the authors was not used in this similar situation [
28].
The following tasks need to solve to achieve the formulated objective: to develop a new scientific and methodical approach for the determination of a complex indicator of the enterprise social responsibility; to form a methodical approach to calculate an aggregated indicator of the enterprise activity productivity; to build an influential model of the complex indicator of the enterprise activity productivity on an aggregate indicator of the enterprise activity productivity.
The research object is Ukrainian food (cheese) industry enterprises.
Based on the suggestions of the authors, developed a scientific and methodical approach can be not only acceptable for practical using; however, this question can be discussed in further.
2. Materials and Methods
At the presented economic development stage, a limitation of the economic, ecological, social and labour, standard and legal means for the enterprise satisfaction of the social interests of the internal and external business-processes member is complemented by the methodological basis limitation of the social responsibility level estimation.
If social responsibility concepts, which are covering socially oriented activities, and which are planned and implemented by an enterprise, are currently formed, then the specific tools that helped to plan costs spent on social responsibility, to assess its level, and to identify the social measures relationship with the enterprise activity productivity, are not developed.
Further Ukrainian business development on the social responsibility principles is required to find new decision-making methods. The creation of an adequate methodology of the comprehensive social responsibility assessment in terms of the economic, ecological, social and labour, standard and legal components is the appropriate methodological foundation.
The following was being noted in the global reporting initiative [
1]: “... Some consequences of the enterprise activities are difficult to imagine, because a necessity of measuring of those consequences exists on more systematic basis, and the results, which they are achieving through their investments in social initiatives. A necessity of the tools and methods using, through which the impact during some time period can keep tracked (monitored), also exists”.
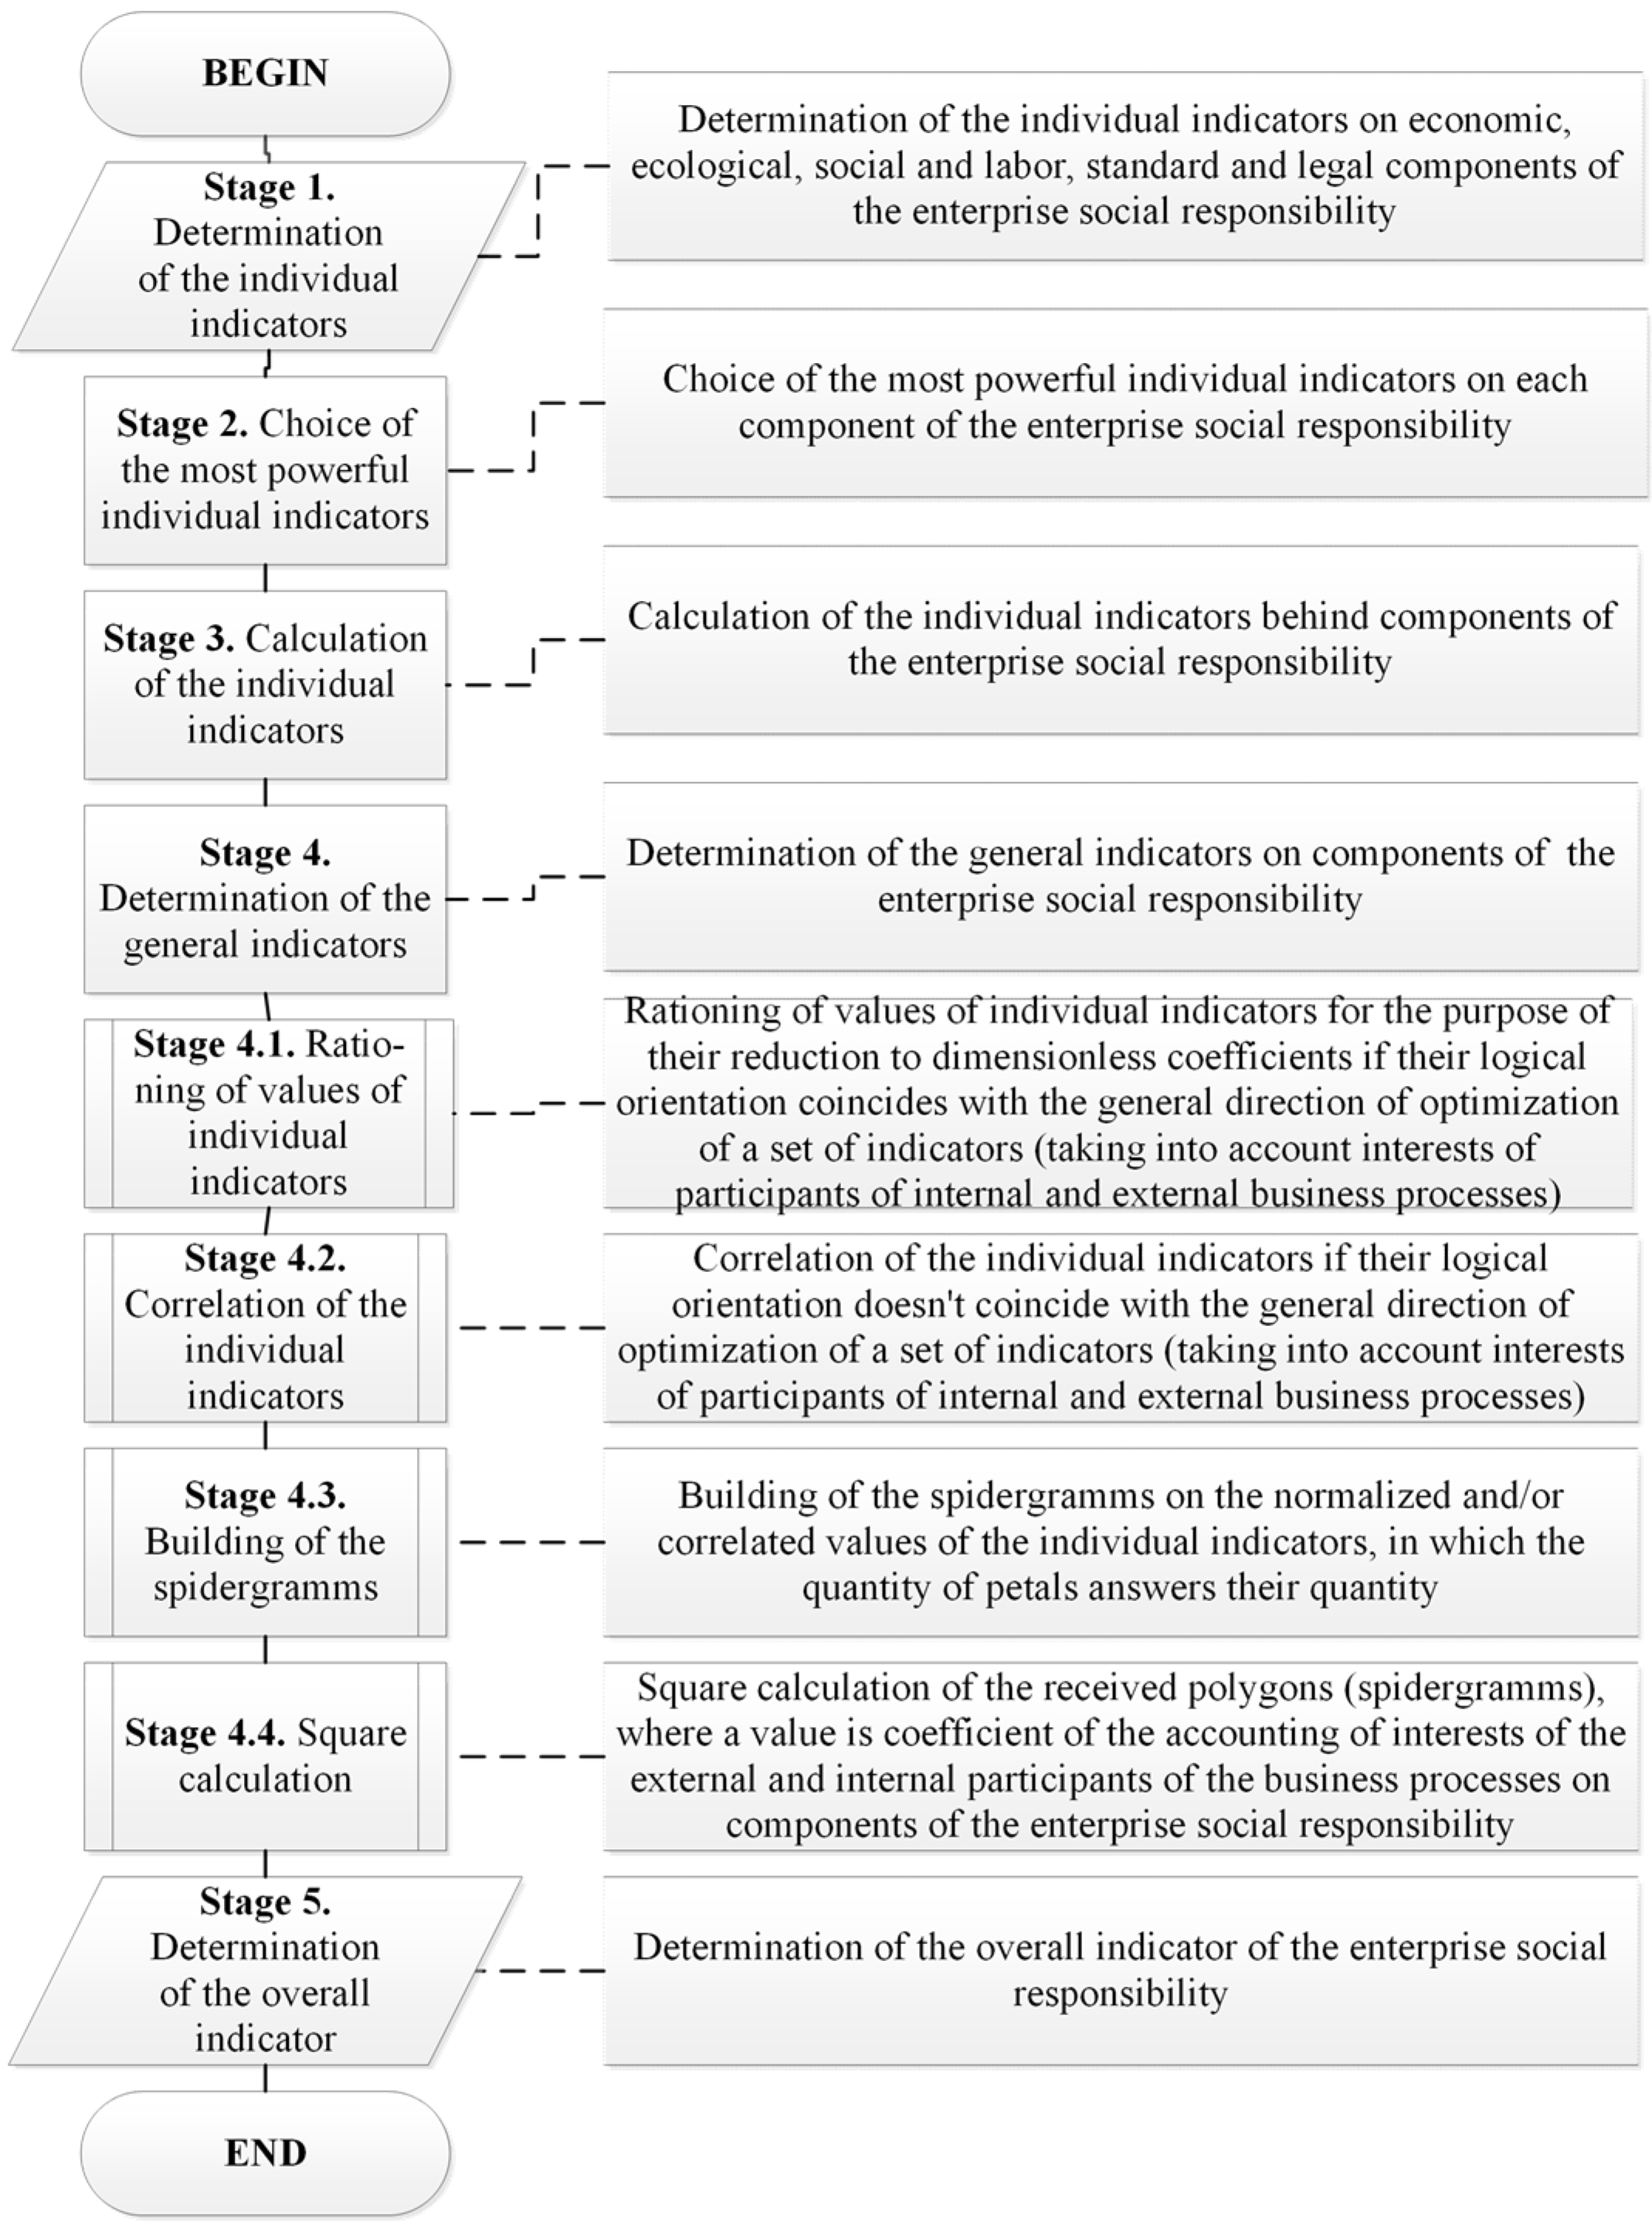
Therefore, based on previous researches of existing methods, the authors present their own method’s scheme of a calculation of the comprehensive social responsibility indicator of the enterprise in
Figure 1.
Stage 1. Identification of some individual parameters, which are the basis for calculating the generalizing economic, ecological, social and labour, standard and legal components of the enterprise social responsibility. Some indicators have been selected based on the interests of the internal and external enterprise business-processes for their determination [
5].
Stage 2. Some indicators have been selected according to the internal and external enterprise business-process interests for a determination of the economic, ecological, social and labour, standard and legal components. The expert estimation method was used to determine the most important indicators from the selected above parameters [
6]. The selected method has allowed ranking the researched indicators by the impact degree on the economic, ecological, social and labour, standard and legal components of the enterprise social responsibility.
Thus, 14 indicators, among which are 9 ecological indicators, 10 social and labour indicators, and 9 regulatory indicators will take into account at the economic component calculating.
Stage 3. Calculation of individual indicators by the components of the enterprise social responsibility. The individual indicators calculation will carried out based on the financial statements of the selected enterprises.
Stage 4. Calculation of the generalizing economic, ecological, social and labour, standard and legal components of enterprise social responsibility.
The indicative-geometric method [
7,
8] was being proposed to calculate the generalizing economic, ecological, social and labour, standard and legal components of the enterprise social responsibility. This method is new in the significance estimating of any business entity or any of its other properties, but this method can be applied to estimate other objects in the different research areas. The main advantages of selected method are the following:
versatility (the ability of using for any object and in any research areas);
simplicity of implementation (does not require the using of some additional methods or approaches, and will provide an easy algorithmic implementation);
the speed of calculation (allows realizing for any input parameter dimension);
visibility by using (enables easy understanding and simplicity of implementation in software form);
uniformity of the input parameters-indicators (allows considering the indicators of the different physical nature).
Stages 4.1 and 4.2. Value normalization of the individual indicators by the social responsibility components to bring these indicators to the dimensionless coefficients, if their logical direction is coinciding with the generalizing optimization direction of a set of indicators (including member interests of the internal and external business processes). Individual indicator correlation by the social responsibility components, if their logical direction is not coinciding with the generalizing optimization direction of a set of indicators. Preparation of the normalized indicator matrix of social responsibility components in terms of internal and external enterprise environment.
In our case, four sets of the indicators were being proposed, so the individual indicators were being proposed by each of four components: economic, ecological, social and labour, standard and legal. The general logical optimization direction is a choice of the best indicator (based on the rule ‘the more value, the better’) and subsequent indicator ranking that remained (i.e., sorting by reduction). The direction of the indicator set of the economic component in mathematical interpretation is the following:
where
i is a number of the individual indicators;
j is a number of enterprises.
The individual indicator set direction of the ecological component is the following:
The individual indicator set direction of the social and labour component is the following:
The individual indicator set direction of the standard and legal component is the following:
The optimization direction of the individual indicators should be determined for more objective estimation of the individual indicators. These indicators are from a standpoint of the interests of internal and external participants of the business processes. Normalization or correlation of the individual indicators depends on the optimal direction. Values normalization can be used those individual indicators with the rule ‘the more value, the better’ to bring with them to unify physical nature, in this case to the dimensionless coefficients.
Correlation is performed for the individual indicators that are subordinate to the rule ‘the less value, the better’. This is due to that logical direction of those individual indicators does not coincide with the general direction, which, in turn, subordinate to the rule ‘the more value, the better’.
Stage 4.3. The spidergramms can be built (for better perception) according to the normalized and/or correlated values of the individual indicators, where the number of spidergramm lobe corresponds to the number of indicators by each of the social responsibility components from the standpoint of the interests of the participants of internal and external business processes.
Stage 4.4. Square calculations of obtaining polygons, the values of which will be the coefficients. The squares of polygons can be calculated for a purpose of calculating of the consideration coefficients of participant interests of the internal and external business process from the enterprise social responsibility components. The indicative-geometric method [
7,
8] were being used in this case.
The indicators of the economic, ecological, social and labour, standard and legal components of the social responsibility will be calculated based on obtaining earlier squares of polygons.
The square of the
jth polygon is equal to a sum of squares
ith triangles
, which are formed its. Number of triangles is equal to the number of individual indicators.
The only exception is the last triangle, the square of which is equal to:
Then the square of
jth polygon can be calculated by the following:
Therefore, the calculated polygon squares from each of the four components, taking into account participant interests of the internal and external business processes, are the output data to calculate the generalizing indicators of the economic, ecological, social and labour, standard and legal components. Given the fact that the enterprises invests its own funds and resources to enhance the social responsibility level, but the result is obtained outside, the component calculation is carried out by the following formula:
where
Ki is the general indicator of
ith components (economic, ecological, social and labour, standard and legal);
K3 is the coefficient of the interests of the external business processes account;
KB is the coefficient of the interests of the internal business processes account.
Stage 5. Calculating of the generalizing social responsibility indicator.
A comprehensive social responsibility indicator of the enterprise can be calculated as ‘one minus an average of the harmonious generalizing indicators of the economic, ecological, social and labour, standard, and legal components’. This method was chosen, because the significant difference among the components exists. The standard value of the comprehensive indicator is equal to 1. In this sense, the enterprise can be the most rationality used its resources for interest satisfaction for participants of the internal and external business processes.
For the calculation can be used the following formula:
where
Мi is the coefficient weight of the
ith indicator group;
Ki is the values of
ith generalizing index of the components (economic, ecological, social and labour, standard and legal);
n is the number of the individual indicators for each component.
As the optimal value is suggested ‘1’, as the best result of the enterprise activity, by which all participant interests of the internal and external business processes are satisfied.
Therefore, with the help of cluster analysis the following comprehensive indicator of enterprise social responsibility was being identified:
SRi < 0—enterprise social responsibility has very low level. Analysis is needed for a side of leadership and experts to identify the causes and develop actions of correcting, warning, and improving character to the immediate elimination of the critical situation nature. Otherwise, the inevitable loss of confidence in the enterprise and its position among competing companies.
0 < SRi < 0.47, if the enterprise social responsibility has low level and close to critical. It is necessary to identify the weaknesses that reflect inefficient resource use. Through those weaknesses, the enterprise is not satisfying the stakeholder's interests of internal and external business processes. Some directions for improving enterprise social responsibility to prevent switching to the critical level should be suggested.
0.48 < SRi < 0.55, if the enterprise has an average social responsibility level. Generalizing, the enterprise satisfies the stakeholder's interests of internal and external business processes. However, there can be not insufficient, when the existing potential is affecting to the results of the enterprise. Maybe the priorities should be changed to improve the enterprise social responsibility.
0.56 < SRi < 0.70, if the enterprise social responsibility has high level. Enterprise satisfies the stakeholder's interests of external and internal business processes sufficiently. However, it is necessary to introduce measures to prevent the occurrence of nonconformities the enterprise interests with the stakeholder's interests in some business processes and increasing the level of improvement, analysis of existing problems and making decisions to eliminate them.
0.71 < SRi < 1, if the enterprise has a high social responsibility level. Stakeholder's interests of internal and external business processes have substantially complied. Enterprise is socially responsible and has a very high level of public confidence. It is necessary to analyse the development measures to maintain the appropriate enterprise social responsibility level.
3. Results
3.1. Determination of the Generalizing Social Responsibility Indicator of the Enterprise
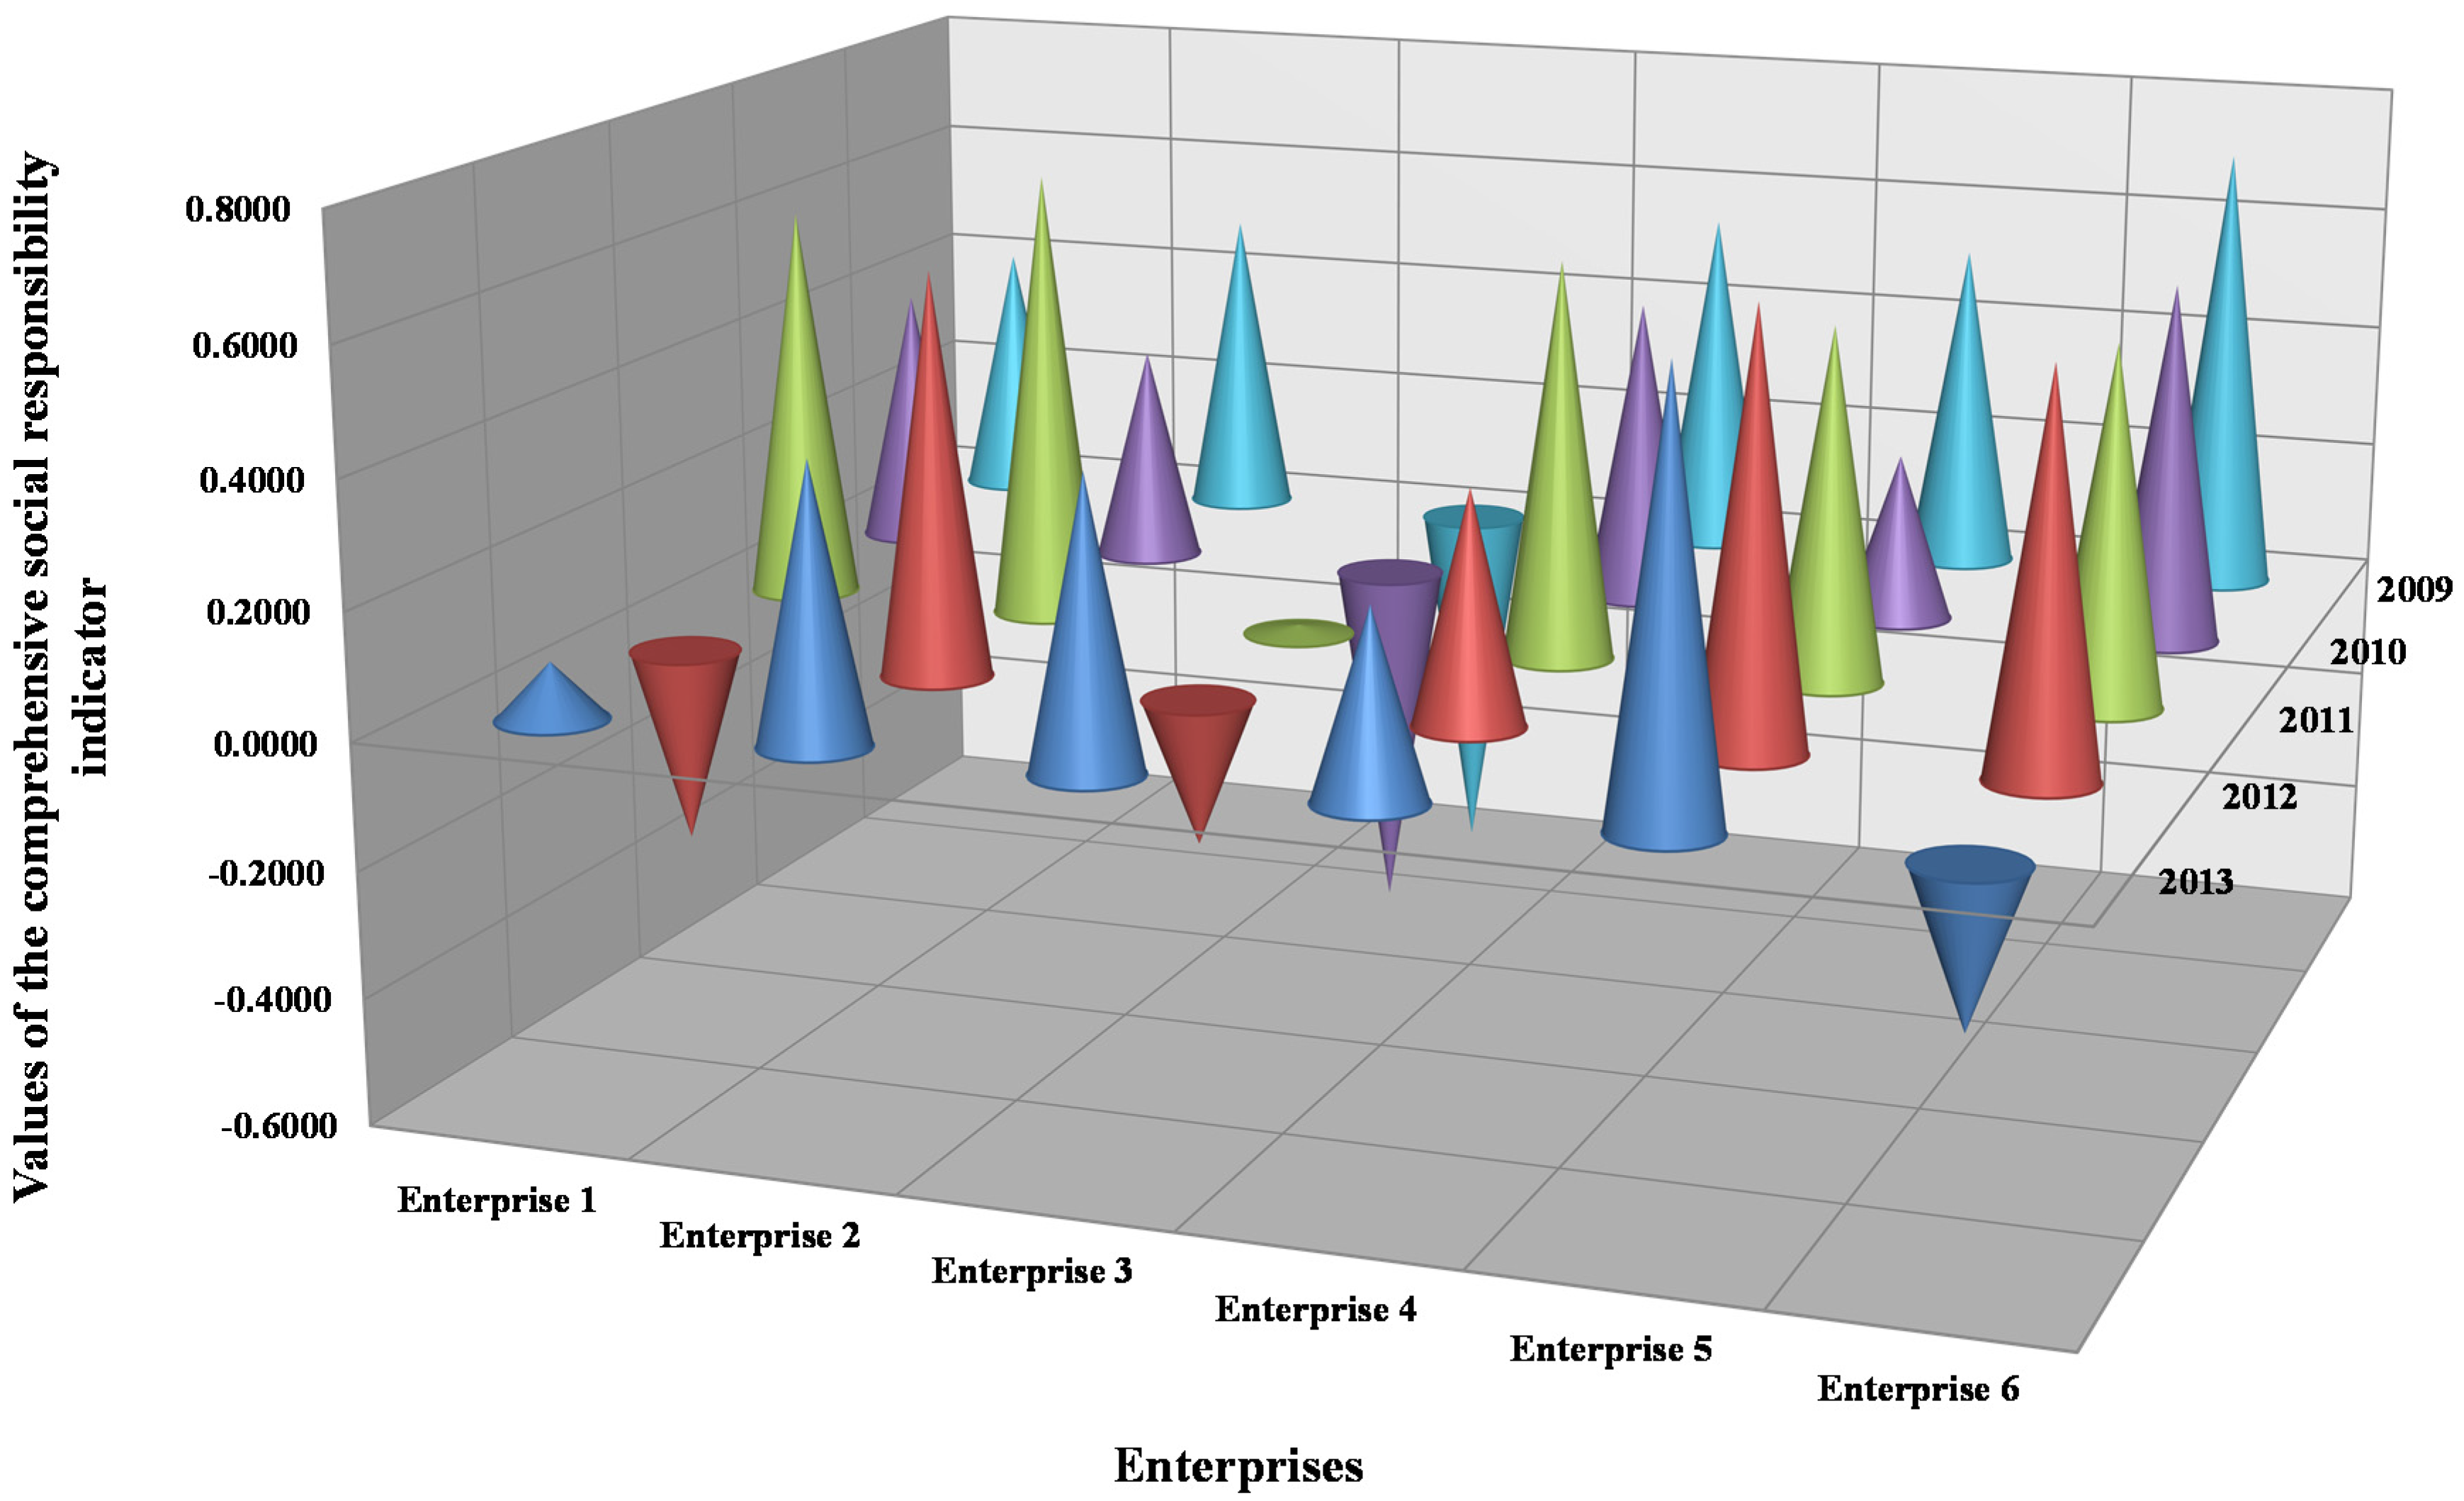
The authors based on an example of the six Ukrainian food (cheese) industry enterprises (
Table 1) were calculating a comprehensive social responsibility indicator. These enterprises were being depersonalized that those calculations will not influence to the real enterprises. Graphical interpretation of these data for better perception is shown in
Figure 2.
Based on data from
Table 1 and
Figure 2, can conclude that the best in social responsibility terms in 2013 is the Enterprise 5 with the value 0.6754. The worst value for the comprehensive social responsibility indicator of the Enterprise 6, because the composite social responsibility indicator is equal −0.2437.
The enterprise activity social side, including Cheese making enterprises (which were being selected by the authors for this research), are increasingly subject to the attention of the world community and almost all states. This applies to any enterprises of all forms of ownership of any activity sphere, regardless of their geographical location. Therefore, in the current economic conditions, more and more enterprises are starting to pay attention to social responsibility issues, to make social reports of their activity and assess the social responsibility level of the enterprise and competitors.
3.2. Calculation of the Generalizing Enterprise Activity Productivity Indicator
One of the main tasks of any enterprise is a productive activity, which is sometimes interpreted as functioning (but it is an inconsistent question), which can be carried out only at coordinating the purposes and results with internal and external business processes and their participants.
Productivity is defined not only by receiving of certain results of goals achievement, but also the rational use of the enterprise resources as achievement of a specific goal predetermines use of certain resources with certain their combination [
9].
Authors suggest to understand the level (the calculated indicator) of achievement of the objectives of the enterprise activity presented by quantitative and quality indicators, which characterize compliance of results of economic, ecological, social, legal components (KS = 4) productivity of the enterprise activity in relation to their purposes, and also the saved-up potential for further conducting socially responsible business processes as productivity of the industrial enterprise activity.
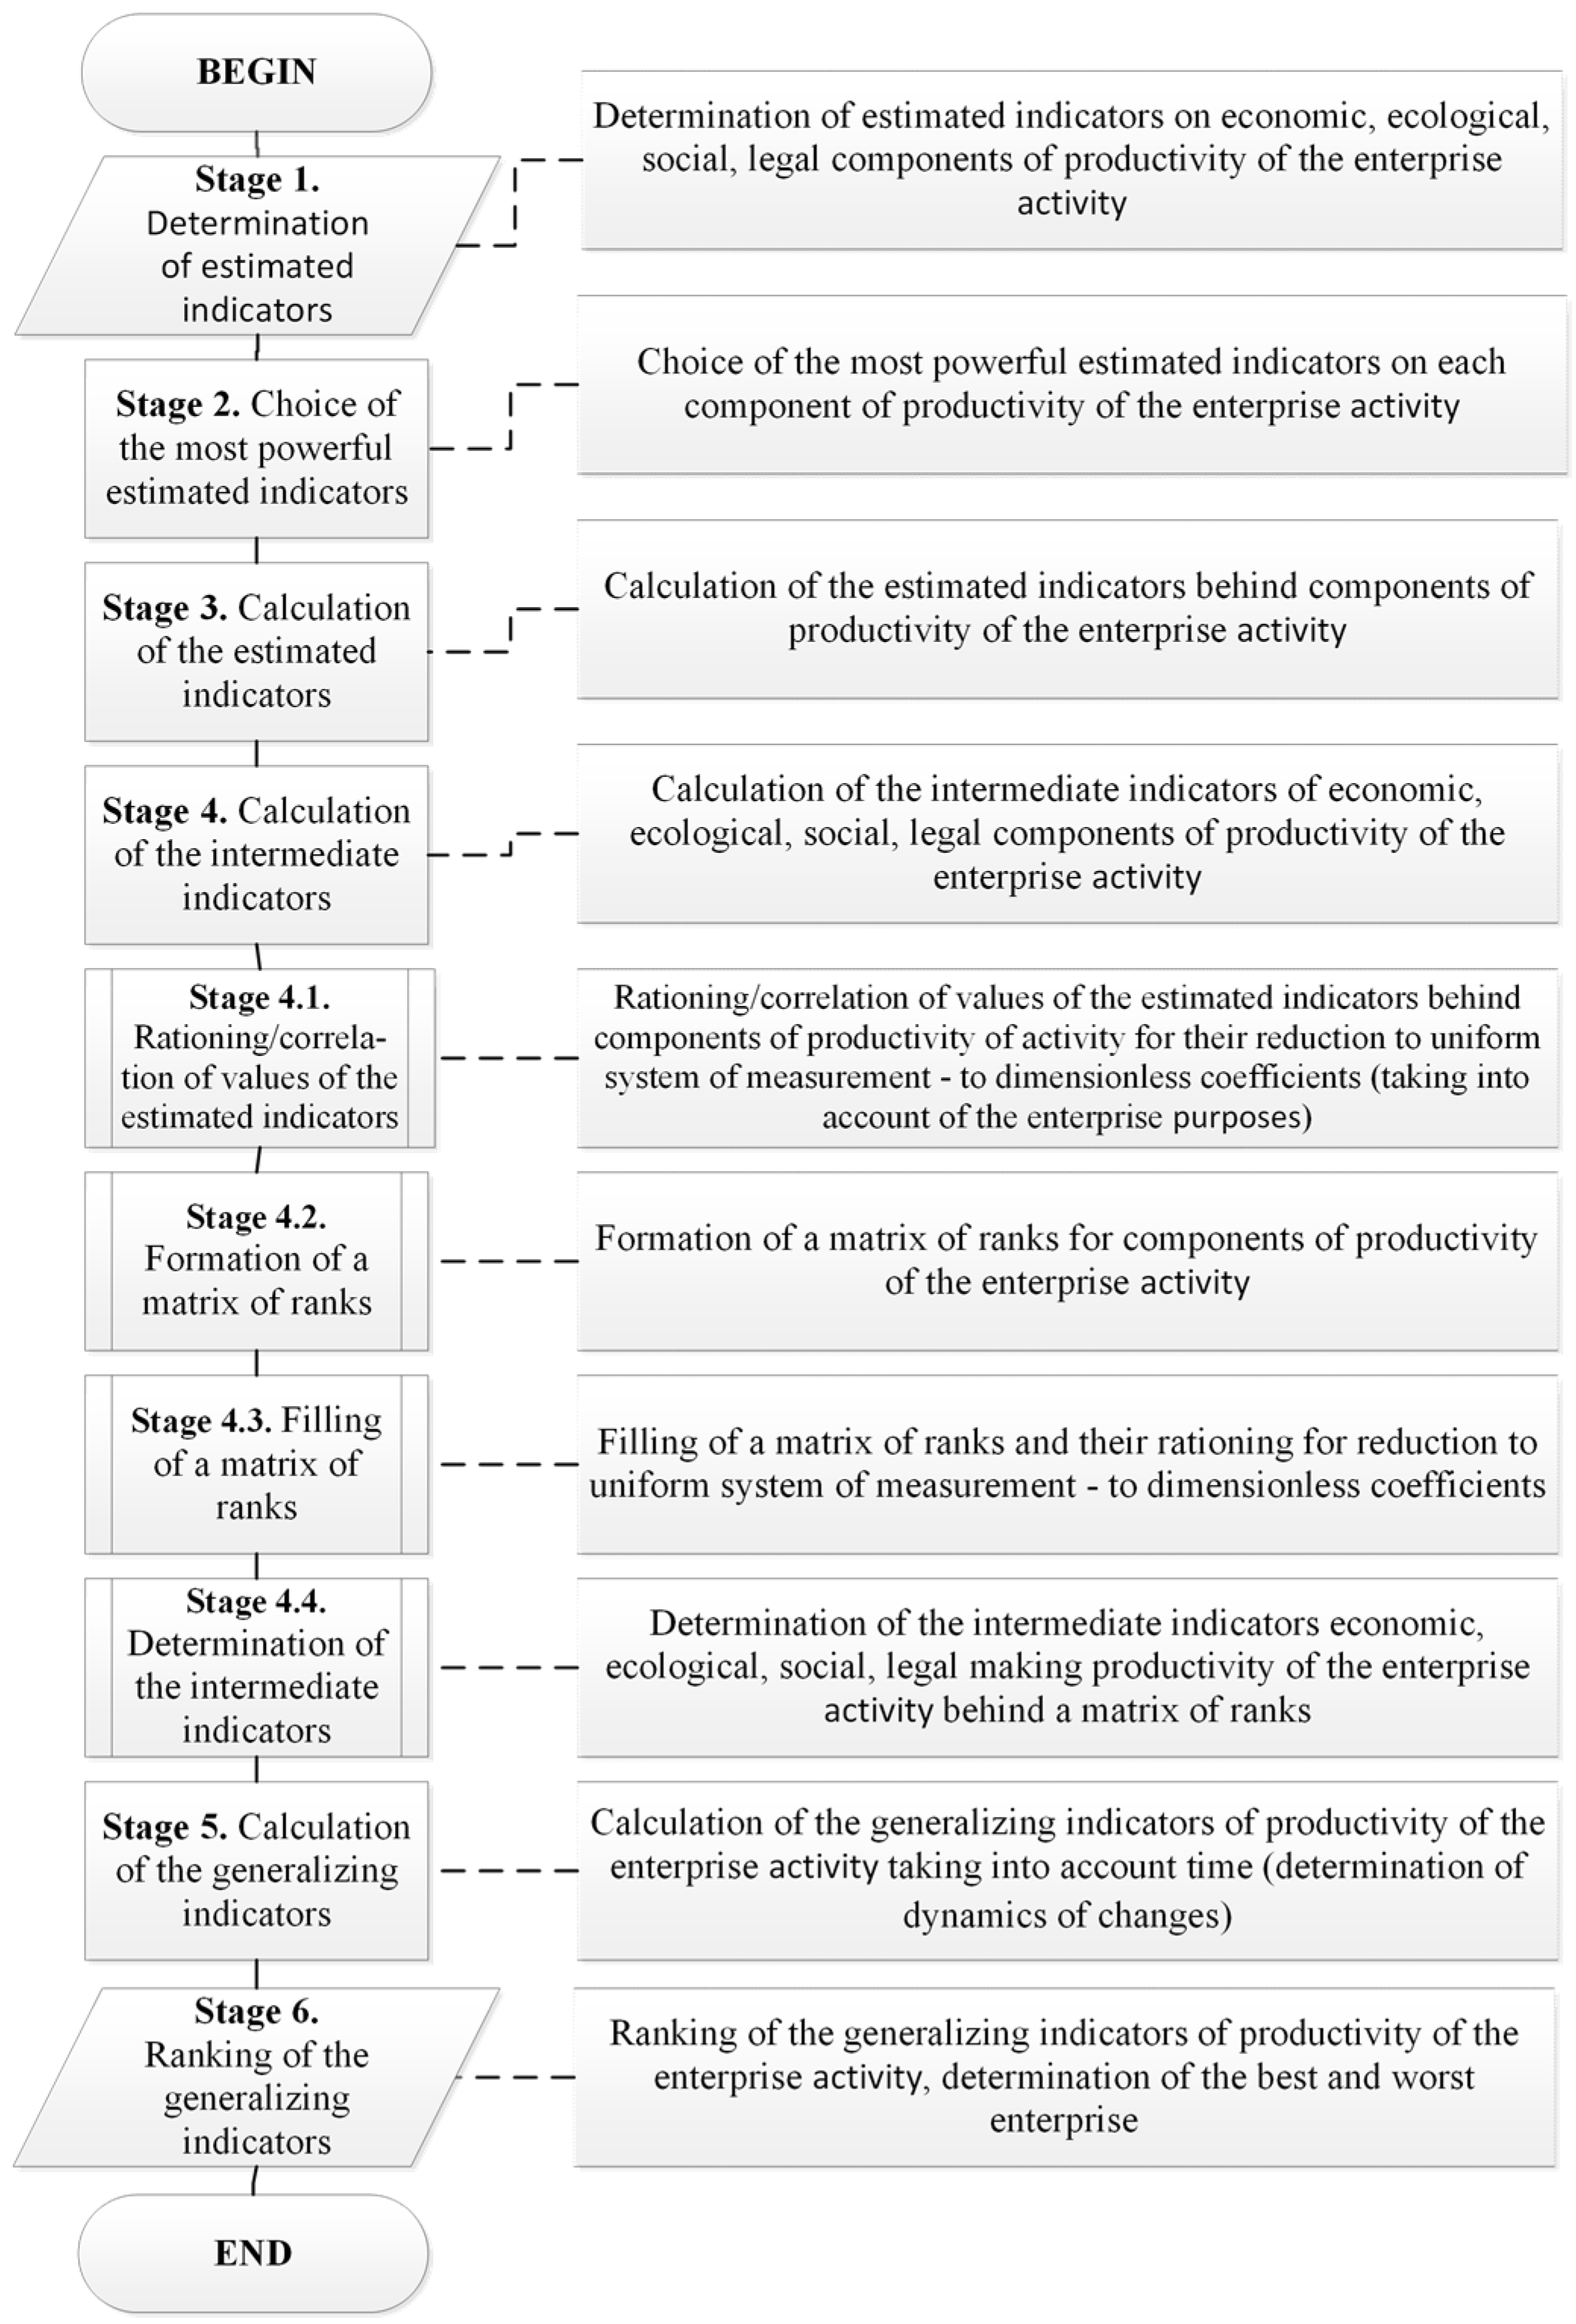
In this regard, the need for an assessment of an indicator of productivity of the industrial enterprise activity for the satisfaction of multilateral interest in this problem appears an important question. For the solution of this question of an assessment of an indicator of productivity of the industrial enterprise activity by authors, the corresponding technique was being proposed (
Figure 3).
As a basis of this technique of the indicator assessment of productivity of the industrial enterprise activity, following two approaches were being used: the balanced system of indicators in the enterprise activity assessment [
10] and matrix approach [
7,
11,
12].
The productivity indicator of the enterprise activity is defined based on the general indicators behind four components: economic, ecological, social and legal. It allows for consideration of all fields of the industrial enterprise activity and its purposes [
10].
The proposed technique of the indicator assessment of a productivity of the industrial enterprise activity consists of the following steps.
Stage 1. Determination of the basic indicators of the enterprise activity, which are a basis for the next calculation of intermediate indicators of economic, ecological, social and legal components of productivity of the enterprise activity. For their determination, a number of indicators can be selected based on groups of the purposes of the industrial enterprise.
Stage 2. For determination of the intermediate indicators of economic, ecological, social, and legal components, a number of estimated indicators was been selected according to groups of the purposes of the industrial enterprise. The method of an expert assessment, which allowed to allocate five most important estimated indicators for each of components of productivity of the enterprise activity, was applied to the determination of the most powerful of the chosen indicators.
Stage 3. Calculation of the estimated indicators of a productivity of the enterprise activity, which are a basis for determination of the intermediated indicators of economic, ecological, social, and legal components.
Stage 4. Calculation of the intermediate indicators of economic, ecological, social, and legal components of a productivity of the enterprise activity.
Stage 4.1. We carry out rationing/correlation of the received values of the estimated indicators by the productivity components of the enterprise activity for reduction them to uniform system of measurement (for obtaining possibility of the comparative analysis) as dimensionless coefficients (taking into account the enterprise purposes).
Stages 4.2–4.3. Formation of a matrix of ranks for productivity components of the enterprise activity.
We consider that the estimated indicators for determination of the intermediate indicators of each of productivity components of the enterprise activity were being chosen proceeding from groups of the purposes of the enterprise. They are an equivalent within each component. Thus, it is possible to enter a matrix of ranks for determination of the intermediate indicators of components.
The previous stage 4.1 has allowed for entering the unified general range of values for each of the estimated indicators from 0 to 1. Thus, the matrix of ranks (which for convenience was proposed for presenting as a two-dimensional matrix with a certain quantity of lines and columns) can be built with a certain stage of differentiation depending on the quantity of the enterprise activity purposes, beginning from two (in the simplest case). In that case, two (S = 2) possible value options – 0.5 and 1will be respectively appropriated to each indicator. Then dimension (N) of the matrix of ranks of Sample will equal (if to break quantity of the purposes (in our case of their Kp = 5) into a quantity of lines, for example, , and quantity of columns, for example, ), . However, in this case the accuracy of determination of the productivity-generalizing indicator of the enterprise activity will be rather low, considering the rather wide range of values of the estimated indicators.
For a more convenient explanation using the matrix approach, the matrix of ranks of Sample (
Table 2) with the parameters determined earlier (S = 2,
,
) are used. However, for a calculation of the productivity-generalizing indicator of the real enterprise activity is used the matrix of the ranks with the differentiation step, which is 0.1 (S = 10), and the obtained dimension of
N = 105 = 10,000.
For the formation of ranks in the matrix, it is necessary to define at first the direction of filling (growth or fall) of ranks (their values) in the matrix. It is possible after the formation of titles (vertical at
(in our case for an example), and horizontal at
(in our case for an example)). Then, having taken the minimum value (in our case it is 0.5) for all estimated indicators, we will obtain that this value (minimum) is answered by the left lower cell of the matrix. By analogy, we will obtain that the maximum value (in our case it is 1) is answered by the right top cell of the matrix. Thus, the direction of exposure of ranks in this matrix was defined. The matrix of ranks is obtained thus the rectangular matrix of Toeplitz or a diagonal and constant matrix [
13,
14], in which on all diagonals are parallel to the main diagonal, the identical elements is called (it is provided in the grey colour in
Table 2).
For bigger more (from the point of view of an assessment of economic indicators), determinations of the intermediated indicators were being normalized by all values in the matrix of ranks, as it is shown in
Table 3.
Thus, it is possible to begin formation of ranks in this matrix. We accept the minimum rank 1 (but for convenience, the minimum rank can equal to any initial value). Then the stage (a difference of the next ranks) with which we determine the ranks, which will put five (according to
Table 5), proceeding from the quantity of the estimated indicators behind each productivity component of the enterprise activity. The order of determination of ranks, which were placed in cells of this matrix, is determined by the importance coefficient of the estimated indicators determined according to the enterprise purposes (according to
Table 5). However, as in our case, the importance coefficients are more whole (Kp = 5) within each component (their quantity equals ‘4’,
Table 5) are equivalent (they are not ranged). Therefore, scales of the estimated indicators also are equivalent, the ranks in matrix cells are distributed evenly behind the filling direction (growth or fall) of ranks (their values) in the matrix of ranks (in our case it is
Table 2): from the left bottom corner (cell) in the right top corner (cell), that is behind the directions of the main diagonal of this matrix (
Table 2).
For example, we will accept values of the estimated indicators as the vector EI = {0.5; 0.5; 1; 1; 0.5}. Then the intermediate indicator of a component will equal 0.3137.
Stage 4.4. Therefore, by the principle described above, the matrix of the ranks with the differentiation step 0.1 (S = 10) was being built for increasing of a determination accuracy of the intermediated indicators of components of productivity of the enterprise activity.
Stage 5. Orthogonal reflection of the options of combinations for the intermediate indicators of economic, ecological, social, legal components of productivity of activity were being executed for a calculation of the generalizing indicator of productivity of the enterprise activity of noted enterprises obtained all on the plane in the set of the rectangular system of coordinate. It is a feasible geometrical interpretation of the obtained results as pieces of the plane, where the coordinates of tops will be determined by all couples (as RSC was being used) possible combinations of productivity components. As the quantity of components of productivity of
KC = 4 components, the quantity of all possible pair combinations taking into account shifts will equal 24 (that is the 12 pieces). Then the distance between obtaining points (pair combinations of productivity components) in RSC can be calculated by the following formula [
15]:
where
D is the distance between the obtained points of all options of combinations for the intermediate indicators of productivity components;
х1, х2, у1, у2 are the coordinates of points (value of the intermediated indicators of productivity components).
We will apply to obtain a set of pieces (12 pieces) the calculation rule of a median (as geometrical interpretation, which was being used) behind their length, which will allow obtaining the generalizing indicator of productivity of the enterprise activity further.
Median in statistics calls a value, which calculated as the middle of the ordered variation row that divides to two equal parts: one-part matters a variation sign less, than average, and the second part is bigger value. The median indicates of a variation sign value, which was reached by half of units of the population [
16].
The median, unlike average degrees, is the concrete characteristic of a variation row, and it has certain values therefore. In addition, it is called still the descriptive characteristic. Such property is connected with the size individual deviations, which are repaid as in case of averages. Descriptive characteristics always answer a certain option [
16]. The generalizing indicators of productivity of the enterprise activity are presented in
Table 4.
Thus, the author’s method of calculation of the generalizing indicator of productivity of the enterprise activity of the elected branch was developed based on the matrix rank approach. The proposed technique allows receiving numerical values of the generalizing indicator of productivity of the enterprise activity due to use of the geometrical interpretation. In addition, using this calculation method of the generalizing indicator of productivity of the enterprise activity of the elected branch was approved on some indicators of the real enterprises (
Table 4). Besides, the proposed technique allows creating practical conclusions of rather real enterprises of the elected branch. Enterprise 1 became the most productive enterprise in 2013 based on the generalizing indicator, which is equal to 0.4778.
However, this result is rather mediocre, in view of that reference value of productivity of the Enterprise 1. In view of that for all studied periods the generalizing indicator of productivity of the activity of the following Enterprise 1; Enterprise 2; Enterprise 3; Enterprise 4; Enterprise 5; Enterprise 6 did not increase value ‘0.5’. It is not possible to determine ranges of admissible values with sufficient accuracy. With that, it is possible to create the general conclusion that productivity of the activity of the studied enterprises of the elected branch has mediocre character and needs the relevant activities concerning its improvement.
3.3. Influence Models Building of the Social Responsibility Level on the Enterprise Productivity Level
The comprehensive social responsibility indicator and generalizing enterprise activity productivity indicator were being calculated on the previous research stages [
5,
9,
15,
17,
18,
19,
20]. The next research stage is the determination of relation for those indicators and a development the model of their dependence.
The new chapter of the modern mathematics, which calls the theory of splines, has rapidly developed in recent years. Splines allows to effectively solve the problems of experimental dependency processing among the parameters that have enough complex structure [
21].
Equally, the rational interpolation and the spline interpolation are one of the polynomial interpolation alternatives.
The basis of the spline interpolation contains the following principle. The interpolation interval is divided into small segments (intervals), on each from which the function is given by the polynomial function of the third degree. The polynomial coefficients are chosen by certain conditions, which are fulfilled (depending on the interpolation method). Common to all types of splines of the third degree requirements are a continuation of this function and passing through the specified points [
21].
The main advantages of spline interpolation are its stability and low complexity. Systems of linear equations, which have to solve for the spline constructing, allow obtaining the polynomial coefficients with high accuracy [
21]. Because the social responsibility influence of the enterprise activity performance is the medium-term, and the spline interpolation of the third degree was being used for determination of their dependence model [
22]. This step will allow not only determine a dependence for indicators, but also will establish what the period of time is need that an increasing of the enterprise social responsibility level will influence to the improvement of the performance level of its activity.
For this research, there are two data sets:
х is a set of the most comprehensive social responsibility indicators;
у is a set of the generalizing productivity [
23] indicator of enterprise activity;
t is the time period (in this case, there are 2009–2013).
The system
y(x) was being proposed, which is described with the help of the following parametric dependencies:
The system y(x) and the influence models were being built with the help of computer mathematical package Maple™. The program automatically determines the possibility of going through the experimental points. Therefore, the model accuracy rating is not required.
The individual economic and mathematical influence model of the comprehensive social responsibility indicator to the generalizing enterprise activity productivity indicator for 2009–2013 was being built based on a determination of this system. For example, economic and mathematical influence models in 2013 were presented in the
Table 5.
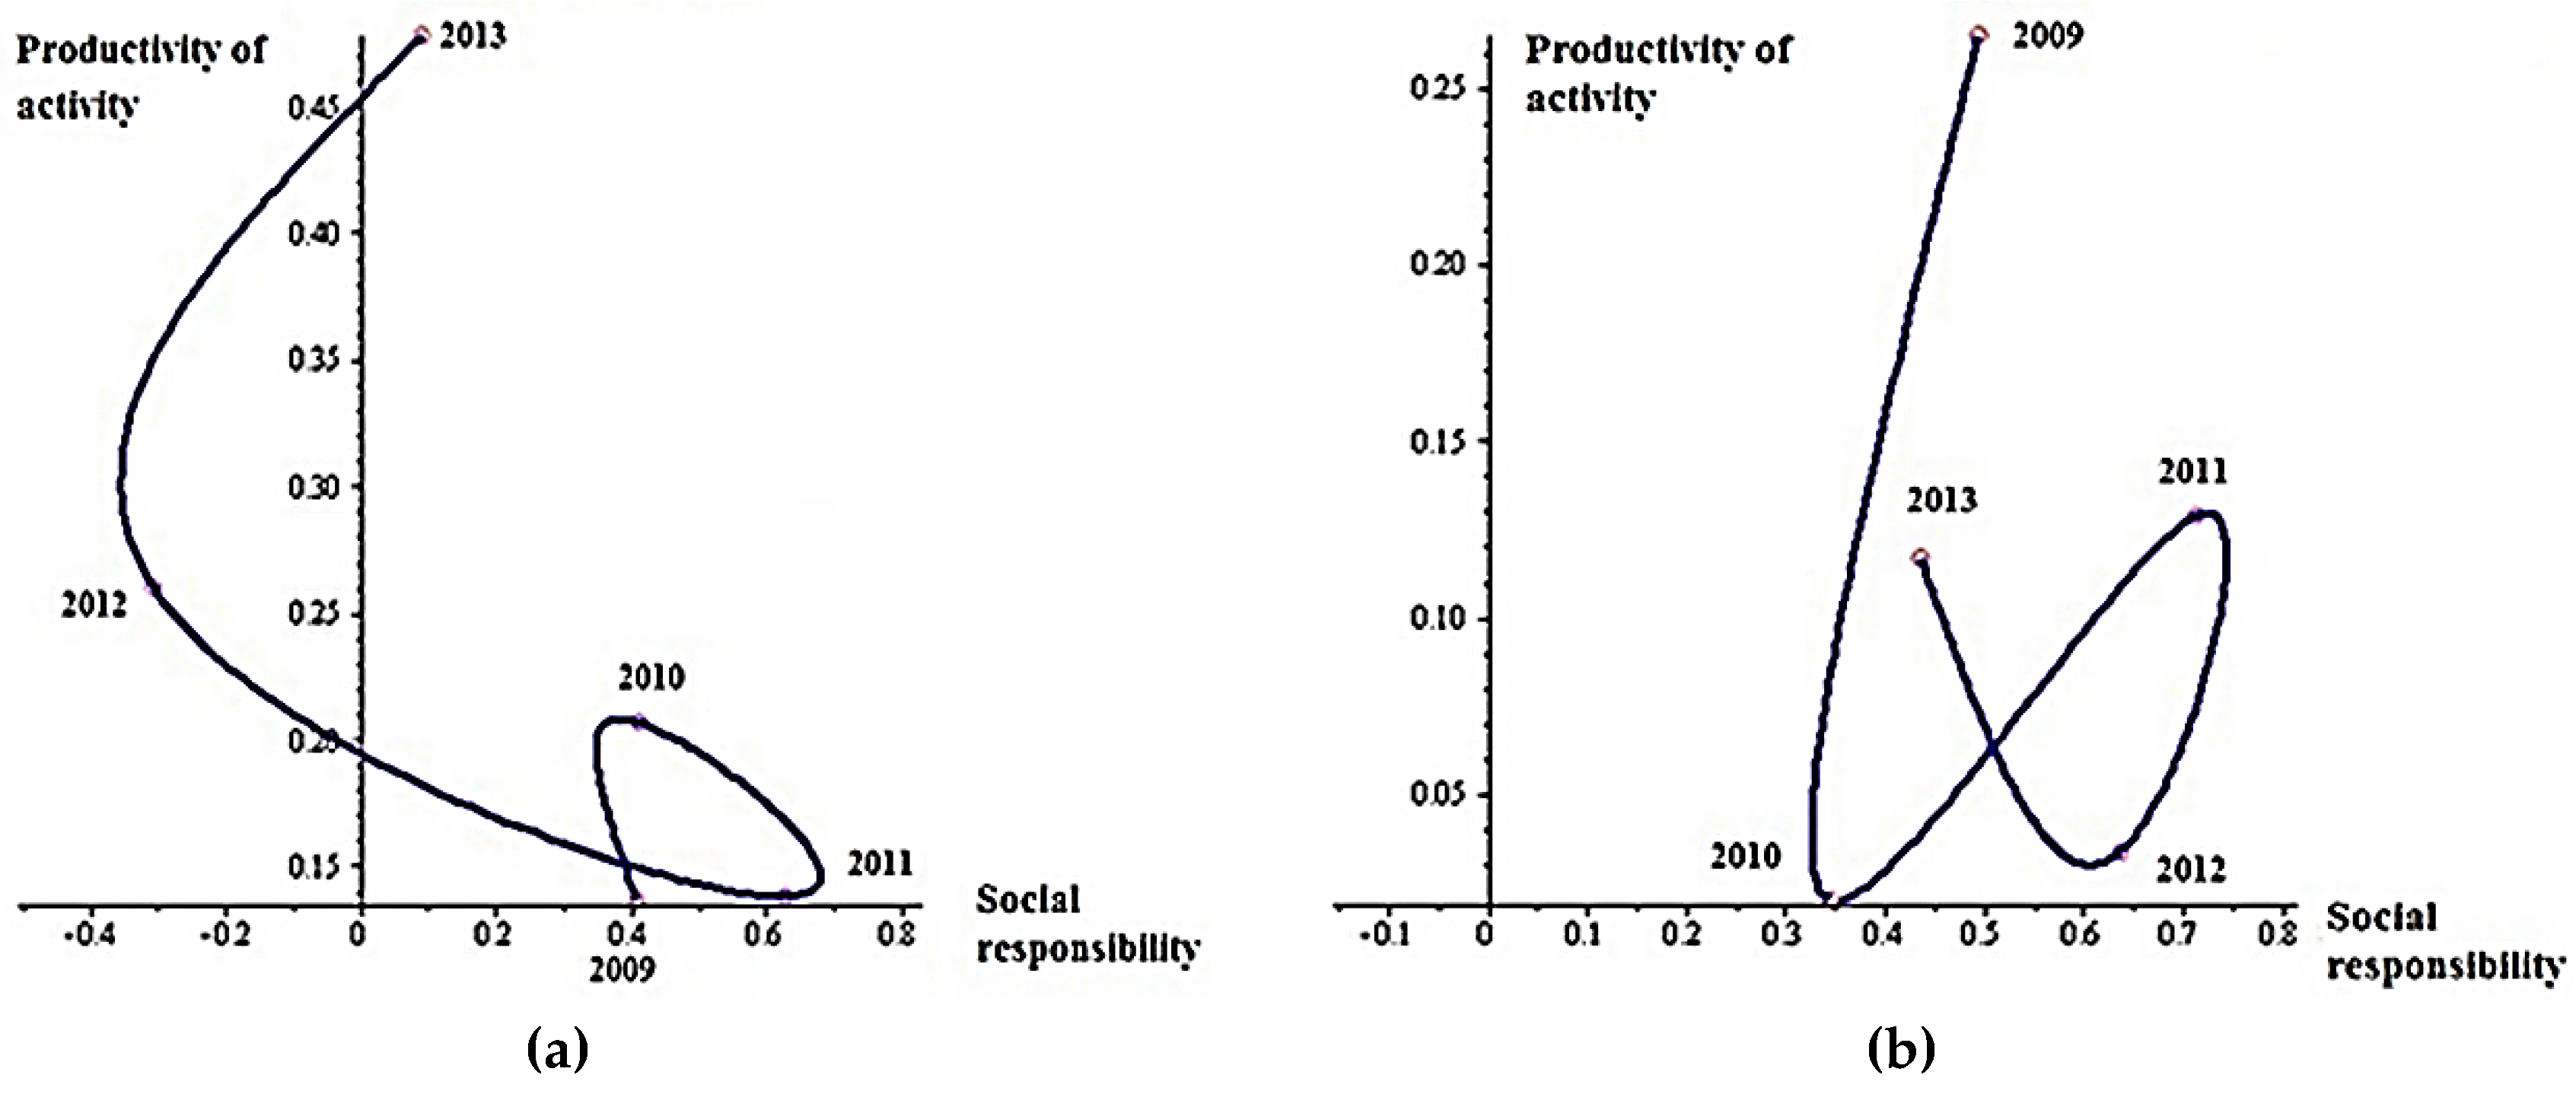
The graphical interpretation of the economic and mathematical influence models of the comprehensive enterprise social responsibility indicator of the generalizing enterprise activity productivity indicator in 2009–2013 is shown in
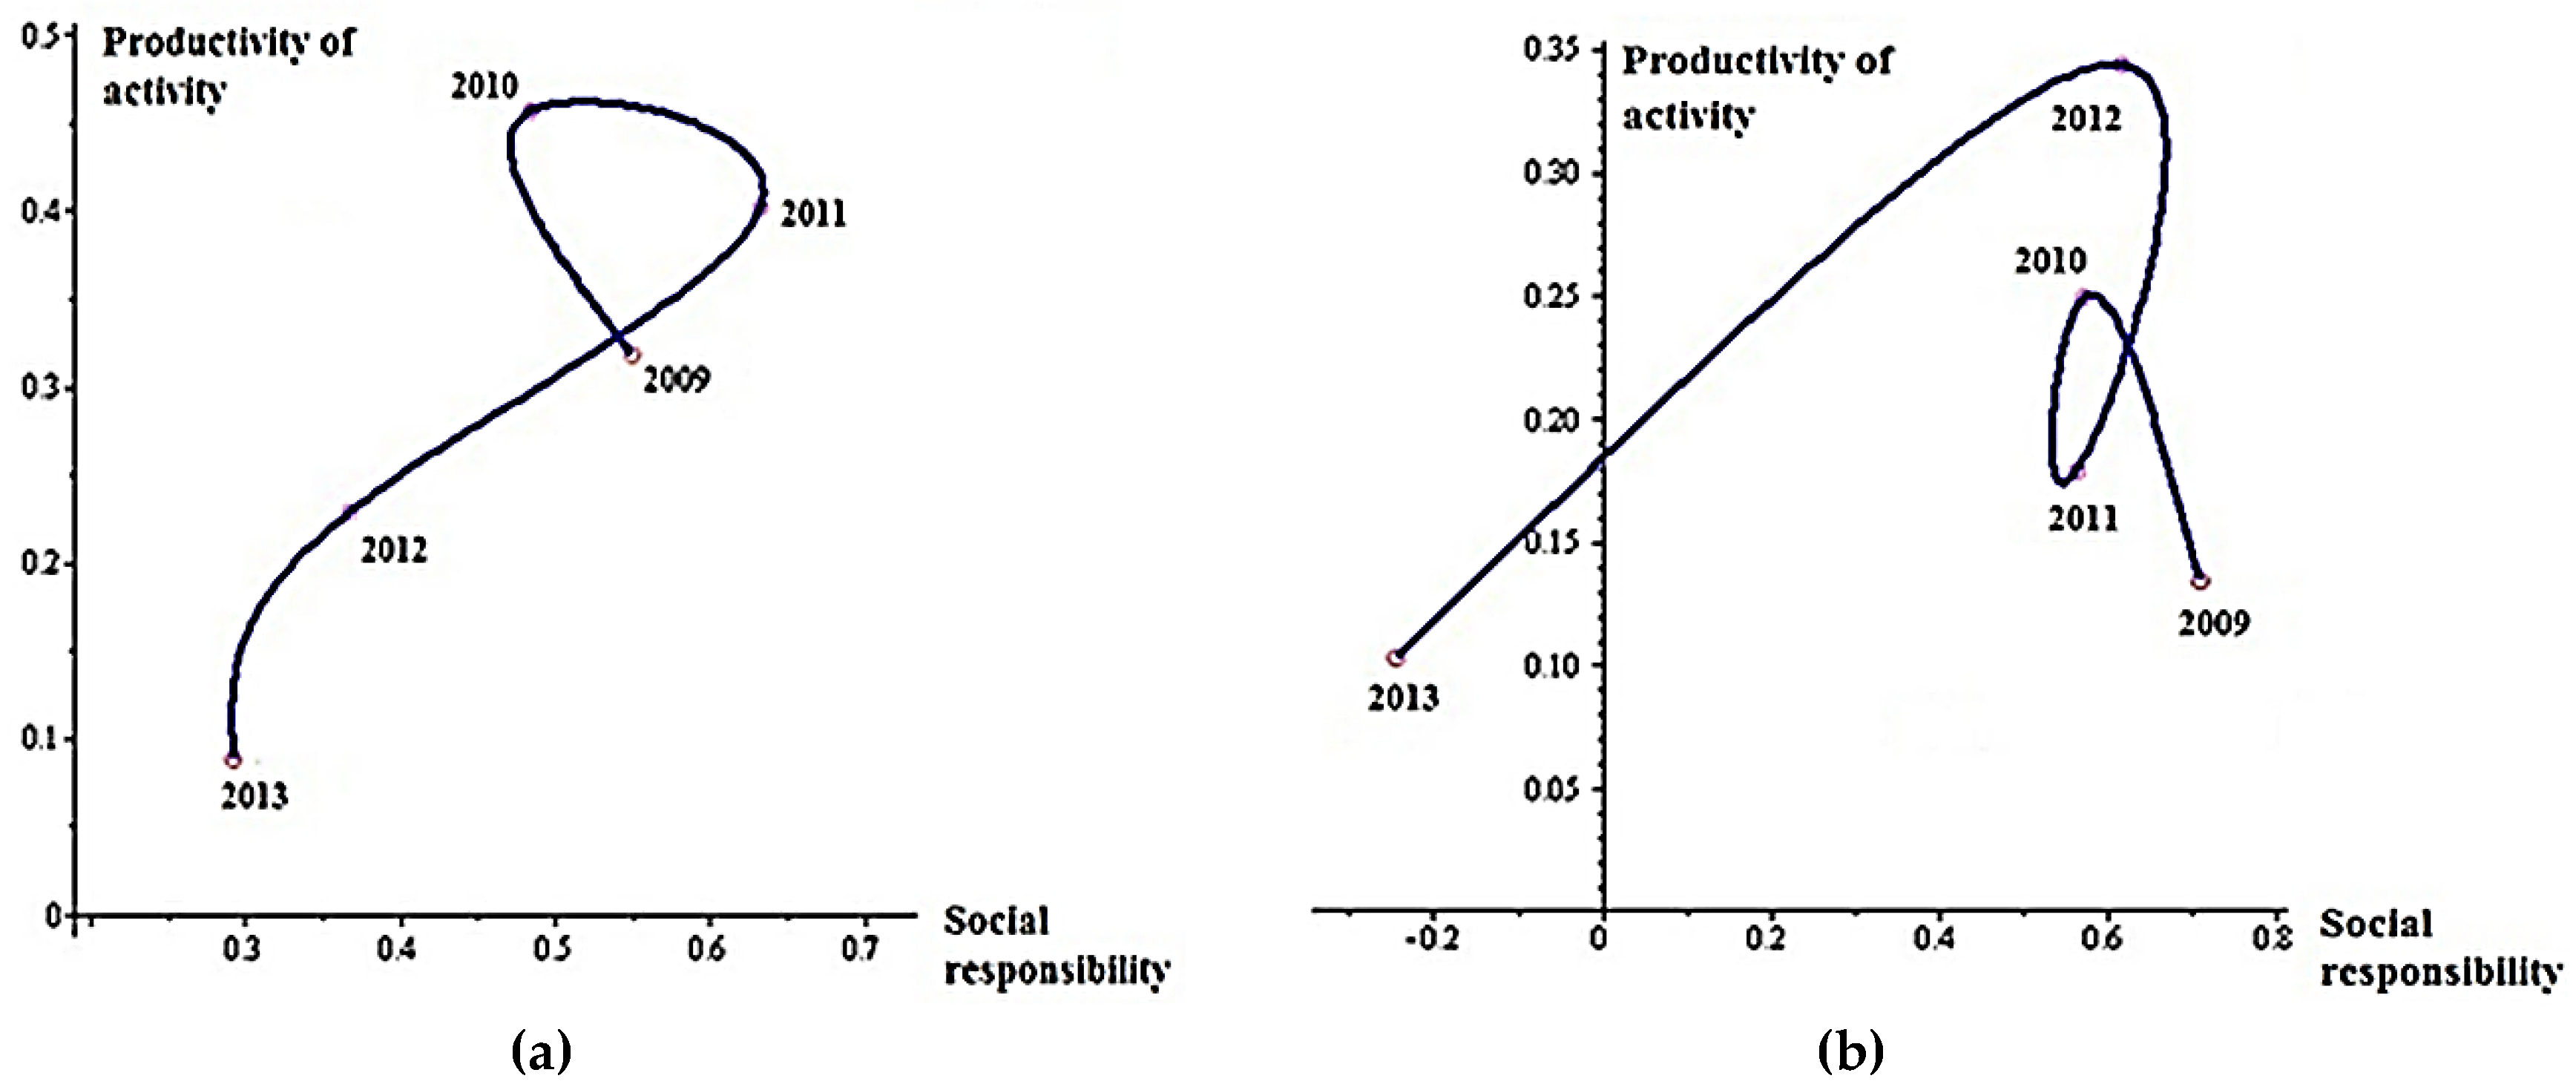
Figure 4.
Based on a fact that the reference value for the researched parameters is 1, then the development dynamics of Enterprise 1 can be called positive (
Figure 4a) generally. This model clearly shows the enterprise activity productivity dependence from the social responsibility in the medium term. For example, the comprehensive social responsibility indicator has increased in 2011, but the enterprise activity productivity has increased only in 2012. However, this enterprise could increase its social responsibility in 2013 and this action has led to increasing of the generalizing activity productivity indicator.
The dynamics model of a dependence of the generalizing activity productivity indicator from the comprehensive social responsibility indicator for Enterprises 2 is not enough stable, as is shown in
Figure 4b. In general, the enterprise activity productivity has quite low value, despite on the relatively high social responsibility indicator.
The dependency of the indicators is observed in the medium term. However, the enterprise management rather inefficiently allocates expenses to the following:
Implementing some programs on reducing the energy consumption and energy intensity of production.
Increasing energy efficiency.
Increasing expenses associated with the implementation of some programs to introduce new systems, quality standards, market research expenses, and establish a degree of customer satisfaction by product quality.
Distribution of investments related to the program implementation to support the territory presence and local community (aimed at the education development, health care, support for culture, arts, sports, non-profit organizations), and others [
24,
25,
26,
27].
Every time, expenses to the listed above program have increased after slight increasing of activity productivity. The sharp productivity drop has occurred in the next year. Thus, Enterprise 2 loses the level of enterprise activity productivity not calculating its opportunities.
Enterprise 4 (
Figure 5a) has a negative dynamics of a dependence of the generalizing enterprise activity productivity indicator from the comprehensive social responsibility indicator, which steadily declining during researched period. Enterprise management [
25,
26,
27] has not any possibility of funds investing in equipment modernization, staff development, and market research due to shortfall net profit. Through an enterprise management policy, the social responsibility and activity productivity levels are decreasing. Enterprise 4 needs an unpopular anti-crisis measures to get the net profit and, only after this action, we can re-pay attention to the social responsibility and the generalizing enterprise activity productivity indicator is lead to the reference value ‘1’.
Management of Enterprise 6 is quite irrational, led its policy of social responsibility. After sharply increasing its comprehensive indicator in 2009, the social responsibility indicator level has almost unchanged. This trend has led to productivity level fluctuations, which, after social responsibility level, is increased, then decreased again. If the enterprise’s management does not introduce new ways to enhance the social responsibility level, will not revise their policy about resource distribution, and spent money to the social initiatives, then the comprehensive social responsibility indicator can be reduced. Moreover, as a result, the generalizing activity productivity indicator can obtain a significant drop in the medium term, that happened in 2013.
4. Conclusions
If the enterprises will compliance the social responsibility principles, then efficiency production will be increased and expenses also will be reduced, sales levels will be increased, qualified professionals will be attracted and retained, employee efficiency will be increased, legal, bureaucratic, and social barriers will be reduced, and some relations with the national and external members of business processes will be established.
Enterprises, which are socially responsible, will be able to manage better by the economic, ecological, social and labour, standard and legal business risks.
Thus, increasing of the social responsibility level allows for improving the enterprise activity productivity level in the medium term. This is due to the confidence growth to the enterprise among members of the internal and external business processes. Investors react positively to social enterprise initiatives, and they are ready to invest costs in such kinds of enterprises. In conclusion, socially responsible management aims not only to make profit, but also to satisfy the interests of members of the internal and external business processes. These enterprises demonstrate the commitment to some social responsibility principles and they are not governed exclusively by the commercial gain principles.
Based on the authors' opinion, calculated indicators of the enterprise social responsibility and activity productivity are dependent and their can use to the best or the worst enterprises of this kind of industry. For example, calculating of a fraction of enterprises into the total amount of incomes that are transferring to budget; calculating the number of employees, which are needed to reduce on each enterprise; calculating a volume of selected investments for each enterprise.
In addition, the best enterprises could be determined for the next aims: based on one of several criteria’s at an estimation of the best enterprise of any brand area; to decrease a volume of taxes paid or granting "tax holidays"; a development of any infrastructure, which is actually in this brand area; at reducing of a number of enterprises in this brand area in any region [
29].
This trend has led to productivity level fluctuations, which, after social responsibility level, is increased, then decreased again. If the enterprise's management does not introduce new ways to enhance the social responsibility level, will not revise their policy about resource distribution, and spent money to the social initiatives, then the comprehensive social responsibility indicator can be reduced. Moreover, as a result, the generalizing activity productivity indicator can obtain a significant drop in the medium term, which happened in 2013.


