The Impact of Equity Funding Dynamics on Venture Success: An Empirical Analysis Based on Crunchbase Data


1
Independent Researcher, 09070 Oristano, Italy
2
Department Statistics, Computer Science, Applications “G. Parenti”, University of Florence, 50134 Florence, Italy
*
Authors to whom correspondence should be addressed.
Economies 2023, 11(1), 19; https://doi.org/10.3390/economies11010019
Submission received: 3 October 2022
/
Revised: 11 December 2022
/
Accepted: 30 December 2022
/
Published: 9 January 2023
Abstract
:Equity funding is a widespread financing form that often accompanies the life cycle of innovative ventures from initial stages until maturity. From the perspective of investors, the event defining the success of an equity financing operation is the exit, which represents the moment when they leave the venture with the purpose of selling their shares. The potential high return of equity funding has motivated an empirical literature aimed at developing predictive models in support of investors’ decisions. However, no study so far has investigated how equity funding dynamics impact on a venture’s chance of successful exit. In this article, we develop a multinomial logistic regression model based on the Crunchbase 2013 Snapshot that relates the events of exit and closure to the amount of equity funds raised at different rounds, while controlling for geographical location, economic sector, age, network ties and several proxies of effectiveness. Our study contributes to the existing literature by providing a quantitative assessment of the impact of equity funding dynamics on a venture’s chance of successful exit and risk of closure that is not limited to the startup stage, but also covers advanced stages of development. In this way, we provide a comprehensive view of the different scenarios that may be envisioned in a venture’s life cycle, which is of core importance to achieve an effective support of investors’ decisions.
1. Introduction
Equity funding is a financing form allowing ventures to raise financial resources without increasing their debt: instead of borrowing money as in debt financing, capital is raised from investors interested in taking part to the entrepreneurial initiative in exchange for shares of the property (Drover et al. 2017). Investors can be individuals, specialized ventures or groups of small lenders who decide to bet on an innovative entrepreneurial idea or business model. If debt financing is about convincing financial intermediaries to lend money behind stringent guarantees and the payment of an interest, equity funding has the goal to attract investors through the perspective of a profitable business (Marsh 1982).
Equity funding is an effective option for receiving financial support without the involvement of credit institutions. It is often exploited by newly established ventures such as startups that could find it difficult to obtain loans through traditional channels (Ueda 2004). However, equity funding is not reserved exclusively to startups, but it often accompanies the life cycle of innovative ventures from initial stages until maturity. In fact, it is not uncommon that ventures resort to equity financing in different stages, even after the startup one, in order to meet short-term liquidity needs or to pursue new growth objectives (Picken 2017).
The equity funding process is characterized by several funding rounds giving rise to a network of stakeholders willing to invest capital into a growing venture in exchange for equity or ownership. A first potential investor is the business angel, who usually gives support to a venture in a premature (seed) phase moved by a belief about the business project (Maxwell et al. 2011). Instead, the venture capitalist is an investor coming into play when the business has already started and its potential is more defined and economically attractive (Fairchild 2011; Fulghieri and Sevilir 2009). From the perspective of investors, the event defining the success of an equity financing operation is the exit, which represents the moment when they leave the venture with the purpose of selling their shares (Cumming and MacIntosh 2003). An exit mainly takes place through Merger & Acquisition (M&A) operations between ventures, or through the public sale of shares, known as Initial Public Offering (IPO) (Cefis et al. 2022).
The potential high return associated to equity funding has motivated an empirical literature aimed at developing predictive models in support of investors’ decisions. Studies of this kind are traced back to the late 90s and early 2000s (Ali-Yrkko et al. 2005; Lussier 1995; Lussier and Pfeifer 2001; Slowinski et al. 1997; Wei et al. 2008), and have widely spread after the advent of Crunchbase (Crunchbase Inc. 2020) in 2007. Crunchbase is a platform gathering information on financing, ownership and acquisitions relatively to public and private ventures on a global scale. Crunchbase data have allowed researchers to significantly increase the sample size and, more important, to exploit information on equity funding dynamics (Arroyo et al. 2019; Bento 2018; Ferrati et al. 2021; Krishna et al. 2016; Shi et al. 2020; Xiang et al. 2012; Zbikowski and Antosiuk 2021). Existing empirical studies based on Crunchbase data are in fact based on large samples ranging from 11,000 (Ferrati et al. 2021) to more than 200,000 ventures (Zbikowski and Antosiuk 2021), and consider many predictive variables, even more than a hundred (Arroyo et al. 2019; Bento 2018). However, these studies have the common limitation to follow a machine learning approach aimed at optimizing the predictive accuracy, with few or no interest in the explanation of how each variable contributes to the prediction. Yet, five out of these seven studies employ logistic regression with good results (Bento 2018; Krishna et al. 2016; Shi et al. 2020; Xiang et al. 2012; Zbikowski and Antosiuk 2021), but, surprisingly, no one reports parameter estimates. Logistic regression, compared to other machine learning methods, is in fact a statistical model, and the inspection of estimated parameters would inform on the impact of each predictive variable on the outcome. Moreover, excepting Arroyo et al. (2019) and Shi et al. (2020), all these studies focus on a binary classification problem, contrasting exited ventures against operating or closed ones (Bento 2018; Ferrati et al. 2021), exited or operating ventures against closed ones (Zbikowski and Antosiuk 2021), operating against not-operating ventures (Krishna et al. 2016), and ventures exited through M&A against all other ones (Xiang et al. 2012). In this way, only a partial view of the different scenarios that may be envisioned in a venture’s life cycle is provided. For instance, contrasting exited ventures against operating or closed ones prevents the investigation of a venture’s chance to continue its activity autonomously, while contrasting exited ventures against operating or closed ones does not allow to assess the risk of closure. The characteristics of existing empirical studies predicting venture success based on equity funding dynamics are summarized in Table 1.
Factors determining survival or successful exit of ventures have been widely theorized and empirically assessed in the literature, including reputation of the entrepreneur (Nahata 2008), venture size (Coad et al. 2016), human capital (Montanaro et al. 2022), and financial management (Saridakis et al. 2022). However, to our knowledge, no study has investigated how equity funding dynamics impact on a venture’s chance of successful exit. Moreover, most existing researches addressing venture success are explicitly focused on startups or consider a short observation window (10 or less years from foundation), so that exits occurring in advanced stages of development are ignored. In this article, we try to fill this gap by developing a multinomial logistic regression model based on the Crunchbase 2013 Snapshot (Crunchbase Inc. 2013) that relates the events of successful exit and closure to the amount of equity funds raised at different rounds, while controlling for geographical location, economic sector, age, network ties and several proxies of effectiveness. Our study contributes to the existing literature by providing a quantitative assessment of the impact of equity funding dynamics on a venture’s chance of successful exit and risk of closure that is not limited to the startup stage, but also covers advanced stages of development. In this way, we provide a comprehensive view of the different scenarios that may be envisioned in a venture’s life cycle, which is of core importance to achieve an effective support of investors’ decisions.
2. Sample and Methodology
Our study is based on the Crunchbase 2013 Snapshot (Crunchbase Inc. 2013), which contains a replica of the Crunchbase database up to 31 December 2013. This database is the latest one licensed under Creative Commons. The Crunchbase 2013 Snapshot has a relational structure consisting of 11 tables in SQL dump format, and collects information on 21,789 ventures and on the related products, investors, acquisitions, and funding rounds. We considered the following two tables: object, which contains time-invariant information on each venture (country, economic sector, foundation and exiting date, number of milestones achieved, number of strategic relationships established, etc.), and funding_rounds, which includes information on all funding rounds in which each venture was involved (date, typology, participants, funds raised, etc.).
In the remainder of this section, we define the outcome variable (Section 2.1), detail the sample selection (Section 2.2), describe research and control variables (Section 2.3 and Section 2.4, respectively), and present the statistical model (Section 2.5). The main steps of our study are illustrated in Figure 1.
2.1. Outcome Variable
In order to achieve a comprehensive view of the different scenarios that may be envisioned in a venture’s life cycle, we defined an outcome variable including the following three exhaustive and mutually exclusive events:
- ‘operating’: the venture is still operating at 31 December 2013;
- ‘exited’: the venture has gone through M&A or IPO before 31 December 2013;
- ‘closed’: the venture has closed due to bankruptcy, ceased trading, or any form of liquidation before 31 December 2013.
The outcome variable is interpreted in the perspective of investors: the event ‘exited’ is the successful goal, the event ‘closed’ is its negative counterpart, and the event ‘operating’ is a neutral situation taken as reference. However, the fact that a venture is still operating after several years may indicate that it has reached a sufficient degree of maturity and stability to continue its activity autonomously. As such, even the event ‘operating’ can be viewed as a fruitful situation for investors, although with a lower expected return than the event ‘exited’.
2.2. Sample Selection
The three target events ‘operating’, ‘exited’, and ‘closed’ appear very imbalanced across the 21,789 ventures in the Crunchbase 2013 Snapshot: 18406 (84.5%) ventures are still operating, 2117 (9.7%) are exited, and 1266 (5.8%) are closed. As suggested by the fourth quintile of age for exited ventures equal to 20 years, successful exit (i.e., through M&A or IPO) is likely to occur also in advanced stages of development. Therefore, in order to balance the representativeness of the three events, we excluded all ventures aged more than 20 years. We also excluded all ventures involved in no funding rounds, because they provide no information on the relationship between successful exit and equity funding dynamics.
These selection criteria led to a sample of 5147 ventures, where 1924 (37.4%) are still operating, 1976 (38.4%) are exited, and 1247 (24.2%) are closed.
2.3. Research Variables
In order to represent equity funding dynamics of ventures, we defined several variables equal to the amount of funds raised across all funding rounds of the same typology. Typologies of funding rounds in the Crunchbase 2013 Snapshot include:
- ‘Angel’: small rounds designed for new ventures, where participants can be individual angel investors, angel investor groups, friends, and familiars;
- ‘Venture—Series A’ and ‘Venture—Series B’: funding rounds for earlier stage ventures, ranging on average between one and USD 30 million;
- ‘Venture—Series C’ and ‘Venture—Series D and onwards’: later funding rounds designed for established ventures, typically consisting of amounts over USD 10 million;
- ‘Venture—Series unknown’: funding rounds for established ventures where the series has not been specified.
We also defined two global measures of equity funding dynamics: (i) the total number of funding rounds (variable funding_rounds), and (ii) the number of unique investors across all funding rounds (variable participants).
Research variables are listed and described in Table 2, while their sample statistics are reported in Table 3.
It can be noted that the number of funding rounds is comprised between 1 and 13, with mean equal to 1.9, while the typology of funding rounds with the highest average amount is ‘Venture—Unknown series’ (USD 4.6 million), followed by rounds of series D and onwards (USD 3.4 million). Furthermore, rounds of series A, B and C consist of an average amount between 2.3 and USD 2.7 million, while rounds of type ‘Angel’ involve the lowest average amount USD 0.1 million). In the sample, there are 521 ventures (10.1%) that raised no funds (datum not shown in the tables).
2.4. Control Variables
Since a venture’s chance of successful exit and risk of closure may be determined by other factors besides our research variables, we also defined several control variables. The first two control variables include geographical location (variable location) and economic sector (variable sector), which should account for different market conditions across ventures. Age (variable age) is a third control variable that should take into account the fact that older ventures may have higher chance of exit and less risk of closure. Also, age at first and at last funding (variables age_first_fund and age_last_fund), respectively) were considered in order to account for the distribution of funds raised across a venture’s life. A further control variable considered in this study is the number of strategic relationships established (variable relationships), which is supposed to reflect network ties. Finally, we defined three proxies of effectiveness: the total number of milestones achieved (variable milestone), and two dummy variables indicating whether at least one milestone was achieved before the first and the last funding (variables miles_first_fund and miles_last_fund).
Control variables are listed and described in Table 2, while their sample statistics are reported in Table 3 and Table 4. In order to limit the occurrence of small frequencies, geographical locations were reclassified into ‘USA’, ‘Europe’, ‘Asia’, and ‘other’, and economic sectors ‘cleantech’, ‘security’, ‘manufacturing’, ‘transportation’, ‘automotive’, ‘nonprofit’, and ‘local’ were included into the category ‘other’. It can be noted that the majority of ventures are located in USA (75.3%) and in Europe (15.7%), and that the most prevalent economic sectors are ‘software’ (17.3%) and ‘web’ (15.5%), followed by ‘entertainment’ (12.9%), ‘sales’ (11.3%), ‘enterprise’ (10.7%), and ‘health’ (10.4%). Also, 14.8% and 15.7% of ventures achieved at least one milestone before the first and the last funding, respectively.
2.5. Statistical Model
In order to assess the impact of research and control variables on a venture’s chance of successful exit and risk of closure, multinomial logistic regression (McCullagh and Nelder 2002, p. 159ff; Hosmer and Lemeshow 2000, p. 269ff) was employed. Multinomial logistic regression allows to describe the probability distribution of a categorical outcome variable Y as a function of the values taken by a set of explanatory variables, and can be viewed as a generalization of logistic regression when the outcome variable has more than two unordered categories.
Denote the categories of the outcome variable Y with values , where value 0 is assigned to the reference category and K is the total number of categories. Also, let be a vector including value 1 in the first position and, in the subsequent positions, the values of explanatory variables observed on unit i (with dummy coding for categorical variables). The multinomial logistic regression model is defined as:
where is a set of parameters to be estimated referred to the category of Y labeled as k, with p equal to the number of explanatory variables after dummy coding. The probability distribution of Y predicted by model (1) for unit i is:
where is an indicator function taking value 1 if , and value 0 otherwise.
It can be noted that model (1) expresses the logarithmic probability ratio of each non-reference category of Y to the reference one as a linear combination of the values taken by explanatory variables. Such probability ratios are often called odds, while their logarithm is known as logit. The k-th odds indicates how much the category of Y labeled as k is more or less likely than the reference one (labeled as 0), and it can be shown that, for , the quantity equates to the variation ratio of the k-th odds due to a unit increase in the value of the j-th explanatory variable at constant values of the other explanatory variables. Therefore, parameter with represents the net effect of the j-th explanatory variable on the k-th odds. Note that parameters act as intercepts and, in particular, represents the k-th odds when all explanatory variables take value 0.
Parameters can be estimated through the maximum likelihood method, consisting in selecting their values that maximize the likelihood (or, more conveniently, the log likelihood) of the model. Maximum likelihood is a widely employed estimation technique due to its desirable statistical properties, i.e., consistency, asymptotic efficiency, and asymptotic Gaussian distribution. Assuming that the sample units are independent, the log likelihood of model (1) is:
where is the number of events experienced by unit i () falling in the category of Y labeled as k, and is the total number of events experienced by unit i. In the case where each sampling unit experiences one and only one event, i.e., , the log likelihood simplifies into:
where is an indicator function taking value 1 if the event experienced by unit i falls in the category of Y labeled as k, and value 0 otherwise.
Due to the asymptotic Gaussian distribution of maximum likelihood estimates, it is possible to compute, for each j and k, the p-value for the significance test on the hypothesis , which equates to the absence of an effect of the j-th explanatory variable on the k-th odds. It is also possible to assess the importance of each explanatory variable based on the analysis of deviance. The deviance of model (1) is defined as minus twice the log likelihood:
Analogously, we can define the deviance of any reduced model obtained by setting to zero one or more parameters in model (1). The deviance can be interpreted as the amount of unexplained variability of a model compared to a situation of perfect fit, which is provided by the saturated model, i.e., a model with one parameter per sampling unit.
Let be the deviance of the reduced model obtained by setting to zero the parameters associated to the j-th explanatory variable in model (1). The difference represents the increase in the deviance when the j-th explanatory variable is excluded from the model, therefore it can be interpreted as the deviance explained by such variable. Consequently, the relative importance of the j-th explanatory variable across all the ones included in the model can be measured as:
It can be shown that is asymptotically distributed as a Chi-squared random variable with a number of degrees of freedom equal to the number of parameters associated to the j-th explanatory variable. This result can be exploited to assess the statistical significance of the contribution of each explanatory variable to the model.
3. Results and Discussion
Parameter estimation of the multinomial logistic regression model was performed in R for Statistical Computing (R Core Team 2022) by means of the function multinom in the package nnet (Venables and Ripley 2002). The results of parameter estimation are shown in Table 5, while the corresponding impact on a venture’s chance of exit (i.e., the odds of the event ‘exited’ versus ‘operating’) and risk of closure (i.e., the odds of the event ‘closed’ versus ‘operating’) are provided in Table 6. These results are discussed relatively to the impact of each research variable in Section 3.1, and to each control variable in Section 3.2. Subsequently, Section 3.3 reports the analysis of deviance aimed at assessing the importance of each variable, and Section 3.4 provides an assessment of the predictive power of the model, which is compared with the ones reported by existing empirical studies.
3.1. Impact of Research Variables
The number of unique participants across all funding rounds significantly favours successful exit. Specifically, all other characteristics being equal, the chance of exit is increased by 4.61% for one more unique participant. This finding suggests that the number of unique participants in the funding rounds acts as a proxy of the short term attractiveness of a venture, which in turn is positively correlated to the chance of exit. Instead, the influence of the total number of funding rounds seems to influence neither the chance of exit nor the risk of closure.
Angel funds provide significant protection from the risk of closure, with no significant influence on the chance of exit. In particular, all other characteristics being equal, USD 1 million more of angel funds reduces the risk of closure by . Instead, the amount of funds raised in rounds of series B impacts positively on both the chance of exit ( for each USD million more) and the risk of closure ( for each USD 1 million more). On the opposite, the amount of funds raised in rounds of series C impacts negatively on the chance of exit ( for each USD 1 million more), with no significant effect on the risk of closure. However, if funds are raised in later rounds, the impact on the chance of exit returns to be positive ( for each USD 1 million more).
These results suggest that angel funds help the venture in the initial steps of its activity preventing early closure but without increasing the attention of potential buyers. Instead, raising funds in early stages (i.e., up to series B) may attract potential buyers and therefore increase the chance of exit, but, since the venture is still young, the entrepreneurial risk remains high. When funds are raised in intermediate stages (i.e., series C), the venture is likely to have achieved the maturity needed to continue the activity autonomously, with the consequence of a decrease in the chance of exit. On the contrary, raising funds in later stages (i.e., series D and onwards) may increase the chance of exit because the maturity achieved by a venture has also the effect of raising attentions from potential buyers.
3.2. Impact of Control Variables
Geographical location has a significant influence on a venture’s chance of exit and risk of closure. Specifically, all other characteristics being equal, ventures located in Europe, in Asia, and in other countries have a lower chance of exit (, and , respectively) compared to ventures located in USA; ventures located in Europe and in other countries have also a lower risk of closure ( and , respectively). These findings suggest that the US market is the most dynamic and competitive one across the world, therefore there is a higher chance of success but also a greater entrepreneurial risk.
Economic sector is a further factor affecting both the chance of exit and the risk of closure. Specifically, all other characteristics being equal, sectors ‘enterprise’ and ‘health’ have a lower risk of closure compared to sector ‘software’ ( and , respectively), while the chance of exit of sector ‘other’ is lower than the one of sector ‘software’ (). Instead, sector ‘web’ has higher chance of exit () and higher risk of closure () compared to sector ‘software’. On one hand, these results highlight the higher riskiness of software development with respect to other prevalent activities such as those related to enterprise and health, but without a significant increase in the chance of exit. Activities in the category ’other’ show an opposite behavior, as they are characterized by a higher chance of success compared to software development, but without a significant increase in the risk of closure. On the other hand, activities related to web services result even more profitable (higher chance of exit) and, at the same time, more risky (higher risk of closure).
Age influences positively the chance of exit. In particular, we see that, all other characteristics being equal, one more year of activity increases the chance of exit by 69.48%, with no significant effect on the risk of closure. This result is quite intuitive, because the more a venture grows older, the less initial difficulties impact on its life cycle, leading to a higher life expectancy and, as a consequence, to a higher chance of exit. Instead, age at last funding seems to significantly reduce both the chance of exit and the risk of closure. Specifically, one more year at last funding reduces the chance of exit by 33.78% and the risk of closure by 13.98%. This finding suggests that ventures raising funds in old age have less risk of closure, but also less chance of exit, presumably because they have achieved enough maturity and solidity to continue their activity autonomously.
The ability of establishing strategic relationships has a protective effect against closure. Precisely, all other characteristics being equal, establishing one more strategic relationship decreases the risk of closure by 10.11%. This result is widely expected because strategic relationships contribute to enhance the competitiveness of ventures, leading to a more profitable activity.
Achieving milestones results in an increased chance of exit. Specifically, all other characteristics being equal, the chance of exit is increased by 64.95% for one more milestone achieved. This finding suggests that, as widely expected, a prompt achievement of milestones increases the ability of ventures to attract investors in the short term and, consequently, rises the chance of exit in the long term. On the opposite, the achievement of at least one milestone before the last funding results to decrease the chance of exit by 28.01% but without a significant reduction in the risk of closure: the fact that an important economic objective has been achieved before the last funding may reflect a longstanding effective management of financial resources that makes the venture more willing to continue its activity autonomously than to seek an exit.
3.3. Importance of Variables
The magnitude of estimated parameters provides an indication of the importance of each variable in predicting the outcome. However, a more rigorous assessment of the importance of variables can be made through the analysis of deviance, which decomposes the deviance explained by the multinomial logistic regression model into the deviance explained by each variable (see Section 2.5).
The results from the analysis of deviance, shown in Table 7, show that age is widely the most important variable, capturing 61.9% of the deviance explained by the model, followed by economic sector (9.5%), number of milestones achieved (8.4%), age at last funding (6.8%), number of strategic relationships (4.5%), and geographical location (4.1%). The total funds raised across all the typologies of funding rounds captures 2.6% of the deviance, while each other variable explains less than 2% of the deviance.
These findings highlight, on one hand, a high heterogeneity of ventures’ chance of exit and risk of closure across geographical locations and economic sectors, and, on the other hand, a relevant role of age in predicting their success, since exit and closure typically occur within few years from foundation. However, besides the high impact of these control variables, the amount of funds provides a significant contribution to the success of ventures, confirming the very important role of equity financing in their life cycle.
3.4. Predictive Power
In order to make a comparison with existing studies, we performed a validation of our model to assess its predictive power. To this purpose, we computed the probability distribution of the outcome variable predicted by our model through 10-fold cross-validation. Based on the Bayesian classification criterion (i.e., maximum posterior probability), we found that our model classifies correctly 64.3% of operating ventures, 74.6% of exited ventures, and 36.7% of closed ones.
As expected, the Bayesian classification accuracy for the event ‘closed’ is pretty lower than the one of the other two events (‘operating’ and ‘exited’) due to the relatively low number of closed ventures in the sample (only 24.2% compared to 37.4% and 38.4% of operating and exited ones, respectively). In order to make an assessment of the predictive accuracy that is not influenced by class imbalance, we constructed the ROC curve for all the possible pairwise comparisons among the three possible events ‘operating’, ‘exited’, and ‘closed’. These ROC curves are displayed in Figure 2, where the corresponding Area Under the Curve (AUC) is also reported. The AUC expresses the probability for the model to predict higher chance of exit (or risk of closure) for actually exited (or closed) ventures, rather than for not exited (or not closed) ones. As such, the AUC measures the discriminant power of the model, which is not affected by class imbalance.
It can be noted that AUC values of the resulting ROC curves range from 0.702 (‘operating’ vs. ‘closed’) to 0.896 (‘exited’ vs. ‘closed’). These values are in line with the ones achieved by logistic regression in existing empirical studies, but are lower than the ones obtained making use of other machine learning methods (e.g., random forests, gradient boosted trees, and neural networks), which span between 0.888 and 0.963. However, since AUC values between 0.7 and 0.8 are generally considered acceptable (Hosmer and Lemeshow 2000, chp. 5, pp. 160–64) and our study is not specifically focused on prediction, the predictive power of our model is high enough to not raise concerns about the validity of the results presented and discussed in Section 3. Moreover, since all existing empirical studies excepting Xiang et al. (2012) are based on data more recent than ours, the similarity of our AUC values with the ones achieved by logistic regression in those studies may indicate that the epoch of observation does not play a relevant role in the relationship between venture success and equity funding dynamics. In other words, our model is likely to return similar results if applied to a more recent sample of ventures.
4. Concluding Remarks
In this article, we have developed a multinomial logistic regression model based on the Crunchbase 2013 Snapshot to assess the impact of equity funding dynamics on a venture’s chance of successful exit and risk of closure.
Our proposal is innovative because an estimation of the impact of each variable is provided, while existing studies aim at optimizing the predictive accuracy with few or no interest in the explanation of how each variable contributes to the prediction. As a consequence, the validity of our model can be assessed based on economic arguments, and not simply based on strictly empirical criteria such as cross-validation accuracy. Although we recognize the merit of existing studies in achieving higher predictive accuracy than our model, we believe that an effective support to investors’ decisions cannot prescind from explicit quantitative information about the role and the different importance of each factor favouring a venture’s successful exit. In fact, investors are not typically willing to make decisions based on black box recommendations. Moreover, observational data may suffer from selection bias, therefore cross-validation may fail to assess the extent to which predictions can be generalized to new sampling units.
A further valuable contribution of our study is represented by the consideration of both the successful event (exit) and its negative counterpart (closure) within 20 years from foundation, while most existing studies either consider just one event among exit and closure, or focus on young ventures. In this way, our model is not limited to the startup stage, but also covers advanced stages of development, thus providing a comprehensive view of the different scenarios that may be envisioned in a venture’s life cycle.
The main limitation of our work relies in the epoch of the data, i.e., 31 December 2013, motivated by the fact that, after such date, Crunchbase data are no longer freely downloadable. However, the similarity of our AUC values with the ones achieved by logistic regression in previous studies may indicate that the epoch of observation does not play a relevant role in the relationship between venture success and equity funding dynamics. In the future, we plan to verify this conjecture by applying our model to more recent data. The use of more recent data could also allow to rely on a broader set of variables and consequently to cover some important dimensions neglected in this study, such as structural characteristics of the venture and the reputation of the entrepreneur.
Author Contributions
Conceptualization, formal analysis, methodology, software, validation, writing—original draft preparation: A.D. and A.M.; data curation, investigation: A.D.; supervision, writing—review and editing: A.M. All authors have read and agreed to the published version of the manuscript.
Funding
This research received no external funding.
Informed Consent Statement
Not applicable.
Data Availability Statement
Data are available from the authors upon reasonable request.
Conflicts of Interest
The authors declare no conflict of interest.
References
- Ali-Yrkko, Jyrki, Ari Hyytinen, and Mika Pajarinen. 2005. Does patenting increase the probability of being acquired? Evidence from cross-border and domestic acquisitions. Applied Financial Economics 15: 1007–17. [Google Scholar] [CrossRef] [Green Version]
- Arroyo, Javier, Francesco Corea, Guillermo Jimenez-Diaz, and Juan A. Recio-Garcia. 2019. Assessment of machine learning performance for decision support in venture capital investments. IEEE Access 7: 124233–43. [Google Scholar] [CrossRef]
- Bento, Francisco Ramadas da Silva Ribeiro. 2018. Predicting Start-Up Success with Machine Learning. Master’s thesis, University of Lisbon, Lisbon, Portugal. [Google Scholar]
- Cefis, Elena, Cristina Bettinelli, Alex Coad, and Orietta Marsili. 2022. Understanding firm exit: A systematic literature review. Small Business Economics 59: 423–46. [Google Scholar] [CrossRef]
- Coad, Alex, Julian S. Frankish, Richard G. Roberts, and David J. Storey. 2016. Predicting new venture survival and growth: Does the fog lift? Small Business Economics 47: 217–41. [Google Scholar] [CrossRef] [Green Version]
- Crunchbase Inc. 2013. Crunchbase 2013 Snapshot. Available online: https://data.crunchbase.com/docs/2013-snapshot (accessed on 5 September 2022).
- Crunchbase Inc. 2020. Crunchbase Company Profile & Funding. Available online: www.crunchbase.com/organization/crunchbase (accessed on 5 September 2022).
- Cumming, Douglas J., and Jeffrey G. MacIntosh. 2003. A cross-country comparison of full and partial venture capital exits. Journal of Banking and Finance 27: 511–48. [Google Scholar] [CrossRef]
- Drover, Will, Lowell Busenitz, Sharon Matusik, David Townsend, Aaron Anglin, and Gary Dushnitsky. 2017. A review and road map of entrepreneurial equity financing research: Venture capital, corporate venture capital, angel investment, crowdfunding, and accelerators. Journal of Management 43: 1820–53. [Google Scholar] [CrossRef] [Green Version]
- Fairchild, Richard. 2011. An entrepreneur’s choice of venture capitalist or angel-financing: A behavioral game-theoretic approach. Journal of Business Venturing 26: 359–74. [Google Scholar] [CrossRef]
- Ferrati, Francesco, Haiquan Chen, and Moreno Muffatto. 2021. A deep learning model for startups evaluation using time series analysis. Paper presented at 16th European Conference on Innovation and Entrepreneurship (ECIE21), Lisbon, Portugal, September 16–17; pp. 311–20. [Google Scholar]
- Fulghieri, Paolo, and Merih Sevilir. 2009. Size and focus of a venture capitalist’s portfolio. The Review of Financial Studies 22: 4643–80. [Google Scholar] [CrossRef]
- Hosmer, Hosmer, and Stanley Lemeshow. 2000. Applied Logistic Regression, 3rd ed. New York: John Wiley and Sons. [Google Scholar]
- Krishna, Amar, Ankit Agrawal, and Alok Choudhary. 2016. Predicting the outcome of startups: Less failure, more success. Paper presented at 16th IEEE International Conference on Data Mining Workshops, Barcelona, Spain, December 12–15; pp. 798–80. [Google Scholar]
- Lussier, Robert N. 1995. A nonfinancial business success versus failure prediction model for young firms. Journal of Small Business Management 33: 8. [Google Scholar]
- Lussier, Robert N., and Sanja Pfeifer. 2001. A crossnational prediction model for business success. Journal of Small Business Management 39: 228–39. [Google Scholar] [CrossRef]
- Marsh, Paul. 1982. The choice between equity and debt: An empirical study. The Journal of Finance 37: 121–44. [Google Scholar] [CrossRef]
- Maxwell, Andrew L., Scott A. Jeffrey, and Moren Lévesque. 2011. Business angel early stage decision making. Journal of Business Venturing 26: 212–25. [Google Scholar] [CrossRef]
- McCullagh, Peter, and John A. Nelder. 1989. Generalized Linear Models, 2nd ed. London: Chapman & Hall. [Google Scholar]
- Montanaro, Benedetta, Angelo Cavallo, Giancarlo Giudici, and Antonio Ghezzi. 2022. Determinants of the exit value in European venture capital-backed technology startups. International Business Journal 32: 62–84. [Google Scholar] [CrossRef]
- Nahata, Rajarishi. 2008. Venture capital reputation and investment performance. Journal of Financial Economics 90: 127–51. [Google Scholar] [CrossRef]
- Picken, Joseph C. 2017. From startup to scalable enterprise: Laying the foundation. Business Horizons 60: 587–95. [Google Scholar] [CrossRef]
- R Core Team. 2022. R: A Language and Environment for Statistical Computing. Vienna: R Foundation for Statistical Computing. Available online: https://www.R-project.org (accessed on 5 September 2022).
- Saridakis, George, Julian Frankish, and David J. Storey. 2022. Unpacking new firm exit. British Journal of Management 33: 1843–63. [Google Scholar] [CrossRef]
- Shi, Yong, Eremina Ekaterina, and Wen Long. 2020. Comparison of reinforcement and supervised learning algorithms on startup success prediction. International Journal of Computer Science and Network Security 20: 86–97. [Google Scholar]
- Slowinski, Roman, Constantin Zopounidis, and Augustinos Dimitras. 1997. Prediction of company acquisition in Greece by means of the rough set approach. European Journal of Operational Research 100: 1–15. [Google Scholar] [CrossRef]
- Ueda, Masako. 2004. Banks versus venture capital: Project evaluation, screening, and expropriation. The Journal of Finance 59: 601–21. [Google Scholar] [CrossRef]
- Venables, William N., and Brian D. Ripley. 2002. Modern Applied Statistics with S, 4th ed. New York: Springer. [Google Scholar]
- Wei, Chih-Ping, Yu-Syun Jiang, and Chin-Sheng Yang. 2008. Patent analysis for supporting merger and acquisition (M&A) prediction: A data mining approach. Lecture Notes in Business Information Processing 22: 187–200. [Google Scholar] [CrossRef]
- Xiang, Guang, Zeyu Zheng, Miaomiao Wen, Jason Hong, Carolyn Rose, and Chao Liu. 2012. A supervised approach to predict company acquisition with factual and topic features using profiles and news articles on techcrunch. Paper presented at 6th International AAAI Conference on Weblogs and Social Media, Dublin, Ireland, June 4–7; vol. 6, pp. 607–10. [Google Scholar]
- Zbikowski, Kamil, and Piotr Antosiuk. 2021. A machine learning, bias-free approach for predicting business success using Crunchbase data. Information Processing and Management 58: 102555. [Google Scholar] [CrossRef]
Figure 1.
Diagram illustrating the main steps of our study.
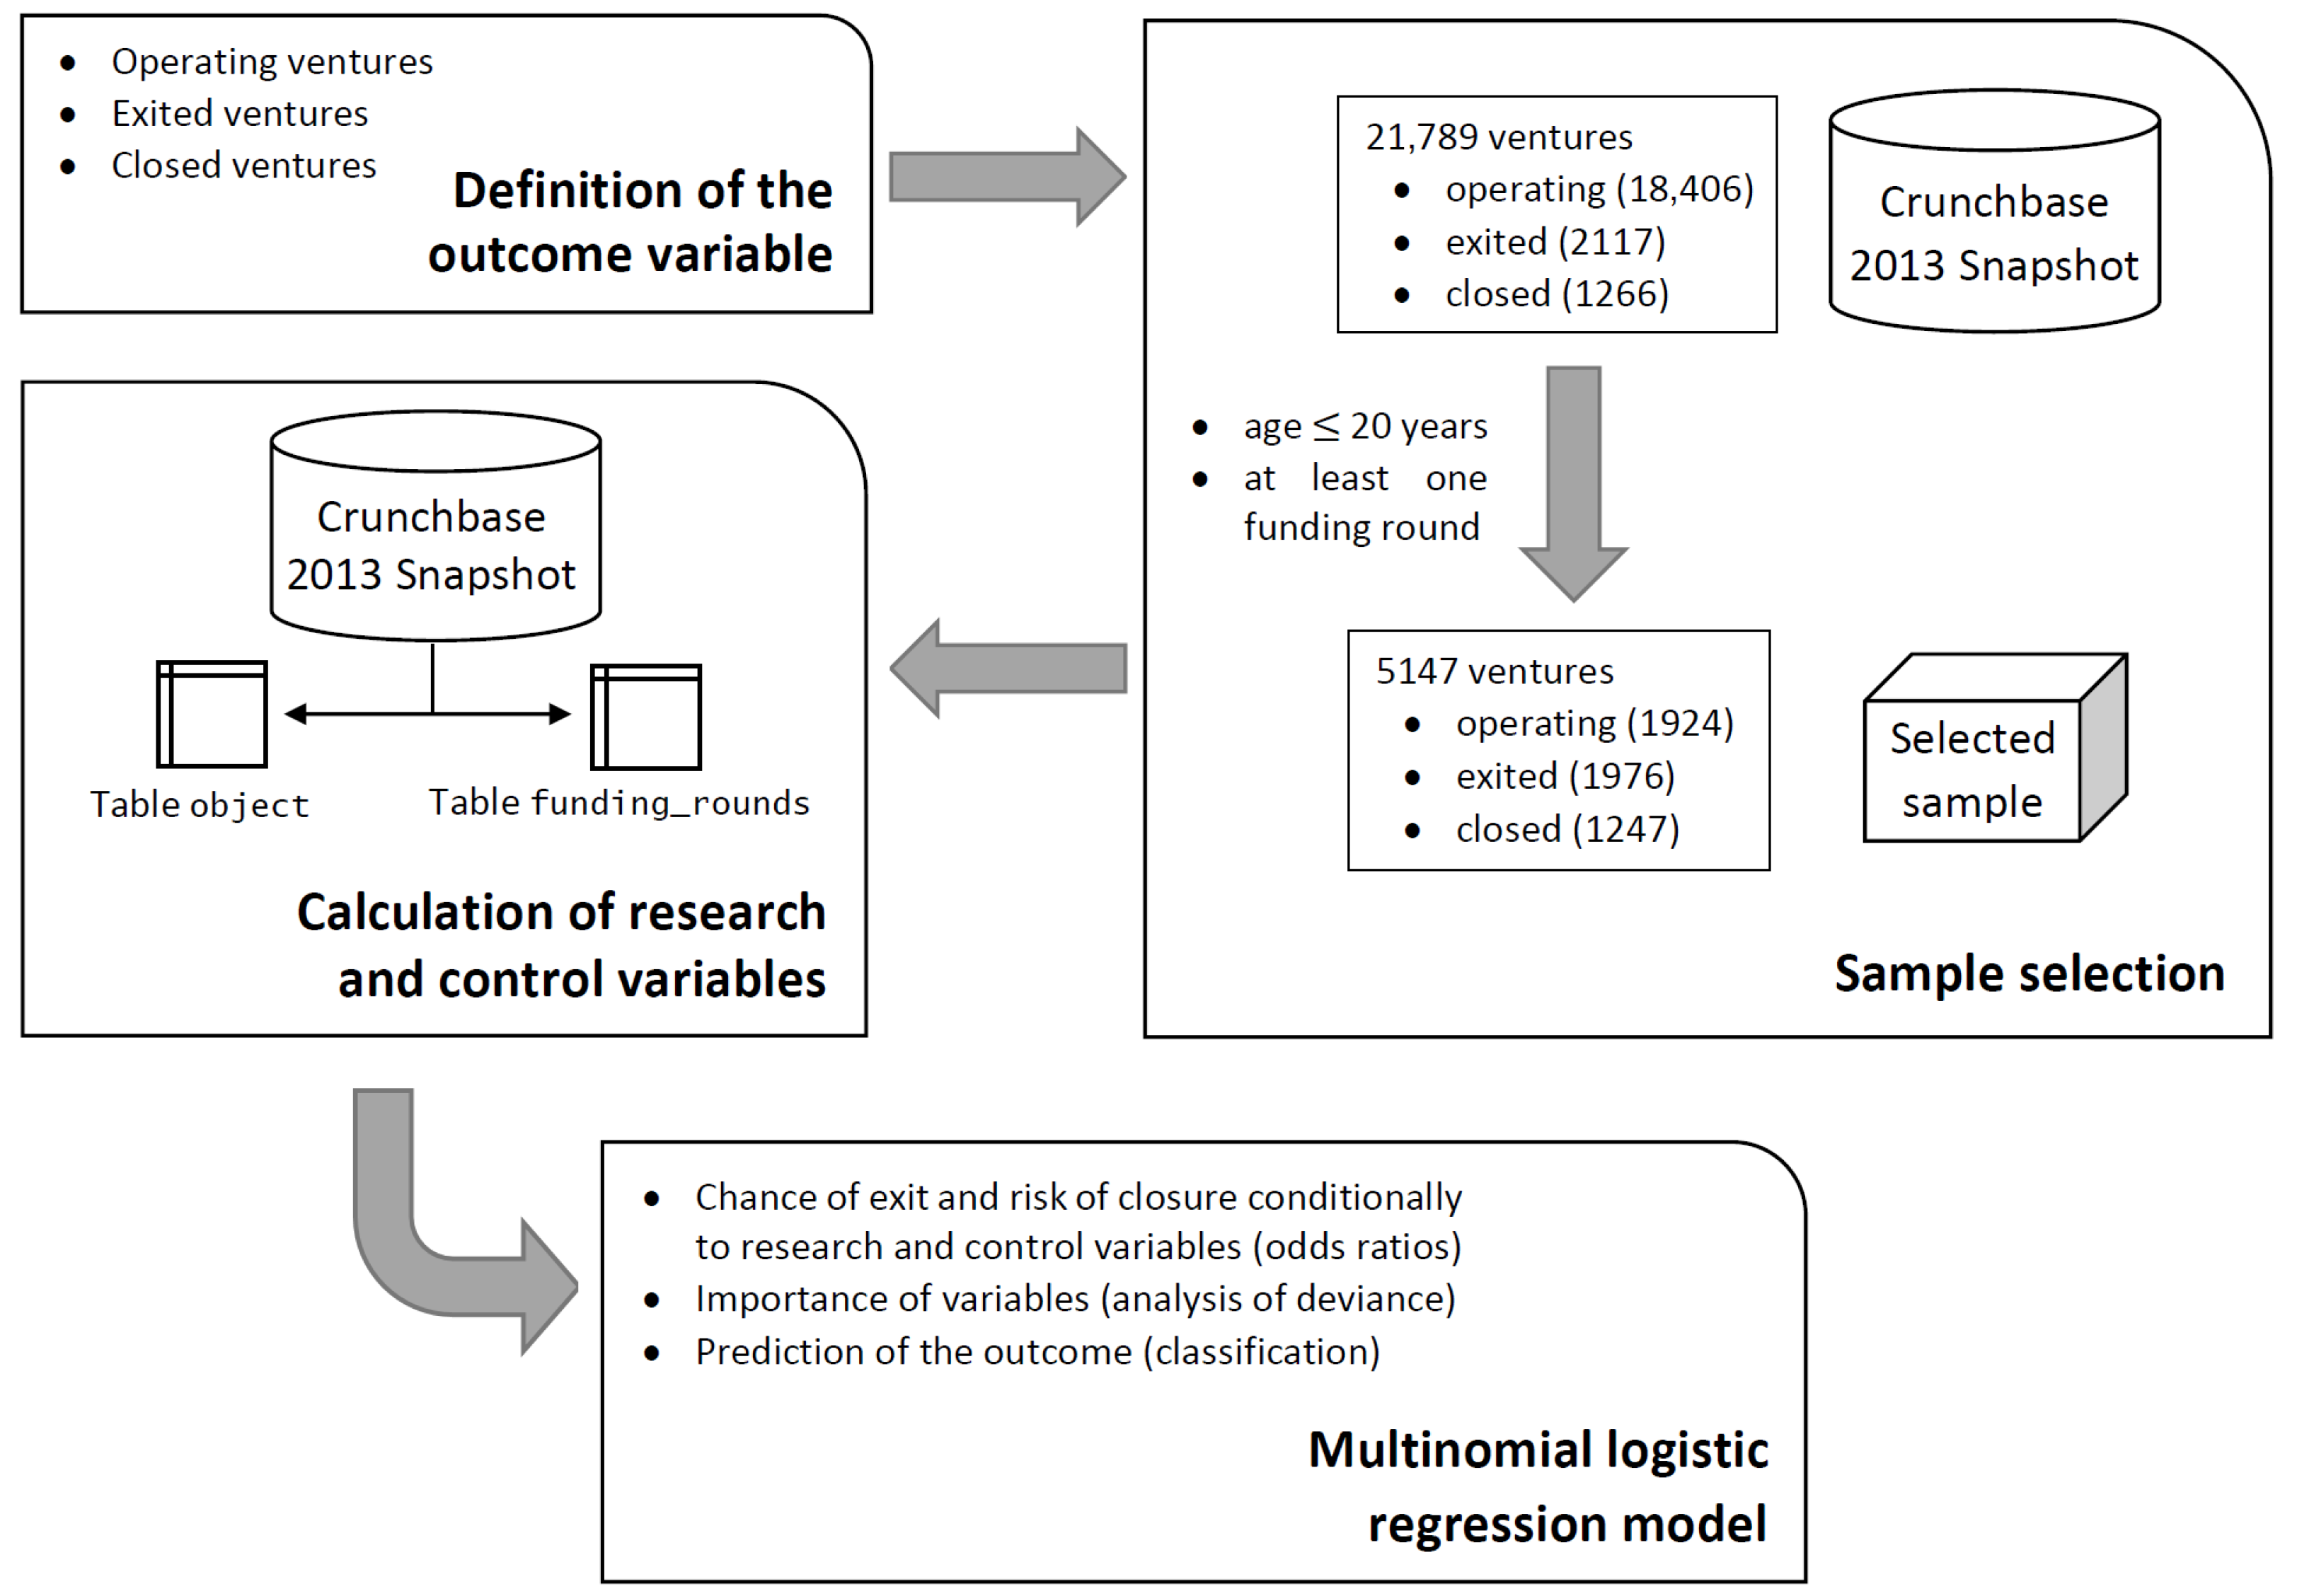
Figure 2.
ROC curves for several pairwise comparisons among the three possible events ‘operating’, ‘exited’, and ‘closed’. The area under the curve (AUC) is reported in the legend.
Figure 2.
ROC curves for several pairwise comparisons among the three possible events ‘operating’, ‘exited’, and ‘closed’. The area under the curve (AUC) is reported in the legend.


Table 1.
Characteristics of existing empirical studies predicting venture success based on equity funding dynamics.
Table 1.
Characteristics of existing empirical studies predicting venture success based on equity funding dynamics.
| Study | Data Source | Sample | Outcomes (% Frequency) | # Predictive Variables | Methods Employed |
|---|---|---|---|---|---|
| Zbikowski and Antosiuk (2021) | Crunchbase | 213,171 ventures founded between 1995 and 2015. | ‘M&A, IPO or operating’ (12.2%); ‘closed’ (87.8%). | 9 (only information known before funding rounds) | Logistic regression, support vector machines, gradient boosted trees. |
| Ferrati et al. (2021) | Crunchbase | 10,211 ventures located in USA and founded between 2000 and 2018. | ‘M&A or IPO’ (37.5%); ‘operating or closed’ (62.5%). | 15 (measures repeated for each of the first 10 years of life) | Neural networks. |
| Shi et al. (2020) | Crunchbase 2013 Snapshot | 24,965 ventures located in the ten countries with most funds (foundation date not specified). | ‘operating’ (18.9%), ‘M&A’ (21.4%), ‘IPO’ (37.4%), ‘closed’ (22.2%). | Details not provided | Logistic regression, k-NN, naive Bayes, random forests, gradient boosted trees. |
| Arroyo et al. (2019) | Crunchbase | 120,507 ventures founded between 2011 and 2015. | ‘closed’ (0.6%), ‘M&A’ (2.7%), ‘at least one funding round’ (18.0%), ‘IPO’ (0.1%), ‘no funding rounds’ (78.6%). | 105 (referred to a 3-year window from 2015 to 2018) | Support vector machines, random forests, extremely randomized trees, gradient boosted trees. |
| Bento (2018) | Crunchbase | 86,588 ventures located in USA and founded between 1985 and 2017. | ‘M&A or IPO’ (15.8%), ‘operating or closed’ (84.2%). | 158 | Logistic regression, support vector machines, random forests. |
| Krishna et al. (2016) | Crunchbase | 11,000 ventures founded between 1999 and 2014. | ‘operating’ (9.4%), ‘M&A, IPO or closed’ (90.6%). | 13 | Logistic regression, k-NN, naive Bayes, random forests, alternating decision trees, Bayesian networks. |
| Xiang et al. (2012) | Crunchbase + TechCrunch (top words in topics) | 59,631 ventures founded between 1970 and 2012. | ‘M&A’ (9.4%), ‘IPO, operating or closed’ (90.6%). | 22 | Logistic regression, support vector machines. |
Table 2.
Description of research and control variables.
| Research variables | |
| Label | Description |
| funding_rounds | Number of funding rounds. |
| participants | Total number of unique participants across all funding rounds. |
| angel | Funds raised (USD million) in rounds of type ‘Angel’. |
| round_a | Funds raised (USD million) in rounds of type ‘Venture-Series A’. |
| round_b | Funds raised (USD million) in rounds of type ‘Venture-Series B’. |
| round_c | Funds raised (USD million) in rounds of type ‘Venture-Series C’. |
| round_other | Funds raised (USD million) in rounds of type ‘Venture-Series D and onwards’. |
| venture | Funds raised (USD million) in rounds of type ‘Venture-Unknown series’. |
| Control variables | |
| Label | Description |
| location | Geographical location, with categories: ‘USA’, ‘Europe’, ‘Asia’, and ‘other’. |
| sector | Economic sector, with categories: ‘enterprise’, ‘entertainment’, ‘finance’, ‘health’, ‘hardware’, ‘mobile’, ‘sales’, ‘software’, ‘web’, and ‘other’. |
| age | Age (years) at the moment of exit, closure or at 31 December 2013 if the venture is still operating. |
| age_first_fund | Age (years) at first funding. |
| age_last_fund | Age (years) at last funding. |
| relationships | Number of strategic relationships established. |
| milestones | Total number of milestones achieved. |
| miles_first_fund | Dummy variable indicating whether at least one milestone was achieved before the first funding. |
| miles_last_fund | Dummy variable indicating whether at least one milestone was achieved before the last funding. |
Table 3.
Sample statistics of quantitative variables (). The description of variables is provided in Table 2.
Table 3.
Sample statistics of quantitative variables (). The description of variables is provided in Table 2.
| Variable | Mean | Std. dev. | Min. | Max. |
|---|---|---|---|---|
| funding_rounds | 1.9 | 1.4 | 1 | 13.0 |
| participants | 3.5 | 4.6 | 0 | 49.0 |
| angel | 0.1 | 0.3 | 0 | 2.9 |
| round_a | 2.3 | 10.8 | 0 | 526.7 |
| round_b | 2.7 | 9.7 | 0 | 355.2 |
| round_c | 2.5 | 13.3 | 0 | 490.0 |
| round_other | 3.4 | 82.0 | 0 | 5700.0 |
| venture | 4.6 | 30.9 | 0 | 1710.0 |
| age | 7.2 | 4.7 | 0 | 20.0 |
| age_first_fund | 2.9 | 3.5 | 0 | 19.0 |
| age_last_fund | 4.0 | 3.9 | 0 | 19.0 |
| relationships | 6.2 | 22.6 | 0 | 1046.0 |
| milestones | 1.2 | 1.2 | 0 | 8.0 |
Table 4.
Sample statistics of categorical variables (). The description of variables is provided in Table 2.
Table 4.
Sample statistics of categorical variables (). The description of variables is provided in Table 2.
| Variable | Category | Freq. | % |
|---|---|---|---|
| location | USA | 3874 | 75.3 |
| Europe | 808 | 15.7 | |
| Asia | 337 | 6.5 | |
| other | 128 | 2.5 | |
| sector | enterprise | 550 | 10.7 |
| entertainment | 666 | 12.9 | |
| finance | 77 | 1.5 | |
| hardware | 261 | 5.1 | |
| health | 533 | 10.4 | |
| mobile | 433 | 8.4 | |
| sales | 583 | 11.3 | |
| software | 892 | 17.3 | |
| web | 798 | 15.5 | |
| other | 354 | 6.9 | |
| miles_first_fund | no | 4384 | 85.2 |
| yes | 763 | 14.8 | |
| miles_last_fund | no | 4341 | 84.3 |
| yes | 806 | 15.7 |
Table 5.
Summary of parameter estimation for the multinomial logistic regression model. The reference category for the outcome variable is ‘operating’, while for geographical location (variable location) and economic sector (variable sector) the reference category is ‘USA’ and ‘software’, respectively.
| Parameter | ‘Exited’ versus ‘Operating’ | ‘Closed’ versus ‘Operating’ | ||||||
|---|---|---|---|---|---|---|---|---|
| Estimate | Std. Error | z Statistic | p-Value | Estimate | Std. Error | z Statistic | p-Value | |
| Intercept | −2.9540 | 0.1639 | −18.0225 | 0.0000 *** | 0.3377 | 0.1528 | 2.2096 | 0.0271 * |
| funding_rounds | 0.0798 | 0.0514 | 1.5523 | 0.1206 | −0.0032 | 0.0669 | −0.0485 | 0.9613 |
| participants | 0.0451 | 0.0111 | 4.0527 | 0.0001 *** | −0.0083 | 0.0154 | −0.5398 | 0.5894 |
| angel | −0.1591 | 0.1261 | −1.2615 | 0.2071 | −0.2695 | 0.1250 | −2.1569 | 0.0310 * |
| round_a | 0.0004 | 0.0046 | 0.0811 | 0.9353 | 0.0004 | 0.0033 | 0.1373 | 0.8908 |
| round_b | 0.0108 | 0.0049 | 2.2100 | 0.0271 * | 0.0174 | 0.0067 | 2.5817 | 0.0098 ** |
| round_c | −0.0106 | 0.0038 | −2.7808 | 0.0054 ** | 0.0051 | 0.0057 | 0.8863 | 0.3754 |
| round_other | 0.0102 | 0.0030 | 3.4310 | 0.0006 *** | −0.0005 | 0.0054 | −0.1007 | 0.9198 |
| venture | 0.0016 | 0.0020 | 0.7902 | 0.4294 | 0.0009 | 0.0037 | 0.2479 | 0.8042 |
| location: Europe | −0.7755 | 0.1147 | −6.7624 | 0.0000 *** | −0.2519 | 0.1008 | −2.4982 | 0.0125 * |
| location: Asia | −0.6953 | 0.1745 | −3.9835 | 0.0001 *** | −0.1086 | 0.1418 | −0.7659 | 0.4437 |
| location: other | −1.2102 | 0.3208 | −3.7729 | 0.0002 *** | −0.5573 | 0.2134 | −2.6113 | 0.0090 ** |
| sector: enterprise | −0.0216 | 0.1474 | −0.1466 | 0.8835 | −0.5042 | 0.1645 | −3.0657 | 0.0022 ** |
| sector: entertainment | −0.0494 | 0.1508 | −0.3277 | 0.7432 | 0.0169 | 0.1410 | 0.1200 | 0.9045 |
| sector: finance | −0.3874 | 0.3429 | −1.1299 | 0.2585 | −0.4712 | 0.3181 | −1.4815 | 0.1385 |
| sector: hardware | −0.1546 | 0.1930 | −0.8012 | 0.4230 | 0.1830 | 0.1974 | 0.9269 | 0.3540 |
| sector: health | −0.0620 | 0.1523 | −0.4070 | 0.6840 | −0.8363 | 0.1723 | −4.8548 | 0.0000 *** |
| sector: mobile | −0.0498 | 0.1641 | −0.3034 | 0.7616 | −0.1183 | 0.1639 | −0.7217 | 0.4705 |
| sector: sales | −0.0260 | 0.1553 | −0.1677 | 0.8669 | 0.2584 | 0.1470 | 1.7576 | 0.0788 . |
| sector: web | 0.5044 | 0.1503 | 3.3562 | 0.0008 *** | 0.9945 | 0.1430 | 6.9524 | 0.0000 *** |
| sector: other | −0.3767 | 0.1769 | −2.1288 | 0.0333 * | −0.0791 | 0.1715 | −0.4616 | 0.6444 |
| age | 0.5276 | 0.0204 | 25.8438 | 0.0000 *** | 0.0132 | 0.0210 | 0.6280 | 0.5300 |
| age_first_fund | −0.0342 | 0.0362 | −0.9471 | 0.3436 | 0.0320 | 0.0515 | 0.6217 | 0.5341 |
| age_last_fund | −0.4122 | 0.0381 | −10.8241 | 0.0000 *** | −0.1506 | 0.0524 | −2.8755 | 0.0040 ** |
| relationships | 0.0050 | 0.0073 | 0.6819 | 0.4953 | −0.1066 | 0.0139 | −7.6764 | 0.0000 *** |
| milestones | 0.5004 | 0.0441 | 11.3495 | 0.0000 *** | 0.0428 | 0.0501 | 0.8546 | 0.3928 |
| miles_first_fund | 0.2554 | 0.1340 | 1.9055 | 0.0567 . | −0.0854 | 0.1498 | −0.5700 | 0.5687 |
| miles_last_fund | −0.3287 | 0.1269 | −2.5910 | 0.0096 ** | −0.2703 | 0.1441 | −1.8754 | 0.0607 . |
Notation for p-values: 0 ‘***’ 0.001 ‘**’ 0.01 ‘*’ 0.05 ‘.’ 0.1 ‘ ’ 1.
Table 6.
Change in the odds of event ‘exited’ versus ‘operating’ (chance of exit) and of event ‘closed’ versus ‘operating’ (risk of closure) implied by parameter estimates in Table 5. Only estimates significant at the 0.05 level () are reported.
Table 6.
Change in the odds of event ‘exited’ versus ‘operating’ (chance of exit) and of event ‘closed’ versus ‘operating’ (risk of closure) implied by parameter estimates in Table 5. Only estimates significant at the 0.05 level () are reported.
| Variable | Change | Chance of Exit (%) | Risk of Closure (%) |
|---|---|---|---|
| participants | +1 | n.s. | |
| angel | +USD 1 million | n.s. | |
| round_b | +USD 1 million | ||
| round_c | +USD 1 million | n.s. | |
| round_other | +USD 1 million | n.s. | |
| location | ‘Europe’ vs. ‘USA’ | ||
| location | ‘Asia’ vs. ‘USA’ | n.s. | |
| location | ‘other’ vs. ‘USA’ | ||
| sector | ‘enterprise’ vs. ‘software’ | n.s. | |
| sector | ‘health’ vs. ‘software’ | n.s. | |
| sector | ‘web’ vs. ‘software’ | ||
| sector | ‘other’ vs. ‘software’ | n.s. | |
| age | year | n.s. | |
| age_last_fund | +1 year | ||
| relationships | +1 | n.s. | |
| milestones | +1 | n.s. | |
| miles_last_fund | ‘yes’ vs. ‘no’ | n.s. |
‘n.s.’: not statistically significant (p-value ≥ 0.05).
Table 7.
Analysis of deviance for the multinomial logistic regression model. ‘DoF’: degrees of freedom of the asymptotic Chi-squared distribution. ‘%’: percentage contribution of each explanatory variable to the deviance explained by the model.
Table 7.
Analysis of deviance for the multinomial logistic regression model. ‘DoF’: degrees of freedom of the asymptotic Chi-squared distribution. ‘%’: percentage contribution of each explanatory variable to the deviance explained by the model.
| Variable | Deviance | DoF | p-Value | % |
|---|---|---|---|---|
| funding_rounds | 2.69 | 2 | 0.2601 | 0.1 |
| participants | 21.01 | 2 | 0.0000 *** | 1.2 |
| angel | 5.06 | 2 | 0.0800 . | 0.3 |
| round_a | 0.02 | 2 | 0.9890 | 0.0 |
| round_b | 8.72 | 2 | 0.0128 * | 0.5 |
| round_c | 10.59 | 2 | 0.0050 ** | 0.6 |
| round_other | 21.10 | 2 | 0.0000 *** | 1.2 |
| venture | 0.70 | 2 | 0.7033 | 0.0 |
| location | 71.82 | 6 | 0.0000 *** | 4.1 |
| sector | 169.00 | 18 | 0.0000 *** | 9.5 |
| age | 1095.44 | 2 | 0.0000 *** | 61.9 |
| age_first_fund | 1.78 | 2 | 0.4114 | 0.1 |
| age_last_fund | 120.08 | 2 | 0.0000 *** | 6.8 |
| relationships | 80.01 | 2 | 0.0000 *** | 4.5 |
| milestones | 149.24 | 2 | 0.0000 *** | 8.4 |
| miles_first_fund | 5.45 | 2 | 0.0656 . | 0.3 |
| miles_last_fund | 8.04 | 2 | 0.0179 * | 0.5 |
Notation for p-values: 0 ‘***’ 0.001 ‘**’ 0.01 ‘*’ 0.05 ‘.’ 0.1 ‘ ’ 1.
Disclaimer/Publisher’s Note: The statements, opinions and data contained in all publications are solely those of the individual author(s) and contributor(s) and not of MDPI and/or the editor(s). MDPI and/or the editor(s) disclaim responsibility for any injury to people or property resulting from any ideas, methods, instructions or products referred to in the content. |
© 2023 by the authors. Licensee MDPI, Basel, Switzerland. This article is an open access article distributed under the terms and conditions of the Creative Commons Attribution (CC BY) license (https://creativecommons.org/licenses/by/4.0/).
Share and Cite
MDPI and ACS Style
Deias, A.; Magrini, A. The Impact of Equity Funding Dynamics on Venture Success: An Empirical Analysis Based on Crunchbase Data. Economies 2023, 11, 19. https://doi.org/10.3390/economies11010019
AMA Style
Deias A, Magrini A. The Impact of Equity Funding Dynamics on Venture Success: An Empirical Analysis Based on Crunchbase Data. Economies. 2023; 11(1):19. https://doi.org/10.3390/economies11010019
Chicago/Turabian StyleDeias, Anna, and Alessandro Magrini. 2023. "The Impact of Equity Funding Dynamics on Venture Success: An Empirical Analysis Based on Crunchbase Data" Economies 11, no. 1: 19. https://doi.org/10.3390/economies11010019
Note that from the first issue of 2016, this journal uses article numbers instead of page numbers. See further details here.