
Comparative Analysis of Socioeconomic Models in COVID-19 Pandemic


Department “Economic Theory and International Relations”, Penza State University, 440026 Penza, Russia
Economies 2022, 10(11), 278; https://doi.org/10.3390/economies10110278
Submission received: 19 September 2022
/
Revised: 29 October 2022
/
Accepted: 3 November 2022
/
Published: 8 November 2022
(This article belongs to the Special Issue The Impact of COVID-19 on Financial Markets and the Real Economy)
Abstract
:Certain features of socioeconomic models can be distinctly determined in different countries and regions. However, such models are quite flexible under external and internal influences. Their changes can be observed under the impact of unpredictable factors, the COVID-19 pandemic being one. The aim of the work is to identify differences in the structure of socioeconomic models under the influence of the pandemic. The object of the study is the socioeconomic models of various states. The subject of the study is the transformation of socioeconomic models at different stages of the pandemic. Research methods include analysis of statistical data, correlation and comparative analysis, and graphical methods of presenting results. A comparison of data from the most well-known socioeconomic models was carried out for the first time. It is determined that the countries of the Chinese model adopted restrictive measures of high Stringency Index. The countries of the Japanese model used unique crowd management methods, and the countries of the Scandinavian, German and Anglo-Saxon models resorted to unprecedented monetary injections into the social and economic spheres. It was revealed that quarantine measures eventually cost countries less than monetary injections. It was shown that a decrease in the Pandemic Uncertainty Index stabilized the economic behavior of the population and businesses and increased the volume of export-import operations. It was found that the pandemic affected the economy indirectly through the level of uncertainty and rigidity of preventive measures. It is assumed that the intensity and severity of measures could be influenced by global trends leading to certain types of preventive measures rather than by the COVID-19 statistics of a particular country.
1. Introduction
The socioeconomic model of the state reflects the real system of management and social relations. It also acts as an indicator of socioeconomic dynamics. It can be assumed that there are certain patterns in the change of the socioeconomic system under the influence of external or internal factors. If the impact of such factors is hard to predict, the patterns become more difficult to determine and analyze. An example of such a factor is COVID-19, which has had a serious impact on the economy of the entire planet (World Health Organization 2020). Any pandemic, being extremely unpredictable, is one of the essential prerequisites for socioeconomic changes. At the same time, the nature of the changes will depend on the degree of pandemic development.
Currently, comparative research lacks studies considering the impact of pandemics on the socioeconomic indicators of various groups of countries. We carried out a comparative analysis of countries from the most well-known socioeconomic models in the conditions of a pandemic. The phases of the pandemic were identified, which is of particular importance when assessing the impact on socioeconomic processes in society. The specifics of government spending during the pandemic, and the features of COVID-19 development in different socioeconomic models are revealed. The relationship between the COVID-19 pandemic phases and changes in the Stringency Index and World Pandemic Uncertainty Index is calculated. We also determined the correlation of pandemic indicators with export-import operations, including an increase in the turnover of computer and communication services.
The results obtained are of practical importance. The main result is data that can be used to adjust economic, social, and political measures to counteract sudden negative impacts on the society of countries of various socioeconomic models and to prevent significant negative consequences.
In research, the terms “pattern” and “model” are used. We believe that one can use the term “model” to combine similar states into groups and unify different states based on similar characteristics. We understand that states belonging to one model cannot be called identical. If that were the case, we could use the term “pattern”. As an example, we can cite an article about business model patterns, which discusses patterns that can serve as a blueprint for organizing a new business (Curtis 2021).
The remainder of the paper is organized as follows. Section 2 contains a Literature Review. Section 3 outlines the key components of the methodology: approaches, stages, and methods of analysis. Section 4 presents the key results obtained during the analysis of statistical data. Section 5 discusses the results obtained in light of earlier achievements. Section 6 contains practical conclusions, limitations, and prospects of the study.
2. Literature Review
Initially, the specifics of a socioeconomic model of the state depend on many factors. The determining prerequisites may be long-term geopolitical traditions, material conditions, national and socio-cultural characteristics, the influence of socio-political forces (Teterina 2015), and institutional specifics (Gubaidullina 2016). Changes in socioeconomic models and even their replacement are natural and justified since no model can constantly guarantee its effectiveness in conditions of instability (Ramazanov 2010).
The main criteria that characterize the socioeconomic model of the state and, at the same time, do not have a clear separation from each other are the following: role of the state in society, type of social policy, level of private entrepreneurship freedom, ratio of different forms of ownership, institutional features, and the openness of the economy, etc.
In turn, indicators of the state of the socioeconomic system characterizing the corresponding model are (Teterina 2015; Gubaidullina 2016): differentiation of income of the population, the share of state production in the economy, export quota (% of GDP), import quota (% of GDP), share in world exports of goods, share in world imports of goods; the ratio of the export of accumulated foreign direct investment (the value of national assets of a given country localized abroad) to GDP, the ratio of the import of accumulated foreign direct investment (the value of foreign assets created by foreign TNCs in a given country) to GDP, the share in the world export of foreign direct investment, and the share in the world import of foreign direct investment, etc.
The description of the generally recognized socioeconomic characteristics (from general to particular) is presented as a division according to specific characteristics of the well-known American, German, Swedish, Japanese, and Chinese models.
1. American (Anglo-Saxon) model is characterized by a liberal economy and high entrepreneurial activity.
1.1. The state encourages private entrepreneurial activity as much as possible. It is reflected in
- -
- creating the necessary conditions for business development;
- -
- supporting entrepreneurial activity;
- -
- limiting government intervention in the economy;
- -
- the manifestation of low production activity of the state (low percentage of the state in the production GDP).
1.2. The low role of the state in solving social issues is manifested in the minimal participation of the state in social protection.
1.3. Free and open economic relations, including:
- -
- tough competition in business;
- -
- the key role of the stock market in business financing, which to a certain extent could indirectly help in surviving the pandemic due to some “habituation” to “swings on the waves of the market and the dangers of storms of stock speculation” (Kanarsh 2018, p. 39);
- -
- management in the interests of key shareholders in a context of distributed ownership;
- -
- foreign trade openness.
1.4. Individualism in labor relations, such as:
- -
- individual responsibility of employees;
- -
- clear distribution of functions;
- -
- priority of personal interests to the interests of the company;
- -
- flexible labor markets;
- -
- short-term hiring.
2. The Rhenish (German) model is a more socially-oriented market economy.
2.1. Private initiative and competition, in that:
- -
- small and medium businesses are the most important components of a market economy;
- -
- the economy is export-oriented.
2.2. Active role of the state in the economy, including:
- -
- support for small and medium businesses;
- -
- high production activity of the state (high share of state-owned enterprises in the economy, a high percentage of the state in the GDP produced, and social expenditures make up a significant part of the state budget).
2.3. Efficient system of social support.
3. The Scandinavian (Swedish) model is characterized by a combination of market relations and state regulation (welfare state).
Its key features are as follows (Aksenov 2006; Tcerkasevich 2019; Gubaidullina 2016; Ramazanov 2010):
3.1. Widespread government intervention in the economy, in that:
- -
- private property is fundamental;
- -
- redistribution of income is a state function;
- -
- full employment is a goal;
- -
- income equalization is a value.
3.2. Widespread nationalization of social services and social spending comprises more than half of GDP.
3.3. Broad participation of the state in the regulation of social issues:
- -
- solidarity policy (income equalization);
- -
- progressive taxation.
4. The Japanese model is socially oriented with a shrinking role of the state.
4.1. Active participation of the state in social issues; developed social protection systems.
4.2. Relations of multilateral cooperation in the economy, including:
- -
- cooperation between enterprises based on the distribution of functions;
- -
- a key role of banks in financing enterprises;
- -
- the equivalence of interests of shareholders and employees;
- -
- a relative closeness of the economy to other countries;
- -
- a low level of foreign business activity in the country;
- -
- state as one of the largest foreign investors.
4.3. Cooperation in labor relations involves:
- -
- collective responsibility;
- -
- an unclear distribution of functions;
- -
- the loyalty of employees to the company;
- -
- long-term hiring.
5. Chinese model: Transformation towards double circulation (Tsedilin 2019; Bardhan 2020; Lukonin and Zakliazminskaia 2020).
Its key features are as follows:
5.1. Macro regulation, state planning, and control:
- -
- relatively high (but declining) share of the public sector (about 40%); mainly processing, energy, metallurgy, and alcohol;
- -
- support for the development of market relations.
5.2. Development of private entrepreneurship, including:
- -
- strict state control;
- -
- annual tax audit of all enterprises;
- -
- free economic zones;
- -
- low labor costs as a competitive advantage in global markets.
5.3. Export orientation, involving:
- -
- dependence on the external market;
- -
- foreign investments (the main investors are ethnic Chinese living abroad).
5.4. Expansion of the domestic sales market.
It should be noted that the socioeconomic models of developed countries operating on the principles of the market economy, regardless of their uniqueness, have similar features (Gubaidullina 2016). For example, almost all of them are characterized by a sectoral structure with a significant share of industries with high added value (Vasin 2022).
In addition, after the creation of the European Union, it was reasonable to expect a convergence of the models of the various countries that formed it. In particular, more similarities began to appear in the socioeconomic systems of Sweden, Germany, France, Italy, etc. (Aksenov 2006).
What element of socioeconomic models assumes the main responsibility for adapting the system to changes? It is worth noting that such adaptation can occur in the form of resistance to change, a flexible reaction to change, or a sharp structural and institutional reshaping. Of course, the main buffer smoothing the impact of unpredictable factors is the state. However, since in traditional conditions, as shown above, the role of the state in various socioeconomic systems is different, the reaction to sudden impacts will also be ambiguous. On the one hand, conceptually, the actions of the state in different countries will be similar, but tactically there may be significant differences.
The pandemic plays the role of a sudden factor affecting the socioeconomic system, which causes changes in its socioeconomic model.
In our study, we will focus on the COVID-19 pandemic as a factor of sudden impact on society. We will not analyze the biological characteristics of the virus and the medical features of its effects on humans: these issues are covered in sufficient detail in the specialized literature (Kurrey and Saha 2022; Gueye et al. 2022; Schlickeiser and Kröger 2022; Murewanhema et al. 2022). We are interested in the specifics of the impact of COVID-19 on the socioeconomic development of society and the issues of stabilizing such an impact due to the increase in the adaptive properties of socioeconomic systems.
The aim of the study is to identify differences in the dynamics of socioeconomic models under the influence of pandemic manifestations in society. There are two bigger segments in our aim. The first is related to the speed, nature, and intensity of the reaction of the decision-making units. The second is the reaction of the system to the actions of management units. As a result of the analysis of these components in a real pandemic, the reasons for the transformational dynamics of the socioeconomic model or its elements become clear.
The published materials contain considerable evidence of the active reaction of various states to the unpredictability of the COVID-19 pandemic. In particular, South Korea’s reaction was to create an extremely detailed information field. It meant collecting the most accessible information about the sick persons or the virus carriers, their movement, purchases, and treatment in order to inform the relevant authorities and the population about the routes of their movement and to use mobile applications to prevent a healthy person from contacting a sick one. In addition, information about the pandemic was brought to everyone in the most detailed version, including the features of the virus, ways of infection, methods of prevention, etc. (Majeed 2021). In turn, Bangladesh has adopted a number of measures typical of most countries: mandatory home quarantine, social distancing, restrictions on local and international flights, closure of educational institutions, including schools, colleges, and universities, as well as the closure of offices. All this has led to national isolation (Faruk and Kar 2021). The reaction of the Nepalese Government to the occurrence of cases of the disease repeated the strict quarantine that had already become standard, which was proactive since there were fewer cases of the disease than in the United States and Europe. The quarantine was soon lifted, but then suddenly, the second wave of the pandemic in the country occurred. The lack of prompt response to its occurrence led to a deterioration in data on morbidity and mortality of the population (Paudel et al. 2021). The actions of the Government of Peru, the most affected country in Latin America, were to close schools, a number of workplaces, and public transport, cancel mass events, restrict gatherings and movement within the country, as well as increase control over international travel. The situation was complicated by the high level of informal employment. This led to internal migration due to job loss and was called “the exodus of hunger”, resulting in social conflicts in the places of the arrival of migrants (Salinas et al. 2021).
Governments of states had to choose different actions and sometimes inaction because all decisions led to economic damage.
According to (Keogh-Brown et al. 2020), it was assumed that if the clinical morbidity rate was 48% and the mortality rate was 1.5%, COVID-19 alone would impose a direct health-related economic burden of 39.6 billion pounds (1.73% of GDP) on the UK economy. Mitigation strategies introduced within 12 weeks can reduce mortality by 29%, but the total cost to the economy will amount to 308 billion pounds (13.5% of GDP); 66 billion pounds (2.9% of GDP), which includes the loss of labor of working parents during school closures, and 201 billion pounds sterling (8.8% of GDP) will be accounted for by the closure of enterprises. Suppressing the pandemic for a longer period of time could reduce mortality by 95%, but the total cost to the UK economy will also increase to 668 billion pounds (29.2% of GDP), of which 166 billion pounds (7.3% of GDP) would be for school closures and 502 billion (21.9% of GDP) for enterprise closures. The researchers prove that the key to determining economic costs is the duration of the closure of schools and businesses (Keogh-Brown et al. 2020). In other words, the possible economic consequences of a pandemic will vary with different reactions of society. At the same time, these consequences will most likely depend on the current socioeconomic model of the state, that is, on the readiness of various subsystems to respond promptly. For example, the support programs launched by most European countries in 2020 were continued in 2021. At the same time, the UK already completed its support program for the population and business in October 2020 (Ivanovskiy 2021, pp. 76–77). Let us assume that changes in the current socioeconomic models are likely during the course of the pandemic both because of the high economic costs and the social perception of the course and the pandemic outcomes.
In addition, it is important to understand the development stages of the pandemic, from its appearance to its termination, to perform a detailed analysis. The specificity of pandemic influence at each stage is of particular importance.
Similar approaches to step-by-step analysis are found in research, especially in forecasting. In particular, (Lacey King et al. 2022) call this method “Multi-Level Nowcast”, implying a multi-stage prediction of the consequences of each individual reaction to a particular event. The approach is justified due to the high level of uncertainty in the context of a pandemic. It is obvious that there is no clear boundary between these stages. Nevertheless, they allow structuring the course of the pandemic by socioeconomic consequences and, accordingly, arguing the dynamics of socioeconomic models to a greater extent.
3. Materials and Methods
3.1. Methodological Approaches
The empirical analysis in our study is presented in the following sequence.
- Cross-sectional analysis. These are the initial positions of indicators of the socioeconomic system on a specific date in the interstate (inter-model) comparison.
- Analysis of COVID-19 statistics and indicators of the activity response of the socioeconomic system during the pandemic life cycle. It reflects the nature and intensity of measures to prevent and combat the pandemic.
- Analysis of the reaction indicators of a socioeconomic system to the activities of its structures due to the impact of pandemic factors.
3.2. Stages and Methods of Analysis
Statistical data collection and analysis methods will be applied in the context of each stage. The following sequence will be used:
1. Selection of statistical data of countries depending on their socioeconomic model. The sample was limited by the availability of the necessary statistical data in the database of statistical services of various states or unions, in particular, integrated by Knoema® (Knoema 2020): Eurostat, Statistics Japan, U. S. Census Bureau, United Nations Economic Commission for Europe, U.S. Centers for Disease Control and Prevention, etc., statistical data from World Bank and International Monetary Fund.
Anglo-Saxon, Rhenish (German), Scandinavian (Swedish), Japanese and Chinese models were selected for the study. At the same time, data from the following states were used to form each model:
Ireland, United Kingdom, Canada, United States, Australia, and New Zealand—Anglo-Saxon model.
Belgium, Germany, Netherlands, and Switzerland—Rhenish (German) model.
Denmark, Finland, Iceland, Norway, and Sweden—Scandinavian (Swedish) model.
Indonesia, Japan, Malaysia, and South Korea—Japanese model.
China and Vietnam—Chinese model.
The relative indicators used allowed us to take into account the characteristic features of the countries included in a particular socioeconomic model. They do not include such features as territory, population, and other similar absolute indicators that distort the final arithmetic mean values calculated for the characteristics of each model.
2. Choosing the period for the analysis of COVID-19 statistics and the activity response of the socioeconomic to the impact of the COVID-19 pandemic. We considered the period from the first signs of the pandemic to the date of availability of statistical data to be indicative. As a rule, this period is from 2020 (sometimes from 2019 to 2021 and, in some cases, to 2022). In some analyses, in order to compare the period of stability with the crisis period, data from 2017 were used.
3. Collection of COVID-19 statistics and data on the activity response of the socioeconomic system according to relative and absolute, objective and subjective (if necessary) indicators for the COVID-19 pandemic in different socioeconomic systems. The analyzed indicators are as follows:
- -
- number of new cases of SARS-CoV-2 per 1 million people (New Cases of SARS-CoV-2, Per Million People) (COVID-19 and Related Statistics 2022);
- -
- number of new deaths from SARS-CoV-2, per 1 million people (Number of new deaths from SARS-CoV-2, Per Million People) (COVID-19 and Related Statistics 2022);
- -
- Stringency Index—government response severity index: composite indicator based on nine response indicators, including school closures, job closures, and travel bans, scaled in value from 0 to 100, where 100 = the toughest response (Stringency Index) (Data on COVID-19 2022; “Stringency Index” in the Fight against the Pandemic 2022);
- -
- World Pandemic Uncertainty Index. A higher number means a higher uncertainty (World Pandemic Uncertainty Index 2022);
- -
- General government total expenditure as a % of GDP (IMF 2022).
4. Choosing a period for analyzing the indicators of the reaction of socioeconomic systems to the impact of pandemic factors. The period from 2020 to 2022 was chosen.
5. Collection of data on the dynamics of the socioeconomic models for the period 2020–2022. The analyzed indicators are as follows:
- -
- dynamics of exports of goods (customs at current prices) in relation to the previous quarter, % (World Bank Global Economic Monitor 2022);
- -
- dynamics of imports of goods (customs at current prices) in relation to the previous quarter, % (World Bank Global Economic Monitor 2022);
- -
- Stock market index calculated in US dollars (January 2000 = 100) (World Bank Global Economic Monitor 2022);
- -
- percentage of total government expenditures in GDP, % compared to the previous year (IMF 2022);
- -
- communications, computers, etc., in % of service exports (World Development Indicators 2022);
- -
- communications, computers, etc., in % of service imports (World Development Indicators 2022).
6. Analysis of the indicators within the selected periods and conclusions about the specifics of the measures taken within each socioeconomic model. A comparative method of analysis and a graphical method of presenting the results were applied.
7. Determination of the relationship between indicators reflecting measures to combat the pandemic in different socioeconomic systems and the effectiveness of such systems during the pandemic. Application of the correlation analysis method with the calculation of correlation coefficients in the Statistica 10 environment at p < 0.05
8. Conclusions on the transformation of socioeconomic models under the influence of pandemic factors.
4. Results
We systematize the range of actions of national governments as an active response to the impact of pandemic factors. The main groups of measures are as follows (compiled from: An Overview of Economic Measure 2020):
- Quarantine measures. They differ in form, degree of manifestation, etc., ranging from recommendations for the prevention of diseases (Sweden) to the introduction of an emergency regime (Germany). In total, these measures are combined using the Stringency Index.
- Injection of liquidity into the economies of countries. The differences are in shapes, sizes, duration, target groups, etc. The amounts ranged from $170 billion (PRC) to $750 billion (UK).
- Simplification of tax regimes: reduction of taxes and deferral of taxes and fees.
- Reduction of reserve requirements for banks.
- Reduction and cancelation of loan repayments and reduction of interest rates.
- Free consulting services (opening of information portals; consulting agencies).
- Stimulating the creation of certain types of businesses (in Japan, companies involved in the fight against the pandemic, in particular, producing protective masks, were subsidized).
- Issuance of stabilization loans and loans to enterprises, including interest-free ones.
- Digitalization of services: new technologies, business practices, and business models.
- Support for export-import operations.
- Compensation of salaries.
- Coverage of social benefits and social payments.
COVID-19 statistics on the most prominent representatives of the considered socioeconomic models are shown in Table 1.
As you can see, the largest total proportion of cases on the date of access to the information resource was observed in Germany (38.1% of the population), and the smallest was in China (0.43%). However, in terms of the number of deaths, the UK and Sweden are both in first place.
The level of government spending relative to GDP is indicative in comparison to the pre-crisis period (Figure 1).
Figure 1 shows a significant relative increase in total government spending in the first year of the pandemic in the countries of all the models under consideration, except for China. This confirms the version that the state is the main buffer in the way of unpredictable factors. The explanation of the relatively low increase in government spending in the countries with the Chinese model includes: first, the earlier morbidity, before it was recognized as a pandemic, and second, the rather high role of the state in the period “before the pandemic”, which ensured the prompt adoption of complex decisions on the prevention of morbidity with a high level of performance discipline in the population.
The Stringency Index is closely related to the increase in government spending.
The graphs (Figure 2) show the relationship between the measures taken to contain the spread of the pandemic (Stringency Index) and its quarterly new cases per one million people (New Cases, Per Million People).
The absolute changes in the Stringency Index and the number of new cases differ in the countries representing the selected socioeconomic models. The ratio of these indicators also varies depending on the model. Thus, the highest Stringency Index observed in the Chinese model corresponds to the lowest incidence and, conversely, in the Scandinavian (Swedish) model, where the frequency of new cases exceeded similar indicators of other models, especially in the period 2021 (Q4)–2022 (Q1) with a relatively low Stringency Index. In general, it should be noted that there is an inverse trend of an increase in the number of new diseases relative to a decrease in compliance with preventive measures.
The degree of similarity of various socioeconomic indicators in different models during the pandemic will be shown below.
Table 2 reflects the correlation of the relative rate of increase or decrease in new cases quarterly. This is important for understanding the similarities and differences between the socioeconomic models under consideration. As you can see, there are no significant differences. Nevertheless, the dynamics in the countries of the Anglo-Saxon model were least similar to the Scandinavian (Swedish) (r = 0.886353) and Chinese (r = 0.914395) models. All correlation coefficients were significant at the level of p ˂ 0.05.
The dynamics in the countries of the German model were least correlated with the countries of the Japanese model (r = 0.85801).
The Japanese model is the most isolated in its specifics, while the highest correlation is observed with the countries of the Anglo-Saxon model (r = 0.920335).
Finally, the countries of the Chinese model were least correlated with the Japanese model (r = 0.9).
However, the absolute number of new cases per 1 million people varies significantly in different models (see Figure 3).
The smallest number of new cases in absolute numbers per 1 million people was observed in the countries of the Chinese model throughout the entire period, slightly more in the countries of the Japanese model. In relation to other models, the rating changed periodically: in the first wave of the pandemic, the largest number of cases was observed in the countries of the Rhenish model; in the last wave, it was the Scandinavian one.
Next, we analyze the mortality rate—quarterly new deaths in countries of different models per 1 million people.
Table 3 shows the correlation of the relative rate of increase or decrease in the number of new deaths in countries of different socioeconomic models on a quarterly basis. The differences in the increase or decrease of new cases were insignificant, but then there were significant differences between the models in mortality statistics. Apparently, a number of factors affect these changes. In particular, healthcare approaches are particularly important. The Rhenish (r = 0.760472) and Scandinavian (r = 0.704784) models correlate with the mortality dynamics in the countries of the Anglo-Saxon model; there is no correlation to the Japanese and Chinese models.
The mortality dynamics in the countries of the Rhenish model, as well as the Scandinavian one, correlates only with the countries of the Anglo-Saxon model.
The Japanese and Chinese models showed a mutual correlation (r = 0.861479).
As we can see, comparing the data from Table 2 and Table 3, there are significant differences in the dynamics of new cases and mortality. It can be concluded that there is a slight relationship between the number of new cases and new deaths per 1 million people. The exception is the Scandinavian model, countries which show a direct correlation between new cases and new deaths (r = 0.735013).
It is likely that the level of morbidity and mortality largely depends on the features of a particular socioeconomic model and the level of severity expressed in the Stringency Index—the index of the rigidity of the government’s response to threats, including those of a pandemic. Let us compare the dynamics of this indicator in different socioeconomic models (Table 4).
As we can see, the changes in the Stringency Index are the most correlated between the Rhenish (German) and Scandinavian (Swedish) models (r = 0.982387), between the Anglo-Saxon and Rhenish (German) (r = 0.928787), as well as between the Japanese and Anglo-Saxon models (r = 0.906539). The Chinese model has the least similarity to other models, especially Scandinavian (r = 0.622197) and Rhenish (r = 0.68987).
However, the differences in the absolute level of the Stringency Index can be significant (Figure 4), which indicates wide discrepancies in the response of socioeconomic systems. As we mentioned earlier (see Figure 2), the most stringent measures were taken in the countries of the Chinese model (in some quarters, the figures almost reached 75), and the least stringent measures were in the Scandinavian model (they dropped to almost 14).
Finally, a comparison of the World Pandemic Uncertainty Index in countries belonging to different socioeconomic models showed significant differences between the models, which is proved by the correlation coefficients (Table 5).
Thus, the index changes are similar, firstly, in the Anglo-Saxon and Rhenish models (r = 0.781554) and in the Rhenish and Scandinavian models (r = 0.823845); secondly, in the Japanese and Chinese models (r = 0.780222). No other correlation was found.
Figure 5 indicates a general downward trend in the World Pandemic Uncertainty Index; however, the detailed differences are still significant.
In general, the lowest uncertainty was observed in the countries of the Japanese and Chinese models. The highest, especially in the first year of the pandemic, is in the countries of the Anglo-Saxon and Rhenish models.
Undoubtedly, different models of socioeconomic systems have differences both in the number of pandemic manifestations and in the nature and intensity of the activity response of various social systems. Now the question arises: how do the indicators of pandemic statistics and the activity response of socioeconomic systems relate to each other, on the one hand, and the economic consequences reflected in the dynamics of socioeconomic systems, on the other hand?
According to a number of sources (Tang et al. 2022; Habibi et al. 2022), the COVID-19 pandemic has had the most serious impact on export-import operations. However, the results of the analysis showed no correlation within each of the models under consideration between the number of new cases and the export (import) of goods, except for the Anglo-Saxon model. Here, a corresponding coefficient was found between the number of new cases and export merchandise, customs in current prices (r = 0.723967), and import merchandise, customs in current prices (r = 0.779147). It is a characteristic feature of this model and a slightly later period of increase in the incidence rate than in other models. It should be noted that no reliable correlation between the number of new deaths and the volume of export-import operations (absolute and relative to the previous period) was found in any model. Moreover, the comparison of the incidence and mortality with the Stringency and Uncertainty indices did not show a reliable relationship.
In turn, in some cases, an inverse correlation was revealed between the indices of Stringency and Uncertainty, and some economic factors (Table 6).
The analysis of Table 6 shows that the most noticeable relationship between the indicators of the Stringency Index, as well as the Global Uncertainty Index and some economic indicators presented here (Exports merchandise, Import merchandise, Stock market index), is determined within the Scandinavian (Swedish), as well as the Rhenish (German) models (reliable correlation coefficients are shown in red at p ˂ 0.05).
It is noteworthy that since the beginning of the pandemic crisis, there has been a sharp increase in the indicators of Communications, Computers, etc., as a percentage of service exports and Communications, Computer, etc., as a % of service imports for each of the models under consideration (Figure 6).
The main prerequisite for such growth was the global and abrupt development of remote technologies, requiring the production of appropriate services. We should note that in the countries of the Chinese model, there was no growth in exports of these services in total, but imports increased significantly.
5. Discussion
First of all, we will identify the signs of the reaction of socioeconomic systems that occur during the period of exposure to unexpected factors and that are characteristic of all countries and regions. The most difficult thing in finding patterns of behavior of the socioeconomic system in response to the large-scale influence of unexpected factors is the choice of the right actions. This choice is most often carried out by current monitoring of the results of the measures taken. In the event that there are no noticeable improvements, the actions are enhanced or replaced by others.
If we take the pandemic as a factor of unexpected impact, then one can expect similar intuitive activity reactions based on the expectation of changes in the models of socioeconomic systems. The most notable changes include the following:
- Increase in the level of morbidity, mortality, and a decrease in the birth rate.
- Significant strengthening of the role of the state in all areas is reflected in the socioeconomic model.
- Development of industries related to remote technologies for the production of goods and services.
- Increased migration of the population: from a foreign country to the homeland and to other countries from places with the worst demographic indicators.
- Significant changes in the trade balance of countries (Habibi et al. 2022).
We suggest identifying several phases of the pandemic to have a clearer idea of socioeconomic systems’ reactions. At the same time, it should be noted that the main differences between countries belonging to different socioeconomic models will be in the strength of a particular reaction in the designated phases.
Phase 1. The feeling of threat, recording of the first cases of diseases and deaths, the appearance of fear and panic among the population, and primary decisions of the government and the market to prevent diseases.
Phase 2. A sharp increase in morbidity and mortality, the introduction of compulsory measures to prevent the disease, restrictions on the work of enterprises and organizations to a complete stop of activity, the development of tests and vaccines, the introduction of testing and vaccination, and panic among the population.
Phase 3. Reduction of morbidity and mortality with periodic peaks of incidence, free or inexpensive vaccination in order to reach the threshold of collective immunity, isolation, quarantine measures, the emergence of contradictions in society on vaccination, and other preventive measures. Introduction of interregional and interstate export-import restrictions and breaks in value chains in the production of goods. Decrease in population income.
Phase 4. A slight increase in the number of cases and deaths, overstocking of production facilities with intermediate-stage products, shortage of end-use products, inflation, mass closure of enterprises and organizations in the real sector of the economy, and an increase in unemployment.
Phase 5. The reduction in mortality and incidence, continued isolation, the development of alternative production options, and the search for import substitution opportunities.
Phase 6. New cases are episodic, isolated in nature, and mortality is low. There is a shortage of imported intermediate and finished goods, a limited possibility of export operations, activation of national production potential, and stabilization of the updated form of the socioeconomic model.
It should be noted that in some, often unclear conditions, repeated waves of the pandemic occur with a complete or partial repetition of its life cycle.
Now we will discuss the revealed differences in the behavior of groups of states belonging to different socioeconomic models.
As we noted earlier, the incidence ratio to the population of states built according to different socioeconomic principles, as well as the death ratio, vary. It depends on a number of factors, one of which is the nature of the state’s activity response. In most cases, shares of government spending increase, but the type and direction of spending can vary significantly. For example, public spending in the countries of the Anglo-Saxon model, which is normally relatively small compared to countries of other models, was unprecedentedly high during the COVID-19 pandemic, and the types of spending are very diverse: in fact, all more or less common measures were applied. On the other hand, the countries of the Japanese model had an unconventional activity reaction of the state, for example, the so-called crowd control, the purpose of which was to separate the flows of people from each other as much as possible in order to avoid mixing healthy people with sick people. To this end, government spending was directed to the creation of special software tools (Durán-Polanco and Siller 2021), while in England, the analysis of the population mobility based on their smartphones was carried out only for research purposes and after the end of the main phases of the pandemic (Lee et al. 2021).
At the same time, the role of the state implied not only financial injections into the economy and social sphere. Discussing the impact of a set of strict measures integrated into the form of the Stringency Index, it can be noted that the use of such measures is strongly characteristic of the Chinese model. Statistics show that it costs the state less than direct or indirect financial injections. Of course, the stricter the measures, the more the economy declines, but in practice, the economic recovery is quite fast (Li et al. 2022; Teng et al. 2022), and at the same time, human lives and health are preserved, unlike the greater morbidity and mortality of countries of other models. The countries of the Japanese model with a lower Stringency Index (versus the countries of the Chinese model) and a relatively low incidence were the exceptions due to the special measures taken by these states.
The dynamics of incidence were important in cross-model comparison. Evidently, the smallest correlation was found between those models that were unique in preventing the spread of the pandemic. However, despite the fact that models with similar dynamics were identified, their comparison by the absolute number of new cases per 1 million people showed significant differences. On the one hand, these two indicators characterize global trends and, on the other hand, the specifics of the local development of the pandemic. This enables us to pay special attention to the measures taken by the more successful countries in the fight against the pandemic, representing the Chinese and Japanese models.
The findings also confirm the results of the analysis of new deaths: the countries of the Chinese and Japanese models have the most favorable dynamics, which distinguishes them from the Anglo-Saxon, Rhenish, and Scandinavian models. It should be noted that the dynamics of new cases were similar between all models. However, the dynamics of mortality differed significantly in different models. We should also note the absence of a correlation between the number of new cases and deaths (except for the Scandinavian model). The measures taken in a number of cases were justified, which shows the great resilience of the Japanese and especially the Chinese models to sudden external factors.
We also note the importance of increasing the level of certainty as opposed to the Uncertainty Index during the pandemic. Certainty and predictability reduce panic and stabilize the economic behavior of the population.
A controversial and unexpected result was the absence in most cases of a confirmed statistical relationship between the number of new cases and deaths and the export-import operations within the countries of the same model. These facts may indicate that the impact of pandemic factors on the economy is indirect. In other words, the number of cases and deaths can only cause a high level of uncertainty and rigidity of preventive measures, which, in turn, affect the country’s economy.
Another unexpected result was the lack of a link between morbidity and mortality rates and the stringency of measures. We believe this may indicate that the stringency of measures could be influenced by global trends provoking total prevention measures rather than by the COVID-19 statistics of a particular state (model). We think that similar results would be obtained when comparing these indicators in individual countries. We assume that it would hardly be consistent if a reliable correlation between new COVID-19 cases and the severity of measures was revealed within some countries.
Moreover, the stringency of the measures taken by the countries of the Japanese and Chinese models did not show a statistical connection with the export of goods. Apparently, the reason for this was the relatively passive dynamics of the Stringency Index (consistently high), which led to the lack of correlation. This conclusion is supported by a confirmed inverse correlation with the Stringency Index of the Anglo-Saxon and Scandinavian models. The high dynamics of this index can be seen above (Figure 2).
An interesting finding was the feedback between the dynamics of exports and imports of goods and the level of uncertainty within the Rhenish and Scandinavian models, which may indicate the suspension of international trade operations in a situation of unpredictable forecasts. This shows that it is highly important to work on increasing predictability in order to stabilize the entire socioeconomic system, which is confirmed by the revealed relationship with stock market indices in the same models.
At the same time, we should note the spike in export-import operations of computer services and communication services at the peak of the pandemic, which at present and in the future can be recognized as a natural reaction when any pandemic factors appear since remote technologies provide the best opportunity to remain socially active, and at the same time comply with isolation requirements.
Most of the changes outlined above led to the deglobalization of the economy.
6. Conclusions
This work partially closes the gap in the comparative analysis of socioeconomic models of states in terms of their reaction to the unforeseen impact of unpredictable factors. We also highlight the course of the pandemic in countries from different socioeconomic models, which allows us to identify the connection between the pandemic and actions taken within a particular model.
The study can be used to adjust the strategy of socioeconomic development in the event of a sudden pandemic. In particular, the most universal measures identified in the study include:
- Enhanced quarantine measures are used to accelerate the localization of the disease and prevent its spreading. It will have a less negative impact on the economy and will contribute to its accelerated recovery. This also applies to the promptness of measures, implying their adoption in case of tension in foreign countries. In other words, actions should be proactive.
- Flexible quarantine measures imply using crowd management methods when the main goal is not absolute isolation of a person but reducing the risk of healthy people contacting the sick.
- Reducing the level of uncertainty and panic, which has a positive impact on the economic behavior of the population, its reasonableness, and prompting citizens to leave the zones of infection. In addition, a low level of uncertainty will cause an increase in entrepreneurial activity, including the development of export-import operations, which will strengthen global business networks.
The study has limitations. First of all, in order to determine the characteristics of each socioeconomic model, the characteristics of the countries included therein were mediated, which inevitably leads to an error in the individual assessment of the development of each country included in a particular model. Second, it cannot be claimed that the COVID-19 pandemic has come to an end, which means that adjustments in the dynamics of socioeconomic models are possible in the future. Third, it would be a mistake to talk about the sharp boundaries of differences between socioeconomic models from one another—all models have common features and uniqueness, which allows for errors in analysis, forecasts, and recommendations.
The study can be developed further. First, we can expand the list of socioeconomic models of the countries in order to find new effective structures that successfully perceive unpredictable impacts. Second, the analysis should be continued as new statistical data are published, which will allow us to present the dynamics in more complete stages of the pandemic. Finally, each model can be considered in greater detail, analyzing smaller elements, which can reveal the unique properties of the model that contribute to reflecting the impact of sudden factors, such as a pandemic.
Funding
This research was funded by the Russian Science Foundation, grant number 22-28-01976. Available online: https://rscf.ru/project/22-28-01976/ (accessed on 10 January 2022).
Informed Consent Statement
Not applicable.
Data Availability Statement
Knoema 2020; World Bank Global Economic Monitor 2022; World Development Indicators 2022; World Health Organization 2022; World Pandemic Uncertainty Index 2022.
Conflicts of Interest
The author declares no conflict of interest.
Appendix A

Table A1.
General government total expenditure as a percentage of GDP.
| 2017 | 2018 | 2019 | 2020 | |
|---|---|---|---|---|
| Anglo-Saxon model | 35.6 | 35.7 | 36.2 | 44.2 |
| Ireland | 26.406 | 25.6 | 24.53 | 28.71 |
| United Kingdom | 39.26 | 39.004 | 38.869 | 50.273 |
| Canada | 40.455 | 40.866 | 40.956 | 52.449 |
| United States | 35.352 | 35.423 | 35.681 | 46.179 |
| Australia | 36.776 | 36.869 | 38.287 | 44.981 |
| New Zeland | 35.605 | 36.175 | 38.818 | 42.423 |
| Rhenish (German) model | 42.5 | 42.3 | 42.5 | 48.8 |
| Belgium | 52.0 | 52.2 | 52.1 | 60.8 |
| Germany | 44.2 | 44.5 | 45.2 | 51.1 |
| Netherlands | 41.7 | 41.5 | 41.3 | 46.9 |
| Switzerland | 32.0 | 31.3 | 31.5 | 36.3 |
| Scandinavian (Swedish) model | 49.3 | 49.1 | 49.2 | 54.5 |
| Denmark | 50.6 | 50.5 | 49.2 | 55.1 |
| Finland | 53.6 | 53.3 | 53.4 | 56.7 |
| Iceland | 44.5 | 44.0 | 43.4 | 49.7 |
| Norway | 49.6 | 48.9 | 51.6 | 58.2 |
| Sweden | 48.3 | 48.8 | 48.3 | 53.1 |
| Japanese model | 23.8 | 24.2 | 24.9 | 29.0 |
| Indonesia | 16.6 | 16.6 | 16.4 | 18.2 |
| Japan | 36.9 | 37.0 | 37.2 | 46.7 |
| Malaysia | 21.9 | 22.8 | 23.5 | 25.4 |
| South Korea | 19.6 | 20.4 | 22.6 | 25.6 |
| Chinese model | 26.6 | 26.7 | 28.5 | 29.3 |
| China | 31.6 | 32.9 | 34.1 | 37.0 |
| Vietnam | 21.5 | 20.5 | 22.8 | 21.6 |
Source: own elaboration based on (IMF 2022).
Appendix B
Table A2.
Stringency Index.
| 2020 Q1 | 2020 Q2 | 2020 Q3 | 2020 Q4 | 2021 Q1 | 2021 Q2 | 2021 Q3 | 2021 Q4 | 2022 Q1 | 2022 Q2 | 2022 Q3 | |
|---|---|---|---|---|---|---|---|---|---|---|---|
| Anglo-Saxon model | 29.4 | 70.9 | 61.0 | 61.6 | 66.6 | 55.1 | 54.5 | 56.1 | 40.7 | 20.1 | 15.1 |
| Ireland | 39.18 | 81.85 | 53.34 | 73.1 | 86.16 | 65.26 | 41.4 | 41.77 | 20.64 | 8.85 | 11.02 |
| United Kingdom | 23.69 | 74.9 | 66.2 | 69.54 | 84.67 | 59.53 | 44.8 | 43.05 | 31.24 | 12.86 | 11.11 |
| Canada | 19.47 | 72.6 | 66.28 | 69.25 | 74.53 | 74.55 | 65.3 | 63.65 | 58.11 | 21.44 | 17.7 |
| United States | 22.5 | 72.04 | 66.56 | 68.51 | 67.76 | 56.3 | 51.22 | 50.86 | 42.68 | 27.59 | 24.32 |
| Australia | 27.03 | 64.52 | 73.2 | 65.73 | 57.87 | 52.62 | 70.07 | 64.53 | 43.93 | 29.99 | 11.36 |
| New Zeland | 44.41 | 59.51 | 40.22 | 23.46 | 28.44 | 22.22 | 54.47 | 72.99 | 47.88 | 20.12 | 15.35 |
| Rhenish (German) model | 36.7 | 67.5 | 49.0 | 59.3 | 70.4 | 62.2 | 46.6 | 41.6 | 36.1 | 17.8 | 15.3 |
| Belgium | 31.84 | 71.75 | 54.06 | 58.33 | 62.41 | 57.26 | 47.03 | 34.1 | 30.58 | 20.96 | 20.96 |
| Germany | 28.22 | 67.3 | 55.12 | 64.31 | 80.97 | 72.6 | 61.32 | 45.5 | 44.3 | 22.82 | 14.81 |
| Netherlands | 42.26 | 71.15 | 45.1 | 64.4 | 78.17 | 67.59 | 40.14 | 45.87 | 40.92 | 16.28 | 15.65 |
| Switzerland | 44.44 | 59.66 | 41.76 | 50.06 | 60.19 | 51.36 | 37.94 | 40.75 | 28.51 | 11.11 | 9.7 |
| Scandinavian (Swedish) model | 31.0 | 58.8 | 45.1 | 49.6 | 60.3 | 55.3 | 36.5 | 27.8 | 25.8 | 14.3 | 14.1 |
| Denmark | 28.22 | 64.82 | 52.82 | 46.57 | 65.87 | 58.48 | 37.35 | 28.42 | 20.03 | 11.11 | 11.11 |
| Finland | 29.4 | 57.89 | 34.22 | 42.9 | 52.31 | 51.02 | 38.45 | 29.49 | 30.34 | 26.85 | 26.24 |
| Iceland | 34.54 | 47.2 | 42.01 | 49.51 | 45.08 | 43.89 | 28.54 | 33.9 | 26.61 | 11.11 | 11.11 |
| Norway | 42.05 | 60.2 | 38.9 | 48.07 | 68.93 | 61.72 | 42.06 | 28.84 | 26.1 | 11.11 | 11.11 |
| Sweden | 20.91 | 63.71 | 57.45 | 60.85 | 69.35 | 61.18 | 36.31 | 18.25 | 25.96 | 11.11 | 11.11 |
| Japanese model | 36.1 | 58.4 | 51.5 | 56.3 | 63.2 | 61.1 | 61.1 | 52.7 | 51.5 | 38.3 | 30.7 |
| Indonesia | 42.25 | 70.37 | 62.99 | 59.77 | 69.09 | 71.76 | 71.18 | 62.31 | 63.44 | 42.86 | 28.11 |
| Japan | 27.66 | 38.54 | 31.66 | 38.29 | 47.64 | 49.23 | 51.27 | 47.22 | 46.99 | 43.14 | 37.53 |
| Malaysia | 31.76 | 70.23 | 58.6 | 69.77 | 73.69 | 70.48 | 74.44 | 56.41 | 52.33 | 48.53 | 43.39 |
| South Korea | 42.9 | 54.5 | 52.62 | 57.47 | 62.21 | 53.02 | 47.58 | 44.85 | 43.11 | 18.68 | 13.89 |
| Chinese model | 59.0 | 72.8 | 71.5 | 62.0 | 65.8 | 70.2 | 74.4 | 69.5 | 66.9 | 56.4 | 49.8 |
| China | 75.45 | 71.17 | 72.32 | 70.47 | 68.25 | 71.47 | 73.13 | 71.83 | 67.74 | 78.66 | 73.61 |
| Vietnam | 42.46 | 74.51 | 70.7 | 53.49 | 63.41 | 68.89 | 75.58 | 67.25 | 65.99 | 34.09 | 25.93 |
Source: own elaboration based on (Data on COVID-19 2022).
Table A3.
New Cases of COVID-19, Per Million People.
| 2020(Q1) | 2020(Q2) | 2020(Q3) | 2020(Q4) | 2021(Q1) | 2021(Q2) | 2021(Q3) | 2021(Q4) | 2022(Q1) | 2022(Q2) | 2022(Q3) | |
|---|---|---|---|---|---|---|---|---|---|---|---|
| Anglo-Saxon model | 395.6 | 3026.2 | 3438.3 | 15,204.8 | 16,305.6 | 5825.9 | 17,770.7 | 36,619.6 | 10,7157.9 | 59,370.7 | 32,373.5 |
| Ireland | 648.7 | 4459.6 | 2142.2 | 11,154.9 | 28,892.9 | 7234.9 | 24,246.7 | 79,940.8 | 135,645.1 | 28,314.1 | 10,974.4 |
| United Kingdom | 572.0 | 3644.8 | 2520.1 | 30,253.9 | 27,600.8 | 6871.8 | 44,680.2 | 76,260.0 | 109,424.1 | 23,436.8 | 11,482.1 |
| Canada | 280.7 | 2460.9 | 1518.9 | 11,209.2 | 10,494.4 | 11,245.9 | 5484.9 | 15,586.7 | 33,185.0 | 12,592.6 | 6118.9 |
| United States | 570.0 | 7290.3 | 13,646.4 | 38,498.6 | 30,744.5 | 9504.5 | 28,957.5 | 33,734.2 | 75,162.6 | 22,109.0 | 19,262.4 |
| Australia | 175.9 | 129.7 | 739.8 | 51.3 | 34.6 | 51.0 | 2952.7 | 12,280.2 | 161,142.9 | 138,559.3 | 70,695.1 |
| New Zeland | 126.1 | 172.1 | 62.4 | 61.2 | 66.5 | 47.2 | 302.0 | 1915.7 | 128,387.7 | 131,212.4 | 75,707.9 |
| Rhenish (German) model | 1132.8 | 2404.3 | 3194.9 | 36,873.9 | 19,424.5 | 15,846.9 | 13,468.4 | 57,792.6 | 209,796.0 | 41,491.9 | 26,799.5 |
| Belgium | 1100.2 | 4190.0 | 4911.1 | 45,476.3 | 20,321.1 | 17,455.1 | 13,764.3 | 74,098.5 | 150,343.8 | 34,020.8 | 19,953.8 |
| Germany | 742.3 | 1586.7 | 1138.5 | 17,150.7 | 13,057.8 | 11,021.3 | 5986.9 | 35,043.4 | 170,326.3 | 83,168.0 | 44,928.1 |
| Netherlands | 778.2 | 2102.2 | 4248.3 | 38,959.4 | 27,195.6 | 23,189.3 | 18,318.4 | 65,391.7 | 269,430.4 | 18,607.4 | 11,259.2 |
| Switzerland | 1910.5 | 1738.4 | 2481.5 | 45,909.0 | 17,123.6 | 11,721.9 | 15,804.0 | 56,636.6 | 249,083.3 | 30,171.3 | 31,056.8 |
| Scandinavian (Swedish) model | 1035.2 | 2274.8 | 1783.3 | 15,107.0 | 12,853.1 | 9795.6 | 10,025.5 | 38,720.7 | 242,436.7 | 22,401.2 | 14,298.9 |
| Denmark | 488.5 | 1692.4 | 2601.5 | 23,142.4 | 11,807.7 | 10,774.1 | 11,123.4 | 75,774.3 | 385,425.9 | 19,301.1 | 16,665.2 |
| Finland | 302.0 | 1009.2 | 538.3 | 4729.6 | 7518.3 | 3245.3 | 8327.5 | 23,251.3 | 110,702.3 | 47,314.7 | 20,445.8 |
| Iceland | 3064.8 | 1860.5 | 2441.0 | 8171.0 | 1220.5 | 1198.9 | 13911.7 | 41,200.5 | 416,736.2 | 34,749.6 | 27,761.4 |
| Norway | 859.0 | 784.4 | 952.8 | 6577.8 | 8608.5 | 6521.7 | 10,756.0 | 37,909.9 | 187,247.3 | 7645.7 | 2301.3 |
| Sweden | 461.8 | 6027.5 | 2382.6 | 32,914.2 | 35,110.7 | 27,238.1 | 6008.9 | 15,467.3 | 112,072.0 | 2994.8 | 4320.6 |
| Japanese model | 73.7 | 141.4 | 413.5 | 1662.5 | 3115.1 | 4547.4 | 15,552.0 | 5464.1 | 83,479.4 | 32,404.1 | 42,211.9 |
| Indonesia | 5.6 | 200.4 | 842.5 | 1666.4 | 2807.3 | 2434.9 | 7440.4 | 173.9 | 6393.0 | 276.3 | 930.1 |
| Japan | 18.1 | 131.2 | 521.4 | 1221.1 | 1920.7 | 2604.0 | 7266.4 | 218.5 | 38,706.3 | 22,159.6 | 72,683.5 |
| Malaysia | 82.4 | 174.9 | 77.0 | 3031.7 | 6924.7 | 12,107.0 | 44,490.4 | 15,261.6 | 43,004.7 | 10,845.8 | 6193.7 |
| South Korea | 188.8 | 59.1 | 213.0 | 730.9 | 807.8 | 1043.5 | 3010.8 | 6202.6 | 245,813.8 | 96,334.7 | 89,040.1 |
| Chinese model | 30.0 | 2.1 | 5.0 | 3.1 | 7.6 | 75.2 | 3971.1 | 4827.4 | 40,223.8 | 6294.5 | 3381.4 |
| China | 57.9 | 2.8 | 2.3 | 2.3 | 3.4 | 2.1 | 4.1 | 5.4 | 79.1 | 463.3 | 41.3 |
| Vietnam | 2.2 | 1.5 | 7.6 | 3.8 | 11.7 | 148.2 | 7938.0 | 9649.3 | 80,368.4 | 12,125.6 | 6721.5 |
Source: own elaboration based on (COVID-19 and Related Statistics 2022).
Appendix C
Table A4.
New Deaths, Per Million People.
| 2020 Q1 | 2020 Q2 | 2020 Q3 | 2020 Q4 | 2021 Q1 | 2021 Q2 | 2021 Q3 | 2021 Q4 | 2022 Q1 | 2022 Q2 | 2022 Q3 | |
|---|---|---|---|---|---|---|---|---|---|---|---|
| Anglo-Saxon model | 18.6 | 281.3 | 55.5 | 204.0 | 354.2 | 56.0 | 89.0 | 135.6 | 210.3 | 129.3 | 93.1 |
| Ireland | 14.2 | 334.7 | 14.7 | 88.2 | 491.3 | 63.0 | 50.3 | 133.0 | 168.7 | 149.6 | 64.4 |
| United Kingdom | 76.4 | 758.9 | 38.4 | 538.2 | 857.2 | 29.8 | 141.4 | 194.5 | 218.1 | 123.6 | 64.6 |
| Canada | 4.0 | 224.6 | 16.3 | 167.6 | 189.3 | 87.4 | 41.1 | 64.4 | 200.1 | 114.1 | 55.2 |
| United States | 15.9 | 362.2 | 233.0 | 429.1 | 587.1 | 155.5 | 285.3 | 381.8 | 468.0 | 102.9 | 78.3 |
| Australia | 0.7 | 3.4 | 30.2 | 0.8 | 0.0 | 0.0 | 15.6 | 36.3 | 144.9 | 137.8 | 147.3 |
| New Zeland | 0.2 | 4.3 | 0.6 | 0.0 | 0.4 | 0.0 | 0.2 | 3.7 | 61.8 | 147.8 | 148.7 |
| Rhenish (German) model | 45.7 | 330.6 | 17.3 | 518.9 | 350.0 | 121.1 | 33.2 | 185.9 | 162.4 | 71.3 | 37.2 |
| Belgium | 60.7 | 778.7 | 33.2 | 819.2 | 300.4 | 185.8 | 36.9 | 235.0 | 214.9 | 94.0 | 49.8 |
| Germany | 7.0 | 100.6 | 6.3 | 282.7 | 518.8 | 174.2 | 33.1 | 219.2 | 213.2 | 137.8 | 70.9 |
| Netherlands | 59.4 | 290.8 | 18.4 | 287.5 | 291.7 | 69.3 | 26.2 | 157.9 | 61.4 | 22.4 | 12.4 |
| Switzerland | 55.8 | 152.3 | 11.4 | 686.3 | 288.9 | 55.0 | 36.6 | 131.6 | 160.0 | 30.8 | 15.5 |
| Scandinavian (Swedish) model | 14.8 | 138.2 | 14.1 | 102.2 | 148.1 | 34.9 | 17.7 | 67.5 | 253.7 | 144.0 | 89.8 |
| Denmark | 15.4 | 89.0 | 7.7 | 110.7 | 191.5 | 19.7 | 20.8 | 94.1 | 415.2 | 131.7 | 72.4 |
| Finland | 9.2 | 46.6 | 3.6 | 47.5 | 52.4 | 18.4 | 24.2 | 107.7 | 225.1 | 312.7 | 126.8 |
| Iceland | 5.4 | 21.6 | 0.0 | 51.3 | 0.0 | 2.7 | 8.1 | 10.8 | 175.5 | 51.3 | 70.2 |
| Norway | 7.2 | 39.0 | 4.4 | 30.0 | 43.9 | 22.6 | 12.4 | 82.4 | 161.0 | 151.6 | 114.0 |
| Sweden | 36.8 | 494.9 | 54.6 | 271.6 | 452.7 | 111.2 | 22.8 | 42.6 | 291.9 | 72.5 | 65.5 |
| Japanese model | 1.4 | 5.4 | 9.1 | 19.2 | 38.4 | 57.8 | 241.8 | 56.9 | 108.5 | 52.1 | 28.8 |
| Indonesia | 0.499 | 10.009 | 28.729 | 41.634 | 68.383 | 64.411 | 304.827 | 7.872 | 40.163 | 6.021 | 2.763 |
| Japan | 0.536 | 7.265 | 4.808 | 15.372 | 45.614 | 44.996 | 22.992 | 5.933 | 78.09 | 25.334 | 60.576 |
| Malaysia | 1.431 | 2.184 | 0.45 | 9.979 | 23.856 | 116.098 | 630.399 | 153.45 | 104.127 | 23.293 | 12.835 |
| South Korea | 3.126 | 2.313 | 2.561 | 9.684 | 15.78 | 5.518 | 9.181 | 60.352 | 211.554 | 153.678 | 38.862 |
| Chinese model | 2.3 | 0.0 | 0.2 | 0.0 | 0.0 | 0.2 | 98.6 | 67.2 | 51.8 | 3.3 | 0.1 |
| China | 2.3 | 0.0 | 0.0 | 0.0 | 0.0 | 0.0 | 0.0 | 0.0 | 0.0 | 0.4 | 0.0 |
| Vietnam | 0.4 | 0.0 | 0.0 | 0.5 | 197.2 | 134.3 | 103.6 | 6.1 | 0.2 |
Source: own elaboration based on (COVID-19 and Related Statistics 2022).
Appendix D
Table A5.
Communications, computer, etc. as a % of service exports.
| 2017 | 2018 | 2019 | 2020 | 2021 | |
|---|---|---|---|---|---|
| Anglo-Saxon model | 44.2 | 45.2 | 46.3 | 55.3 | 60.4 |
| Ireland | 75.05733718 | 78.39089583 | 80.56090528 | 84.74048791 | 85.84943511 |
| United Kingdom | 51.73400862 | 53.59555737 | 54.3556805 | 61.04554527 | 61.35376748 |
| Canada | 49.14219131 | 51.07201149 | 51.83397138 | 62.60320658 | 63.47158469 |
| United States | 48.4486822 | 48.31342932 | 49.22303739 | 58.29486981 | 58.43605712 |
| Australia | 21.34883929 | 21.10219424 | 21.92888586 | 34.1336442 | 46.69816482 |
| New Zeland | 19.19337286 | 18.5622856 | 19.94700922 | 30.84307169 | 46.76756499 |
| Rhenish (German) model | 60.1 | 60.2 | 60.0 | 63.1 | 62.2 |
| Belgium | 62.39909403 | 62.14700282 | 62.60034489 | 63.81248449 | 62.73845421 |
| Germany | 57.22498312 | 57.61653953 | 57.54207168 | 62.30480882 | 60.81586752 |
| Netherlands | 67.76506205 | 66.44139947 | 66.90268709 | 71.48285284 | 68.67899707 |
| Switzerland | 53.21018729 | 54.66971257 | 53.0994684 | 54.87344565 | 56.64012863 |
| Scandinavian (Swedish) model | 44.3 | 44.1 | 47.0 | 57.1 | 52.5 |
| Denmark | 34.66869238 | 36.48714019 | 35.16161734 | 36.79874231 | 29.55980655 |
| Finland | 71.77170932 | 71.05126601 | 73.08927911 | 84.32100277 | 84.76089425 |
| Iceland | 15.77228251 | 15.57357165 | 22.09320861 | 47.8338883 | 35.59355701 |
| Norway | 33.22450984 | 32.89905355 | 35.26015201 | 41.06454886 | 40.58221579 |
| Sweden | 66.31018683 | 64.61295781 | 69.47537803 | 75.67737515 | 72.02660513 |
| Japanese model | 44.5 | 44.4 | 44.1 | 62.3 | 66.2 |
| Indonesia | 31.56129706 | 33.22324465 | 32.07659137 | 55.83153732 | 65.63389296 |
| Japan | 56.68290955 | 56.36117915 | 57.57903174 | 69.85898198 | 73.093649 |
| Malaysia | 36.15409261 | 36.33395338 | 36.56132658 | 66.93479457 | 76.54224781 |
| South Korea | 53.72787239 | 51.60232452 | 50.13082766 | 56.75361652 | 49.55457416 |
| Chinese model | 60.9 | 60.9 | 60.9 | 60.9 | 60.9 |
| China | 60.88352357 | 60.88352357 | 60.88352357 | 60.88352357 | 60.88352357 |
| Vietnam | … | … | … | … | … |
Source: own elaboration based on (World Development Indicators 2022). …—no data.
Table A6.
Communications, computer, etc. as a % of service imports.
| 2017 | 2018 | 2019 | 2020 | 2021 | |
|---|---|---|---|---|---|
| Anglo-Saxon model | 46.6 | 46.9 | 48.5 | 62.4 | 61.9 |
| Ireland | 83.81065257 | 81.93914316 | 86.22825975 | 86.99577811 | 85.14069696 |
| United Kingdom | 49.66916088 | 51.2649503 | 52.07493961 | 69.29383135 | 66.47186585 |
| Canada | 38.15118669 | 40.48536832 | 42.37828907 | 55.8637609 | 58.35493615 |
| United States | 44.3759709 | 43.28663107 | 42.66385393 | 55.2272431 | 50.96960381 |
| Australia | 27.04156365 | 27.28019663 | 28.03761011 | 53.11261441 | 57.37615398 |
| New Zeland | 36.50517535 | 37.1990325 | 39.86840086 | 53.66720374 | 53.26019589 |
| Rhenish (German) model | 61.2 | 60.7 | 61.2 | 67.2 | 64.1 |
| Belgium | 54.63510949 | 54.37495686 | 55.73224996 | 60.17961604 | 57.24475382 |
| Germany | 49.75304378 | 49.58028062 | 50.77431769 | 58.67686619 | 54.51614024 |
| Netherlands | 68.47091713 | 67.57137015 | 66.56505073 | 71.77558334 | 67.16624438 |
| Switzerland | 71.9285433 | 71.17340584 | 71.60858525 | 77.98832848 | 77.39226681 |
| Scandinavian (Swedish) model | 45.5 | 46.3 | 48.2 | 61.0 | 58.8 |
| Denmark | 37.79592829 | 39.9172503 | 40.06613054 | 45.16918873 | 41.80856418 |
| Finland | 57.06772248 | 58.01932838 | 61.46151773 | 71.6091286 | 71.82659044 |
| Iceland | 33.01342232 | 35.84915889 | 36.59856094 | 54.45525693 | 50.73477094 |
| Norway | 41.46978611 | 39.74891965 | 41.87667821 | 59.26009173 | 55.99895991 |
| Sweden | 58.24670094 | 58.03248066 | 60.9708934 | 74.39750219 | 73.80770386 |
| Japanese model | 47.5 | 46.5 | 48.3 | 58.6 | 59.2 |
| Indonesia | 37.75165623 | 34.76245333 | 37.10766921 | 54.43350712 | 56.00033063 |
| Japan | 62.56298461 | 63.57553381 | 67.06778297 | 72.68903423 | 72.96429008 |
| Malaysia | 40.99841364 | 39.0962351 | 38.46178202 | 47.77574101 | 48.66910029 |
| South Korea | 48.54415773 | 48.64404958 | 50.47213053 | 59.69368671 | 59.30591324 |
| Chinese model | 22.8 | 23.9 | 26.2 | 36.5 | 36.7 |
| China | 22.83291969 | 23.89444497 | 26.17395206 | 36.51316135 | 36.68037004 |
| Vietnam | … | … | … | … | … |
Source: own elaboration based on (World Development Indicators 2022). …—no data.
References
- Aksenov, Sergey Mikhailovich. 2006. The Swedish model of society development. ECO 2: 137–51. Available online: https://www.elibrary.ru/download/elibrary_9251080_81770608.pdf (accessed on 15 August 2022).
- An Overview of Economic Measures Applied by Countries in the Context of the Spread of COVID-19. 2020. Roscongress. Available online: https://roscongress.org/upload/medialibrary/c98/Obzor_eco_mer_final2.pdf (accessed on 9 September 2022).
- Bardhan, Pranab. 2020. The Chinese governance system: Its strengths and weaknesses in a comparative development perspective. China Economic Review 61: 101430. [Google Scholar] [CrossRef]
- COVID-19 and Related Statistics. 2022. Available online: https://public.knoema.com/oxosmkg/covid-19-and-related-statistics (accessed on 31 August 2022).
- Curtis, Steven Kane. 2021. Business model patterns in the sharing economy. Sustainable Production and Consumption 27: 1650–71. [Google Scholar] [CrossRef]
- Data on COVID-19 (Coronavirus) by Our World in Data. 2022. Available online: https://github.com/owid/covid-19-data/tree/master/public/data/ (accessed on 4 September 2022).
- Durán-Polanco, Liliana, and Mario Siller. 2021. Crowd management COVID-19. Annual Reviews in Control 52: 465–78. [Google Scholar] [CrossRef] [PubMed]
- Faruk, Omar, and Suman Kar. 2021. A Data Driven Analysis and Forecast of COVID-19 Dynamics during the Third Wave Using SIRD Model in Bangladesh. COVID 1: 503–17. [Google Scholar] [CrossRef]
- Gubaidullina, Farida Sabirovna. 2016. Transformation of Economic Model of Japan. Journal of Modern Competition 10: 74–89. [Google Scholar]
- Gueye, Khadim, Abdou Padane, Cyrille Kouligueul Diédhiou, Samba Ndiour, Ndéye Diabou Diagne, Aminata Mboup, Moustapha Mbow, Cheikh Ibrahima Lo, Nafissatou Leye, Aissatou Sow Ndoye, and et al. 2022. Evolution of SARS-CoV-2 Strains in Senegal: From a Wild Wuhan Strain to the Omicron Variant. COVID 2: 1116–24. [Google Scholar] [CrossRef]
- Habibi, Zohal, Hamed Habibi, and Mohammad Aqa Mohammadi. 2022. The Potential Impact of COVID-19 on the Chinese GDP, Trade, and Economy. Economies 10: 73. [Google Scholar] [CrossRef]
- IMF: World Economic Outlook (WEO) Database, April. 2022. Available online: https://public.knoema.com/wqlxlcg/imf-world-economic-outlook-weo-database-april-2022 (accessed on 23 August 2022).
- Ivanovskiy, Boris Georgievich. 2021. Economic damage from the COVID-19 pandemic and measures to overcome it in the countries of the European Union (Review). Economic and Social Problem of Russia 3: 75–87. [Google Scholar] [CrossRef]
- Kanarsh, Grigorij Y. 2018. Two models of capitalism. Horizons of Humanitarian Knowledge 2: 35–51. [Google Scholar] [CrossRef]
- Keogh-Brown, Marcus R., Henning Tarp Jensen, W. John Edmundss, and Richard D. Smith. 2020. The impact of COVID-19, associated behaviours and policies on the UK economy: A computable general equilibrium model. SSM—Population Health 12: 100651. [Google Scholar] [CrossRef]
- Knoema. 2020. Available online: https://knoema.com (accessed on 4 September 2022).
- Kurrey, Ramsingh, and Anushree Saha. 2022. An Overview of SARS-CoV-2 and Technologies for Detection and Ongoing Treatments: A Human Safety Initiative. COVID 2: 731–51. [Google Scholar] [CrossRef]
- Kuznetsov, Aleksei V. 2017. Peculiarities of investment strategies of Japan and the prospects of cooperation with Russia. Finansy: Teoriya i praktika = Finance: Theory and Practice 21: 108–17. [Google Scholar] [CrossRef] [Green Version]
- Lacey King, Erin, Stephan Weiler, Eric Stewart, and Kendall Stephenson. 2022. Multi-Level Nowcasting: Estimation in a Post-COVID Landscape. Economies 10: 194. [Google Scholar] [CrossRef]
- Lee, Won Do, Matthias Qian, and Tim Schwanen. 2021. The association between socioeconomic status and mobility reductions in the early stage of England’s COVID-19 epidemic. Health and Place 69: 102563. [Google Scholar] [CrossRef] [PubMed]
- Li, Xin, Eddie C. M. Hui, and Jianfu Shen. 2022. Institutional development and the government response to COVID-19 in China. Habitat International 127: 102629. [Google Scholar] [CrossRef] [PubMed]
- Lukonin, Sergey Aleksandrovich, and Ekaterina Olegovna Zakliazminskaia. 2020. Transformation of the socio-economic model of China in the context of a pandemic. Outlines of Global Transformations: Politics, Economics, Law 13: 198–216. [Google Scholar] [CrossRef]
- Majeed, Abdul. 2021. Effective Handling of COVID-19 Pandemic: Experiences and Lessons from the Perspective of South Korea. COVID 1: 325–34. [Google Scholar] [CrossRef]
- Murewanhema, Grant, Tafadzwa Dzinamarira, Innocent Chingombe, Munyaradzi Paul Mapingure, Solomon Mukwenha, Itai Chitungo, Helena Herrera, Roda Madziva, Solwayo Ngwenya, Godfrey Musuka, and et al. 2022. Emerging SARS-CoV-2 Variants, Inequitable Vaccine Distribution, and Implications for COVID-19 Control in Sub-Saharan Africa. COVID 2: 341–49. [Google Scholar] [CrossRef]
- Paudel, Samrat, Amol Dahal, and Hitesh Kumar Bhattarai. 2021. Temporal Analysis of SARS-CoV-2 Variants during the COVID-19 Pandemic in Nepal. COVID 1: 423–34. [Google Scholar] [CrossRef]
- Plyuhina, Аnastasiya Аlekseevna. 2020. Theoretical aspects of the concept of socio-economic model and its main elements. In XX Chayanov Readings, Paper presented at the Russian Economy: New Realities and Development Strategies. Collection of Articles, Moscow, Russian, 19 March 2020. Moscow: Russian State University for the Humanities, pp. 223–33. [Google Scholar]
- Population of the World: Data for 2022. 2022. Available online: https://migrantumir.com/naselenie-stran (accessed on 23 August 2022).
- Ramazanov, Zamal S. 2010. World socio-economic models and Russia. Proceedings of Tomsk Polytechnic University 316: 16–21. [Google Scholar]
- Salinas, Teresa, Magaly Tejada, Juan José Encinas, Seyyedmilad Talebzadehhosseini, and Iván Garibay. 2021. Evolution Scenarios and Mitigation Strategies for COVID-19 in Peru, from the Complexity Approach and Agent-Based Modeling. COVID 1: 528–45. [Google Scholar] [CrossRef]
- Schlickeiser, Reinhard, and Martin Kröger. 2022. Forecast of Omicron Wave Time Evolution. COVID 2: 216–29. [Google Scholar] [CrossRef]
- “Stringency Index” in the Fight against the Pandemic. 2022. Available online: https://cer.uz/en/post/publication/indeks-strogosti-v-borbe-s-pandemiej (accessed on 25 August 2022).
- Tang, Wenguang, Jian Hu, Geovanny Genaro Reivan Ortiz, Fatma Mabrouk, and Jinghuan Li. 2022. Research on the Impact of COVID-19 on Import and Export Strategies. Frontiers in Environmental Science 10: 891780. [Google Scholar] [CrossRef]
- Tcerkasevich, Larisa. 2019. Myths and Reality of the Swedish “People’s Home”. Sovremennaya Evropa = The Modern Europe 2: 163–74. [Google Scholar] [CrossRef]
- Teng, Bin, Sicong Wang, Yufeng Shi, Yunchuan Sun, Wei Wang, Wentao Hua, and Chaojun Shi. 2022. Economic recovery forecasts under impacts of COVID-19. Economic Modelling 110: 105821. [Google Scholar] [CrossRef] [PubMed]
- Teterina, Tatiana. 2015. The History of the Formation of Modern Economic System. Vestnik Universiteta 1: 111–15. [Google Scholar]
- Tsedilin, Leonid Ivanovich. 2019. Modern Model of Social and Economic Development of China: Identification and Analysis. Bulletin of the IE RAS 3: 126–36. [Google Scholar]
- Vasin, Sergey Mikhailovich. 2022. Sectoral Transformation of the Economic System during Crisis and Stable Growth Periods (A Case Study of the European Countries). Economies 10: 148. [Google Scholar] [CrossRef]
- World Bank Global Economic Monitor. 2022. Available online: https://public.knoema.com/qhpqgye/world-bank-global-economic-monitor (accessed on 16 August 2022).
- World Development Indicators (WDI). 2022. Available online: https://public.knoema.com/lftihvf/world-development-indicators-wdi (accessed on 16 August 2022).
- World Health Organization. 2020. WHO Announces COVID-19 Outbreak a Pandemic. Available online: https://www.euro.who.int/en/health-topics/health-emergencies/coronavirus-covid-19/news/news/2020/3/who-announces-covid-19-outbreak-a-pandemic/ (accessed on 20 April 2022).
- World Health Organization. 2022. Situation by Region, Country, Territory & Area. Available online: https://covid19.who.int/table (accessed on 23 August 2022).
- World Pandemic Uncertainty Index. 2022. Available online: https://public.knoema.com/djnmytf/world-pandemic-uncertainty-index (accessed on 27 August 2022).
Figure 1.
General government total expenditure in % of GDP. Source: (IMF 2022; Initial data are shown in Appendix A, Table A1).
Figure 1.
General government total expenditure in % of GDP. Source: (IMF 2022; Initial data are shown in Appendix A, Table A1).
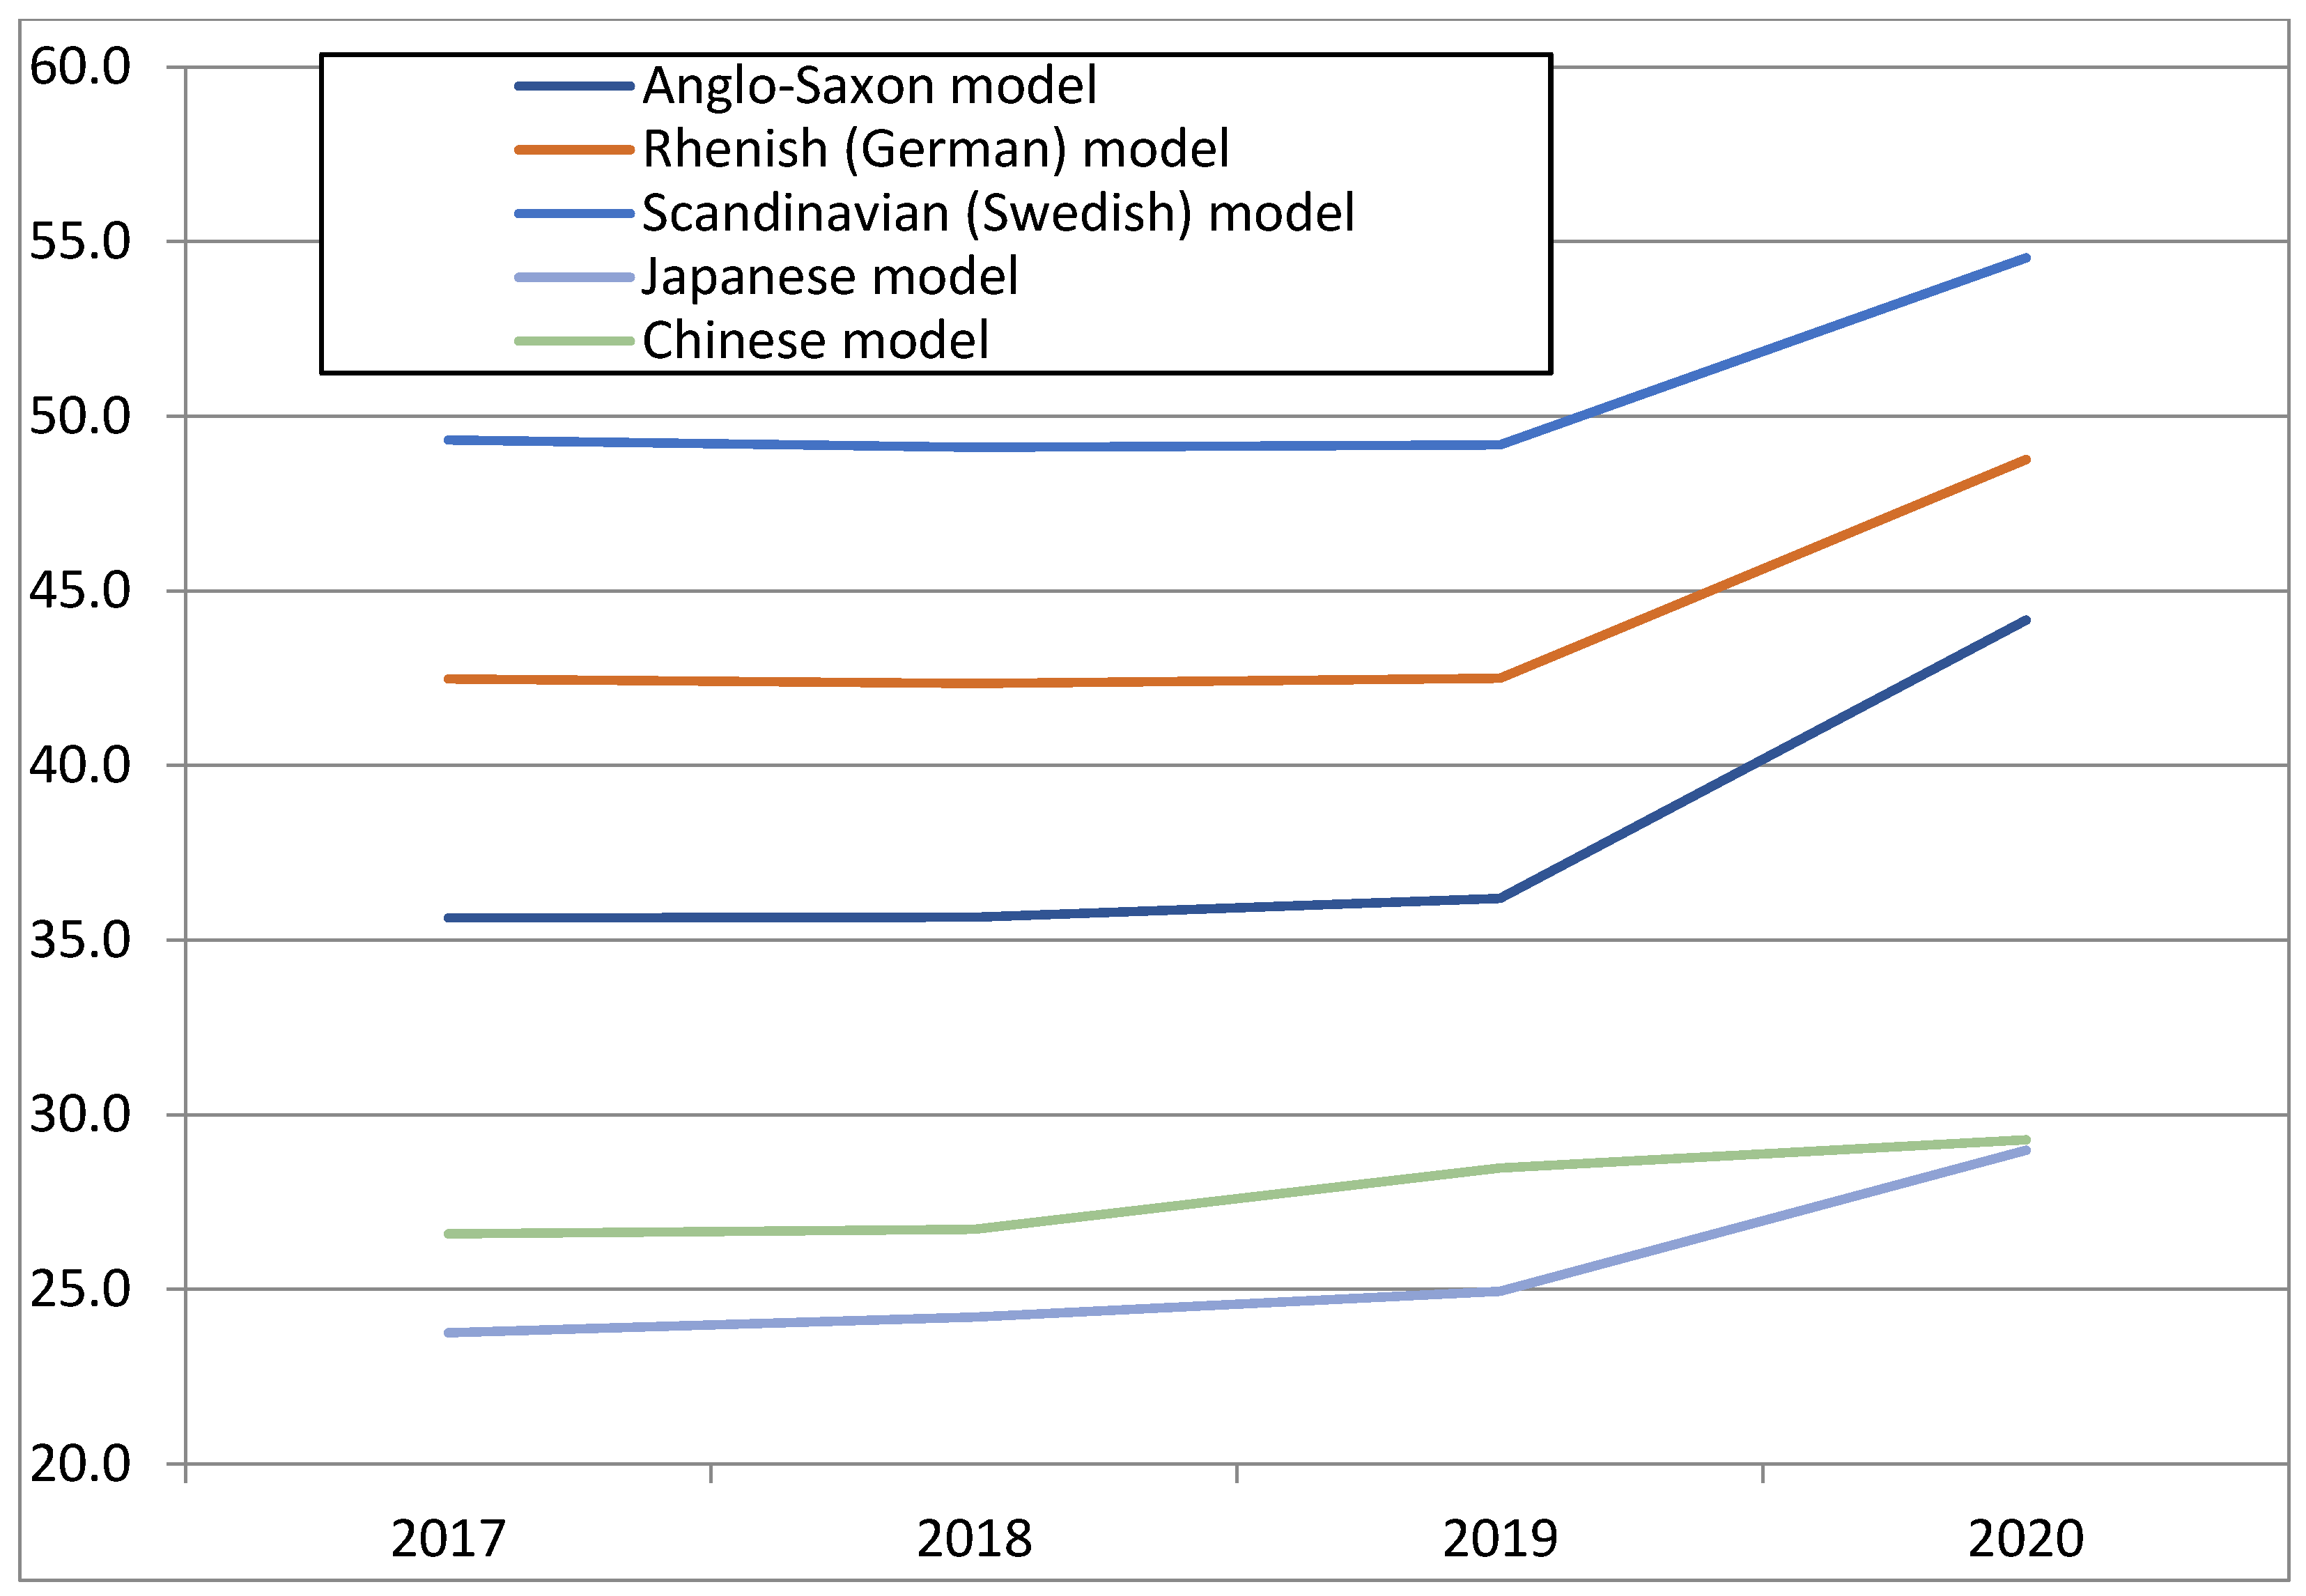
Figure 2.
Graphical relationship between the Stringency Index and the quarterly number of new cases per 1 million people. Source: (Data on COVID-19 2022; COVID-19 and Related Statistics 2022; Initial data are shown in Appendix B, Table A2 and Table A3).
Figure 2.
Graphical relationship between the Stringency Index and the quarterly number of new cases per 1 million people. Source: (Data on COVID-19 2022; COVID-19 and Related Statistics 2022; Initial data are shown in Appendix B, Table A2 and Table A3).
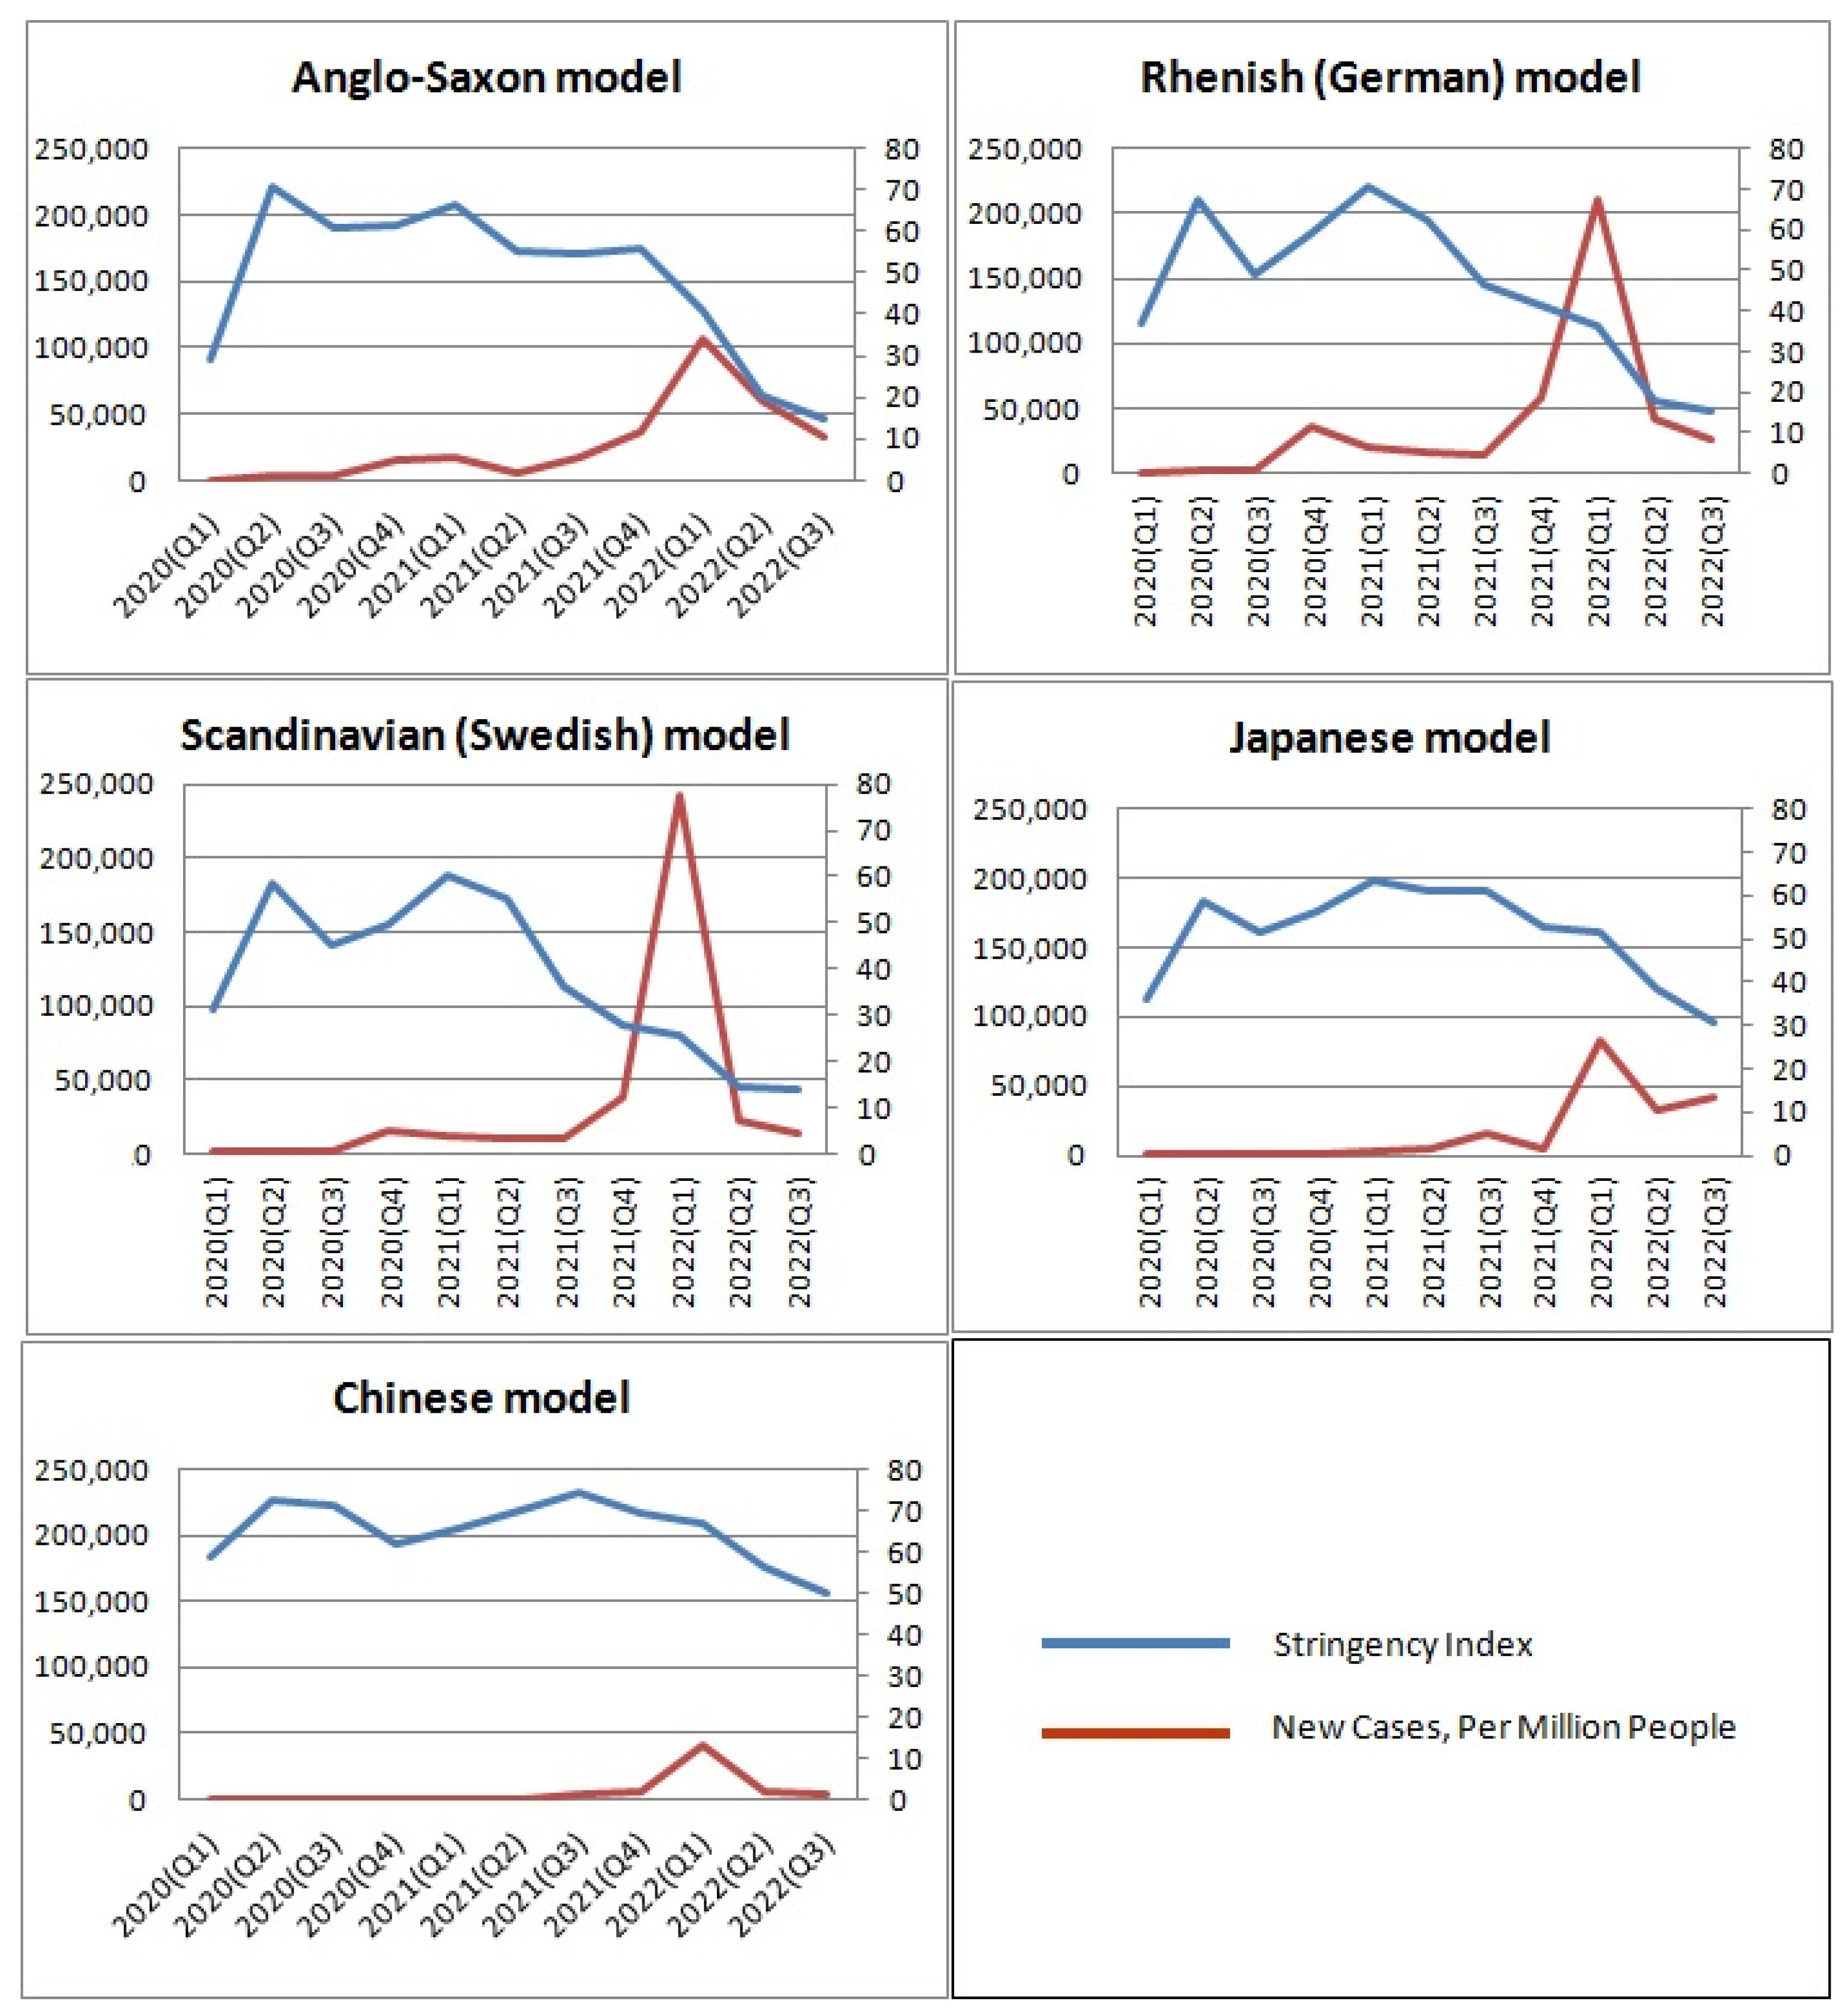
Figure 3.
New Cases, Per Million People. Source: (COVID-19 and Related Statistics 2022; Initial data are shown in Appendix B, Table A3).
Figure 3.
New Cases, Per Million People. Source: (COVID-19 and Related Statistics 2022; Initial data are shown in Appendix B, Table A3).
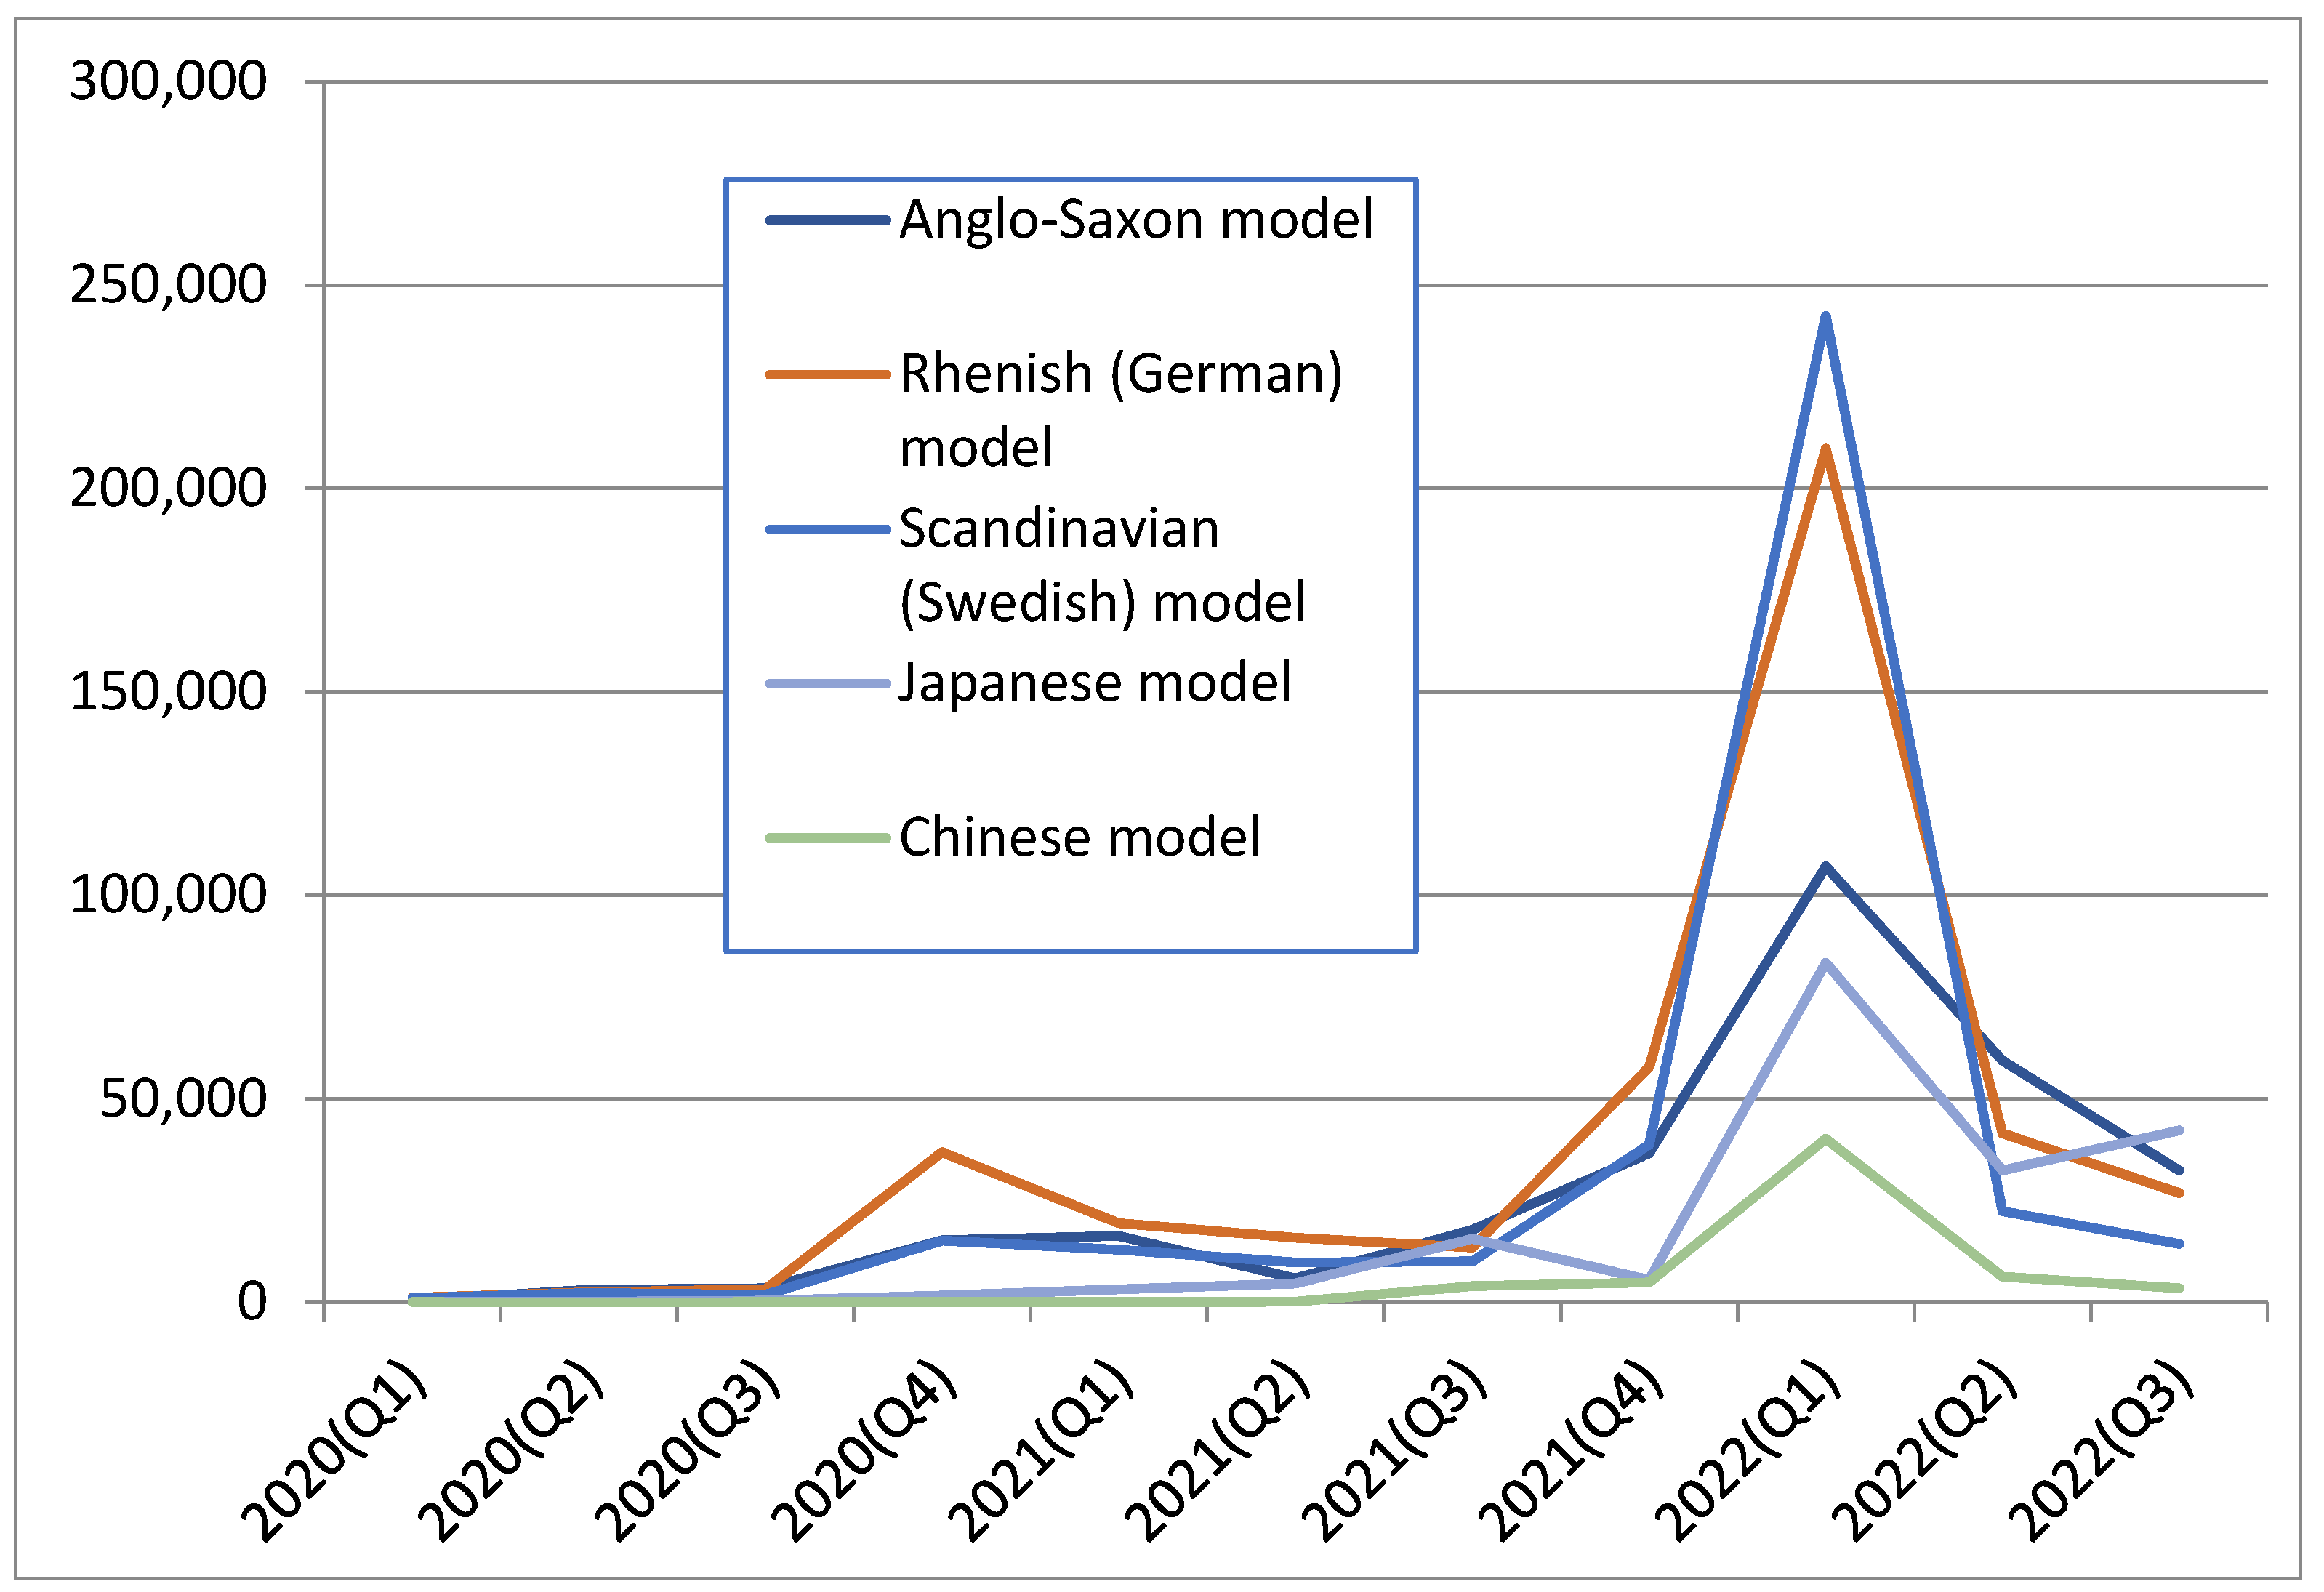
Figure 4.
Stringency Index. Source: (Data on COVID-19 2022; Initial data are shown in Appendix B, Table A2).
Figure 4.
Stringency Index. Source: (Data on COVID-19 2022; Initial data are shown in Appendix B, Table A2).
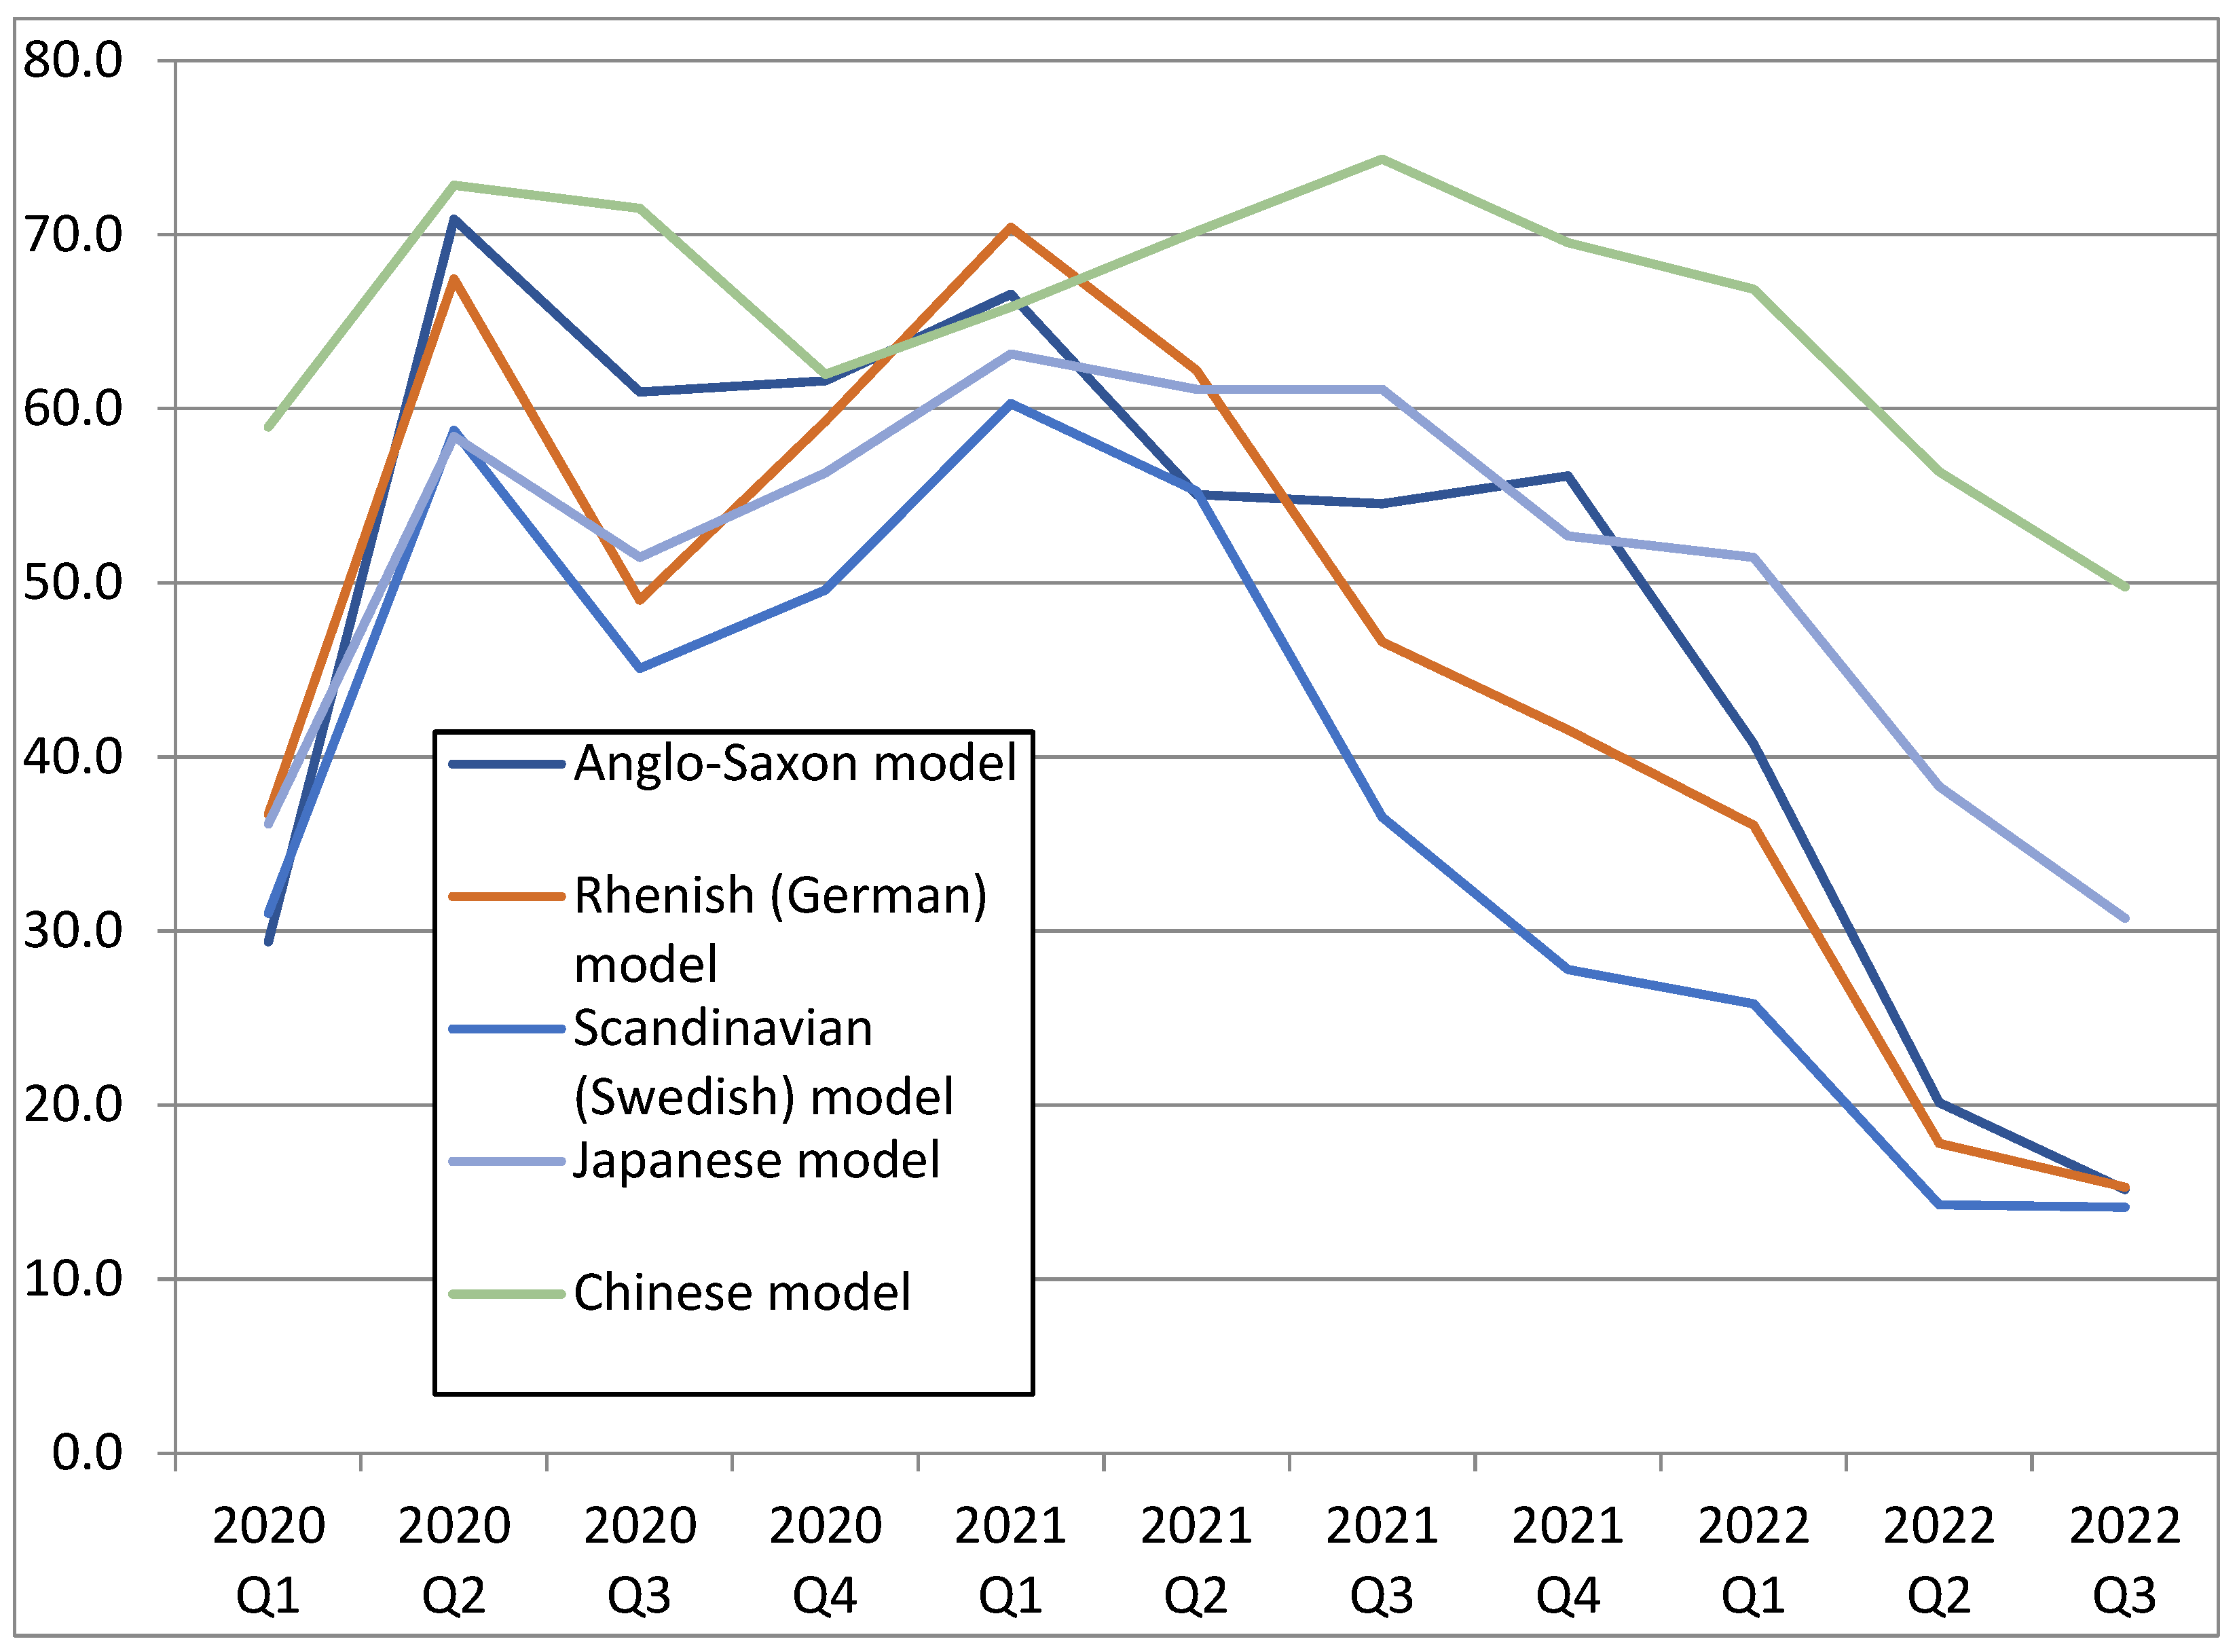
Figure 5.
World Pandemic Uncertainty Index. Source: (World Pandemic Uncertainty Index 2022).
Figure 5.
World Pandemic Uncertainty Index. Source: (World Pandemic Uncertainty Index 2022).
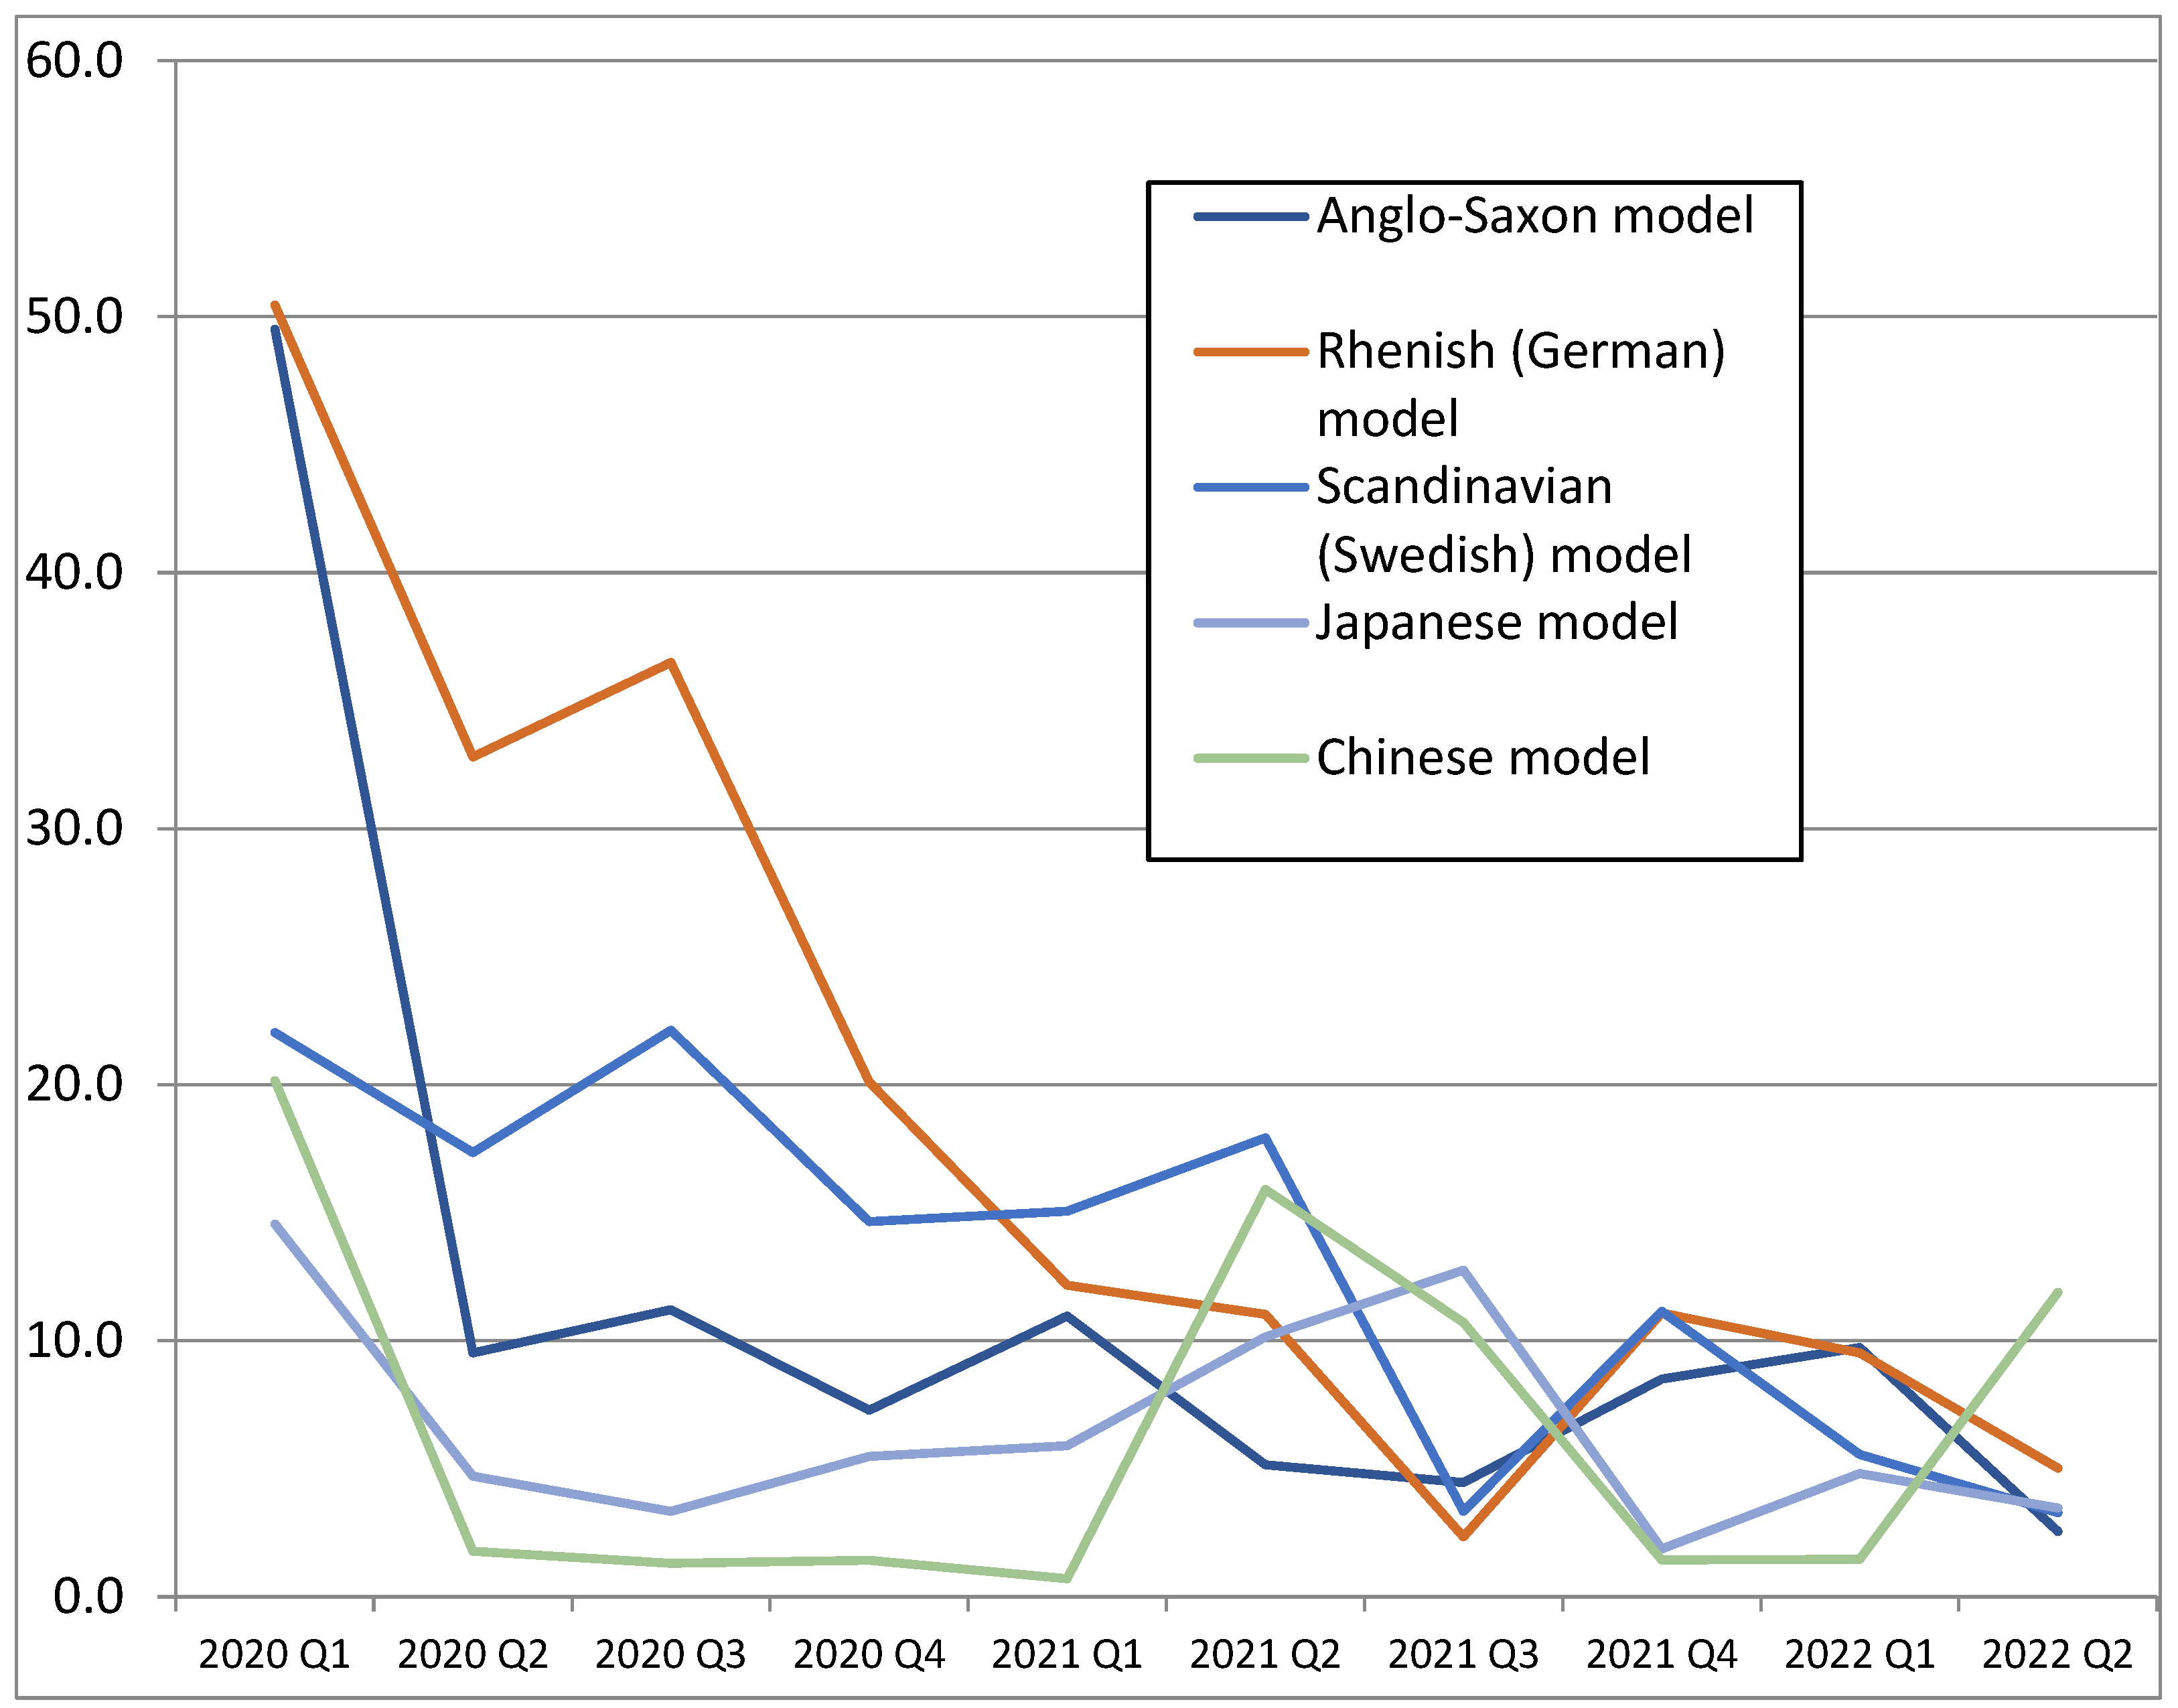
Figure 6.
Communications, computer, etc. in % of service exports (left) and Communications, computer, etc., as a percentage of service imports (right). Source: (World Development Indicators 2022; Initial data are shown in Appendix D, Table A5 and Table A6).
Figure 6.
Communications, computer, etc. in % of service exports (left) and Communications, computer, etc., as a percentage of service imports (right). Source: (World Development Indicators 2022; Initial data are shown in Appendix D, Table A5 and Table A6).
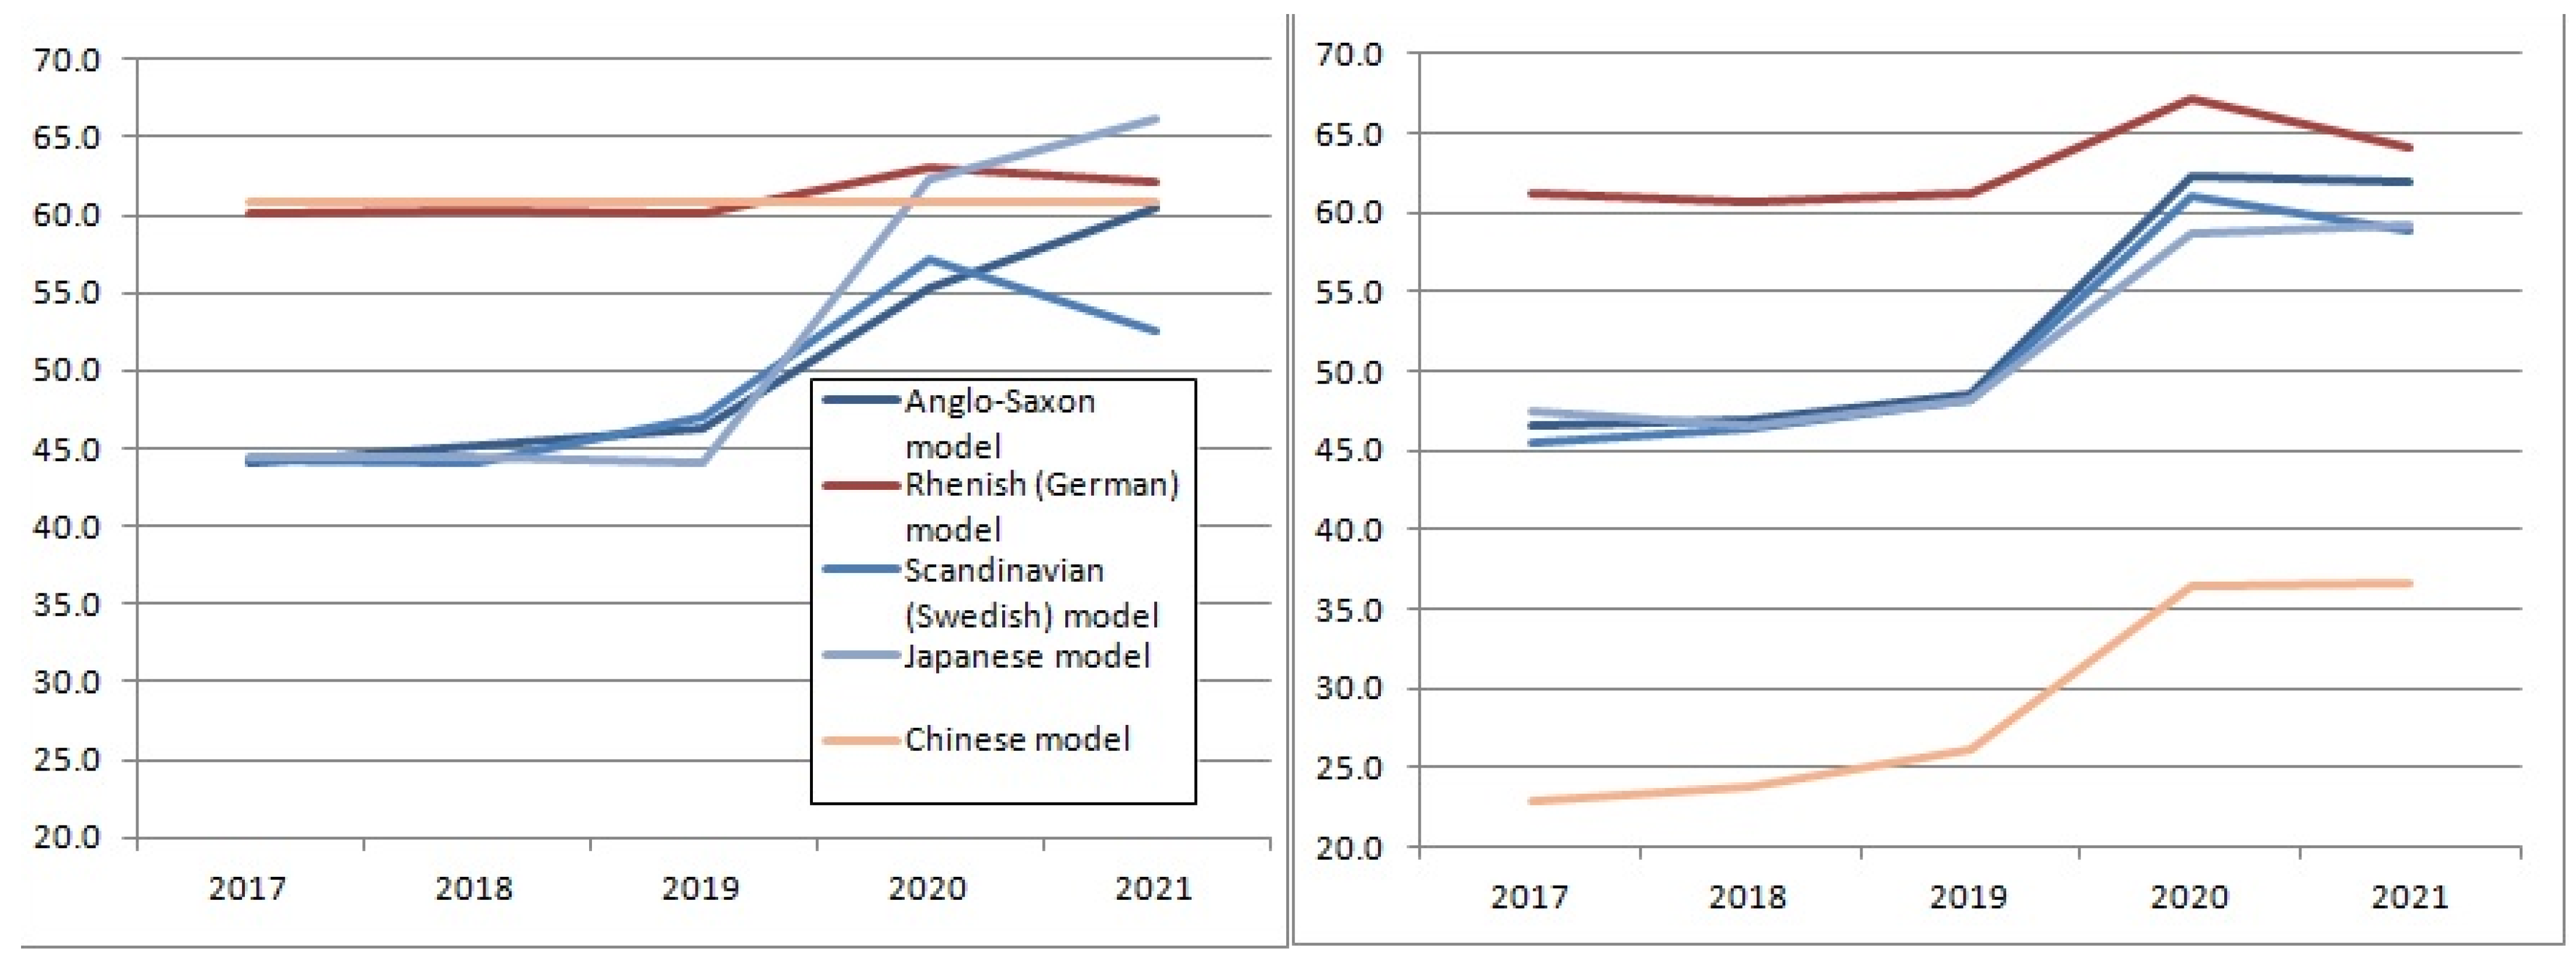
Table 1.
COVID-19 statistics. (Source: Population of the World: Data for 2022; World Health Organization 2022).
Table 1.
COVID-19 statistics. (Source: Population of the World: Data for 2022; World Health Organization 2022).
| Model | 1. Anglo-Saxon Model (UK and US Data) | 2. Rhenish (German) Model (Data for Germany) | 3. Scandinavian (Swedish) Model (Data for Sweden) | 4. Japanese Model (Data for Japan) | 5. Chinese Model (Data for China) | ||
|---|---|---|---|---|---|---|---|
| Data | |||||||
| Population, people. | 68,329,385 | 333,666,025 | 83,727,972 | 10,189,848 | 126,449,787 | 1,447,364,028 | |
| Total cases of diseases, number/% of population | 23,461,939/34.3 | 92,364,392/27.7 | 31,868,639/38.1 | 2,558,943/25.1 | 17,325,025/13.7 | 6,163,563/0.43 | |
| Mortality, number/% of the number of cases | 187,018/0.8 | 1,029,936/0.31 | 146,650/0.46 | 19,682/0.78 | 37,304/0.22 | 24,499/0.4 | |
Table 2.
Correlation between the emergence of new COVID-19 cases in countries with different socioeconomic models. (number of new cases per 1 million people, the arithmetic mean of the most characteristic countries representing the model, quarterly from 2020 to 2022).
Table 2.
Correlation between the emergence of new COVID-19 cases in countries with different socioeconomic models. (number of new cases per 1 million people, the arithmetic mean of the most characteristic countries representing the model, quarterly from 2020 to 2022).
| Anglo-Saxon Model | Rhenish (German) Model | Scandinavian (Swedish) Model | Japanese Model | Chinese Model | |
|---|---|---|---|---|---|
| Anglo-Saxon model | 1.000000 | 0.925214 (p = 0.000045) | 0.886353 (p = 0.000279) | 0.920335 (p = 0.000059) | 0.914395 (p = 0.000081) |
| Rhenish (German) model | 0.925214 (p = 0.000045) | 1.000000 | 0.986969 (p = 0.000000) | 0.858010 (p = 0.000728) | 0.974330 (p = 0.000000) |
| Scandinavian (Swedish) model | 0.886353 (p = 0.000279) | 0.986969 (p = 0.000000) | 1.000000 | 0.854415 (p = 0.00081) | 0.989803 (p = 0.000000) |
| Japanese model | 0.920335 (p = 0.000059) | 0.858010 (p = 0.000728) | 0.854415 (p = 0.00081) | 1.000000 | 0.900051 (p = 0.000160) |
| Chinese model | 0.914395 (p = 0.000081) | 0.974330 (p = 0.000000) | 0.989803 (p = 0.000000) | 0.900051 (p = 0.000160) | 1.000000 |
Source: (COVID-19 and Related Statistics 2022; Initial data are shown in Appendix B, Table A3).
Table 3.
Correlation between new COVID-19 deaths in countries with different socioeconomic models. (number of new deaths per 1 million people, the arithmetic mean of the most characteristic countries representing the model, quarterly from 2020 to 2022).
Table 3.
Correlation between new COVID-19 deaths in countries with different socioeconomic models. (number of new deaths per 1 million people, the arithmetic mean of the most characteristic countries representing the model, quarterly from 2020 to 2022).
| Anglo-Saxon Model | Rhenish (German) Model | Scandinavian (Swedish) Model | Japanese Model | Chinese Model | |
|---|---|---|---|---|---|
| Anglo-Saxon model | 1.000000 | 0.760472 (p = 0.006585) | 0.704784 (p = 0.015440) | −0.102443 (p = 0.764389) | −0.103983 (p = 0.760935) |
| Rhenish (German) model | 0.760472 (p = 0.006585) | 1.000000 | 0.402162 (p = 0.220144) | -0.284801 (p = 0.395963) | -0.235334 (p = 0.486052) |
| Scandinavian (Swedish) model | 0.704784 (p = 0.015440) | 0.402162 (p = 0.220144) | 1.000000 | −0.027743 (p = 0.935467) | −0.034043 (p = 0.920847) |
| Japanese model | −0.102443 (p = 0.764389) | −0.284801 (p = 0.395963) | −0.027743 (p = 0.935467) | 1.000000 | 0.861479 (p = 0.000654) |
| Chinese model | −0.103983 (p = 0.760935) | −0.235334 (p = 0.486052) | −0.034043 (p = 0.920847) | 0.861479 (p = 0.000654) | 1.000000 |
Source: (COVID-19 and Related Statistics 2022; Initial data are shown in Appendix C, Table A4).
Table 4.
Correlation between the Stringency Index changes in countries with different socioeconomic models (arithmetic mean of the most characteristic countries representing the model, quarterly from 2020 to 2022).
Table 4.
Correlation between the Stringency Index changes in countries with different socioeconomic models (arithmetic mean of the most characteristic countries representing the model, quarterly from 2020 to 2022).
| Anglo-Saxon Model | Rhenish (German) Model | Scandinavian (Swedish) Model | Japanese Model | Chinese Model | |
|---|---|---|---|---|---|
| Anglo-Saxon model | 1.000000 | 0.928787 (p = 0.000036) | 0.880180 (p = 0.00035) | 0.906539 (p = 0.000119) | 0.824664 (p = 0.001787) |
| Rhenish (German) model | 0.928787 (p = 0.000036) | 1.000000 | 0.982387 (p = 0.000000) | 0.875780 (p = 0.000409) | 0.689870 (p = 0.018816) |
| Scandinavian (Swedish) model | 0.880180 (p = 0.00035) | 0.982387 (p = 0.000000) | 1.000000 | 0.809203 (p = 0.002552) | 0.622197 (p = 0.040937) |
| Japanese model | 0.906539 (p = 0.000119) | 0.875780 (p = 0.000409) | 0.809203 (p = 0.002552) | 1.000000 | 0.840277 (p = 0.001203) |
| Chinese model | 0.824664 (p = 0.001787) | 0.689870 (p = 0.018816) | 0.622197 (p = 0.040937) | 0.840277 (p = 0.001203) | 1.000000 |
Source: (Data on COVID-19 2022; Initial data are shown in Appendix B, Table A2).
Table 5.
Correlation between the dynamics of the World Pandemic Uncertainty Index in countries belonging to different socioeconomic models (arithmetic mean of the most characteristic countries representing the model, (quarterly from 2020 to 2022).
Table 5.
Correlation between the dynamics of the World Pandemic Uncertainty Index in countries belonging to different socioeconomic models (arithmetic mean of the most characteristic countries representing the model, (quarterly from 2020 to 2022).
| Anglo-Saxon Model | Rhenish (German) Model | Scandinavian (Swedish) Model | Japanese Model | Chinese Model | |
|---|---|---|---|---|---|
| Anglo-Saxon model | 1.000000 | 0.781554 (p = 0.007581) | 0.534053 (p = 0.111809) | 0.558595 (p = 0.093271) | 0.494488 (p = 0.146257) |
| Rhenish (German) model | 0.781554 (p = 0.007581) | 1.000000 | 0.823845 (p = 0.003386) | 0.227231 (p = 0.527812) | 0.168962 (p = 0.640767) |
| Scandinavian (Swedish) model | 0.534053 (p = 0.111809) | 0.823845 (p = 0.003386) | 1.000000 | 0.146814 (p = 0.685679) | 0.073814 (p = 0.839409) |
| Japanese model | 0.558595 (p = 0.093271) | 0.227231 (p = 0.527812) | 0.146814 (p = 0.685679) | 1.000000 | 0.780222 (p = 0.007754) |
| Chinese model | 0.494488 (p = 0.145257) | 0.168962 (p = 0.640767) | 0.073814 (p = 0.839409) | 0.780222 (p = 0.007754) | 1.000000 |
Source: (World Pandemic Uncertainty Index 2022).
Table 6.
Correlation between Stringency and Uncertainty indices and some economic indicators of socioeconomic models.
Table 6.
Correlation between Stringency and Uncertainty indices and some economic indicators of socioeconomic models.
| Anglo-Saxon Model | Rhenish (German) Model | Scandinavian (Swedish) Model | Japanese Model | Chinese Model | |
|---|---|---|---|---|---|
| Exports merchandise, customs in current prices and Stringency Index | −0.673525 (p = 0.032756) | −0.508312 (p = 0.133570) | −0.701661 (p = 0.023728) | −0.110885 (p = 0.760399) | −0.001509 (p = 0.996699) |
| Exports merchandise, customs in current prices and World Pandemic Uncertainty Index | −0.284511 (p = 0.425611) | −0.790548 (p = 0.006483) | −0.814360 (p = 0.004126) | −0.107848 (p = 0.766806) | −0.223653 (p = 0.534505) |
| Import merchandise, customs in current prices and World Pandemic Uncertainty Index | −0.417379 (p = 0.230100) | −0.784667 (p = 0.007187) | −0.765969 (p = 0.009786) | −0.153315 (p = 0.672396) | 0.021100 (p = 0.953865) |
| World Pandemic Uncertainty Index and Stock market index calculated in US dollars (Jan. 2000 = 100) | −0.422843 (p = 0.223425) | −0.798651 (p = 0.005595) | −0.661625 (p = 0.037191) | −0.013367 (p = 0.970765) | −0.055899 (p = 0.878102) |
Publisher’s Note: MDPI stays neutral with regard to jurisdictional claims in published maps and institutional affiliations. |
© 2022 by the author. Licensee MDPI, Basel, Switzerland. This article is an open access article distributed under the terms and conditions of the Creative Commons Attribution (CC BY) license (https://creativecommons.org/licenses/by/4.0/).
Share and Cite
MDPI and ACS Style
Vasin, S.M. Comparative Analysis of Socioeconomic Models in COVID-19 Pandemic. Economies 2022, 10, 278. https://doi.org/10.3390/economies10110278
AMA Style
Vasin SM. Comparative Analysis of Socioeconomic Models in COVID-19 Pandemic. Economies. 2022; 10(11):278. https://doi.org/10.3390/economies10110278
Chicago/Turabian StyleVasin, Sergey Mikhailovich. 2022. "Comparative Analysis of Socioeconomic Models in COVID-19 Pandemic" Economies 10, no. 11: 278. https://doi.org/10.3390/economies10110278
Note that from the first issue of 2016, this journal uses article numbers instead of page numbers. See further details here.