Internet of Energy Training through Remote Laboratory Demonstrator


1
Faculty of Engineering, International Telematic University UNINETTUNO, 00186 Roma, Italy
2
Istituto Motori, National Research Council of Italy, Via G. Marconi 4, 80125 Naples, Italy
*
Author to whom correspondence should be addressed.
Technologies 2019, 7(3), 47; https://doi.org/10.3390/technologies7030047
Submission received: 15 May 2019
/
Revised: 17 June 2019
/
Accepted: 26 June 2019
/
Published: 27 June 2019
(This article belongs to the Special Issue Technology Advances on IoT Learning and Teaching)
Abstract
:In this paper, a new learning tool is proposed to train professional figures, such as entrepreneurs, engineers, and technicians, who need to improve their skills in the field of Internet of Energy. The proposed tool aims to cover the lack of experimental knowledge on new energy systems and to layer proper skills, which are useful to deal with challenges required by smart energy management in the new complex distributed configuration of the electric power systems, characterized by demand response services. This tool is based on a small-scale laboratory demonstrator, representative of a smart rural house, equipped with a measurement and control system. This demonstrator can be remotely accessed, through web server applications based on a low cost single-board computer. Trainers can have direct experience on the main concepts related to smart grids, renewable energy sources, electrochemical storage systems, and electric vehicles, through the use of the proposed tool managed by the web software interface.
1. Introduction
At the end of the last century, the typical scheme of an electric power system was based on a unidirectional power flow coming from a small number of high power electric plants, mainly fed by fossil fuels, transferring power through transmission and then distribution networks until the consumers were reached. The continuous growth of the world energy demand (the U.S. Energy Information Administration estimates that world net electricity generation will increase by 45% between 2015 and 2040 [1]) and the need of more environmentally-sustainable and resilient energy networks has encouraged the development of several technological advances that are quickly changing the scenario of energy systems [2].
1.1. The Internet of Energy Scenario
The energy scenario described above has changed with the wide diffusion of small scale distributed renewable power plants and then the advent of “prosumers”, i.e., entities in the network that in some conditions operate as producers and in other conditions as consumers. Storage systems have increased the network resilience and flexibility, but also its complexity. Smart grids and microgrids are creating small clusters of networks that often operate with independent control roles with respect to the global network [3]. New actors, such as energy system aggregators, are able to act as intermediate players among the costumers and the producers [4]. The same concept of consumers is evolving, due to the diffusion of smart devices that can be controlled and managed to improve the performances of the power system [5]. In addition, electric vehicles are expected to become consumers of large quantities of energy in the next future. All these technological changes have widely evolved the level of complexity of modern power networks.
In addition, digital transformation considers the energy sector as one of its favorite targets. The wide availability of low cost smart sensors allows gathering huge quantities of data that can be analyzed and cross-correlated by means of big data techniques, and then used to define new management strategies and new business policies [6]. Grid operators have much more information to forecast, optimize and control the energy systems in real time and at a large scale. Customers can join tiered and dynamic price policies, as it usually happens in the telecommunication sector. Forecast algorithms can schedule the recharge of electric vehicles at off-pick times. Intelligent objects can autonomously perform financial transactions, secured through blockchain technologies, on energy and data. The energy economy is shifting from a power economy to a data and power economy, with new opportunities for consumers, providers and generators.
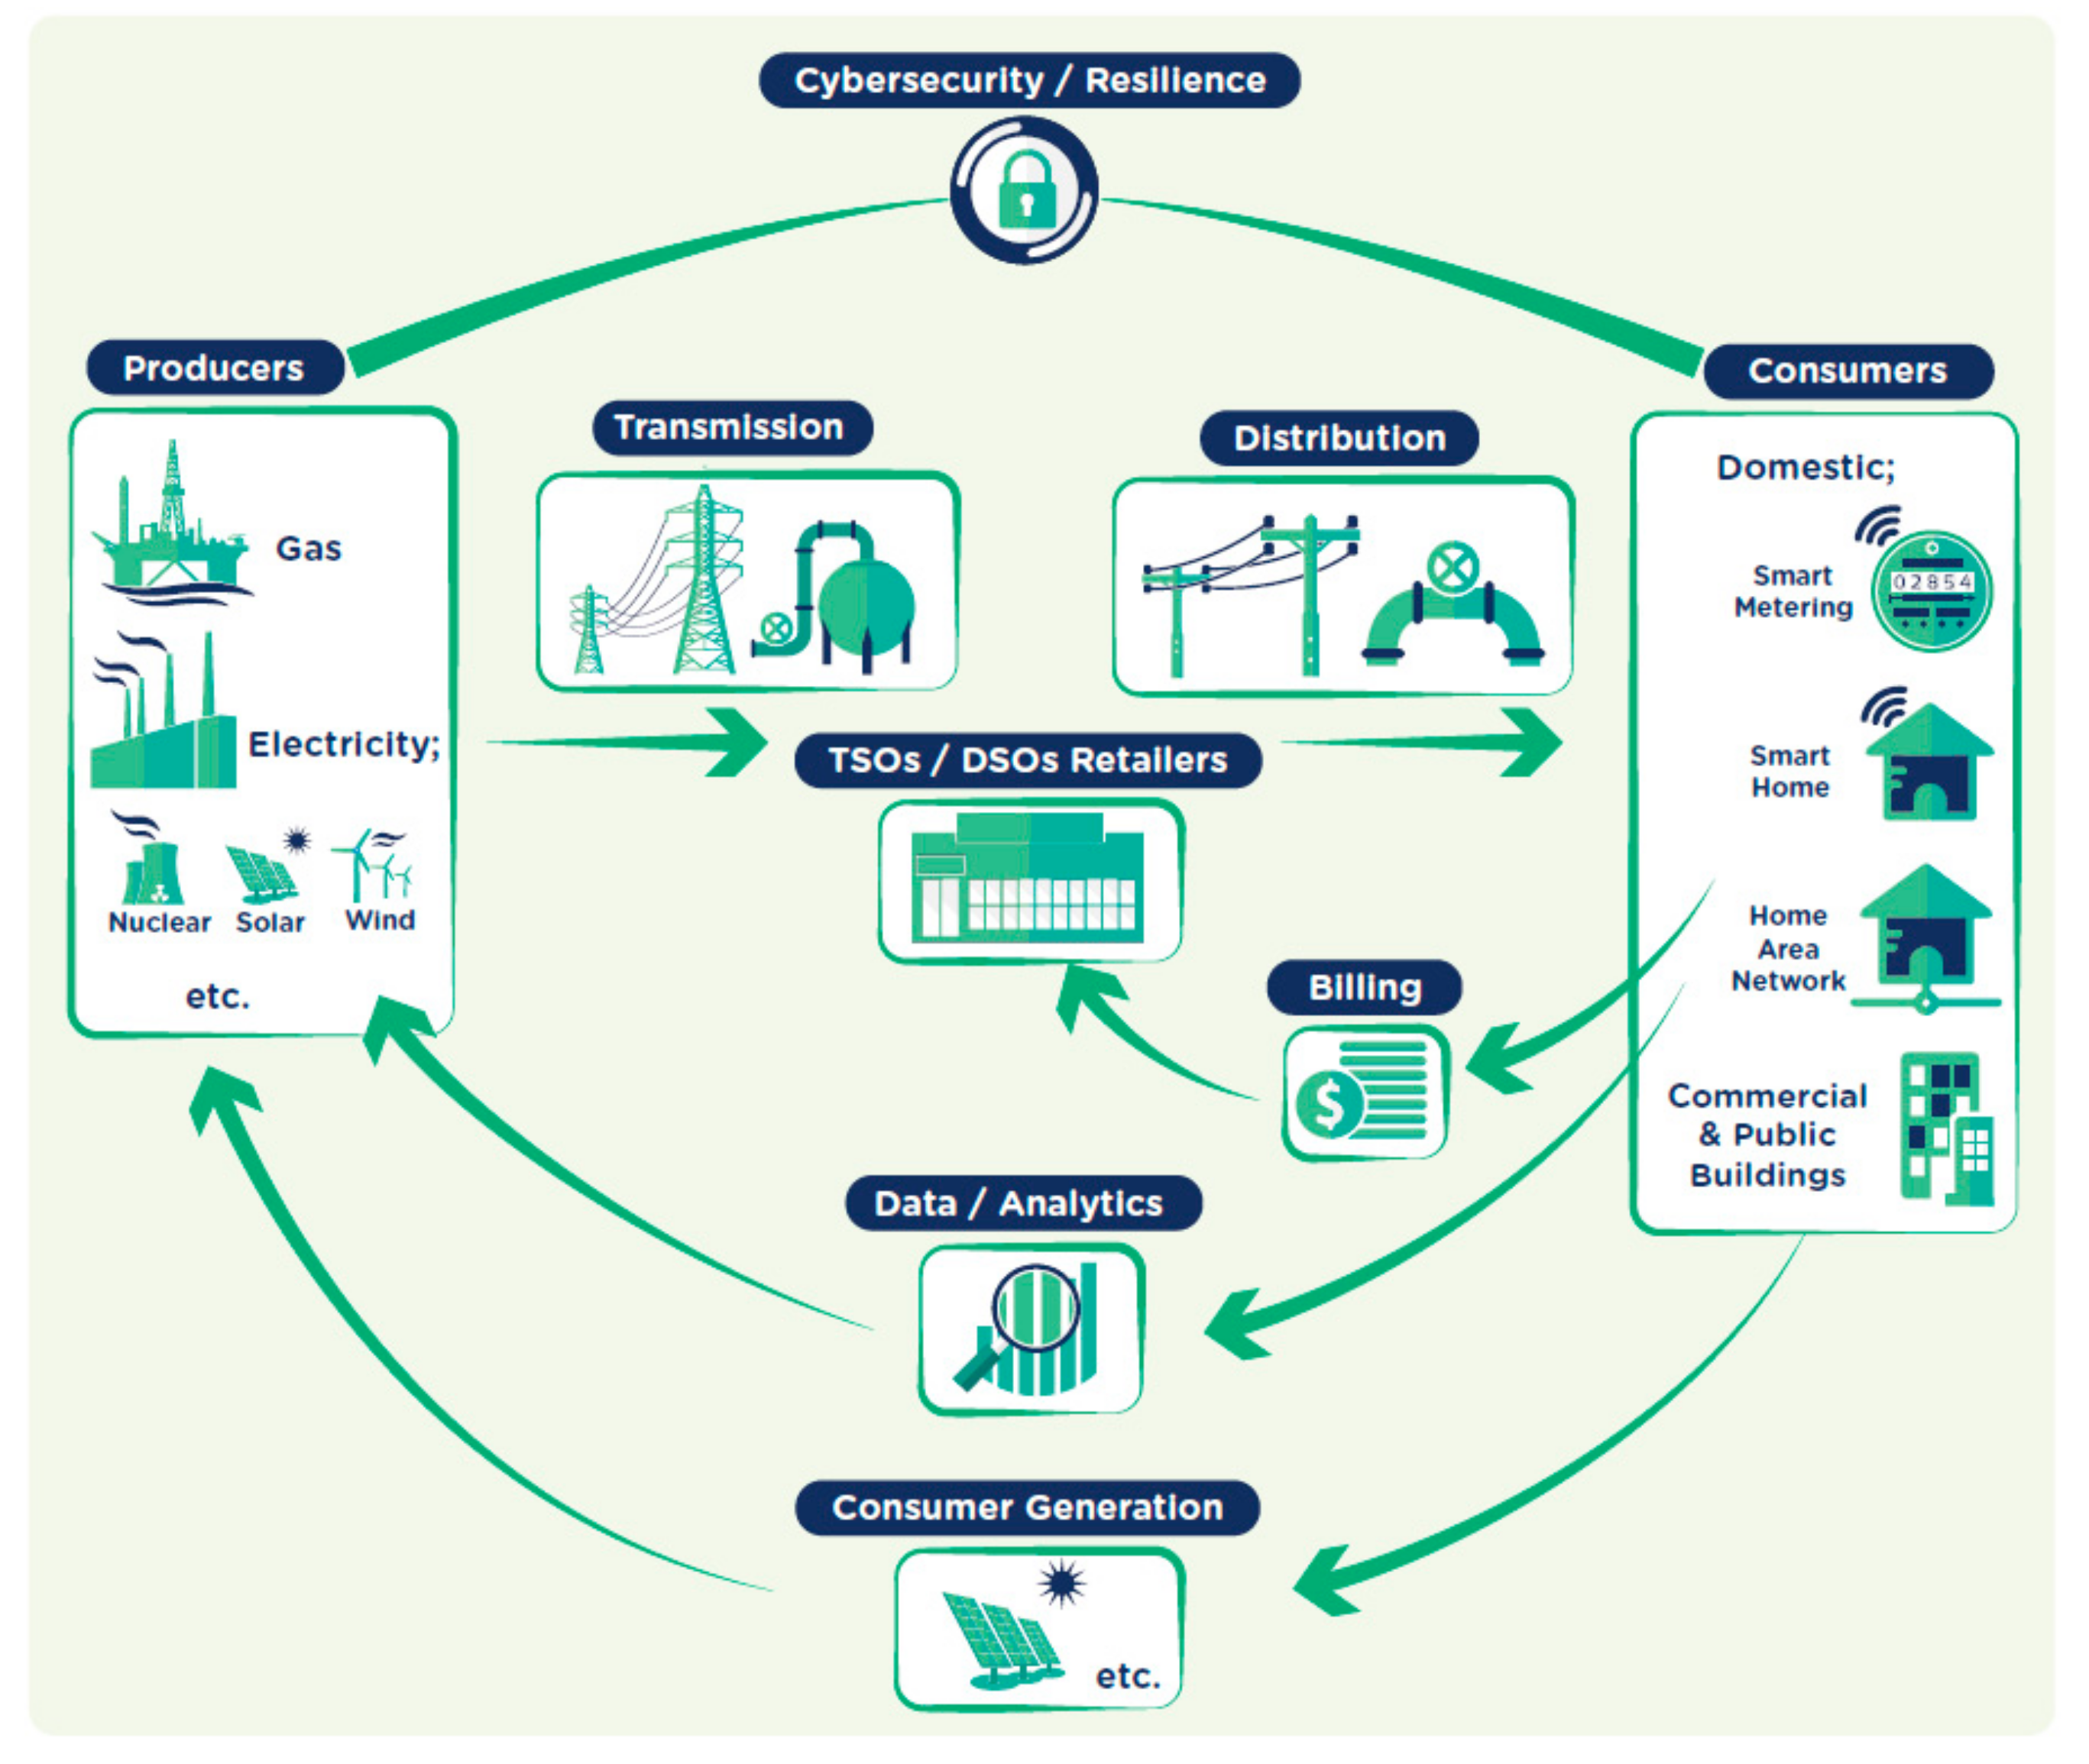
The process of “smartization” of devices (smart energy equipment, smart energy storage), networks (smart grids), and monitoring systems (smart energy meter) is leading to the so-called “Internet of Energy” (IoE) [7,8]. The modern “energy supply chain”, as represented in Figure 1, is based on a bidirectional flow of power from producers to consumers and vice-versa, fully integrated in a continuous stream of data allowing a full control and monitoring of the system.
This new scenario is also bringing new treats in the energy sector. Smart objects, due to their constructive simplicity, have proved to be very vulnerable to cyberattacks and even more targeted by cybercrime. In 2014, smart fridges have been hacked to realize attacks with email spamming and a Hewlett-Packard study has revealed that ~70% of smart devices have at least one vulnerability [9]. Therefore, cybersecurity is a key aspect to ensure the network reliability and resilience. Real time data collection in growing grids implies the synchronization of an incremental number of measurement devices. The continuous evolution of the new ICT technologies applied to energy systems requires a fast adaptation of protocols and standards. Last but not least, the share of large amount of data in the web generates consumers’ concerns about the privacy of the data.
In this context, the IoE ecosystem has expanded and embraced new sectors from energy consumers to traditional and renewable energy systems, wherever data can be acquired or controlled via the network. In particular, in the IoE concept, the main grid is considered as a network of interconnected objects with embedded “intelligent” ICT devices, with capability of real-time data acquisition and power flow control. In addition, these devices are devoted to transfer information in a reliable and secure way towards a large number of distributed energy management systems, through a proper communication infrastructure, on the base of the existing internet standards [10].
With the above architecture the electric grid can be divided in AC or DC microgrids, which include, in a restricted geographical area, traditional power plants, distributed renewable energy sources, stationary energy storage systems, and plug-in electric vehicles. The concept of a microgrid in the IoE architecture can be seen as equivalent to the concept of LAN in the internet architecture. In fact, the management and control of each microgrid is performed through external entities, which are called energy routers [11,12]. From the electric point of view, the energy router consists in a solid-state transformer (SST), which is obtained through the use of bidirectional power converters. In addition, these devices are equipped with smart ICT control & communication modules, able to optimize power generation and demand, within the controlled microgrid, and transmit information towards other routers or control systems of higher hierarchical level. In this scenario, the main actors within the microgrid are represented by renewable energy sources, energy storage devices and active loads, such as plug-in electric vehicles. The integration of the above components with the microgrid can be conveniently performed by means of plug & play interfaces, which work similarly to USB interfaces for the connection between external hardware and personal computers. The IoE plug & play interface is composed of either DC/DC or DC/AC bidirectional power converters, as both DC and AC microgrids can be considered. Each interface is equipped with a communication module based on standard protocols, which allows device identification (e.g., solar power plant, PEV, etc.) and the information exchange between the connected device and the energy router. In this way, on the basis of the main requirements of the grid system operator, energy routers can interact with each component of the microgrid, during their different operative conditions, such as: PEV slow/fast charging operations, Vehicle to Grid (V2G) operations and load leveling and peak shaving operations through the use of stationary energy storage systems.
1.2. Training Needs in the IoE Scenario
All these innovations are disrupting old business models and job figures and creating new ones. According to a recent World Economic Forum analysis, among the top 10 most requested jobs in 2022 there will be the Digital Transformation Specialists and the New Technology Specialist [13]. With specific reference to the energy sector, all the companies suddenly found they need(ed) data analysts, while meter readers’ jobs are disappearing due to the advent of automatic energy meters, online and operating in real time. This requires the training of new professionals able to develop, adopt or manage IoE technologies. In order to satisfy this labor market need, new training programs and new methodologies are required. In particular, training activities on advanced technological aspects cannot just rely on theoretical contents, but must include practical or experimental activities [14].
In the framework of the Erasmus+ program, the IoE-EQ (Internet of Energy—Education and Qualification) project has been funded, with the aims of raising awareness about the benefits of the digital transformation in the energy sector. The main activity of this project is the realization of a set of training courses, fully available at distance, on topics of interest in the energy sector such as smart metering, renewable energy systems and smart cities. A strength point of the courses is the integration of theoretical concepts (video lessons and text materials) with real examples of IoE applications (webinars taken by experts) and practical activities (virtual and remote labs). In particular, one of the side goals of the project is the realization of a set of virtual and remote labs intended to be didactic demonstrators for the use of IoE technologies. Such a solution combines the need to let practical environments available to the students and be compliant with constrains of costs, time and space. In fact, especially in the energy sector, laboratories may be expensive, may require a continuous maintenance and the need to realize in-presence supervised didactic activities, due to safety constrains.
Virtual and remote labs allow learners to perform simulated experimental activities, without requiring hardware for the experiments [15]. They are a valuable solution to save money both for the hardware purchase and maintenance. They also allow to involve an audience much wider that the one that can be involved in real experiments. However, being the experiments not real, the quality of the didactic experience relies on the quality of the implemented models. Recently, the possibility to use virtual reality or augmented reality in virtual labs has highly enhanced the quality of the potential didactic experience. Moreover, remote labs have the advantage, with respect to virtual labs, to allow the learners to control real experiments at distance [16,17,18,19,20]. The students have then to deal with the repeatability and the uncertainty of the measurements, the real behavior of the components and the effect that the surrounding environmental conditions can have on the experience. These aspects are of course absent in virtual labs and make the experience much close to one in presence. On the other hand, higher costs have to be faced and problems occur in the concurrent use of the equipment. Therefore, in conclusion, nowadays virtual and remote labs are considered efficient solutions in STEM education to allow students acquiring practical skills.
This paper illustrates the design and implementation of a small scale demonstrator for training activities in the field of Internet of Energy. The proposed experiment implements a small scale smart grid with several real components and functionalities.
The remainder of the paper is organized as it follows. In Section 2, the proposed demonstrator is described, with a detailed analysis on the main components of a smart microgrid application. Then, in Section 3, didactical experiences are presented in order to highlight the experimental learning possibilities offered by the demonstrator. Finally, conclusions and future developments are discussed.
2. Remote Laboratory on Microgrid
Research activities related to various subjects in the field of Internet of Energy can be carried out in experimental research laboratories based on 1:1 scale test benches. An example of the above test benches and their capabilities to be used for specific training activities of engineers have been widely discussed in [21], with reference to the laboratory facilities available in the Istituto Motori of the National Research Council of Italy. When these facilities are used for educational training courses, an important aspect to be considered consists in the safety risks involved by high voltage/current levels and high capacity/power lithium battery packs. For this reason, local training activities on the above components need to be always supervised by qualified staff. On the other hand, online training activities, carried out by means of web interactions, require additional measures to allow the prompt intervention of qualified staff in case of safety issues, which can be caused by remote users not physically located near the components under test. It is clear that the management of such a complex training system requires relevant efforts in terms of safety insurance, cost and time.
The above issues can be properly addressed through the use of small-scale demonstrators, based on the same working principles of the real-scale components. These demonstrators can be specifically designed for didactical purposes and are generally characterized by voltage, current and power values which are not considered dangerous for the operators.
On the basis of the above considerations, a small-scale smart microgrid has been realized in the laboratories of the Istituto Motori, in order to support training activities of engineers, in the field of Internet of Energy, through local and remote interactions with its main components. In particular, the demonstrator is representative of a smart rural house, configured as an islanded microgrid, which integrates domestic loads, electric mobility, stationary storage systems and renewable energy generation sources. A picture (a) of the considered microgrid with its functional scheme (b) is reported in Figure 2.
The didactic demonstrator has been physically realized by means of wood panels and synthetic grass, in order to both reduce costs and obtain an appearance similar to a rural-domestic microgrid. The loads and sources can be activated through the use of either front panel switches or remotely controlled relays. The energy used to supply DC loads comes from a PV generation system, composed of two solar panels, with a rated power of 5 W, and a wind turbine, with a rated power of ~10 W. The two solar panels are electrically connected in parallel and are equipped with luminosity sensors, which give information about the irradiance on each panel. The irradiance is simulated by means of a 150 W external lamp, which can be remotely activated by the users, through a specific 5 V relay. The additional power is supplied by a micro-wind turbine which is based on a DC brushless generator and can be activated by means of a remotely controlled fan. The DC bus is directly connected with a stationary energy storage system, which consists of a 7 Ah/12 V lead acid battery. DC/DC boost converters are used to manage the connection of PV panels and micro-wind turbine with the DC bus. These converters allow boosting the output voltage of renewable sources, in order to perform the charging operations of the lead acid battery. The DC loads are simulated through fans, lights, USB plugs and a DC motor, able to drive a water pump for a garden fountain. A Ni-Mh battery cell of a 3.6 V/750 mAh simulates the behavior of a vehicle battery pack, during its charging operations. This vehicle is charged with the energy coming from the DC Bus by means of a DC/DC power converter. An additional contribution of electric power to charge the vehicle battery pack can be supplied by a small PV panel, installed on the car shelter, with a rated power of 1 W. In this demonstrator, the power fluxes related to the interactions among energy sources, storage systems and loads can be monitored and acquired through voltage and current transducers installed in specific points of interest.
Figure 3 reports the complete control and management scheme of the microgrid laboratory demonstrator.
In particular, the core of the microgrid control and management system is based on a Raspberry Pi board. This board is characterized by a large number of advantages in terms of costs, connectivity and modularity. It is powered with a Quad-core 64-bit CPU ARM Cortex A53 clocked at 1.2 GHz, a 400MHz GPU Video Core IV multimedia, and 1GB LPDDR2-900 SDRAM. It holds 4 USB ports, 1 HDMI port, has Ethernet and Bluetooth connectivity, 17 GPIO pins, and a HAT ID bus. The 17 digital input/output pins, working at 5 V, can be used to control the switches of the demonstrator. In addition, thanks to the Quad-core 64-bit processor, the Raspberry PI can work as a single-board computer, supporting different operating systems. For this reason, it has been widely proposed in the scientific literature for the implementation of applications based on the concept of Internet of Things [22,23].
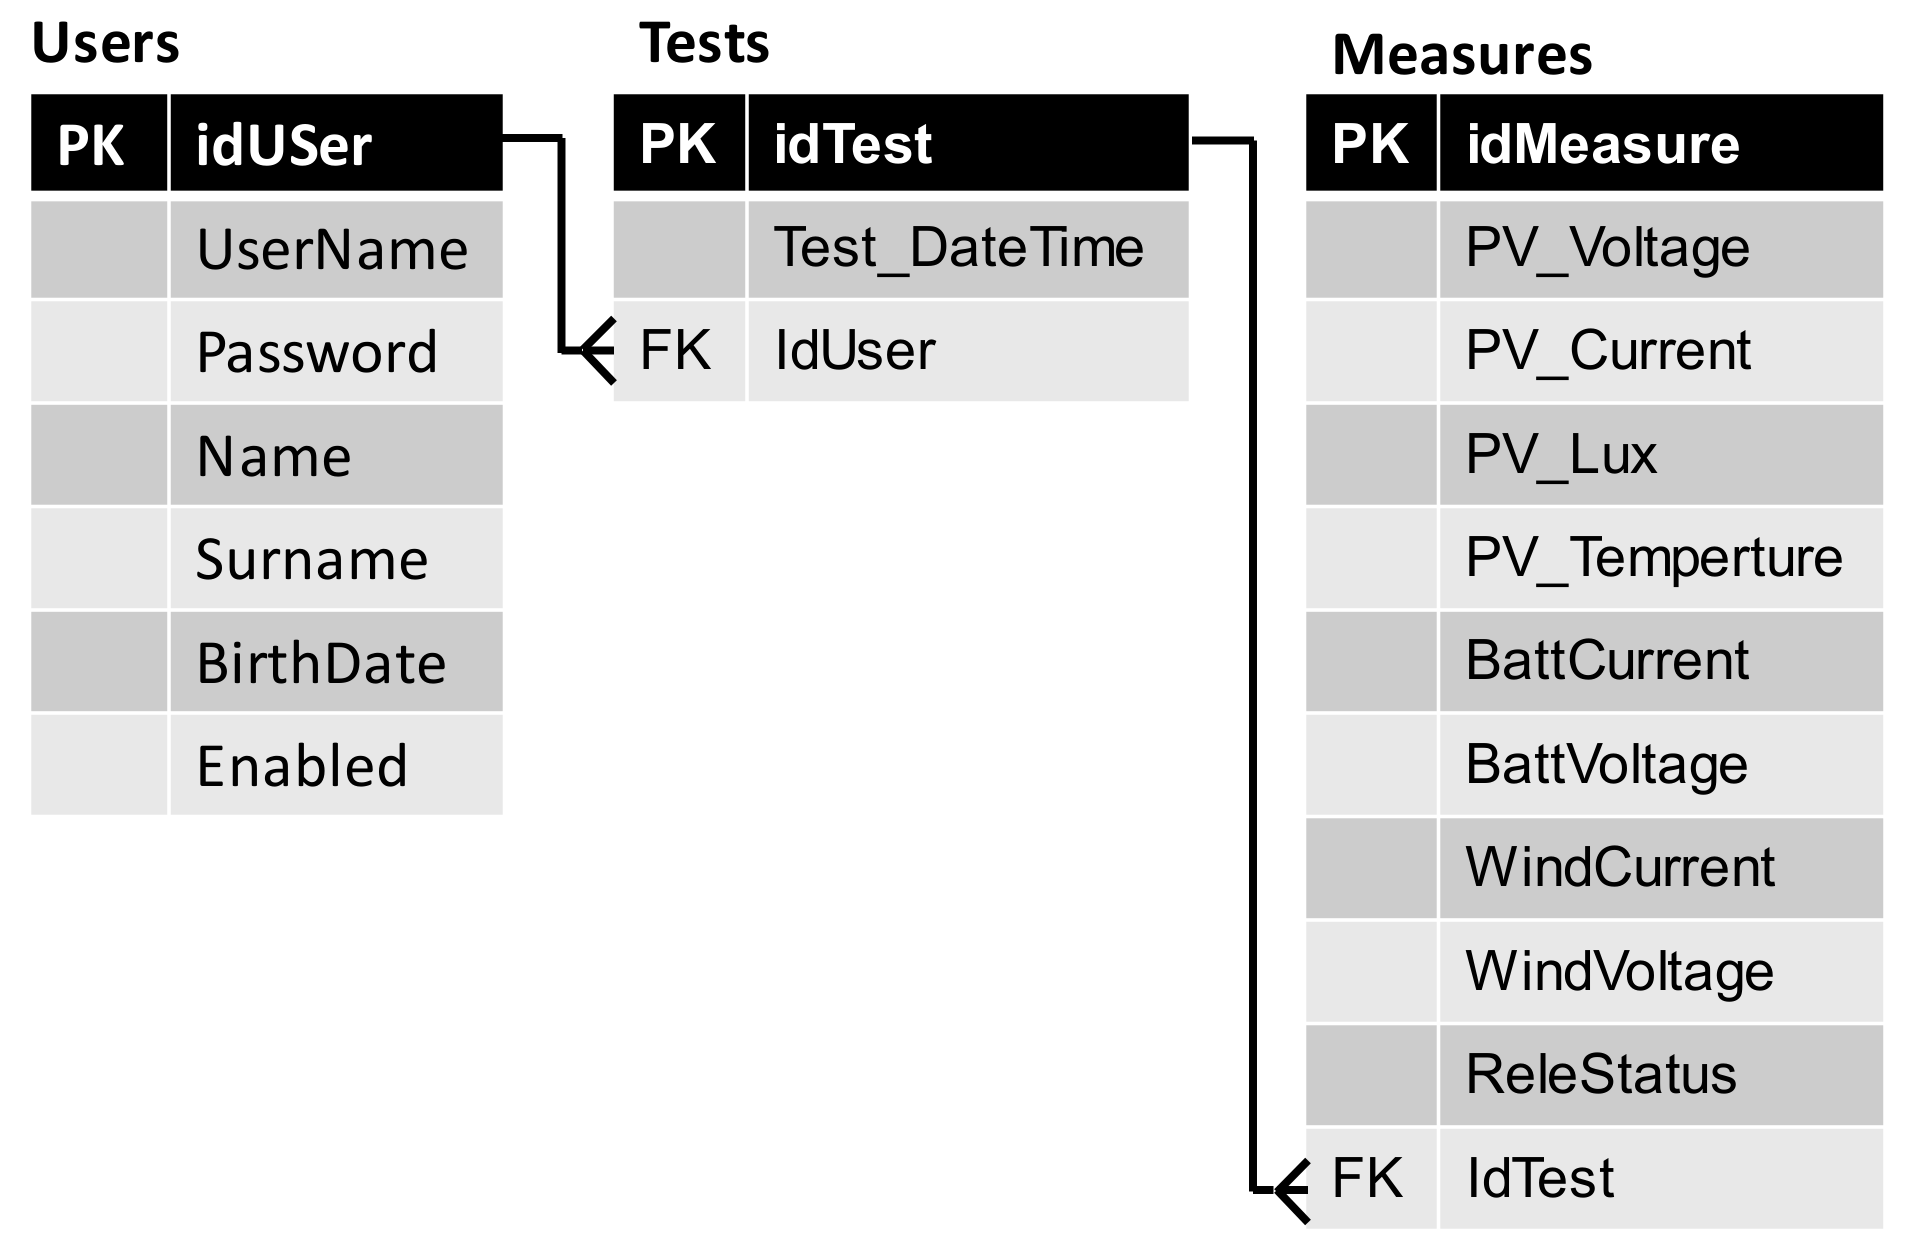
For this specific application, the free operating system Debian Raspbian has been installed and configured to be remotely accessible. Http requests from remote clients are managed by the Raspberry Pi through the use of an Apache http server installed on-board. In addition, the Raspberry Pi has been configured to work as a MySQL db server, in order to store data acquired during experimental test sessions and to support a proper authentication service for remote users. The entity-relationship (E-R) diagram of the considered database is reported in the following Figure 4.
In particular, with this configuration, users are identified by means of a unique username and password, which is encrypted in MD5 format. In addition, a Boolean field allows the system enable/disable users in order avoid simultaneous uses of the demonstrator. Each user can perform various kind of tests on the demonstrator, which are identified by date/time and are linked to the user running the test, to be reanalyzed in a second time for didactical purpose. For each test, the corresponding set of measures can be easily identified by means of the one-to-many relationship between the table’s tests and measures. In particular, the demonstrator has been equipped with voltage, current, temperature, and luminosity sensors in order to give the users a complete set of measurements on the behavior of the microgrid. The data acquisition and real time control of the demonstrator is obtained by means of an Arduino Due board, which is equipped with an Ethernet Shield and is configured to acquire the data coming from the sensors and to store them into the MySql Database.
As already mentioned in this section, the proposed hardware and software architecture allows users to remotely control and monitor the main parameters of the demonstrator. In particular, a specific web interface, running on the Apache web server, has been developed in php language. In this regard, Figure 5 shows a picture of the software interface described above, with the relays switched-off after a test.
This interface is composed of a control module and a monitoring module. The control module gives the possibility to switch on/off the relays of the demonstrator (e.g., lights, fans, etc.), in order to simulate different energy scenarios. The monitoring module is divided into a webcam section, to show to the user real-time videos of the demonstrator, a measurement panel, which gives real-time information about the measurement of the main parameters and a chart panel. That chart panel is realized by using the open source Thinger.io platform and gives the possibility of analyzing the behaviors of main electrical and thermal parameters as a function of time. An additional feature of this software interface is represented by the possibility for the users of locally downloading all the measures related to their tests. This feature can be realized thanks to the interaction between php page and MySql Database.
3. Didactic Experiences
Simple use-cases are presented in this Section, in order to highlight the didactic potentiality of the proposed demonstrator. In particular, a single user, after the login phase, can begin the test procedure of the demonstrator through the software interface. At this point, a new element, identified by the date/time of the test and by the user ID running the test, is added to the Tests table in the database. The Arduino Due device, with reference to the above test, begins the collection of new measured values in the Measures table. Starting with no energy supplied by renewable energy sources, after switching on some relays, related to the different loads, user can have a first analysis of the data by looking at the charts. In particular, the behavior of battery current and voltage, after the switching on of water pump and fan, is reported, as an example, in the charts of the following Figure 6.
As is clear from the above results, in this case, the electric power is supplied with the only contribution coming from the battery pack. As a consequence, the first decrease in the battery voltage, of ~1 V, is related to the activation of the first load, represented by the water pump. Then, the battery pack begins its discharging phase with a current value of 0.7 A. The corresponding battery voltage decrease, after 3 minutes, is ~1 V. At this point, the switch related to the fan is activated and the battery discharging current increases its value up to 1.2 A, until the battery discharging voltage of 9.6 V is reached.
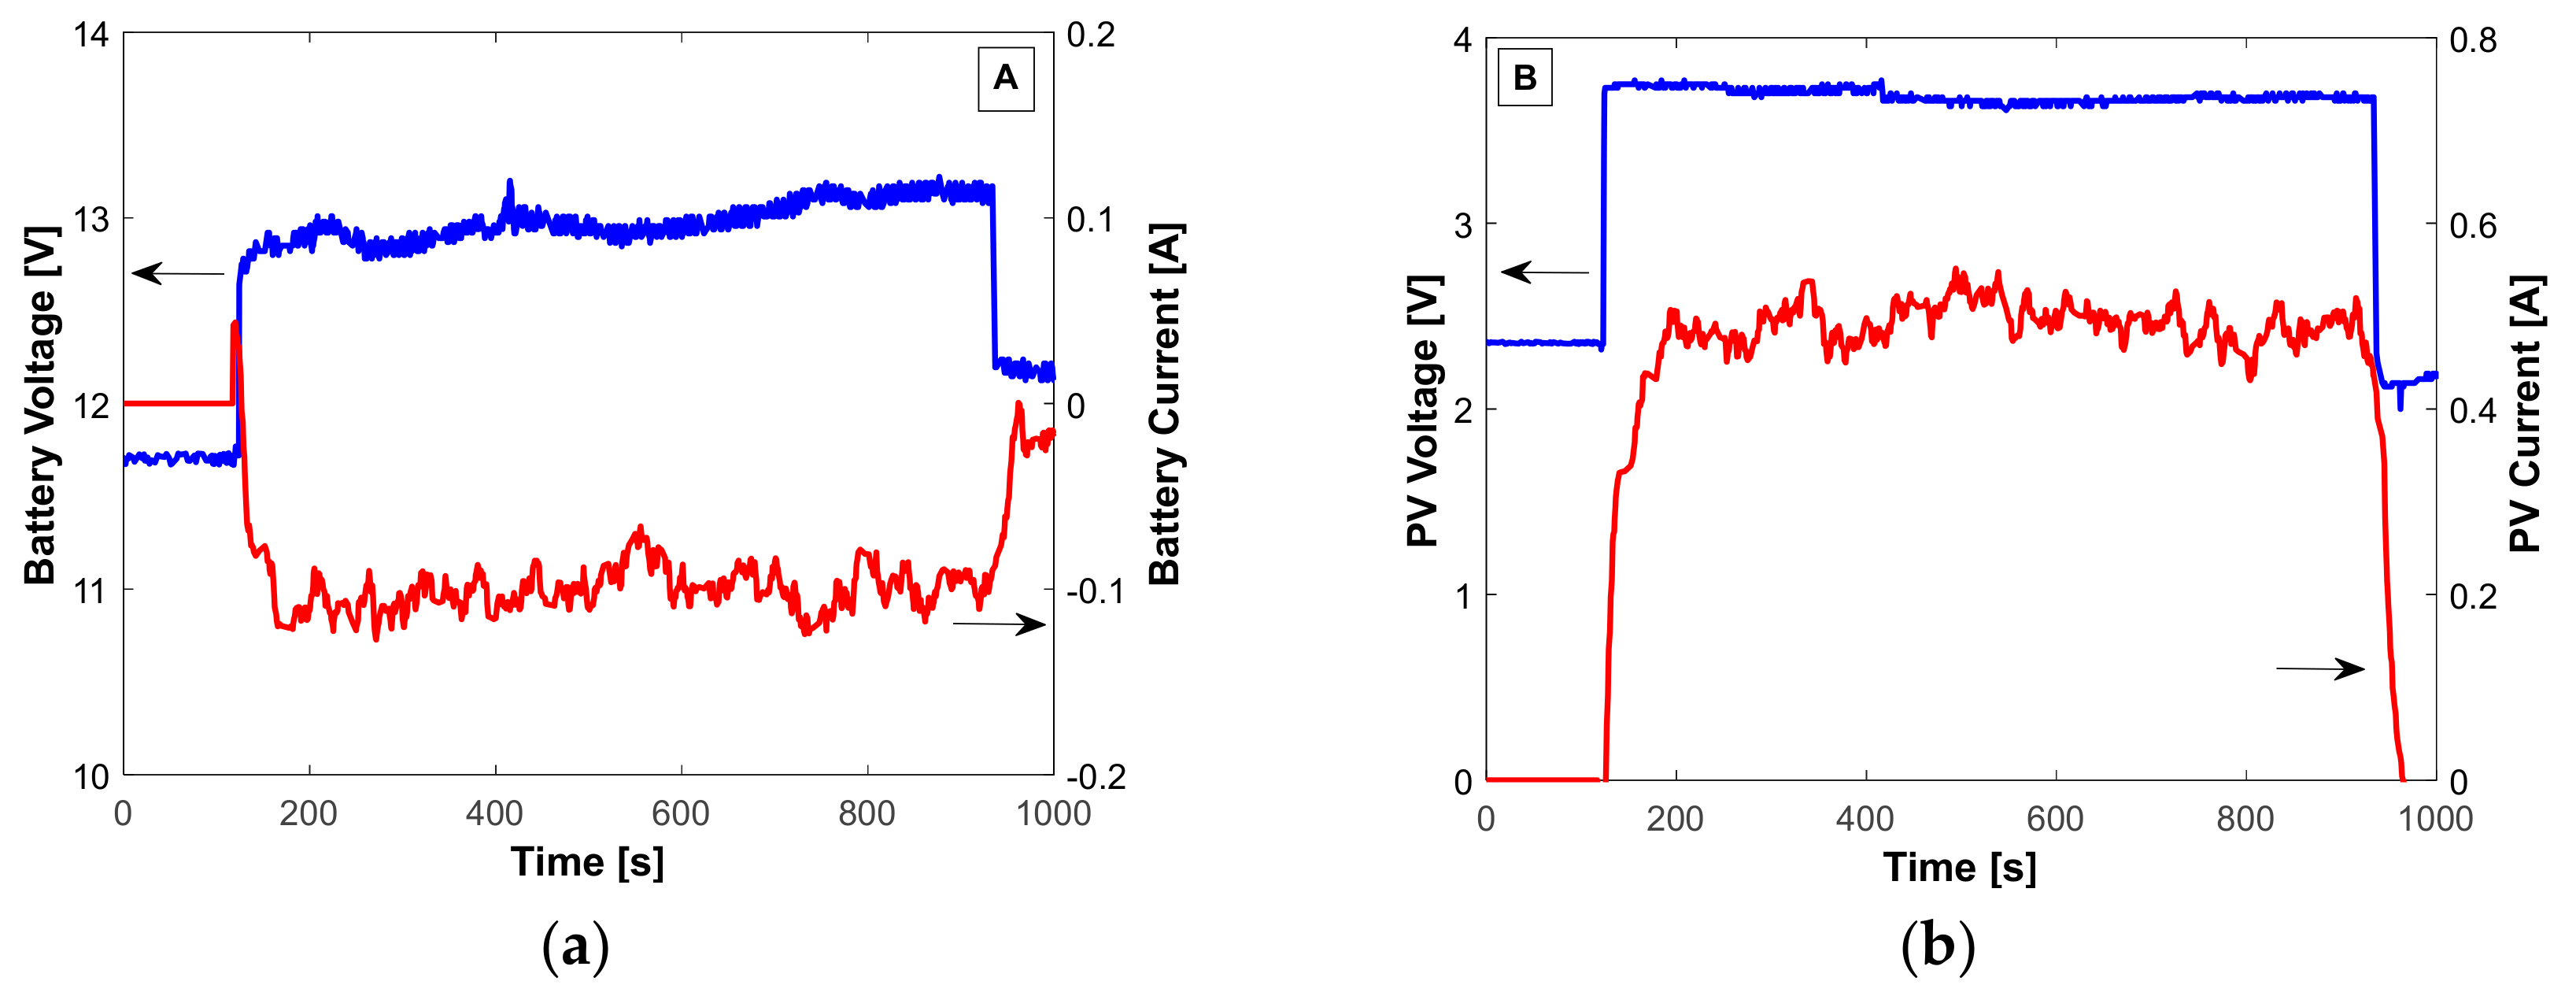
After the above analysis, the user can switch on the external lamp, which simulates the natural irradiance of the sun and activates the PV panels. The main results related to this phase of the test are reported in Figure 7. In particular, the battery pack is recharged, with a current value of about 0.1 A (Figure 7a), by using the electric power coming from the PV system. Therefore, the first battery voltage step, from 11.8 V to 12.8 V, is related to the beginning of charging operations. Then, the battery pack is slowly charged, with its voltage reaching the value of ~13.3 V, after ~12 min. During the battery charging phase, the PV panels work at a fixed voltage value of 3.8 V, and current value of 0.5 A (Figure 7b), with an overall electric power of 2 W (Figure 7c). In this case, the efficiency of the solar charging system can be easily evaluated as the ratio between battery and PV panels charging power. For this test, a maximum efficiency of ~70% is calculated.
It should be also noticed that the activation of the external lamp involves an increase in the temperature of the PV panels, which can be evaluated through the related sensors installed on the demonstrator. In particular, for this test, a temperature increase of ~10 °C has been observed (Figure 7c).
Another possible use-case, which allows a better understanding of the behavior of renewable sources, is the recharging of the battery pack by means of the wind turbine simulator, installed on the didactic demonstrator. In this case, the user can switch on and off an external fan, which simulates, in a small scale, the behavior of the wind. The main results obtained for this kind of battery charging operations are reported in Figure 8.
In this test, the user can simulate the effects of different wind gusts on the battery pack, by manually switching on/off the external fan. In particular, four different gusts are simulated with a generation power of about 7 W. During these gusts, the battery pack voltage, starting from an initial value of 12.3 V, reaches a maximum value of 12.6 V, whereas a maximum charging current value of about 0.6 A is obtained during the last gust.
Further tests can be carried out in order to pursue different learning objectives. As an example, the didactic demonstrator procedure can be useful to analyze the main electric parameters of the demonstrator, for a wide range of its operative conditions. Furthermore, the actual battery capacity, in terms of Ah, can be evaluated for various discharging current values, which can be regulated by the users through the proper remote control of the relays acting on the loads. The behavior, in terms of efficiency, of the battery charging process for different value of PV temperature and irradiance can be also analyzed by the users, in order to acquire fundamental skills on the experimental characteristics of the PV systems.
The tests presented in this section can be also carried out in the context of specific training courses, through step-by-step procedures with the help of trainers dedicated to this experiment.
4. Conclusions
In this paper a new learning tool has been proposed to train professional figures, such engineers and technicians, who are required to improve their skills in the field of Internet of Energy. In fact, the proposed demonstrator is able to reproduce the real behavior of a smart microgrid with its several subsystems, including energy storage systems, charging stations and renewable power generation plants.
The hardware and software architecture supporting the demonstrator gives the possibility to users of controlling the tests through remote internet connections and to store the measures related to specific tests in a MySQL database, useful for the data post-elaboration.
As described in this paper, various kinds of tests can be performed with this demonstrator, which are certainly close to the real operating conditions of an electric grid, although these components are tested on a reduced scale.
The didactic potentialities of the architecture, realizing the demonstrator of smart microgrid presented in this paper, appear to be very high, because they give to future energy managers the possibility to acquire experimental know-how on the complex subjects related to the Internet of Energy.
Author Contributions
Conceptualization, D.D., C.C. and O.V.; methodology, D.D., C.C. and O.V.; investigation, D.D., C.C. and O.V; validation, D.D., C.C. and O.V.
Funding
This research was cofunded by the European Commission within the project Internet of Energy—Education and Qualification, grant number 2017-1-IT01-KA202-006251.
Acknowledgments
The authors gratefully acknowledge Antonio Rossi and Mario Di Puorto, who work as technicians of Istituto Motori, for their respective cooperation in realizing the hardware and software architecture of the demonstrator proposed in this paper.
Conflicts of Interest
The authors declare no conflicts of interest.
References
- U.S. Energy Information Administration. International Energy Outlook 2017 (IEO2017). Available online: https://www.eia.gov/outlooks/ieo/pdf/0484 (accessed on 14 September 2017).
- Dangerman, A.J.; Schellnhuber, H.J. Energy systems transformation. Proc. Natl. Acad. Sci. USA 2013, 110, E549–E558. [Google Scholar] [CrossRef] [PubMed] [Green Version]
- Lund, H.; Andersen, A.N.; Østergaard, P.A.; Mathiesen, B.V.; Connolly, D. From electricity smart grids to smart energy systems–a market operation based approach and understanding. Energy 2012, 42, 96–102. [Google Scholar] [CrossRef]
- Carreiro, A.M.; Jorge, H.M.; Antunes, C.H. Energy management systems aggregators: A literature survey. Renew. Sustain. Energy Rev. 2017, 73, 1160–1172. [Google Scholar] [CrossRef]
- Strengers, Y. Smart Energy Technologies in Everyday Life: Smart Utopia? Springer: Berlin, Germany; Heidelberg, Germany, 2013. [Google Scholar]
- Zhou, K.; Fu, C.; Yang, S. Big data driven smart energy management: From big data to big insights. Renew. Sustain. Energy Rev. 2016, 56, 215–225. [Google Scholar] [CrossRef]
- Doost Mohammadian, H. Internet of energy: A solution for energy management challenges. In Proceedings of the 2019 IEEE Global Engineering Education Conference (EDUCON), Dubai, UAE, 9–11 April 2019. [Google Scholar]
- Cao, J.; Mingbo, Y. Energy internet--towards smart grid 2.0. In Proceedings of the 2013 Fourth International Conference on Networking and Distributed Computing (ICNDC), Los Angeles, CA, USA, 21–24 December 2013. [Google Scholar]
- Grau, A. Can you trust your fridge? IEEE Spectr. 2015, 52, 50–56. [Google Scholar] [CrossRef]
- Ancillotti, E.; Bruno, R.; Conti, M. The role of communication systems in smart grids: Architectures, technical solutions and research challenges. Comput. Commun. 2013, 36, 1665–1697. [Google Scholar] [CrossRef] [Green Version]
- Kafle, Y.; Mahmud, K.; Morsalin, S.; Town, G. Towards an internet of energy. In Proceedings of the 2016 IEEE International Conference on Power System Technology (POWERCON), Wollongong, NSW, Australia, 28 September–1 October 2016. [Google Scholar]
- Huang, A.Q.; Crow, M.L.; Heydt, G.T.; Zheng, J.P.; Dale, S.J. The future renewable electric energy delivery and management (FREEDM) system: The energy internet. Proc. IEEE 2010, 99, 133–148. [Google Scholar] [CrossRef]
- World Economic Forum. The Future of Jobs Report 2018. Available online: https://www.voced.edu.au/content/ngv:80780 (accessed on 26 June 2019).
- Assante, D.; Caforio, A.; Flamini, F.; Romano, E. Smart Education in the context of Industry 4.0. In Proceedings of the 2019 IEEE Global Engineering Education Conference (EDUCON), Dubai, UAE, 9–11 April 2019; pp. 1172–1177. [Google Scholar]
- De Jong, T.; Sotiriou, S.; Gillet, D. Innovations in STEM education: The Go-Lab federation of online labs. Smart Learn. Environ. 2014, 1, 3. [Google Scholar] [CrossRef]
- García Zubía, J.; Alves, G.R. Using Remote Labs in Education: Two Little Ducks in Remote Experimentation; Universidad de Deusto: Bizkaia, Spain, 2012. [Google Scholar]
- Sancristobal, E.; Castro, M.; Martin, S.; Tawkif, M.; Pesquera, A.; Gil, R.; Díaz, G.; Peire, J. Remote labs as learning services in the educational arena. In Proceedings of the 2011 IEEE Global Engineering Education Conference (EDUCON), Amman, Jordan, 4–6 April 2011; pp. 1189–1194. [Google Scholar]
- Assante, D.; Tronconi, M. Photovoltaic system as a remote didactic laboratory for electrical engineering courses. Int. J. Online Eng. 2015, 11, 39–46. [Google Scholar] [CrossRef]
- Assante, D.; Crucco, R. M2M learning environment for electric applications. In Proceedings of the 2019 IEEE Global Engineering Education Conference (EDUCON), Dubai, UAE, 9–11 April 2019; pp. 1546–1150. [Google Scholar]
- Assante, D.; Fornaro, C. An educational IoT-based indoor environment monitoring system. In Proceedings of the 2019 IEEE Global Engineering Education Conference (EDUCON), Dubai, UAE, 9–11 April 2019; pp. 1503–1507. [Google Scholar]
- Capasso, C.; Veneri, O.; Assante, D. A novel platform for the experimental training on Internet of Energy. In Proceedings of the 2018 IEEE Global Engineering Education Conference (EDUCON), Tenerife, Spain, 18–20 April 2018; pp. 1746–1752. [Google Scholar]
- Yamanoor, N.S.; Yamanoor, S. High quality, low cost education with the Raspberry Pi. In Proceedings of the 2017 IEEE Global Humanitarian Technology Conference (GHTC), San Jose, CA, USA, 19–22 October 2017; pp. 1–5. [Google Scholar]
- Assante, D.; Tronconi, M. A remotely accessible photovoltaic system as didactic laboratory for electrical engineering courses. In Proceedings of the 2015 IEEE Global Engineering Education Conference (EDUCON), Tallinn, Estonia, 18–20 March 2015; pp. 479–485. [Google Scholar]
Figure 1.
Infographic a modern energy supply chain (source: Beecham Research 2016).

Figure 2.
Didactic smart microgrid demonstrator: (a) picture and (b) functional scheme of the implementation.
Figure 2.
Didactic smart microgrid demonstrator: (a) picture and (b) functional scheme of the implementation.

Figure 3.
Control and management functional scheme of the microgrid laboratory demonstrator.

Figure 4.
E-R diagram of the demonstrator database.

Figure 5.
Picture of the software interface.

Figure 6.
Picture of the software interface.

Figure 7.
Main electric parameters during battery charging operations performed through PV generation system: (a) battery voltage and current; (b) PV voltage and current; (c) PV temperature and power.
Figure 7.
Main electric parameters during battery charging operations performed through PV generation system: (a) battery voltage and current; (b) PV voltage and current; (c) PV temperature and power.


Figure 8.
Battery voltage and battery current versus time during charging operations performed through wind generation system.
Figure 8.
Battery voltage and battery current versus time during charging operations performed through wind generation system.

© 2019 by the authors. Licensee MDPI, Basel, Switzerland. This article is an open access article distributed under the terms and conditions of the Creative Commons Attribution (CC BY) license (http://creativecommons.org/licenses/by/4.0/).
Share and Cite
MDPI and ACS Style
Assante, D.; Capasso, C.; Veneri, O. Internet of Energy Training through Remote Laboratory Demonstrator. Technologies 2019, 7, 47. https://doi.org/10.3390/technologies7030047
AMA Style
Assante D, Capasso C, Veneri O. Internet of Energy Training through Remote Laboratory Demonstrator. Technologies. 2019; 7(3):47. https://doi.org/10.3390/technologies7030047
Chicago/Turabian StyleAssante, Dario, Clemente Capasso, and Ottorino Veneri. 2019. "Internet of Energy Training through Remote Laboratory Demonstrator" Technologies 7, no. 3: 47. https://doi.org/10.3390/technologies7030047
Note that from the first issue of 2016, this journal uses article numbers instead of page numbers. See further details here.