Improving the Vanillin-Sulphuric Acid Method for Quantifying Total Saponins


1
School of Environmental and Life Sciences, University of Newcastle, Ourimbah, NSW 2258, Australia
2
Faculty of Bio-Food Technology and Environment, University of Technology (HUTECH), Ho Chi Minh City 700000, Vietnam
3
School of Science and Health, Western Sydney University, Penrith, NSW 2751, Australia
4
Central Coast Primary Industries Centre, NSW Department of Primary Industries, Ourimbah, NSW 2258, Australia
*
Author to whom correspondence should be addressed.
Technologies 2018, 6(3), 84; https://doi.org/10.3390/technologies6030084
Submission received: 16 August 2018
/
Revised: 31 August 2018
/
Accepted: 3 September 2018
/
Published: 6 September 2018
Abstract
:The colorimetric assay used for saponin quantification in plant extracts is subject to interference by common solvents used to extract the saponins from plant materials. Therefore, the degree of interference of ten common solvents was investigated. It was found that the presence of acetone, methanol and n-butanol in the reaction solution caused an intense darkening of the reaction solution in the absence of saponins, which likely could lead to erroneous saponin content values. Using aescin to construct standard curves with different solvents—such as water, ethanol, and methanol— also showed significant differences in the standard curves obtained, which led to different values when they were applied to quantify the saponin content of an ethanol extract from dried and powdered Gac (Momordica cochinchinensis Spreng) seed kernels. To improve the method, a solvent evaporation step was added prior to the colorisation reaction to prevent undesired solvent interference during the reaction step. Using this modified protocol for the aescin standard curve and the Gac seed kernel extract eliminated any solvent interference. Thus, this improved protocol is recommended for the quantification of the saponin content of plant extracts irrespective of which extraction solvent is used.
1. Introduction
Saponins are a diverse group of compounds widely distributed in the plant kingdom, which are characterised by their structure containing a triterpenoid (C30) or steroid (C27) aglycone, and one or more carbohydrate chains [1]. Their physicochemical (e.g., surfactant) properties [1], coupled with mounting evidence on their biological activities (e.g., anticancer and anti-cholesterol activity) [2], have led to the emergence of saponins as significant compounds with expanding applications in the food, cosmetics and pharmaceutical sectors [3].
As for other plant bioactives, the realisation of the potential of saponins requires robust methods for their effective extraction from plant materials, for their easy quantification in extracts and for the ultimate identification of individual saponins. Many methods have been developed for the detection and measurement of saponins in plant products; they can be classified into two main categories [4], (i) spectrophotometric methods [5,6,7], which give a total saponin content (TSC) value, and (ii) chromatographic methods, which quantify specific saponin compounds [8,9].
For TSC analysis, a spectrophotometric method proposed by Hiai et al. [7] has become popular for the detection and quantification of saponins in plant materials [4], largely because it is simple, fast and inexpensive. The method is known as the vanillin-sulfuric acid assay because the basic principle of the method is the reaction of sulphuric acid-oxidised triterpene saponins with vanillin, which gives a distinctive red-purple colour measured at wavelengths ranging from 473 to 560 nm [4] using a spectrophotometer [10]. The TSC of a plant sample is determined from a calibration curve with a standard saponin (e.g., aescin, oleanolic acid, diosgenin, quillaja saponin) [4,11] and it is expressed in terms of the standard’s equivalence (e.g., mg standard equivalents per g sample; or g standard equivalents per 100 g sample).
The original method was used to measure saponins in aqueous and ethanol extracts of ginseng [10,12]. However, since then, a number of other solvents have been used to extract saponins from a wide range of plant materials [3], including butanol [13], methanol [14], ethyl acetate [15], dichloromethane [16], acetone [17], and hexane [18], among others. In order to appropriately eliminate any colour reactions that are not due to the saponins, each solvent needs to be included in the reagent blank and the standard solutions at the same concentration as in the sample extracts. However, in initial experiments, it was noticed that solvents such as methanol and acetone gave high reagent blank absorbance values, which may not be able to be effectively used to zero a spectrophotometer or subtract from readings obtained for the samples and standards. Therefore, in this study, the effect of ten different solvents, used for the extraction of saponins from plant materials, on the vanillin-sulphuric acid assay [7] was investigated. The possible interference of the solvents was addressed by introducing some modifications to the assay. The modified assay was verified by quantifying the TSC of a sample extract—the ethanolic extract of Gac (Momordica cochinchinensis Spreng) seeds.
2. Materials and Methods
2.1. Materials
The solvents acetonitrile, acetone, methanol, ethanol, ethyl acetate, n-butanol, dichloromethane, diethyl ether, chloroform and hexane and chemicals including vanillin and sulphuric acid were products of Merck (Bayswater, VIC, Australia). Aescin was purchased from Sigma-Aldrich Co. (Castle Hill, NSW, Australia).
Dried seed kernel powder from the Gac fruit (Momordica cochinchinensis Spreng), a material rich in triterpenoid saponins [19], was used for the extraction and analysis of TSC using the vanillin-sulphuric acid assay. The Gac seeds were collected from fresh Gac fruit bought at Gac fruit fields in Dong Nai province, Ho Chi Minh city, Vietnam (latitude: 10.757410; longitude: 106.673439). After separation from the fresh fruit, the seeds were vacuum dried at 40 °C for 24 h and the dried seeds were de-coated to get the kernels. These kernels were ground to pass through a 1.4 mm sieve. The powder was then freeze-dried using a Dynavac FD3 freeze dryer (Sydney, NSW, Australia) for 48 h at −45 °C, under vacuum at a pressure loading of 10−2 mbar (1 Pa), to reduce the moisture content to 1.21 ± 0.02%.
2.2. Methods
2.2.1. The Usual Vanillin-Sulphuric Acid TSC Assay
The vanillin-sulphuric acid assay for determining the TSC of plant materials [12] is usually done [11,20] by incubating 0.25 mL of plant sample extracts, standards or reagent blank (Table 1) with 0.25 mL of 8% (w/v) vanillin in ethanol and 2.50 mL of 72% (v/v) sulphuric acid in water for 15 min at 60 °C in a shaking water bath, with the standards and the reagent blank made up with the solvent used for extracting the plant samples (extraction solvent) as shown in Table 1. After cooling in water at the ambient temperature for 5 min, the absorbance of the standards and extracts are measured at 560 nm using a Cary 50 UV–VIS spectrophotometer (Agilent Technologies, Santa Clara, CA, USA) after zeroing it with the reagent blank (Table 1). The TSC of the samples is then expressed in mg of standard equivalents per gram of plant sample (mg SE g−1).
2.2.2. Solvents and the Reagent Blank
To investigate whether any colour development occurred, due to the extraction solvent in the vanillin—sulphuric acid assay, ten common extraction solvents were tested: Acetonitrile, acetone, methanol, ethanol, ethyl acetate, n-butanol, dichloromethane, diethyl ether, chloroform, and hexane. These solvents were used as absolute. Accordingly, ten reagent blanks and a zeroing blank with water were prepared as described in Table 2. The reagent blanks and the zeroing blank were vortexed, and incubated in a water bath at 60 °C for 15 min, and then cooled down in a water bucket for 5 min. The absorbance of each solution was then measured at 560 nm, using a Cary 50 UV–VIS spectrophotometer (Agilent Technologies, Santa Clara, CA, USA) after the spectrophotometer was zeroed with the water blank (Table 2).
2.2.3. Solvents Used to Prepare Saponin (Aescin) Solutions
To investigate whether solvents had an effect on the colour development with increasing concentrations of saponins in the vanillin (sulphuric acid assay, aescin—a natural mixture of triterpenoid saponins) was used. However, of the ten solvents investigated with the reagent blank, aescin could only be dissolved in methanol and ethanol, as well as in water, to produce a clear solution. Therefore, aescin was initially dissolved in three solvents (methanol, ethanol and water) and four sets of serially diluted aescin solutions were prepared as follows:
- Set 1: A stock solution of aescin in ethanol (1500 mg L−1) was prepared. The ethanol stock solution was diluted with ethanol to 1000, 800, 500, 250 and 100 mg L−1.
- Set 2: A stock solution of aescin in water (1500 mg L−1) was prepared. The water stock solution was diluted with water to 1000, 800, 500, 250 and 100 mg L−1.
- Set 3: The ethanol stock solution (1500 mg L−1) was diluted with water to 1000, 800, 500, 250 and 100 mg L−1.
- Set 4: A stock solution of aescin in methanol (1500 mg L−1) was prepared. The methanol stock solution was diluted with water to 500, 250, 125, 62.5 and 31.25 mg L−1. The range of concentrations for this set was adjusted downwards because the initial concentrations (as in Sets 1 to 3) gave absorbance values that were too high for the Cary 50 UV-VIS spectrophotometer.
The four sets of aescin solutions were set up with two reagent blanks, one with water and the other with ethanol, as described in Table 3. The solutions were mixed and incubated at 60 °C in a water bath for 15 min and then cooled in water at the ambient temperature for 5 min. The absorbance was measured at 560 nm using the UV–VIS spectrophotometer after the spectrophotometer was zeroed with the ethanol reagent blank (Table 3) for Set 1 of aescin solutions and with the water reagent blank (Table 3) for Sets 2, 3, and 4 of aescin solutions. The resulting absorbance values were plotted against the aescin concentrations to generate four regression lines.
2.2.4. The Modified Vanillin-Sulphuric Acid TSC Assay
The setup procedure for the TSC assay was modified as shown in Table 4. Based on the experiments with the different solvents in the reagent blank, and the preparation of the saponin (aescin) solutions, it was determined that the extraction solvent should be removed from the extracts before the vanillin-sulphuric acid reaction was performed. In the usual assay (Table 1), the volume of extract used is 0.25 mL. However, the extracts typically need to be diluted to fit within the linear range of the standard curve. Therefore, to obviate the need to dilute the extracts, and especially to make it easier to remove the extraction solvent, only 25 µL of the extract was used in the modified assay (Table 4).
To also make the removal of the standards’ solvent easier, the standards were also made at 10 times higher concentrations than for the usual method (Table 1), and only 25 µL of the standard solutions were used in the modified assay (Table 4). A corresponding reagent blank was also prepared with 25 µL of the extraction solvent (Table 4), which was also removed before the vanillin, and the sulphuric acid solutions were added. Furthermore, to keep the total volume in the assay at 3 mL (Table 1) with the concentration of vanillin. and sulphuric acid unchanged, the concentration of the vanillin solution was decreased by half to 4% (w/v), and the volume was doubled to 0.50 mL (Table 4).
2.2.5. Determining the TSC of a Gac Seed Extract Using the Modified Method
• Preparation of the Standard Curve
Aescin, a natural mixture of triterpenoid saponins, was used to produce a standard curve. A 15,000 mg L−1 aescin stock solution was prepared by dissolving 150.0 mg of aescin in 10 mL of methanol. A serial dilution was then done in triplicate using methanol, and methanol was used as the solvent blank for the standards, as presented in Table 5.
As described in Table 4, 25 µL of each aescin standard solution (Table 5) was used in the modified assay. A reagent blank for the standards was also prepared using 25 µL of methanol (Table 4). All tubes were placed in a water bath set at 65 °C until the methanol was evaporated to dryness (~5 min). Then, 0.5 mL of 4% vanillin in ethanol (w/v) was added to each tube followed by 2.5 mL of 72% H2SO4 (v/v) (Table 4). The tubes were covered, vortexed, incubated in a water bath at 60 °C for 15 min and then cooled for 5 min in water at ambient temperature. The absorbance of the solutions was measured at 560 nm using the Cary 50 UV-VIS spectrophotometer after zeroing with the blank. The absorbance values obtained (Table 5) were plotted against the concentrations to construct a standard curve.
• Preparation of a Gac Seed Kernel Powder Extract
One gram of freeze-dried Gac seed kernel powder was mixed with 30 mL of ethanol in a 100 mL conical flask. The suspension was left standing for 30 min pre-leaching at ambient temperature before extraction was done for three cycles of 10 s power ON and 15 s power OFF (per cycle), with the power set at 360 W, using a R395YS Sharp Carousel microwave oven (Sharp Corporation, Bangkok, Thailand). The suspension was then rapidly cooled to ambient temperature in an iced water bath, and filtered through a 0.45 µm membrane filter. The clear extract was collected and its TSC was determined using the usual (Table 1) and the modified (Table 4) vanillin-sulphuric acid methods.
• Determination of the Total Saponin Content of the Gac Seed Kernel Powder Extract
The modified method was applied to measure the TSC for the ethanol Gac seed kernel powder extract following the composition as described in Table 4, where the extraction solvent was ethanol and the standard was aescin. The saponin content of the sample extract was calculated from the aescin standard curve equations (Figures 2 and 3). The TSC was calculated relative the mass of the sample used as per Equation (1):
The TSC was expressed as mg aescin equivalents per gram dry weight of Gac seed kernel powder (mg AE g−1).
2.2.6. Statistical Analyses
Experiments were performed in triplicate and means ± SD were assessed using the Student t-test when comparing two means only, and the one-way ANOVA and Tukey’s Post Hoc Multiple Comparisons for more than two means, using IBM SPSS Statistics 24 (IBM Corp., Armonk, NY, USA). Differences in means were considered statistically significant at p < 0.05. The aescin standard curves and regression equations were generated using the Microsoft Excel software.
3. Results
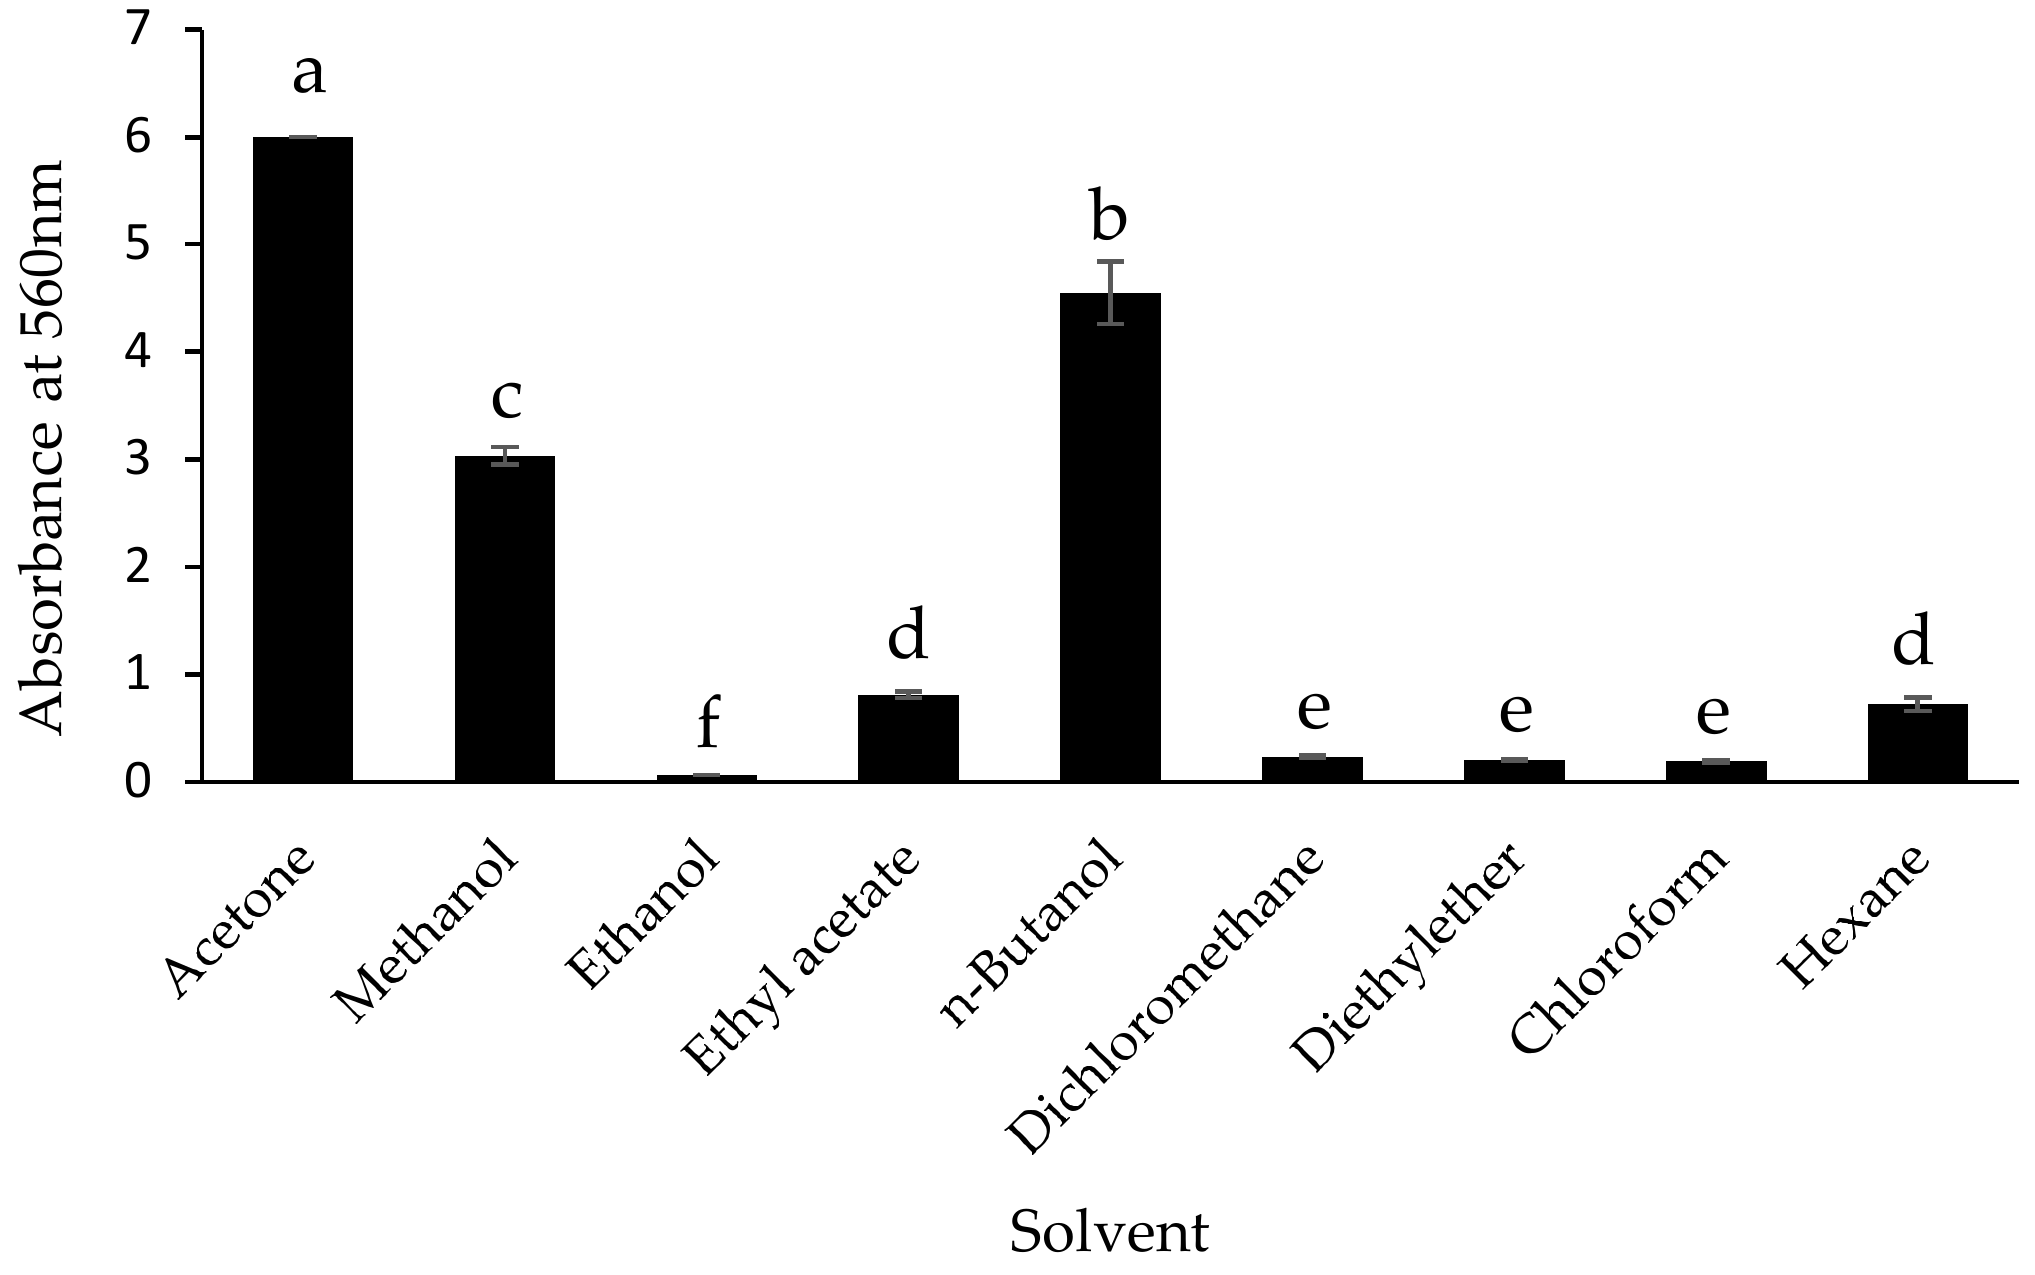
3.1. The Effect of Different Solvents in the Reagent Blank
It can be seen in Figure 1 that the presence of acetone in the reagent blank for the vanillin-sulphuric acid method resulted in the darkest solution, which obstructed the transmission of most of the spectrophotometer’s light in the absence of any saponins. Besides acetone, n-butanol, and methanol also led to substantially high absorbance values (Figure 1), followed by ethyl acetate and hexane, and then by dichloromethane, diethyl ether and chloroform to a lesser extent. Only ethanol did not have a significant effect on the absorbance of the reaction mixture compared to water. It was also observed that chloroform and hexane also caused some cloudiness in the reagent blank solution.
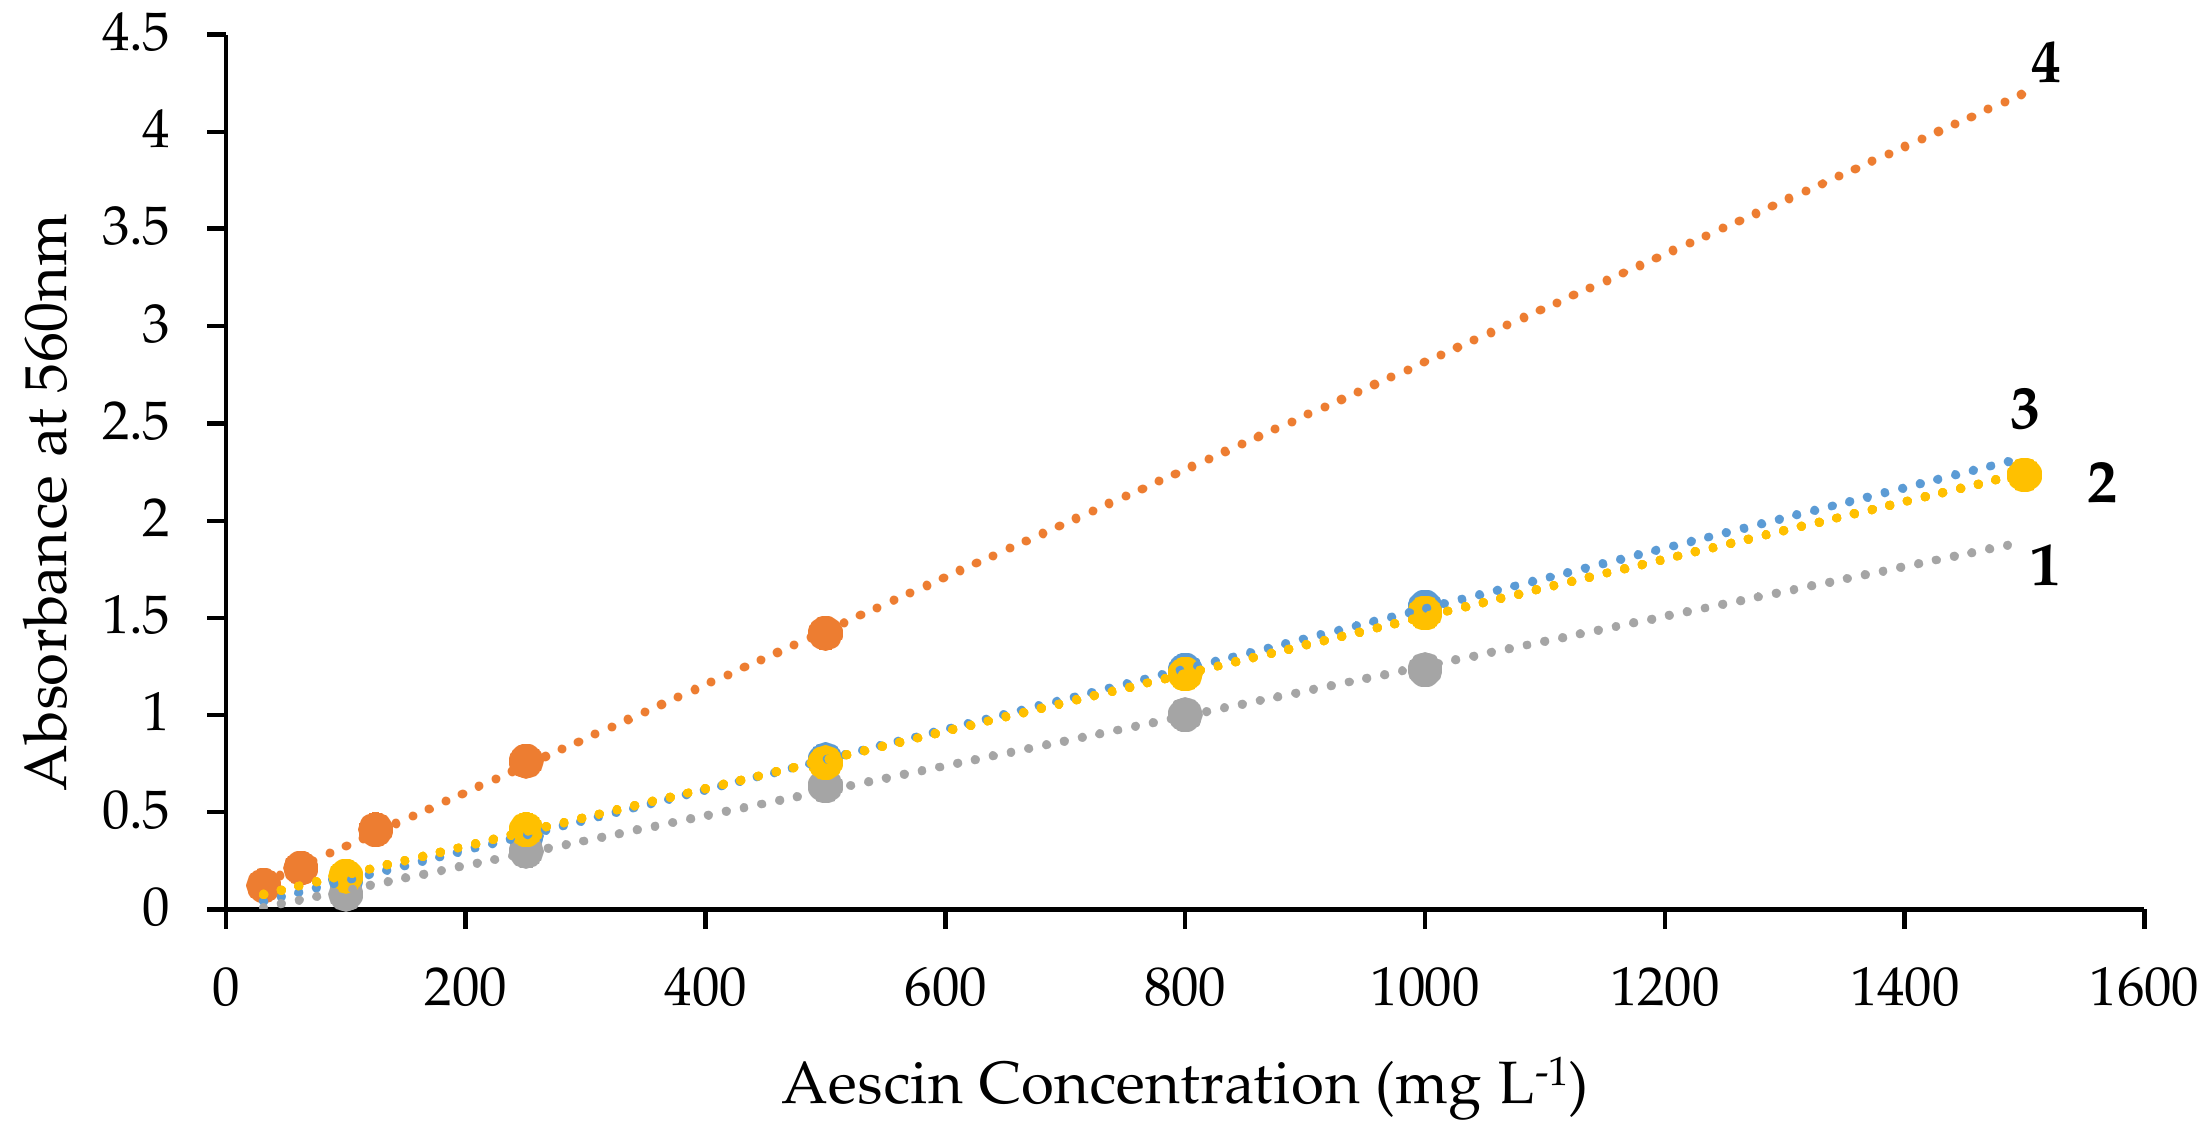
3.2. Effect of Solvents on the Aescin Standard Curve
Following the procedure described in Section 2.2.3, four aescin standard curves and their regression equations were obtained as shown in Figure 2. Except for curves 2 and 3, it was observed that the aescin standard curves varied between the solvents used to prepare the aescin solutions.
Notably, when the aescin was dissolved in methanol and diluted in water, the slope of the resulting standard curve was substantially higher (Line 4) than for to the other 3 standard curves. This effect was likely, due to the increasing concentrations of methanol in the aescin solutions that were less diluted with water to give the increasing aescin concentrations, and was consistent with the increased absorbance methanol was observed to have in the reagent blank (Figure 1).
3.3. Aescin Standard Curve for the Modified Method
The aescin standard curve and its regression equation, obtained using the modified method described in Section 2.2.4 and Section 2.2.5, is shown in Figure 3. It can be seen that over the concentration range of the aescin standard (937.5 to 15,000 mg L−1), a very highly linear response in absorbance was achieved as the aescin concentration was increased.
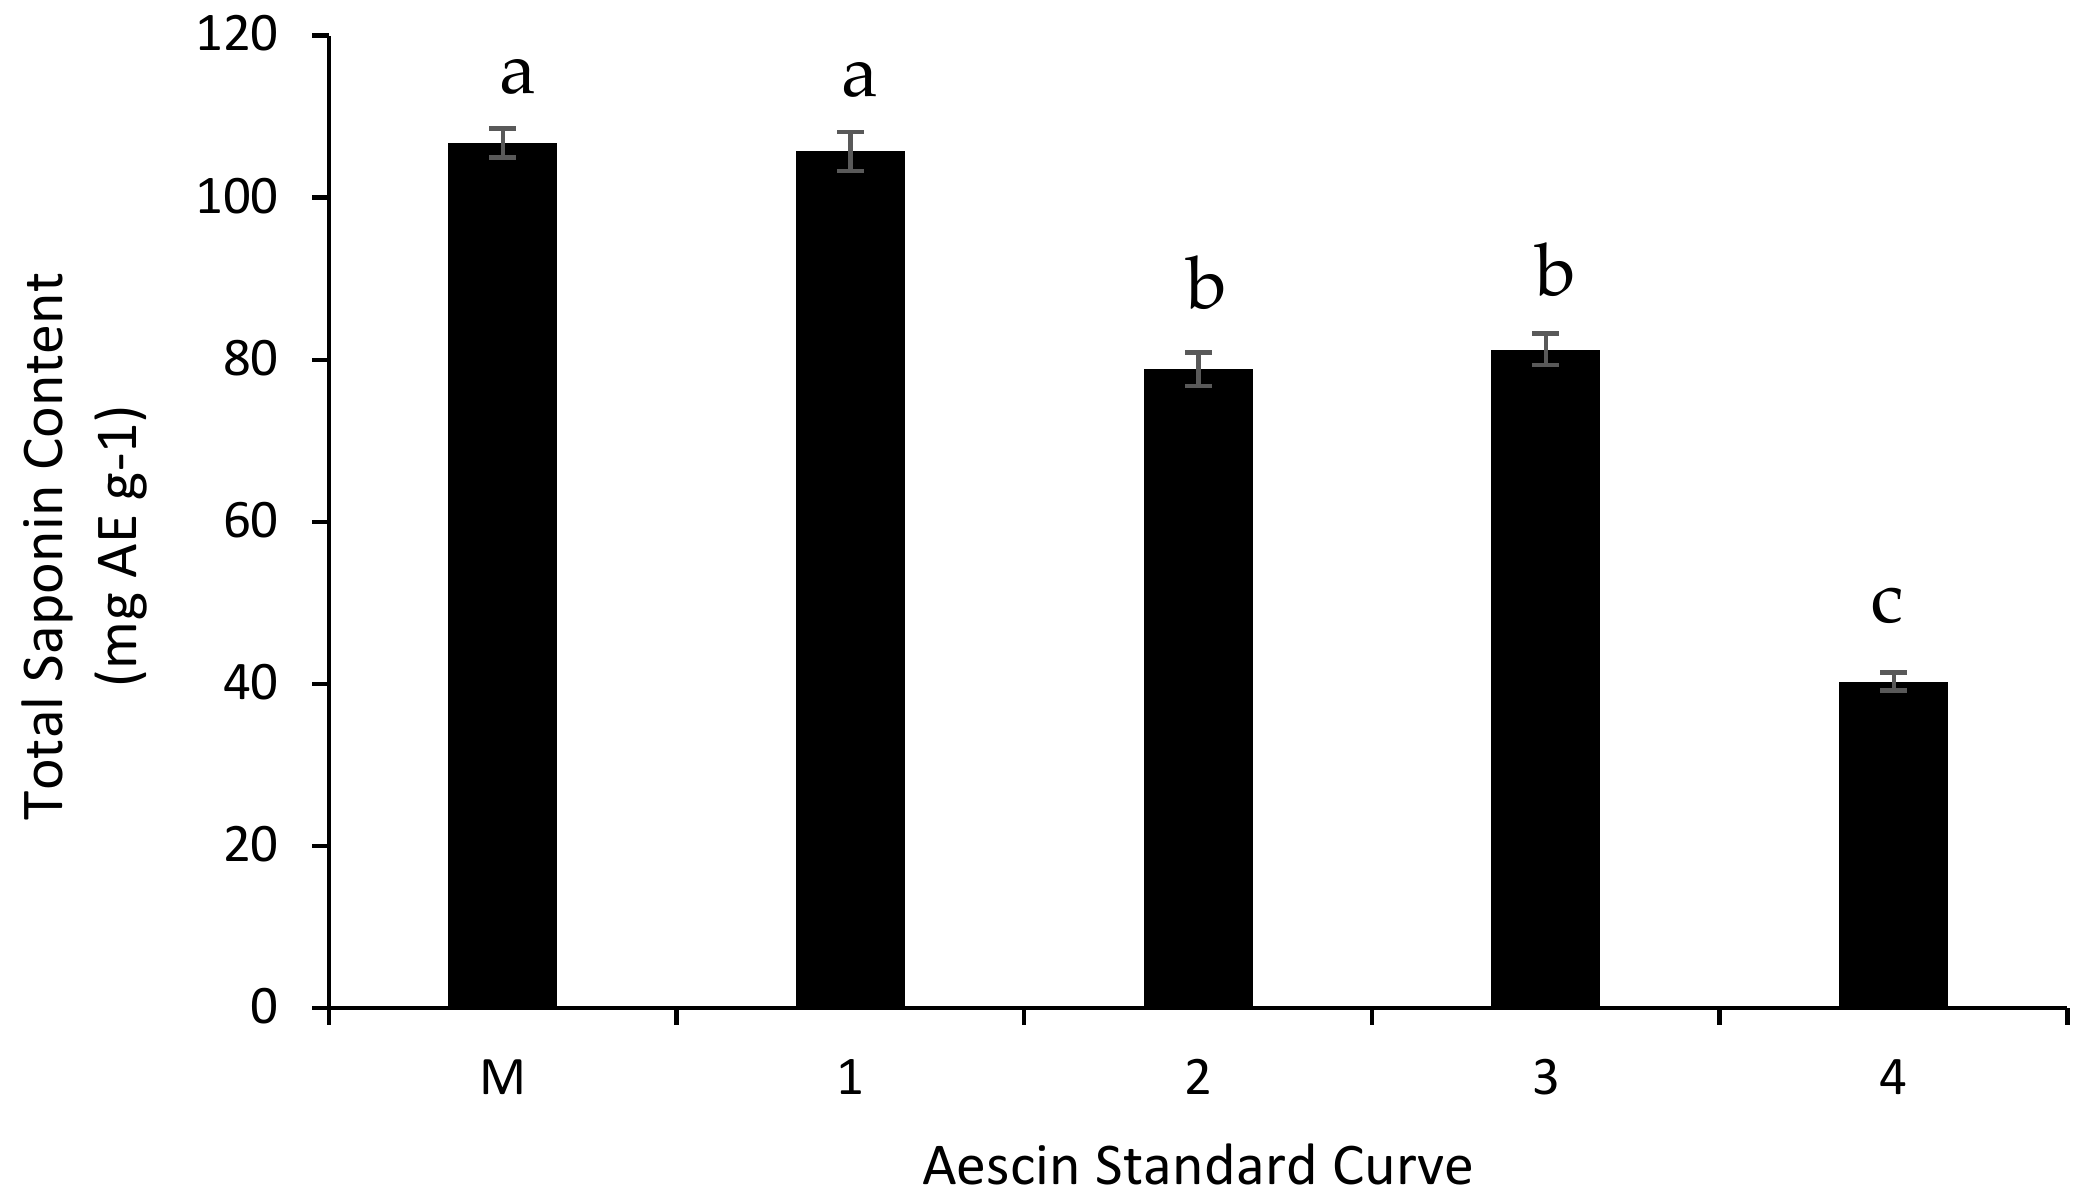
3.4. Saponin Content of the Gac Seed Kernel Powder
The TSC of the Gac seed kernel powder was determined using an ethanol extract. and the modified vanillin-sulfuric acid method using the aescin standard curve in Figure 3. The results were compared with the unmodified method using the four aescin standard curves in Figure 2.
As seen in Figure 4, the values for the TSC of the Gac seed kernel powder were significantly lower (25%, 23% and 62% lower, respectively) when aescin standard curves 2, 3 and 4 in Figure 2 were used to measure the saponins in the ethanol extract compared to when the value was derived from aescin standard curve 1.
Using the modified vanillin-sulphuric acid method and the aescin standard curve in Figure 3, the value for the TSC of the Gac seed kernel powder was the same for the ethanol extract as when the value was derived using the unmodified method and aescin standard curve 1 (Figure 4).
Although the regression equations for the modified method and the unmodified method with aescin standard curve 1 were different, the absorbance and the saponin concentration obtained for the ethanol extract of the Gac seen kernel powder were not significantly different, which led to the TSC for the Gac seed kernel powder also not being significantly different between the two methods (Table 6). In other words, the modified method gave results that were entirely consistent with the unmodified vanillin-sulphuric acid method when ethanol was used as the extracting solvent and included in the standard curve, a feature of the original methodology [7,10,12].
4. Discussion
4.1. Effect of Common Extraction Solvents on the Vanillin-Sulphuric Acid Method
Of the ten solvents investigated, acetone caused the most intense darkening of the reaction solution in the absence of saponins, followed by butanol and methanol, which also caused very substantial colour development in the reagent blank (Figure 1). Therefore, these three solvents were found to be incompatible with the vanillin-sulphuric acid method. Ethyl acetate and hexane also caused moderate absorbance in the reagent blank, and could also significantly interference with the accurate measurement of saponins using this assay. Of note, ethanol, which was used in the original assay [7,10,12], was the only solvent not to cause a significant colour reaction in the absence of saponins.
For acetone, it is known that its reaction with concentrated sulphuric acid at an elevated temperature creates the carbonaceous resin, mesitylene, which has a dark colour [21,22]. Development of this coloured product, during the vanillin-sulphuric acid assay, could obviously result in an artificially high saponin result, and may explain why acetone could give the highest TSC values when compared to several other extraction solvents [23].
While the mechanism for the colour development with n-butanol remains unknown, the mechanism for the chroma effect of methanol is most likely, due to the esterification reaction between methanol and concentrated sulphuric acid to create methyl hydrogen sulphate [24,25]. Methanol is often used to dissolve aescin because, unlike for other solvents, the saponin mixture used as an external saponin standard [11,20,26], dissolves very well in the alcohol. For example, aescin cannot be efficiently dissolved in acetone and n-butanol and therefore these solvents could not be tested for their effects on the aescin standard curve in the present study.
However, the interfering effects of methanol were also seen (Figure 2) when it was used to dissolve aescin to construct the standard curve. Therefore, the effects of methanol on the reagent blank, and the standard curve may explain why methanol extracts have often been observed to give higher TSC values than extracts derived from other solvents [26,27,28,29,30,31,32,33], and why the TSC values increase as the methanol concentration is increased [20,33].
The presence of ethanol in the reaction solution is acceptable because it does not cause a significant difference in the absorbance readings in comparison to its aqueous counterpart. This means that the unmodified vanillin-sulphuric acid method is still acceptable for ethanol extracts providing that the standard curve is prepared with ethanol only.
However, it can be concluded that, except for ethanol, the extraction solvents evaluated in this study can interfere with the TSC measurements and thus, they should be eliminated from the extracts before the vanillin-sulphuric acid reaction step as proposed in this study. Furthermore, even for ethanol extracts, the modified method does not require the extract to be diluted, and therefore, it is an improvement because it saves on both labour and dilution solvent.
The construction of the standard curves also revealed that the linear range of the absorbance value measured by a spectrophotometer can be as high as 2.2, or more (Figure 2), instead of 1.0, as usually recommended. This means a higher range of saponin concentration can be measured by this method.
4.2. Modifications of the Vanillin-Sulphuric Acid Method
In the modified assay, the major change was the elimination of the extraction solvent by evaporation from the sample extract before the vanillin-sulphuric acid reaction step. To facilitate this change, other minor modifications were also made:
- To make it easier to remove the solvent from the extract by evaporation, the volume of the sample extract used in the assay was decreased ten times (from 0.25 mL to 25 µL);
- To keep the total volume of the solution, and the concentration of the reagents during the reaction step the same as for the unmodified assay, the concentration of the vanillin solution in ethanol was decreased by half from 8% to 4% (w/v), and the volume of the 4% (w/v) vanillin solution added was doubled (from 0.25 mL to 0.5 mL).
4.3. Advantages of the Modified Vanillin-Sulphuric Acid Method
The modified method for the quantification of the TSC of plant materials has the following advantages over the unmodified protocol:
- Because the chemical reaction in the modified protocol is not interfered with by the presence of extraction solvent, it does not require the standard curve to be constructed with a new solvent every time the extraction solvent is changed. Moreover, once the standard curve has been proven to be reproducible over time, then it will not need to be done for every assay; the same standard curve can be used for subsequent assays, and for extracts derived from all types of solvents, which means that labour and reagents can be is saved.
- In the unmodified protocol, the standards and the reagent blank needs to be prepared (dissolved and diluted) in the same solvent that has been used to extract the material. However, this is difficult in practice because every saponin standard dissolves only in a limited number of solvents. This often leads to the use of a solvent other than that used for extraction of the material to dissolve the saponin standard, which can result in some errors and inconsistencies in the results obtained. In contrast, the results obtained with the modified protocol are not affected by the nature of the solvent used to dissolve the standard because whatever the solvent is, it is eliminated from the reaction system in the same way the extraction solvent is removed. Therefore, the modified protocol can be applied not only for aescin, used in the present study as the external saponin standard, but also for any other selected saponin standard.
- In the unmodified protocol, the sample extract needs to be diluted so that its saponin content does not cause an absorbance reading that is too high, and therefore, out of the assay’s linear range. In contrast, in the modified protocol, the appropriate concentration of saponin in the reaction mixture can simply be achieved by changing the volume of the sample aliquot added to the test tube prior to evaporating the extraction solvent. Therefore, the modified protocol does not require the sample dilution step, which means that labour and solvents can be saved.
- For the unmodified protocol, when the sample extract contains a highly non-polar solvent, such as hexane or chloroform, it can form a cloudy emulsion with the highly polar vanillin-sulphuric acid solution, and therefore, the saponin content cannot be accurately measured spectrophotometrically. The modified method avoids that problem because the solvent contained in the extract is evaporated away and not present when the polar vanillin-sulphuric acid solution is added and therefore possible emulsification is prevented.
4.4. Implementation of the Modified Vanillin-Sulphuric Acid Method
For the modified protocol to best work and be consistently performed across laboratories, the following should be considered:
- To facilitate the removal of the solvent from the sample extract, a small volume of undiluted sample (high concentration) is recommended.
- If the saponins in the sample extract are heat- and/or oxidation-sensitive, a stream of an inert gas (e.g., nitrogen or helium) can be used to evaporate the extraction solvent instead of using a hot water bath.
- When building up the standard curve for saponin standards other than aescin, the concentration of the standard stock solution and the volume of each diluted standard solution can be adjusted so that the absorbance readings fall within the absorbance linear range of the spectrophotometer used.
- When the volume of the sample used (V µL) is not 25 µL, the concentration value calculated from the calibration curve needs to be multiplied by a normalisation factor of 25/V to obtain the final saponin concentration in the extract, which can then be used to determine the TSC of the extracted plant material.
5. Conclusions
This study demonstrated that the current method for the vanillin-acid sulphuric assay was not appropriate to use for extracts in solvents such as methanol, acetone, butanol, acetonitrile, ethyl acetate, dichloromethane, diethyl ether, chloroform and hexane. Therefore, to improve the existing method, a solvent evaporation step was added prior to the reaction step to eliminate any undesired effects of the extraction solvent. The improved protocol is simpler, requires less labour and solvent for dilutions, and most importantly, eliminates any possible interference by the extraction solvent. Therefore, this improved method is recommended for quantifying the TSC of extracted plant materials.
Author Contributions
Conceptualization, A.V.L., M.H.N. and P.D.R.; Methodology, A.V.L.; Validation, A.V.L.; Formal Analysis, A.V.L.; Investigation, A.V.L.; Data Curation, A.V.L. and P.D.R.; Writing-Original Draft Preparation, A.V.L.; Writing-Review & Editing, P.D.R., M.H.N. and S.E.P.; Supervision, P.D.R., M.H.N. and S.E.P.
Funding
This research received no external funding.
Acknowledgments
A.V.L. acknowledges the University of Newcastle and VIED for their financial support.
Conflicts of Interest
The authors declare no conflict of interest.
References
- Hostettmann, K.; Marston, A. Chemistry and Pharmacology of Natural Products, Saponin; Cambridge University Press: Cambridge, UK, 1995; ISBN 0-521-32970-1. [Google Scholar]
- Sparg, S.; Light, M.; Van Staden, J. Biological activities and distribution of plant saponins. J. Ethnopharmacol. 2004, 94, 219–243. [Google Scholar] [CrossRef] [PubMed]
- Güçlü-Üstündağ, Ö.; Mazza, G. Saponins: Properties, applications and processing. Crit. Rev. Food Sci. Nutr. 2007, 47, 231–258. [Google Scholar] [CrossRef] [PubMed]
- Cheok, C.Y.; Salman, H.A.K.; Sulaiman, R. Extraction and quantification of saponins: A review. Food Res. Int. 2014, 59, 16–40. [Google Scholar] [CrossRef]
- Gestetner, B.; Birk, Y.; Bondi, A.; Tencer, Y. Soya bean saponins—VII: A method for the determination of sapogenin and saponin contents in soya beans. Phytochemistry 1966, 5, 803–806. [Google Scholar] [CrossRef]
- Baccou, J.; Lambert, F.; Sauvaire, Y. Spectrophotometric method for the determination of total steroidal sapogenin. Analyst 1977, 102, 458–465. [Google Scholar] [CrossRef] [PubMed]
- Hiai, S.; Oura, H.; Hamanaka, H.; Odaka, Y. A color reaction of panaxadiol with vanillin and sulfuric acid. Planta Med. 1975, 28, 131–138. [Google Scholar] [CrossRef] [PubMed]
- Oleszek, W.; Bialy, Z. Chromatographic determination of plant saponins—an update (2002–2005). J Chromatogr. A 2006, 1112, 78–91. [Google Scholar] [CrossRef] [PubMed]
- Oleszek, W. Chromatographic determination of plant saponins. J. Chromatogr. A 2002, 967, 147–162. [Google Scholar] [CrossRef]
- Hiai, S.; Oura, H.; Odaka, Y.; Nakajima, T. A colorimetric estimation of Ginseng saponins. Planta Med. 1975, 28, 363–369. [Google Scholar] [CrossRef] [PubMed]
- Tan, S.P.; Vuong, Q.V.; Stathopoulos, C.E.; Parks, S.E.; Roach, P.D. Optimized aqueous extraction of saponins from bitter melon for production of a saponin-enriched bitter melon powder. J. Food Sci. 2014, 79, E1372–E1381. [Google Scholar] [CrossRef] [PubMed]
- Hiai, S.; Oura, H.; Nakajima, T. Color reaction of some sapogenins and saponins with vanillin and sulfuric acid. Planta Med. 1976, 29, 116–122. [Google Scholar] [CrossRef] [PubMed]
- Wu, J.; Lin, L.; Chau, F.T. Ultrasound-assisted extraction of ginseng saponins from ginseng roots and cultured ginseng cells. Ultrason. Sonochem. 2001, 8, 347–352. [Google Scholar] [CrossRef]
- Oleszek, W.A. Composition and quantitation of saponins in alfalfa (Medicago sativa L.) seedlings. J. Agric. Food Chem. 1998, 46, 960–962. [Google Scholar] [CrossRef]
- Habicht, S.D.; Kind, V.; Rudloff, S.; Borsch, C.; Mueller, A.S.; Pallauf, J.; Yang, R.; Krawinkel, B.M. Quantification of antidiabetic extracts and compounds in bitter gourd varieties. Food Chem. 2011, 126, 172–176. [Google Scholar] [CrossRef]
- Masullo, M.; Calabria, L.; Gallotta, D.; Pizza, C.; Piacente, S. Saponins with highly hydroxylated oleanane-type aglycones from Silphium asteriscus L. Phytochemistry 2014, 97, 70–80. [Google Scholar] [CrossRef] [PubMed]
- Zhao, Y.; Wang, X.; Wang, H.; Liu, T.; Xin, Z. Two new noroleanane-type triterpene saponins from the methanol extract of Salicornia herbacea. Food Chem. 2014, 151, 101–109. [Google Scholar] [CrossRef] [PubMed]
- Abubakar, E.-M.M. Antibacterial activity of crude extracts of Euphorbia hirta against some bacteria associated with enteric infections. J. Med. Plants Res. 2009, 3, 498–505. [Google Scholar]
- Masayo, I.; Hikaru, O.; Tatsuo, Y.; Masako, T.; Yoshie, R.; Shuji, H.; Kunihide, M.; Ryuichi, H. Studies on the constituents of Momordica cochinchinensis Spreng. I. Isolation and characterization of the seed saponins, Momordica saponins I and II. Chem. Pharm. Bull. 1985, 33, 464–478. [Google Scholar] [CrossRef]
- Nguyen, V.T.; Vuong, Q.V.; Bowyer, M.C.; Van Altena, I.A.; Scarlett, C.J. Microwave-assisted extraction for saponins and antioxidant capacity from Xao Tam Phan (Paramignya trimera) Root. J. Food Process. Preserv. 2017, 41. [Google Scholar] [CrossRef]
- Kane, S.M.; Timonen, R.S.; Leu, M.-T. Heterogeneous chemistry of acetone in sulfuric acid solutions: implications for the upper troposphere. J. Phys. Chem. A 1999, 103, 9259–9265. [Google Scholar] [CrossRef]
- Reichardt, C.; Welton, T. Solvents and Solvent Effects in Organic Chemistry; John Wiley & Sons: Weinheim, Germany, 2011; ISBN 9783527324736. [Google Scholar]
- Bhuyan, D.J.; Vuong, Q.V.; Chalmers, A.C.; van Altena, I.A.; Bowyer, M.C.; Scarlett, C.J. Investigation of phytochemicals and antioxidant capacity of selected Eucalyptus species using conventional extraction. Chem. Pap. 2016, 70, 567–575. [Google Scholar] [CrossRef]
- Van Loon, L.L.; Allen, H.C. Methanol reaction with sulfuric acid: A vibrational spectroscopic study. J. Phys. Chem. B 2004, 108, 17666–17674. [Google Scholar] [CrossRef]
- Ota, K.I.; Nakagawa, Y.; Takahashi, M. Reaction products of anodic oxidation of methanol in sulfuric acid solution. J. Electroanal. Chem. Interface Electrochem. 1984, 179, 179–186. [Google Scholar] [CrossRef]
- Pham, H.N.T.; Bowyer, M.C.; van Altena, I.A.; Scarlett, C.J. Influence of solvents and novel extraction methods on bioactive compounds and antioxidant capacity of Phyllanthus amarus. Chem. Pap. 2016, 70, 556–566. [Google Scholar] [CrossRef]
- Van Tang, N.; Bowyer, M.C.; Van Vuong, Q.; Van Altena, I.A.; Scarlett, C.J. Phytochemicals and antioxidant capacity of Xao tam phan (Paramignya trimera) root as affected by various solvents and extraction methods. Ind. Crops Prod. 2015, 67, 192–200. [Google Scholar] [CrossRef]
- Pham, H.N.T.; Nguyen, V.; Vuong, Q.; Bowyer, M.C.; Scarlett, C.J. Bioactive compound yield and antioxidant capacity of Helicteres hirsuta Lour. stem as affected by various solvents and drying methods. J. Food. Process Preserv. 2017, 41, e12879. [Google Scholar] [CrossRef]
- Pham, H.N.T.; Nguyen, V.T.; Vuong, Q.V.; Bowyer, M.C.; Scarlett, C.J. Effect of extraction solvents and drying methods on the physicochemical and antioxidant properties of Helicteres hirsuta Lour. leaves. Technologies 2015, 3, 285–301. [Google Scholar] [CrossRef]
- Pham, H.N.T.; Vuong, Q.V.; Bowyer, M.C.; Scarlett, C.J. Effect of extraction solvents and thermal drying methods on bioactive compounds and antioxidant properties of Catharanthus roseus (L.) G. Don (Patricia White cultivar). J. Food Process. Preserv. 2015, 3, 285–301. [Google Scholar] [CrossRef]
- Nguyen, V.T.; Sakoff, J.A.; Scarlett, C.J. Physicochemical properties, antioxidant and anti-proliferative capacities of dried leaf and its extract from Xao tam phan (Paramignya trimera). Chem. Biodivers. 2017, 14. [Google Scholar] [CrossRef] [PubMed]
- Barve, K.; Laddha, K.; Jayakumar, B. Extraction of saponins from Safed Musli. Pharmacogn. J. 2010, 2, 561–564. [Google Scholar] [CrossRef]
- Ngo, T.V.; Scarlett, C.J.; Bowyer, M.C.; Ngo, P.D.; Vuong, Q.V. Impact of different extraction solvents on bioactive compounds and antioxidant capacity from the root of Salacia chinensis L. J. Food Qual. 2017, 2017. [Google Scholar] [CrossRef]
Figure 1.
The effect of the indicated solvents on the absorbance of the reagent blank at 560 nm for the vanillin-sulphuric acid method. The values are the means of three replicates for each reaction. Columns not sharing the same superscript letter are significantly different at p < 0.05.
Figure 1.
The effect of the indicated solvents on the absorbance of the reagent blank at 560 nm for the vanillin-sulphuric acid method. The values are the means of three replicates for each reaction. Columns not sharing the same superscript letter are significantly different at p < 0.05.

Figure 2.
Standard curves for aescin as prepared in four ways as described in Section 2.2.3, and assayed using the unmodified vanillin-sulphuric acid method described in Section 2.2.1. Line 1: Aescin dissolved and diluted in ethanol; Y = 0.0013X – 0.0302 (R2 = 0.9984); Line 2: Aescin dissolved and diluted in water; Y = 0.0015X + 0.0309 (R2 = 0.9997); Line 3: Aescin dissolved in ethanol and diluted in water; Y = 0.0016X – 0.0067 (R2 = 0.9999); Line 4: Aescin dissolved in methanol and diluted in water; Y = 0.0028X + 0.0491 (R2 = 0.9991).

Figure 3.
Standard curve for aescin using the modified vanillin-sulphuric acid method (Y = 0.00012X + 0.0008 (R2 = 0.9999)).
Figure 3.
Standard curve for aescin using the modified vanillin-sulphuric acid method (Y = 0.00012X + 0.0008 (R2 = 0.9999)).
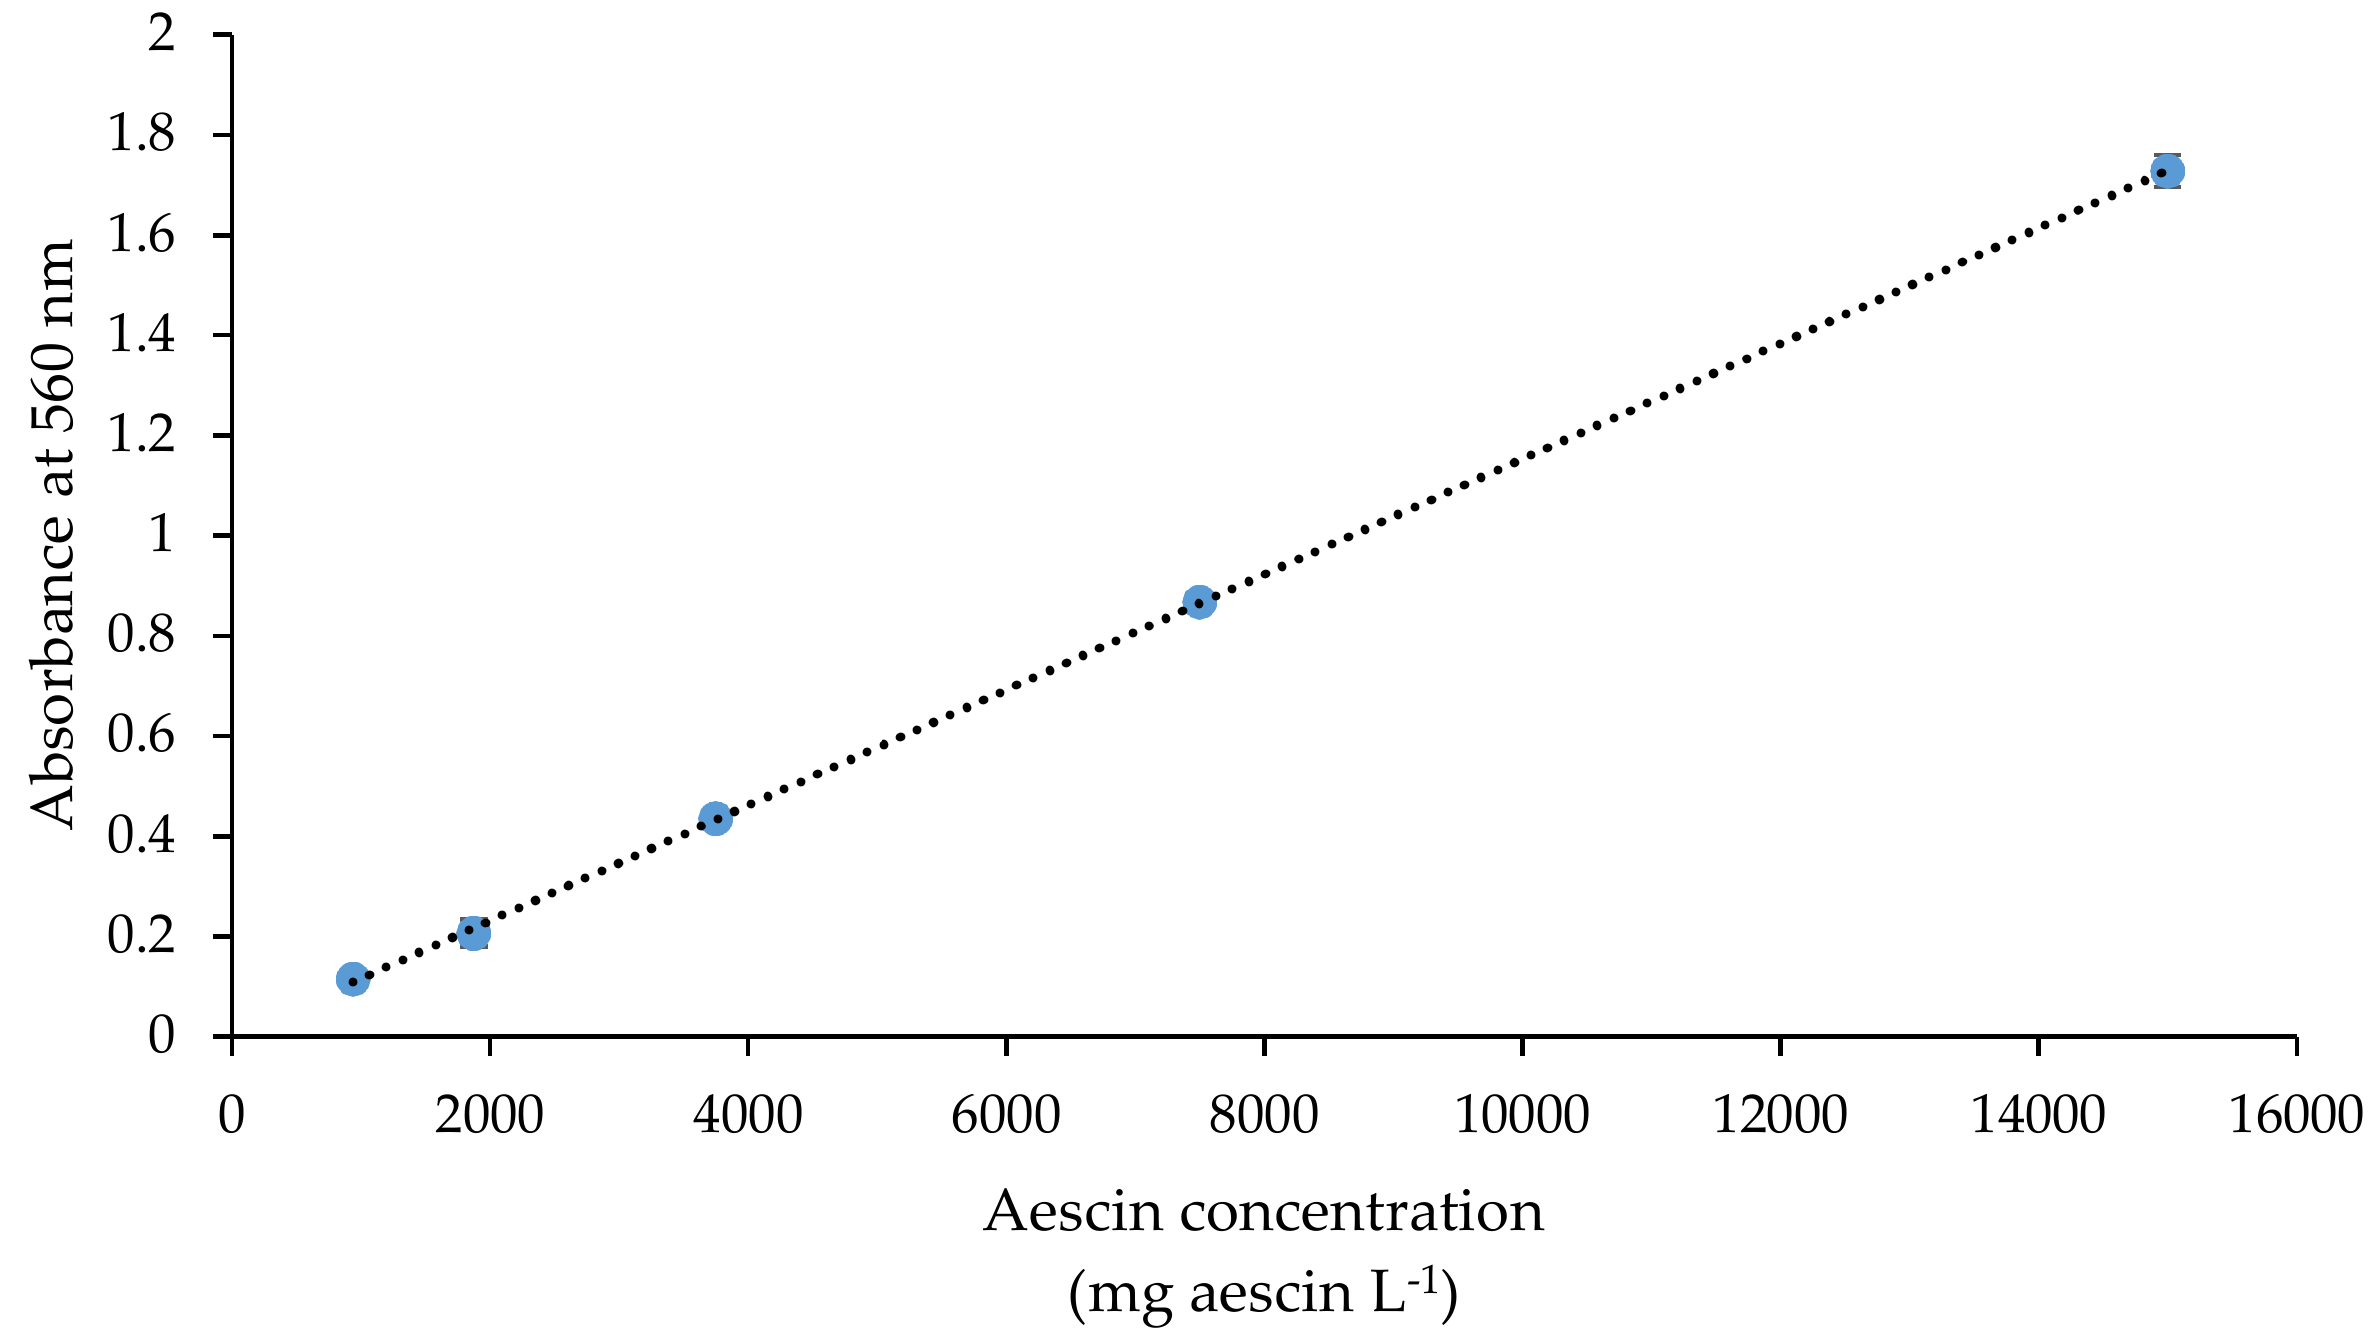
Figure 4.
The total saponin content (TSC) of the Gac (Momordica cochinchinensis Spreng) seed kernel powder determined using ethanol as the extraction solvent and the modified method with the aescin standard curve in Figure 3 (M) and the unmodified method with the four aescin standard curves in Figure 2 (1–4). The values are the means of three replicates for each extraction. Columns not sharing the same superscript letter are significantly different at p < 0.05.


Table 1.
The vanillin-sulphuric acid assay setup procedure.
| Component | Reagent Blank (mL) | Standards (mL) | Samples (mL) |
|---|---|---|---|
| Extraction Solvent | 0.25 | - | - |
| Standards in Extraction Solvent | - | 0.25 | - |
| Sample in Extraction Solvent | - | - | 0.25 |
| Vanillin 8% (w/v) in Ethanol | 0.25 | 0.25 | 0.25 |
| Sulphuric acid 72% (v/v) in Water | 2.50 | 2.50 | 2.50 |
Table 2.
The setup procedure for testing different extraction solvents in the reagent blank.
| Component | Zeroing Blank (mL) | Reagent Blank (mL) |
|---|---|---|
| Deionised Water | 0.25 | - |
| Extraction Solvent (absolute) | - | 0.25 |
| Vanillin 8% (w/v) in Ethanol | 0.25 | 0.25 |
| Sulphuric acid 72% (v/v) in Water | 2.50 | 2.50 |
Table 3.
The setup procedure for testing different solvents used to prepare saponin (aescin) solutions.
Table 3.
The setup procedure for testing different solvents used to prepare saponin (aescin) solutions.
| Component | Reagent Blank | Aescin Solutions (mL) | |
|---|---|---|---|
| Water Blank (mL) | Ethanol Blank (mL) | ||
| DI water | 0.25 | - | - |
| Ethanol | - | 0.25 | - |
| Aescin solution | - | - | 0.25 |
| Vanillin 8% (w/v) in Ethanol | 0.25 | 0.25 | 0.25 |
| Sulphuric acid 72% (v/v) in Water | 2.50 | 2.50 | 2.50 |
Table 4.
The modified vanillin-sulphuric acid assay setup procedure.
| Component | Reagent Blank (mL) | Standards (mL) | Samples (mL) |
|---|---|---|---|
| Extraction Solvent | 0.025 (removed) | - | - |
| Standards in Methanol | - | 0.025 (removed) | - |
| Sample in Extraction Solvent | - | - | 0.025 (removed) |
| Vanillin 4% (w/v) in Ethanol | 0.500 | 0.500 | 0.500 |
| Sulphuric acid 72% (v/v) in Water | 2.500 | 2.500 | 2.500 |
Table 5.
Preparation of the aescin standard curve for the modified method.
| Standard | Dilution | Concentration (mg L−1) | Absorbance (560 nm) |
|---|---|---|---|
| (1) | Stock solution (no dilution) | 15,000 | 1.7283 ± 0.0321 |
| (2) | 2 mL (1) + 2 mL methanol | 7500 | 0.8674 ± 0.0062 |
| (3) | 2 mL (2) + 2 mL methanol | 3750 | 0.4352 ± 0.0124 |
| (4) | 2 mL (3) + 2 mL methanol | 1875 | 0.2069 ± 0.0265 |
| (5) Blank | 2 mL (4) + 2 mL methanol Methanol only | 937.5 0 | 0.1151 ± 0.0075 Used for zeroing |
Table 6.
Saponin values for the Gac seed kernel powder using ethanol as the extraction solvent and the unmodified and modified vanillin-sulphuric acid methods.
Table 6.
Saponin values for the Gac seed kernel powder using ethanol as the extraction solvent and the unmodified and modified vanillin-sulphuric acid methods.
| Method | Absorbance ‡ | Standard Curve | Saponin ‡ (mg AE L−1) | TSC § (mg AE g−1) |
|---|---|---|---|---|
| Unmodified † | 0.409 ± 0.010 a | Y = 0.0013X – 0.0302 | 3377 ± 77 a | 105.69 ± 2.40 a |
| Modified | 0.410 ± 0.008 a | Y = 0.00012X + 0.0008 | 3411 ± 57 a | 106.77 ± 1.79 a |
† The Unmodified method and aescin standard curve 1 in Figure 2. ‡ Absorbance and Saponin concentration for the ethanol extract. § The TSC for the Gac seed kernel powder. In each column, values not sharing the same superscript letter are significantly different at p < 0.05.
© 2018 by the authors. Licensee MDPI, Basel, Switzerland. This article is an open access article distributed under the terms and conditions of the Creative Commons Attribution (CC BY) license (http://creativecommons.org/licenses/by/4.0/).
Share and Cite
MDPI and ACS Style
V. Le, A.; E. Parks, S.; H. Nguyen, M.; D. Roach, P. Improving the Vanillin-Sulphuric Acid Method for Quantifying Total Saponins. Technologies 2018, 6, 84. https://doi.org/10.3390/technologies6030084
AMA Style
V. Le A, E. Parks S, H. Nguyen M, D. Roach P. Improving the Vanillin-Sulphuric Acid Method for Quantifying Total Saponins. Technologies. 2018; 6(3):84. https://doi.org/10.3390/technologies6030084
Chicago/Turabian StyleV. Le, Anh, Sophie E. Parks, Minh H. Nguyen, and Paul D. Roach. 2018. "Improving the Vanillin-Sulphuric Acid Method for Quantifying Total Saponins" Technologies 6, no. 3: 84. https://doi.org/10.3390/technologies6030084
Note that from the first issue of 2016, this journal uses article numbers instead of page numbers. See further details here.