Teaching Enzyme Activity to the Visual Impaired and Blind Students

Programa de Educação, Gestão e Difusão em Biociências, Instituto de Bioquímica Médica, Universidade Federal do Rio de Janeiro, Rio de Janeiro 21941-902, RJ, Brazil
*
Author to whom correspondence should be addressed.
Technologies 2017, 5(3), 52; https://doi.org/10.3390/technologies5030052
Submission received: 17 May 2017
/
Revised: 1 August 2017
/
Accepted: 14 August 2017
/
Published: 17 August 2017
(This article belongs to the Special Issue Education Technologies)
Abstract
:Biochemistry requires a high abstraction level, and different approaches should be used to enable the proper understanding of different subjects. In particular, students with visual impairment or blindness need special attention, not due to a lack of cognitive skills, but due to the fact that most of the teaching methods are visual. Enzyme properties are usually taught through experimental data that show how the activity changes in different conditions, which end up with the analysis of graphs. Therefore, our group developed experiments and graphical representations that enable visually impaired and blind students to understand enzyme properties. The experiments were done with pineapple bromelain, using reconstituted dry milk and gelatin as substrates. The “visualization” of the results were based on the sensation of the viscosity of the samples. The graphs were made with cold porcelain with all the labels (legends and numbers) written in Braille with a positive slate. From our experience with a blind student, both the experiments and the graphic representations were useful adaptations for teaching enzyme properties.
1. Introduction
Teaching Biochemistry is usually a difficult task since it requires a great deal of abstract thinking and different approaches should be used to enable the proper understanding of different subjects [1,2]. In particular, for the visually impaired or blind students, the understanding of Biochemistry can be far more complex, and important adjustments need to be done for their proper inclusion.
Many authors believe that visual literacy is essential in the teaching and learning process in general (for a review see ref. [3]). Schönborn and Anderson [4] emphasize the importance of visual literacy to the understanding of biochemical processes. Locatelli et al. [5] consider visualization as a crucial element in learning chemistry, and suggest the need of “a metavisual capability in all levels and modes of representation to really understand concepts in chemistry”. According to Teruya et al. [6], chemistry knowledge is intrinsically multimodal, implying that for any verbal representation, there is a corresponding visual representation of the content. Costa et al. [7], for instance, indorse that “computational Biology and Bioinformatics are indispensable components in the training of life scientists”.
On the other hand, interesting suggestions in chemistry education for students with disabilities have been reported [8,9,10,11,12]. As Miner et al. [8] pointed out, visual impairment occurs in different forms and degrees of severity, which demands flexibility. These authors also call attention to the fact that visually impaired students are not helpless, and suggest that simple accommodations should be pursued for a full participation of the student.
Hiemenz and Pfeifer [9] described an adaptation of a triple-beam balance where pre-determined weights are notched, causing a clicking noise as the weight slides over the notched beam, which allows the students to weight objects with an uncertainty of 0.2 g. Supalo et al. [10,11,12] show that the instructors can use some simple resources to teach chemistry to the blind and visually impaired students. For instance, the use of a slate, tracing wheel, hot glue, and thermo pen to make tactile drawings [10], or commercially available techniques to represent graphs or organic molecules [11], in addition to a plastic syringe with calibrated volumes notched in the plastic pull tab [12].
Computer based assisted technologies to teach science to visually impaired and blind students have been reported since the early 1980s [13,14,15,16,17,18]. The microcomputer-based Universal Laboratory Training and Research Aid (ULTRA) was developed to aid blind students in undergraduate chemistry laboratories, and could be interfaced with a wide variety of instruments and sensors that provided an analog signal for a chart recorder or a digital output [13,14]. Later on, Morrison et al. [15] described extensions made to the ULTRA system by adapting it to accept voice commands, the Voice-Operated Isolated Command Entry (VOICE) terminal. Tomlinson et al. [16] developed the software Graph and Number line Input and Exploration software (GNIE), of auditory graphs that present an alternative to visual graphs to teach mathematics. Successful applications of the Sci-Voice Talking LabQuest software to engage visual impaired and blind students in hands-on science learning activities have also been reported [17,18]. It has been suggested by Supalo et al. [19] that the use of Job Access with Speech (JAWS), combined with data collection software to enable blind and visually impaired students to read data aloud. Nevertheless, Johnson and Ruppert [20] reported a few problems related to JAWS that compromised its use by persons with disabilities.
In this work, we will focus on a case study of one undergraduate blind student of Biology from a distance education division of our University that enrolled Biochemistry 1, at the Center of Distance Education of the State of Rio de Janeiro (CEDERJ). CEDERJ offers 15 higher education courses in 33 core units widespread throughout the State of Rio de Janeiro. Tutoring support is provided from both distance and face-to-face interactions. The distance communication between students and tutors occurs in a learning platform based on Moodle, or by a toll-free number. There are two types of face-to-face components in these courses, and laboratory classes are compulsory activities.
Biochemistry 1 offers a weekly 4 hours face-to-face meeting (optional), and two laboratory classes (compulsory) during one academic term of one semester. It covers the basics of structure and function of macromolecules, and one of the laboratory classes is about enzymes. Here we show the adaptation of laboratory protocols and 3D graphical representations of enzyme properties to a blind student using low-cost materials. In order to check the enzyme activity, we used samples that could be analyzed by touching. The enzyme source was pineapple juice that is rich in bromelain [21], a cysteine protease. As substrates, we used gelatin and reconstituted powdered milk, both good sources of protein.
Gelatin is obtained by heat dissolution at alkaline or acidic pH, and partial hydrolysis of collagen in animal skins, bones and tendons [22]. Gelatin presents colloidal properties, and it is a sol (resembles a liquid) at temperatures higher than 35 °C, and is a gel when cooled. An additional hydrolysis of the peptides in the gelatin solution by bromelain prevents gel formation, even at low temperatures.
Casein, the major protein in milk, is a complex set of different proteins that form large colloidal particles called casein micelles [23]. Fluorescence light scattering suggested that submicellar aggregates containing 20–30 monomers associated to form micelles, in which hydrophobic interactions play an important role [24]. Therefore, hydrolysis of the casein micelle exposes their hydrophobic interior, which, in turn, leads to milk clot.
2. Procedures
2.1. Preparation of Pineapple Juice and Gelatin
Pineapple chunks were blended until a smooth purée was formed (100 g pineapple flesh + 10 mL Milli-Q water). Large fibers were separated with a sieve and the remaining juice was filtered in a funnel containing two layers of silk or a Jelly strainer bag. This prep yields about 40 mL of pineapple juice (One medium pineapple yields ~400 mL of juice). The juice can be stored in the freezer for at least two months without significant changes in the bromelain activity.
2.2. Enzyme Activity Using Gelatin as Substrate
A 12 g pack (or two 0.25 oz. packs) (This is the amount in one pack of unflavored gelatin in Brazil. It can be substituted by 2 packs of 0.25 oz. each (~14 g)) of unflavored gelatin was added to 250 mL of boiling water in a 600 mL beaker. After the gelatin was well dissolved, 250 mL of ice-cold water was added. The final solution was at 30 °C and ready to be used in the experiments, in the sol state. Samples of 20 mL of gelatin solution (unset gelatin) were placed in 50 mL centrifuge tubes. In order to start the reaction, 3 mL of fresh pineapple juice was added. The samples were homogenized and then left in the fridge (8–10 °C) for 30 min. After hydrolysis, the gelatin was unable to set in the gel state in the refrigerator, remaining in a liquid state. The consistency of the gelatin was checked by the blind student in two different ways: by feeling the consistency of the samples with glass rods, or by shaking the closed tubes (up and down and/or back and forth). For the experiment of thermal denaturation of the enzyme, 10 mL of pineapple juice was placed in boiling water for 5 min in order to denature the enzyme, and transferred to crushed ice for 5 min before using. Control experiments were done by the addition of water instead of pineapple juice.
2.3. Milk Clot Procedure
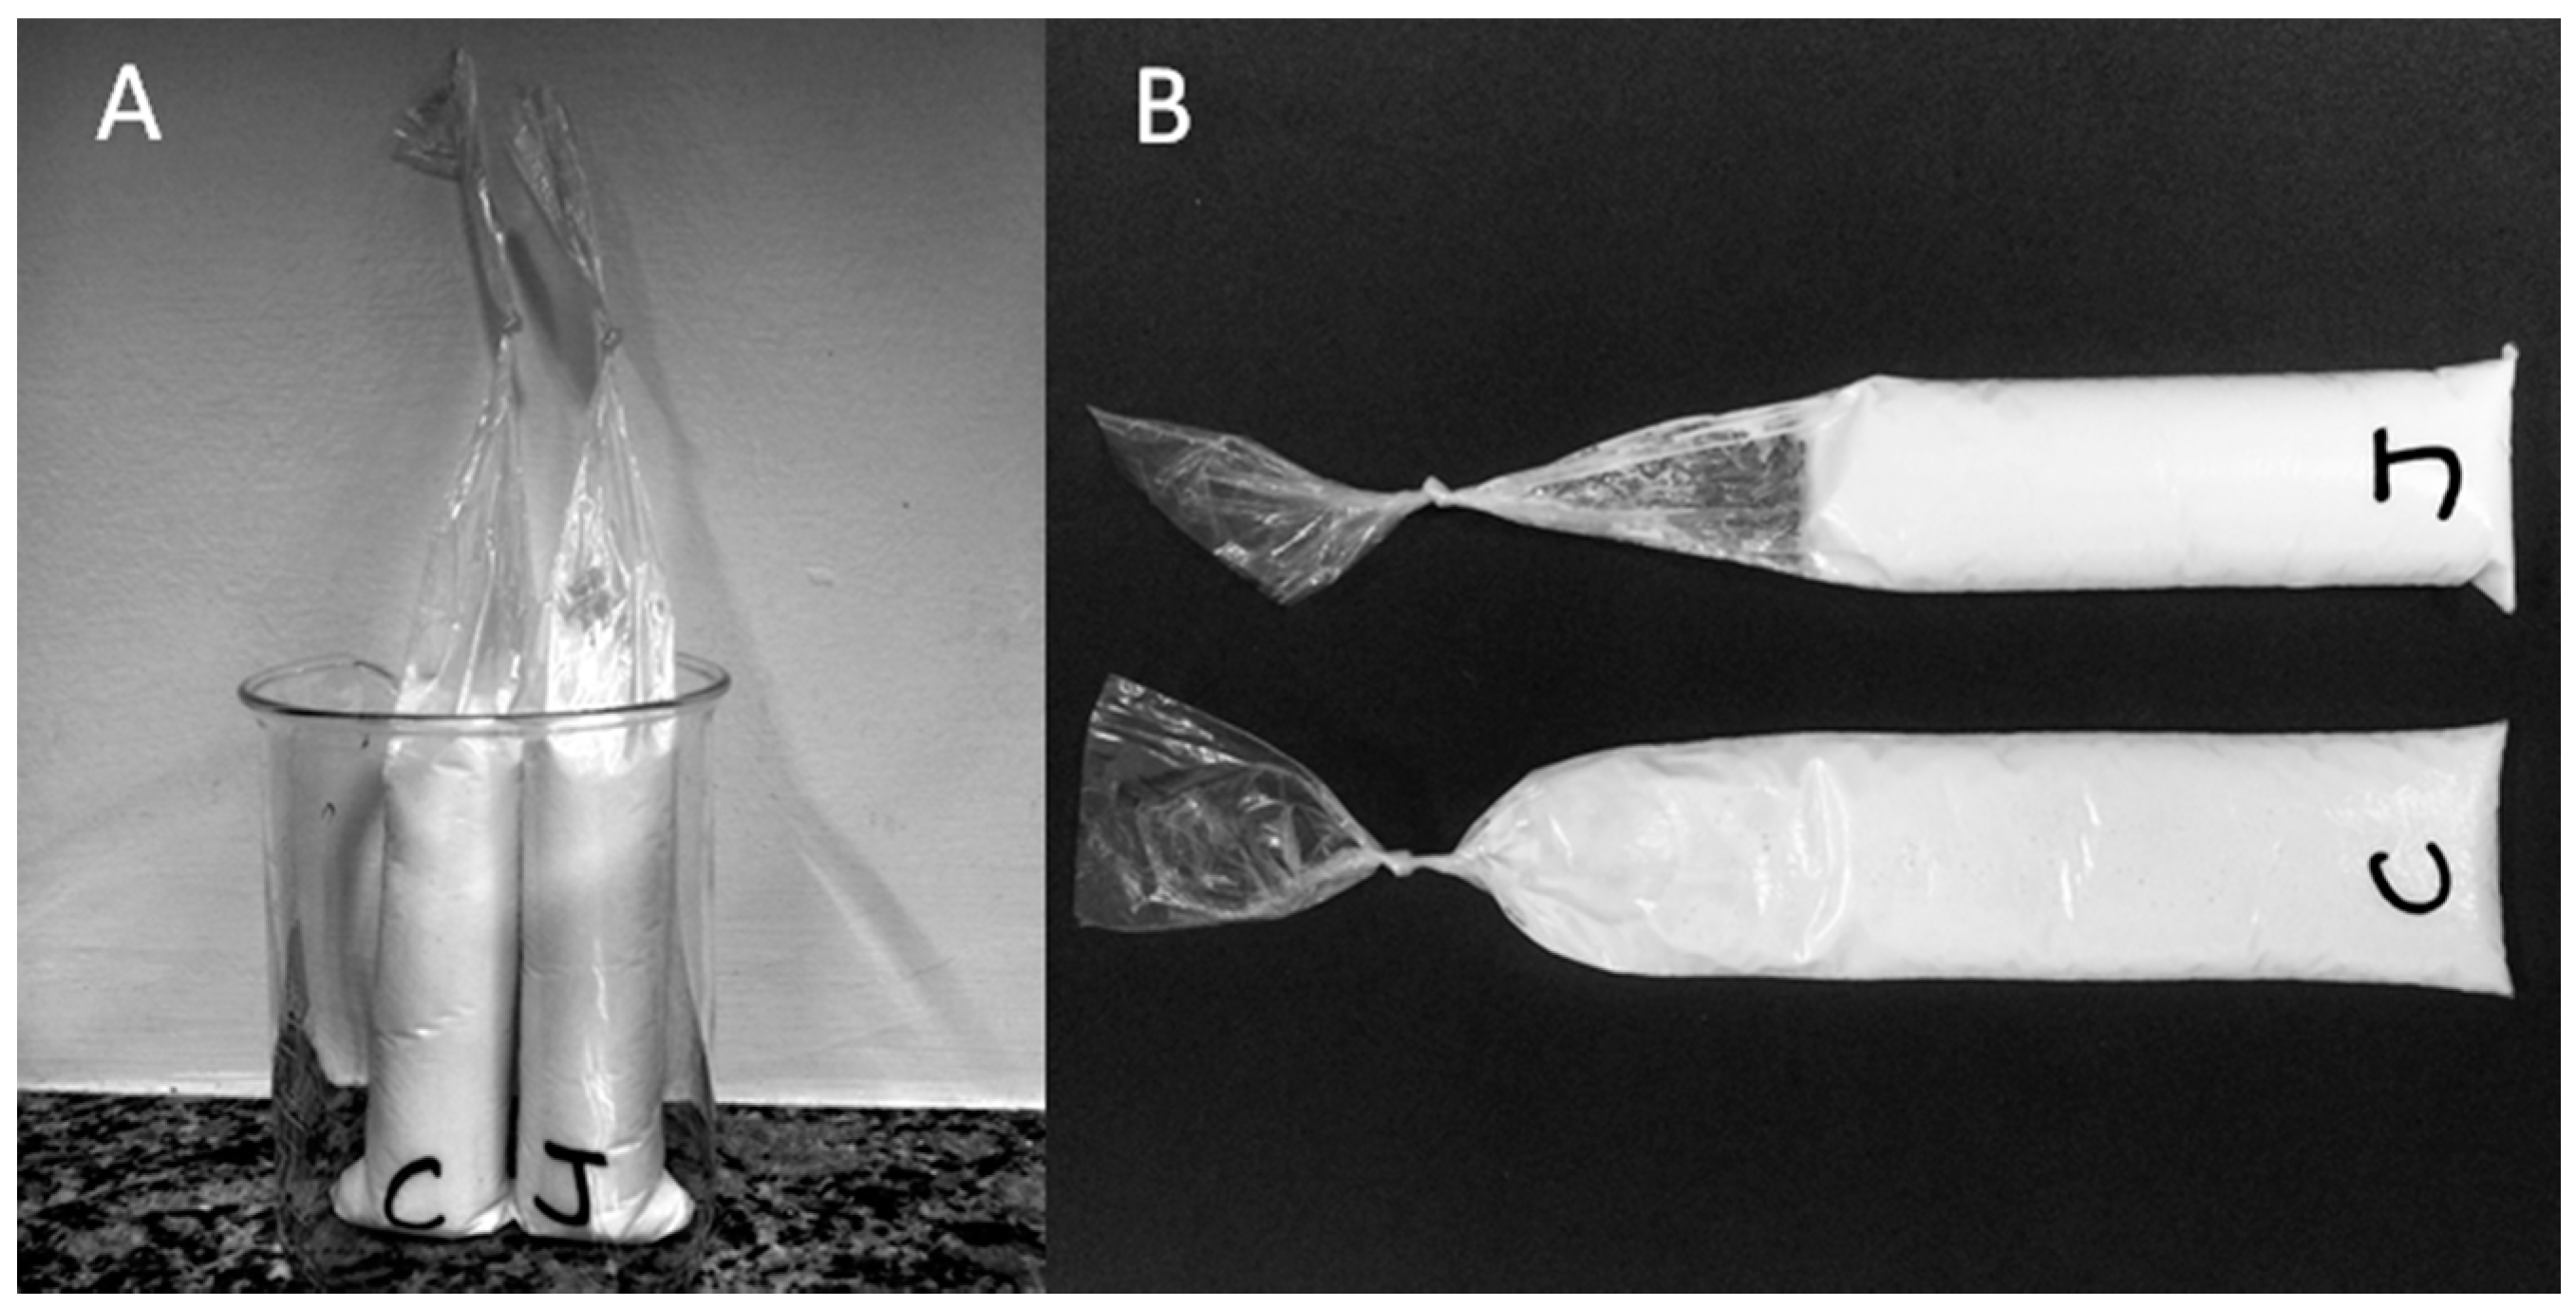
After filling ice candy bags with powdered whole milk with the help of a funnel, we added of Milli-Q water to each bag (see Section 2.4 and Section 2.5 for quantities). Reconstituted dry milk was obtained by hand mixing the samples until the milk was well dissolved. To each bag we added 5 mL of Mill-Q water (control experiments) or fresh pineapple juice. Hand mixing followed every addition until a homogeneous sample was obtained. Before knotting the bag, the excess of air was carefully removed. The bags of the samples containing pineapple juice were marked with a cut in the opening to enable the identification by the blind student (see Figure 1B).
The samples were left inside of a beaker (Figure 1A) on the bench for 20 min at room temperature (22 °C), and the milk consistency was checked by touching the bags. Milk clot was observed in the samples with native bromelain (positive reaction). Figure 1B shows the consistency of the milk in two samples after the reaction took place: in the absence (C) and in the presence (J) of pineapple juice.
2.4. Effect of Enzyme Concentration
This experiment was done with the milk cloth assay. For the reconstitution of powdered milk, four solutions of enzyme in different concentrations were obtained in graduated glass cylinders, as follows: (1) Control: 30 mL of water; (2) 5% Bromelain: 28.5 mL Mill-Q water + 1.5 mL pineapple juice; (3) 10% Bromelain: 27 mL Milli-Q water + 3 mL pineapple juice; and (4) 20% Bromelain: 24 mL Milli-Q water + 6 mL pineapple juice. The solutions were transferred from the cylinders to 4 ice candy bags, containing 20 g of powdered whole milk each. After homogenization, milk consistency was checked every 5 min. It is important to notice that, since the results relies on the verification of the milk consistency by touch, and the student needs to compare all the samples at the same time, this procedure needs the help of other students—we had four students adding the solutions at the same time to the four bags, so the time of the reaction was the same in each sample.
2.5. Effect of Substrate Concentration
Three ice candy bags were filled with 12 g, 16 g, and 20 g of powdered whole milk with the help of a funnel. To each bag, 20 mL of Milli-Q water was added. Reconstituted dry milk was obtained by hand mixing the samples until the milk was well dissolved. To each bag, we added 5 mL fresh juice. The same procedure was done with control samples where 5 mL Milli-Q water was added. Hand mixing followed every addition until a homogeneous sample was obtained. As described above, we carefully took the air out of the bag before tying a knot. The consistency of the milk was checked every 5 min by touching the bags.
2.6. Graphical Representations of the Data
Plots were done with cold porcelain (Lycin Mercantil Industrial, Ltda, São Paulo, SP, Brazil), and glued on 10 × 10 inches boards of medium-density fiberboard (MDF) over graph representations of different enzyme properties, such as the effect of substrate concentration, enzyme concentration, pH, and inhibitor. The graphs were plotted in Origin® 7 (MicroCal, Northampton, MA, USA) and printed without the numbers. The axis and curves were covered with cold porcelain and let dry for 24 h at room temperature (22 °C). The numbers and the legends were written in Braille, with a positive slate from TECE (Tecnologia e Ciência Educacional Ltda). This is a reverse slate that unlike the conventional instrument that allows the writing from left to right in high-relief, when a stylus is pushed against the paper between the two slates. After gluing the paper to the boards, the axes and the curves were done with the help of an extruder for cold porcelain so that every piece was standardized, and the pieces were glued over the drawings.
3. Results
3.1. Thermal Denaturation of Bromelain
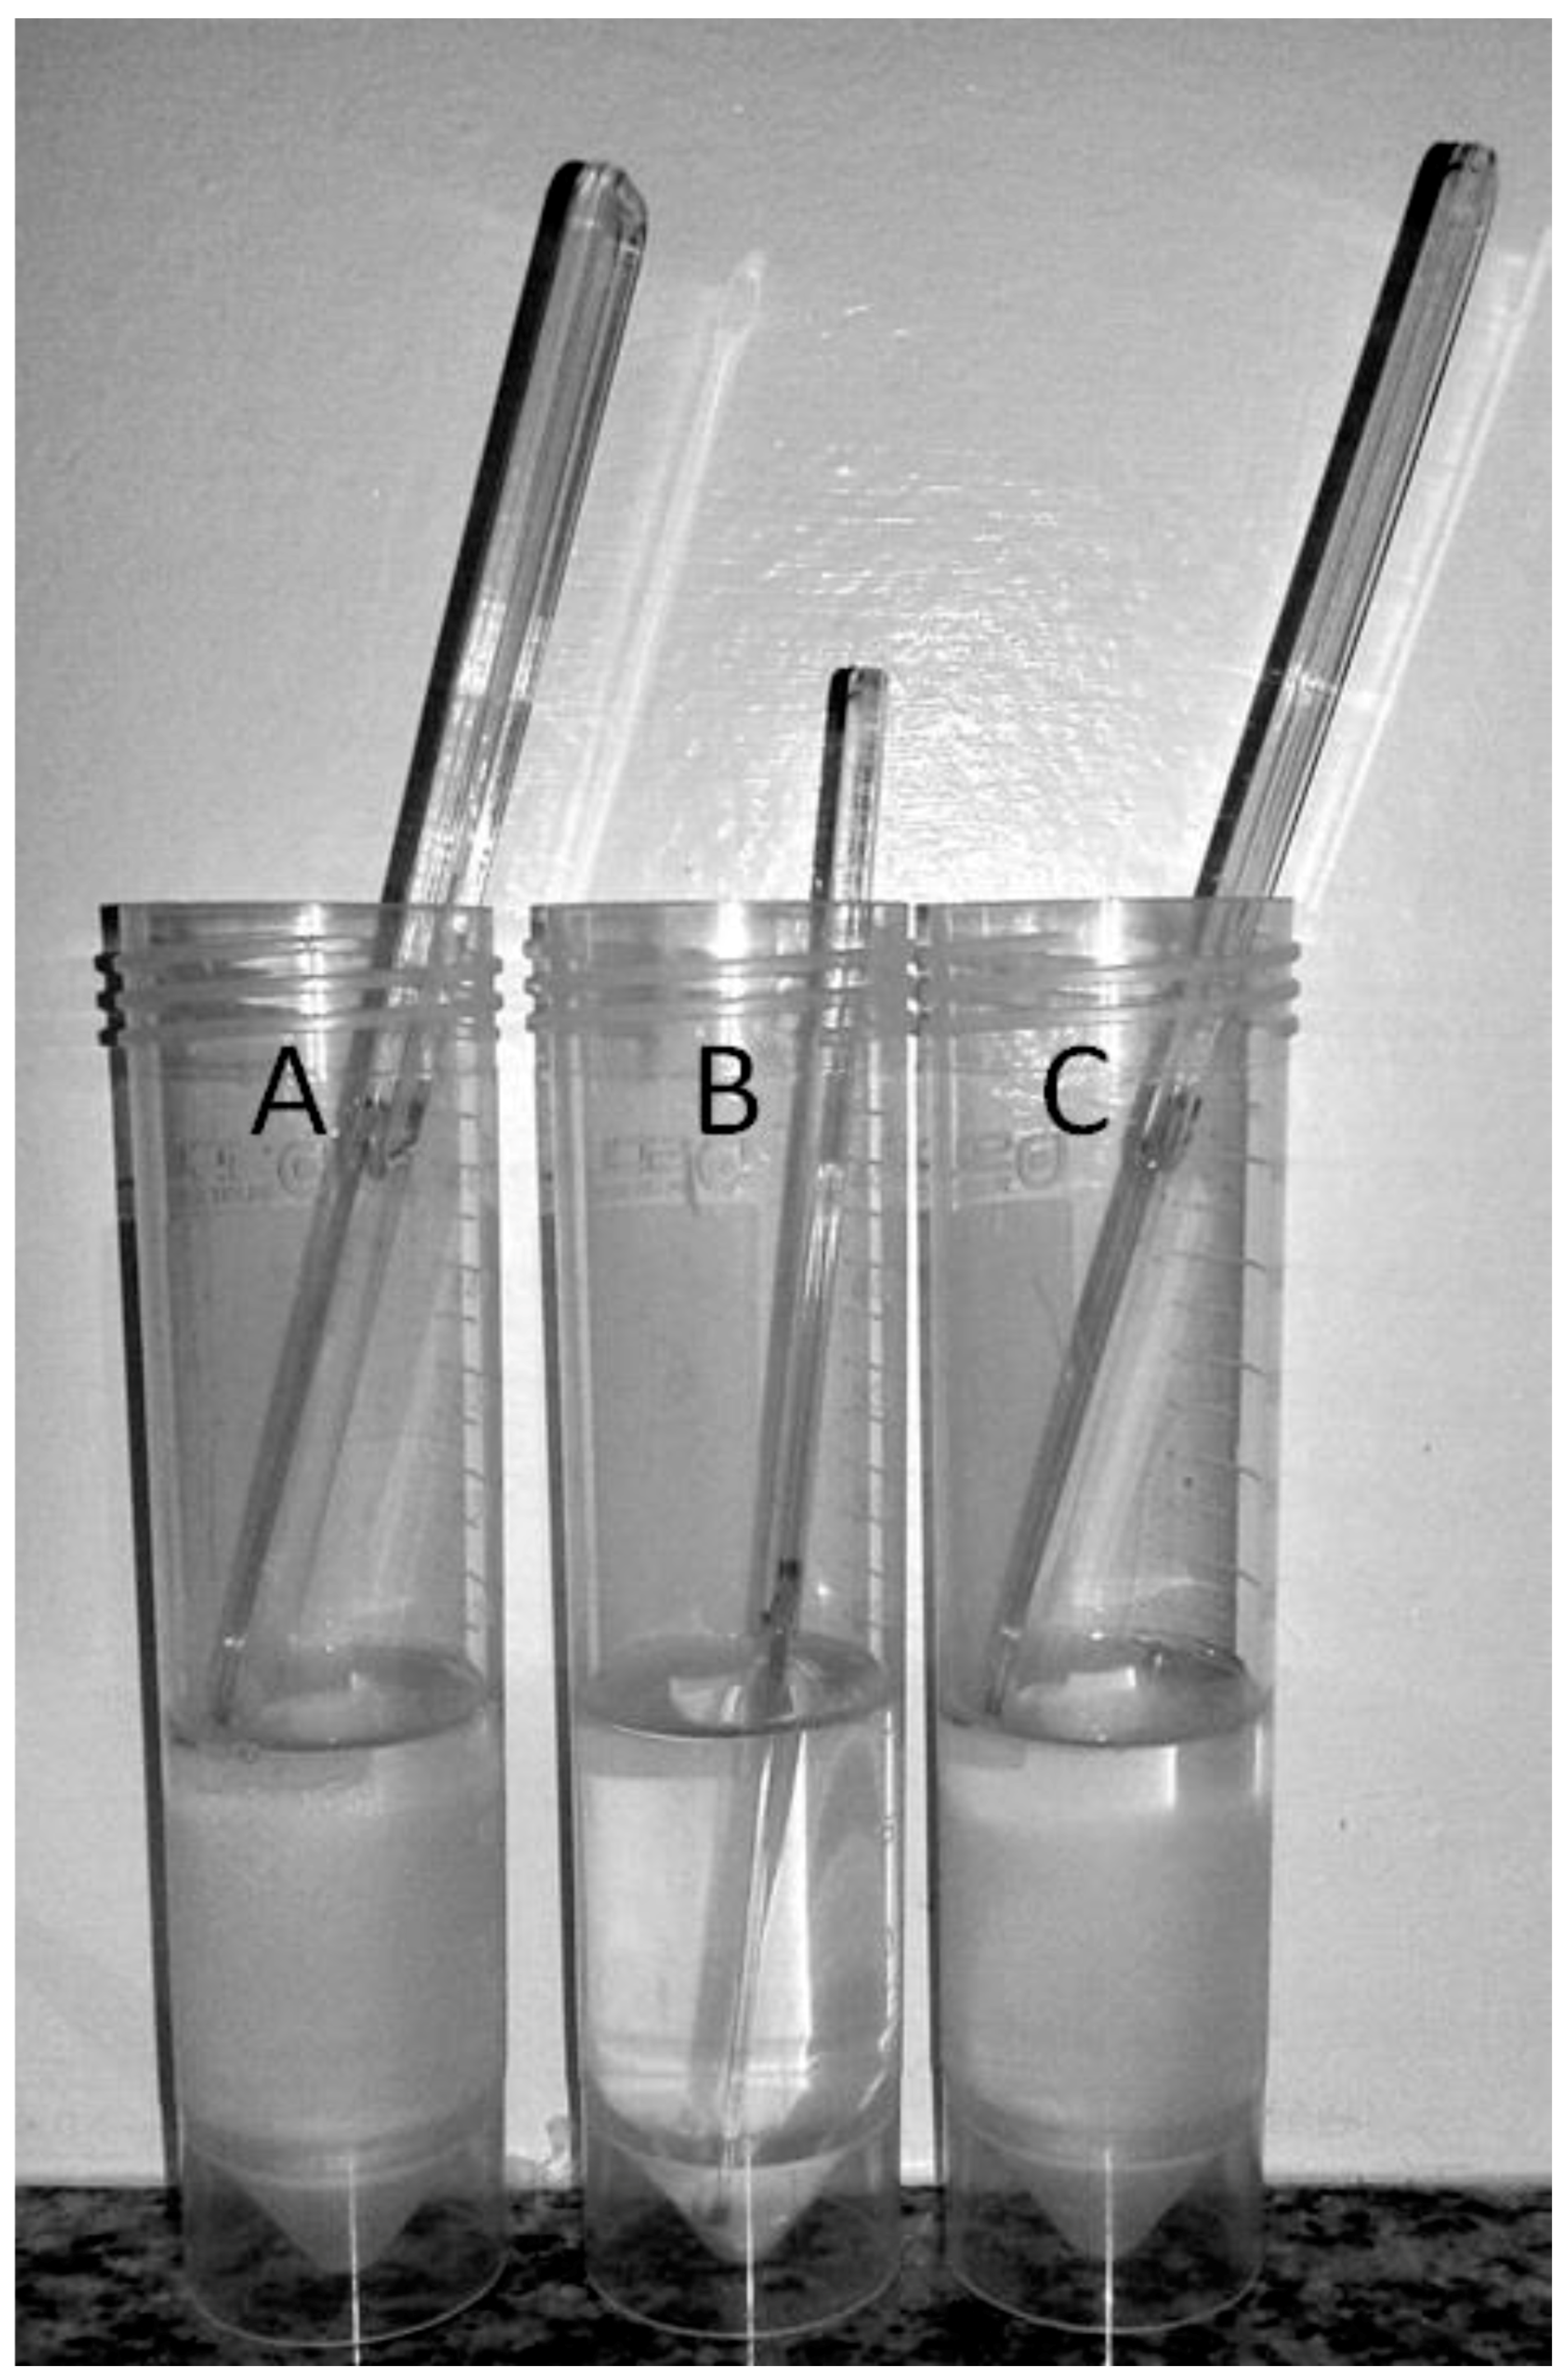
Three samples of 20 mL of gelatin solution (unset gelatin) in 50 mL centrifuge tubes were used. To one tube (Control; Figure 2A), we added 5 mL Milli-Q water; to the second tube (Native Enzyme; Figure 2B) we added 5 mL of fresh pineapple juice, and to the third (Denatured Enzyme; Figure 2C) we added 5 mL of boiled pineapple juice. After 30 min in the refrigerator, the gelatin set in both samples without enzyme (Figure 2A,C), but it was liquid in the sample where hydrolysis occurred (Figure 2B). These samples can be manipulated by shaking up and down or back and forth (closed tubes), or with a glass rod to feel the gelatin consistency. As it can be seen in Figure 2, the glass rod sits on the top of the set gelatin (negative reaction, in A and C) or touches the bottom of the tube when gelatin is liquid (positive enzyme reaction, in B). At the end, the student can also “mix” the samples with the glass rods to check the viscosity.
The thermal denaturation of bromelain can also be confirmed with the milk clot procedure.
3.2. Effect of Enzyme Concentration
This experiment was done by the milk clot assay with four concentrations of bromelain, obtained by dilution of the pineapple juice to 5%, 10%, and 20% as described in the Procedures. After 5 min reaction, milk consistency was checked by touch. It was easily observed that the sample with the lower enzyme concentration was similar to the control sample (no enzyme added). In the other two samples with higher enzyme concentrations, the milk clot was more evident. In the bag with the highest enzyme concentration, the milk consistency was similar to that shown in Figure 1B. As expected, the results showed a linear behavior (r = 0.989) of the time needed for all of the samples to have the assumed consistency for the end of the reaction (Figure 1B): 37.5 min for bromelain 5%, 26.0 min for bromelain 10%, and 8.5 min for bromelain 20%.
3.3. Effect of Substrate Concentration
Reconstituted dry milk was obtained with three concentrations of milk, and the consistencies of the samples were checked by touch. As expected, the reaction was faster as the substrate concentration increased: 14.3 min for the sample containing 12 g of milk, 10.3 min for 16 g of milk, and 8.5 min for 20 g of milk. It is important to note that the reaction did not occur with lower concentrations of milk (10 g or less) in a final volume of 25 mL (20 mL water + 5 mL pineapple juice).
3.4. Using 3D Graphical Representation of Enzyme Properties
Although a limited number of samples were used with the blind student, we used graphic representations of the data obtained by visual students with similar protocols. Figure 3 shows these representations made with cold porcelain of some important properties of enzymes, i.e., the effect of substrate concentration, enzyme concentration, pH, and inhibitor.
Enzymes are proteins that act as biological catalysts, increasing the rate of metabolic reaction by lowering the free energy barrier that separates substrates and products [25]. The rate of an enzyme catalyzed reaction can be increased by a factor of ~105, as observed with human Cyclophilin, to a factor of ~1017, as in the case of Orotidine 5′-phosphate decarboxylase [26].
By keeping a constant enzyme concentration, the rate of the reaction increases with the increase in substrate concentration yielding hyperbolic curves for Michaelis-Menten reactions (Figure 3A). On the other hand, by keeping a high substrate concentration constant, the increase in enzyme concentration leads to a linear increase in reaction rate (Figure 3B). The rate of enzyme catalyzed changes with the pH (Figure 3C) due to changes in the protein conformation or in the degree of protonation of amino acid residues in the active site. Pineapple juice bromelain is active in acidic pH, with an optimum pH range of between 4 and 6 (Figure 3C). For the bromelain inhibition (Figure 3D), we used the juice of potato tubers that is rich in potato cysteine proteinase inhibitor, PCPI [27].
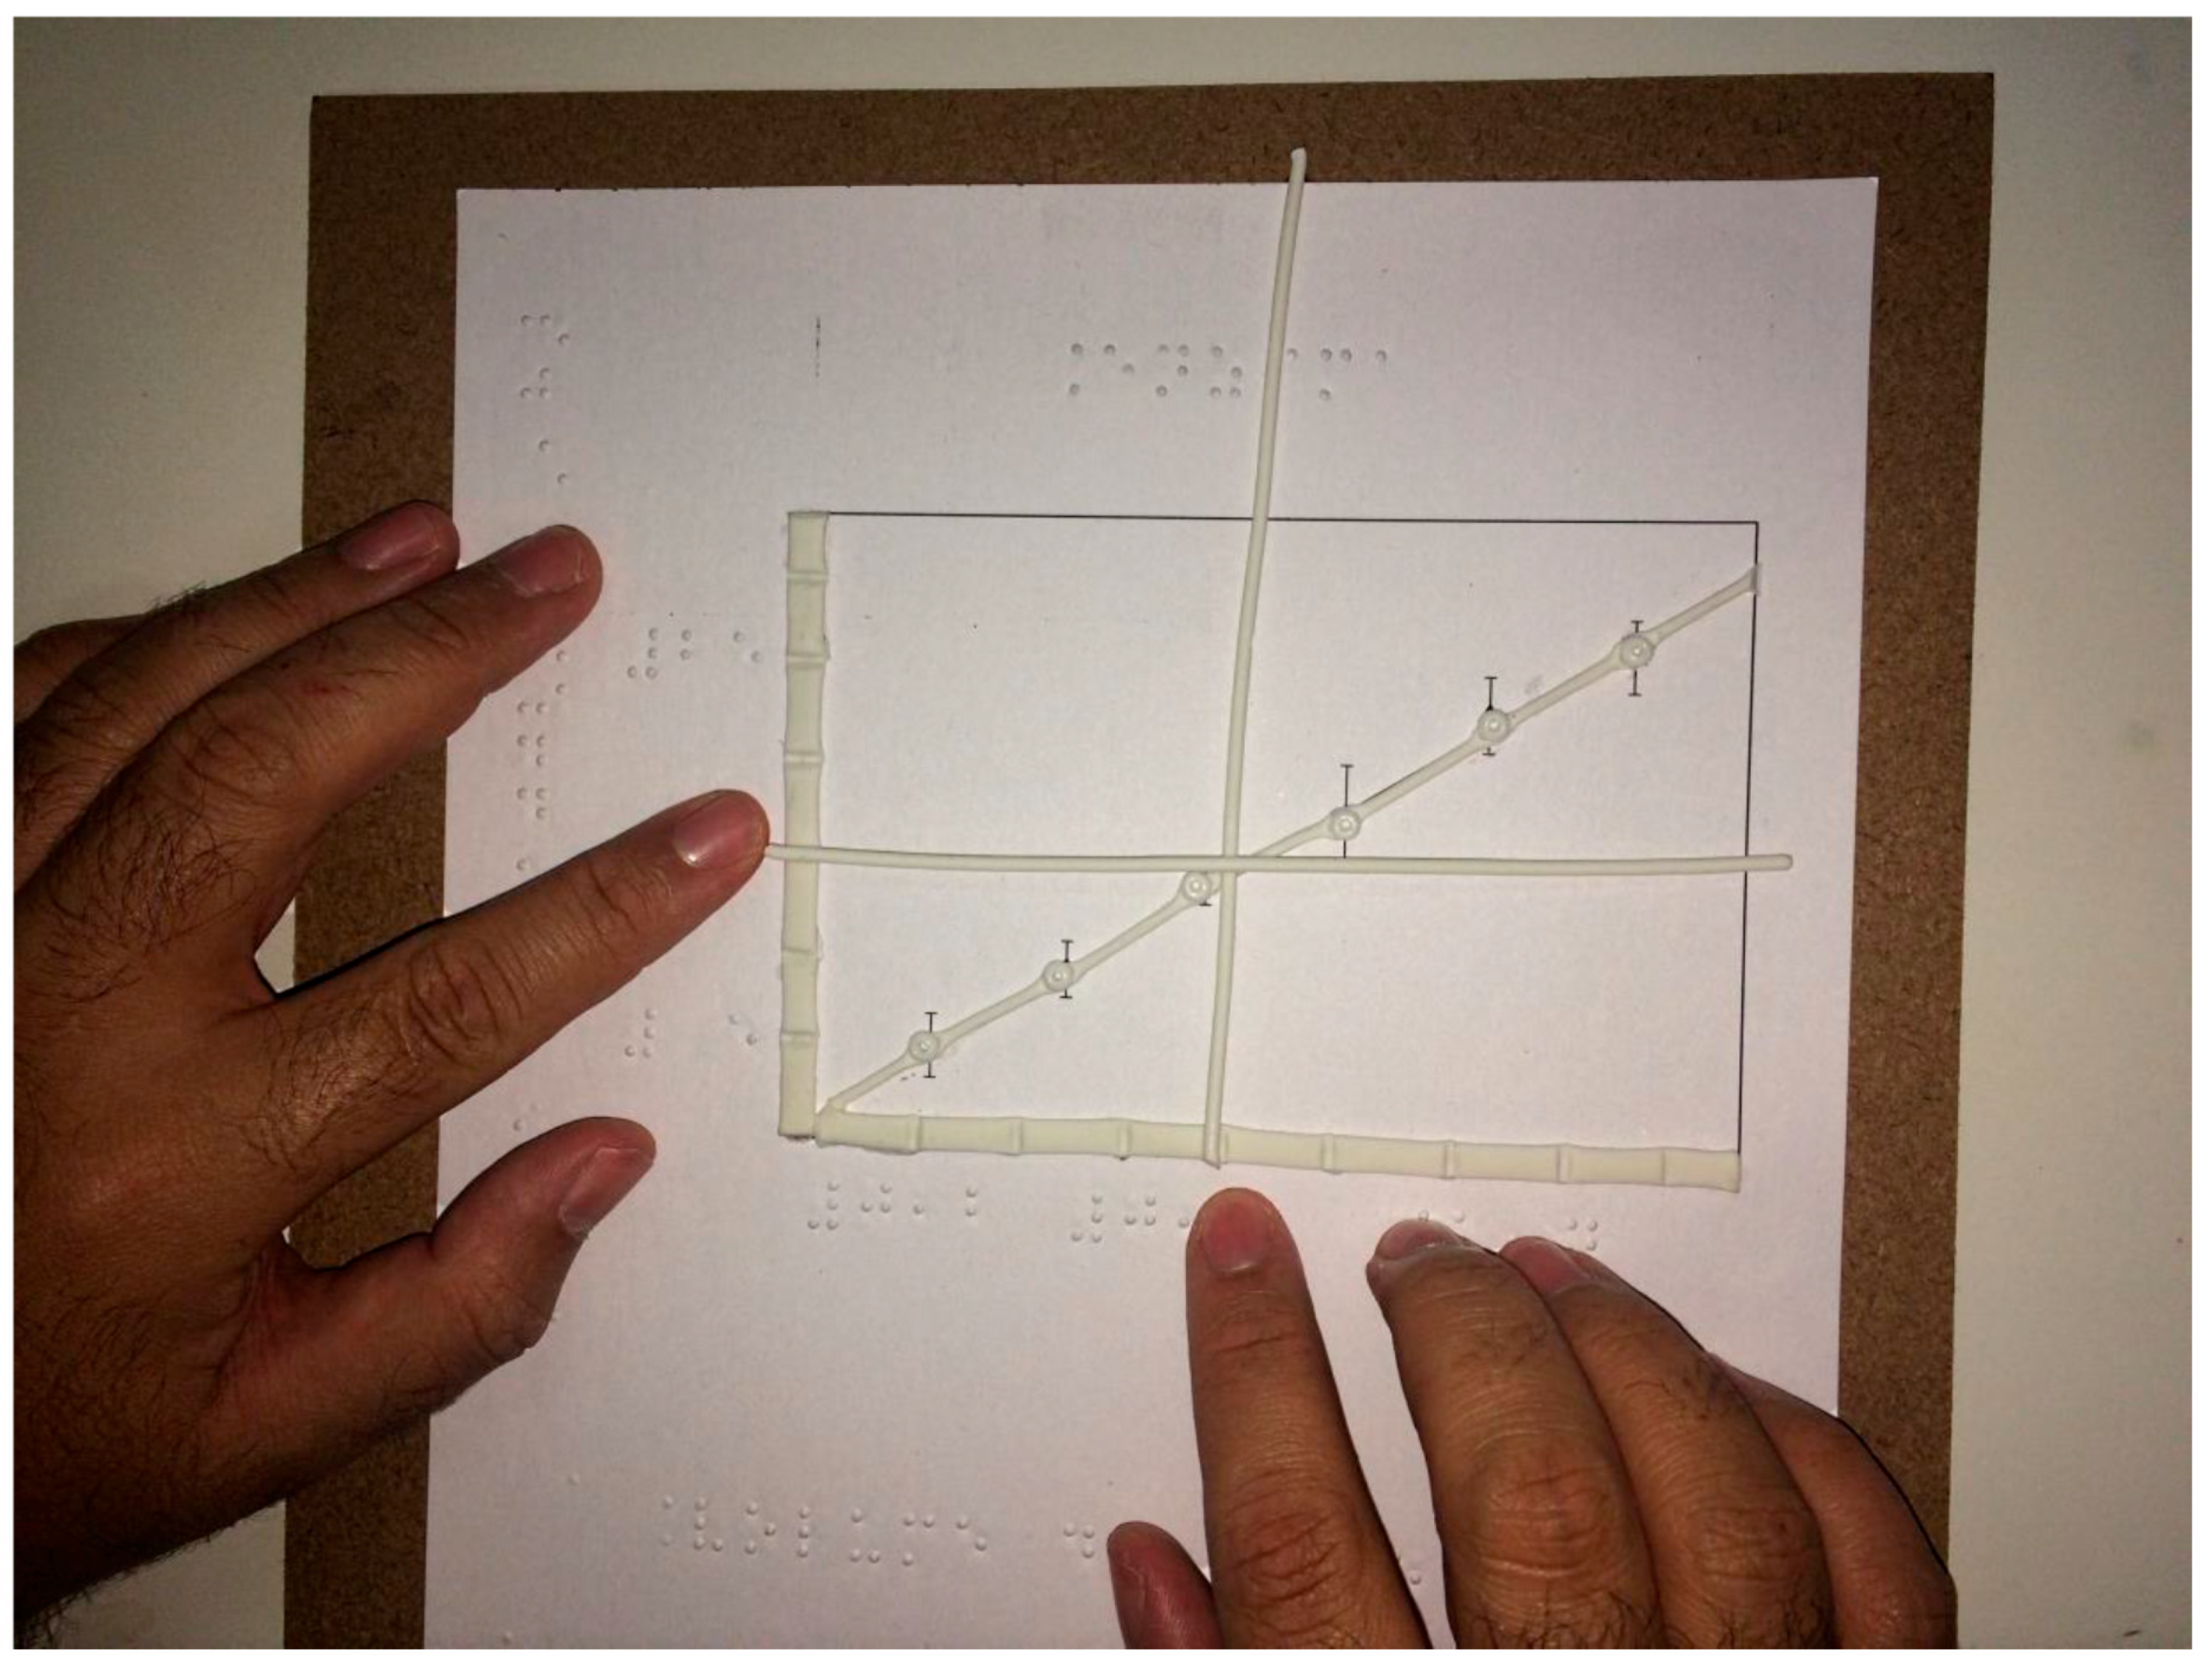
The graphs were plotted in a paper of 180 g/m2 grammage, and the lines (axis and curves) were covered up with cold porcelain. All of the numbers and legends were in Braille, written with a positive slate (TECE). The paper was glued to a piece of medium-density fiberboard (MDF) in order to increase the durability of the 3D graphs. The student was able to recognize the data in the graphs with the help of two guides (20 cm long rods of 1 mm diameter), as shown in Figure 4.
4. Discussion
Educational technologies (ET) seem to be related to the applications of mechanical and material tools, such as computers and software. However, according to Lakhana [28], “a more complex conception of ET includes immaterial tools, such as processes and ways of thinking, (…), whereby technology is not merely processes and tools, but is understood systematically”. This author [20] suggests a broader interpretation of technologies, dismissing myths that limit ET to matters of hardware. In addition, the definition of ET by the Association for Educational Communication & Technology includes both hard and soft technologies, the latter meaning “intellectual processes”, i.e., transformative methods or actions that facilitate learning and performance [28]. In this way, the protocols described here for a blind student can be defined as soft technology.
In order to check the enzyme activity, we used the samples in ice candy bags that could be analyzed by touching. The use of plastic bags to show chemical reactions was already described by Wedler et al. [29] in which the instructors demonstrated a series of endothermic/exothermic, as well as acid−base reactions through the so-called “baggie experiments”.
The enzyme source was pineapple juice that is rich in bromelain [21], a cysteine protease. As substrates, we used gelatin and reconstituted powdered milk. Nevertheless, in the short time to develop the protocols, we decided to have the assistance of a tutor in the preparation of the samples (weighting and/or measuring volumes). However, it would be interesting to use the adapted triple-beam balance [9] and the syringe with notched values in the plastic pull tab [12].
The gelatin, used as a substrate forms a colloidal solution when properly dissolved in water. As a colloid, the gelatin is a sol (liquid) at 35 °C and higher, and a gel at low temperatures. In the absence of bromelain, the gelatin was able to form a gel after 30 min in the refrigerator. However, when hydrolysis took place, the gelatin was unable to form the gel, and the consistency of the sample was liquid. On the contrary, when reconstituted powdered milk was used, casein hydrolysis by bromelain caused precipitation (milk clotting), while the control sample remained liquid.
This is very interesting since opposite effects are seen after hydrolysis of the substrates. The tactile approach allowed for a perfect understanding of the effects of the protease in different proteins, such as the gelatin and casein in milk.
The proper understanding of a graphical representation requires a first step related to data analysis, and a choice of the best plot type (scatter/line/column/bar) that helps to accurately communicate the meaning of the data. Patterson and Leonard [30] suggest that graphical representations involve two different types of thinking: analytical, logical thinking, and creative, holistic thinking.
The ability to read and interpret graphics, for instance, is one of the most difficult tasks for the instructors to teach. Students, in general, are not able to understand the general aspects of a graph and the interpretation of the data in several types of graphical representations. This is far more difficult to the blind or visually impaired student. Therefore, it is crucial that new instructional tools are developed in order to help these students.
Supalo [31] draws attention to the fact that although many new instructional materials, and/or teaching strategies are being developed, they are not intended towards the blind student. Software and models are commonly found, but graphical representations need to be drawn in a paper using an embossed design, and specialized printers are expensive and are never always available. A low-cost strategy suggests the use of a tracing wheel or hot glue to draw a graph [10]. Poon et al. [24] suggested the use of wax-covered string manipulatives to represent molecular formulas, orbitals, and graphs. These authors used a commercial product known as Wikki Stix (Omnicor, Inc., Phoenix, AZ, USA), a pliable combination of wax and yarn [32]. Draftsman, from the American Printing House for the Blind (APH), is a commercial product that can be used to draw graphs with a stylus over a sheet of plastic paper placed on its rubber surface [11].
The computer based technologies to assist blind and visual impaired students [13,14,15,16,17,18,19] are very useful. However, the use of these tools requires not only the computer itself, but also the expertise many visually impaired and blind students do not have [17]. In addition, the high cost of some software can be a limitation in certain Schools and Colleges. This is the case of CEDERJ, a Public University that usually faces serious financial problems, and one of the reasons why we developed low-cost experiments and graphical representations.
Teachers are not usually prepared to adapt their practice to teaching students with visual impairment or blindness in inclusive classrooms. An actual inclusion represents a real challenge for the instructors and for the other students. It is our understanding that the many approaches described in the literature are valid and should be encouraged. Nevertheless, the possibility of using low-cost materials increase the chance of instructors to adapt their classes to blind students.
Acknowledgments
The authors thank the fellowships for Felipe Sales de Oliveira from Coordenação de Aperfeiçoamento de Pessoal de Nível Superior (CAPES) and for Agatha Santos Do Nascimento from Programa Institucional de Bolsas de Extensão (PIBEX/UFRJ).
Author Contributions
Felipe Sales de Oliveira and Maria Lucia Biancon conceived, designed, and performed the experiments; Agatha Santos Do Nascimento was responsible for graphical representations; Felipe Sales de Oliveira and Agatha Santos Do Nascimento revised the bibliography; Maria Lucia Biancon wrote the paper.
Conflicts of Interest
The authors declare no conflict of interest.
References
- Chen, H.; Ni, J.H. Teaching arrangements of carbohydrate metabolism in biochemistry curriculum in Peking University Health Science Center. Biochem. Mol. Biol. Educ. 2013, 41, 139–144. [Google Scholar] [CrossRef] [PubMed]
- Nair, S.P.; Shah, T.; Seth, S.; Pandit, N.; Shah, G.V. Case Based Learning: A Method for Better Understanding of Biochemistry in Medical Students. J. Clin. Diagn. Res. 2013, 1576–1578. [Google Scholar] [CrossRef] [PubMed]
- Stokes, S. Visual literacy in teaching and learning: A literature perspective. Electron. J. Integr. Technol. Educ. 2001, 1, 10–19. [Google Scholar]
- Schönborn, K.J.; Anderson, T.R. The importance of visual literacy in the education of biochemists. Biochem. Mol. Biol. Educ. 2006, 34, 94–102. [Google Scholar] [CrossRef] [PubMed]
- Locatelli, S.; Ferreira, C.; Arroio, A. Metavisualization: An important skill in the learning chemistry. Probl. Educ. 21st Century 2010, 24, 75–83. [Google Scholar]
- Teruya, L.C.; Marson, G.A.; Ferreira, C.R.; Arroio, A. Visualization in chemistry education: Directions for research and development of educational resources. Quim. Nova 2013, 36, 561–569. [Google Scholar] [CrossRef]
- Costa, M.J.; Galembeck, E.; Marson, G.A.; Torres, B.B. A Quick Guide for Computer-Assisted Instruction in Computational Biology and Bioinformatics. PLoS Comput. Biol. 2008, 4, 1–3. [Google Scholar] [CrossRef] [PubMed] [Green Version]
- Miner, D.L.; Nieman, R.; Swanson, A.B.; Woods, M.; Carpenter, K. Teaching Chemistry to Students with Disabilities: A Manual for High Schools, Colleges, and Graduate Programs, 4th ed.; The American Chemical Society: Washington, DC, USA, 2001; pp. 4–147. [Google Scholar]
- Hiemenz, P.C.; Pfeiffer, E. A General Chemistry Experiment for the Blind. J. Chem. Educ. 1972, 49, 263. [Google Scholar] [CrossRef] [PubMed]
- Supalo, C. Techniques to Enhance Instructors’ Teaching Effectiveness with Chemistry Students Who Are Blind or Visually Impaired. J. Chem. Educ. 2005, 82, 1513–1518. [Google Scholar] [CrossRef]
- Supalo, C.; Kennedy, S.H. Using Commercially Available Techniques To Make Organic Chemistry Representations Tactile and More Accessible to Students with Blindness or Low Vision. J. Chem. Educ. 2014, 91, 1745–1747. [Google Scholar] [CrossRef]
- Supalo, C.A.; Mallouk, T.E.; Rankel, L.; Amorosi, C.; Graybill, C.M. Low-cost Laboratory Adaptations for Precollege Students who are Blind or Visually Impaired. J. Chem. Educ. 2008, 85, 243–247. [Google Scholar]
- Lunney, D.; Morrison, R.C. High Technology Laboratory Aids for Visually Handicapped Chemistry Students. J. Chem. Educ. 1981, 58, 228. [Google Scholar] [CrossRef]
- Lunney, D.; Morrison, R.C.; Cetera, M.M.; Hartness, R.V.; Mills, R.T.; Salt, A.D.; Sowell, D.C. A Microcomputer-based Laboratory Aid for Visually Impaired Students. IEEE Micro 1983, 3, 19–31. [Google Scholar] [CrossRef]
- Morrison, R.C.; Lunney, D.; Terry, R.J.; Hassell, J.; Boswood, G. Voice-Operated Microcomputer-Based Laboratory Data Acquisition System To Aid Handicapped Students in Chemistry Laboratories. J. Chem. Inf. Comput. Sci. 1984, 24, 271–275. [Google Scholar] [CrossRef]
- Tomlinson, B.J.; Batterman, J.; Chew, Y.C.; Henry, A.; Walker, B.N. Exploring Auditory Graphing Software in the Classroom: The Effect of Auditory Graphs on the Classroom Environment. ACM Trans. Access. Comput. 2016, 9, 3–27. [Google Scholar] [CrossRef]
- Supalo, C.A.; Hill, A.A.; Larrick, C.G. Summer Enrichment Programs to Foster Interest in STEM Education for Students with Blindness or Low Vision. J. Chem. Educ. 2014, 91, 1257–1260. [Google Scholar] [CrossRef]
- Supalo, C.A.; Isaacson, M.D.; Lombardi, M.V. Making Hands-On Science Learning Accessible for Students Who are Blind or Have Low Vision. J. Chem. Educ. 2014, 91, 195–199. [Google Scholar] [CrossRef]
- Supalo, C.A.; Mallouk, T.E.; Amorosi, C.; Lanouette, J. Using Adaptive Tools and Techniques to Teach a Class of Students Who Are Blind or Low-Vision. J. Chem. Educ. 2009, 86, 587–591. [Google Scholar] [CrossRef]
- Johnson, A.; Ruppert, S. An Evaluation of accessibility in online learning menagement systems. Libr. Hi Tech 2002, 20, 441–451. [Google Scholar] [CrossRef]
- Maurer, H.R. Bromelain: Biochemistry, pharmacology and medical use. Cell. Mol. Life Sci. 2011, 58, 1234–1245. [Google Scholar] [CrossRef] [PubMed]
- Djagny, K.B.; Wang, Z.; Xu, S. Gelatin: A Valuable Protein for Food and Pharmaceutical Industries: Review. Crit. Rev. Food Sci. Nutr. 2001, 41, 481–492. [Google Scholar] [CrossRef] [PubMed]
- Dalgleish, D.G.; Spagnuolo, P.; Goff, H.D. A possible structure of the casein micelle based on high-resolution field-emission scanning electron microscopy. Int. Dairy J. 2004, 14, 1025–1031. [Google Scholar] [CrossRef]
- Slattery, C.W.; Sood, S.M.; Chang, P. Hydrophobic interactions in human casein micelle formation: Beta-casein aggregation. J. Dairy Res. 1989, 56, 427–433. [Google Scholar] [CrossRef] [PubMed]
- Voet, D.; Voet, J.G. Biochemistry, 7th ed.; Wiley Int.: Toronto, ON, Canada, 2010. [Google Scholar]
- Radzicka, A.; Wolfenden, R. A Proficient Enzyme. Science 1995, 267, 90–93. [Google Scholar] [CrossRef] [PubMed]
- Pouvreau, L.; Kroef, T.; Gruppen, H.; van Koningsveld, G.; van den Broek, L.A.; Voragen, A.G. Structure and stability of the potato cysteine protease inhibitor group (cv. Elkana). J. Agric. Food Chem. 2005, 53, 5739–5746. [Google Scholar] [CrossRef] [PubMed]
- Lakhana, A. What is Educational Technology? An Inquiry into the Meaning, Use, and Reciprocity of Technology. CJLT/RCAT 2014, 40, 1–41. [Google Scholar]
- Wedler, H.B.; Boyes, L.; Davis, R.L.; Flynn, D.; Franz, A.; Hamann, C.S.; Harrison, J.G.; Lodewyk, M.W.; Milinkevich, K.A.; Shaw, J.T.; et al. Nobody Can See Atoms: Science Camps Highlighting Approaches for Making Chemistry Accessible to Blind and Visually Impaired Students. J. Chem. Educ. 2014, 91, 188–194. [Google Scholar] [CrossRef]
- Patterson, T.F.; Leonard, J.G. Turning Spreadsheets into Graphs: An Information Technology Lesson in Whole Brain Thinking. J. Comput. High. Educ. 2005, 17, 95–115. [Google Scholar] [CrossRef]
- Supalo, C.A. ConfChem Conference on Interactive Visualizations for Chemistry Teaching and Learning: Concerns Regarding Accessible Interfaces for Students Who Are Blind or Have Low Vision. J. Chem. Educ. 2016, 93, 1156–1159. [Google Scholar] [CrossRef]
- Poon, T.; Ovadia, R. Using Tactile Learning Aids for Students with Visual Impairments in a First-Semester Organic Chemistry Course. J. Chem. Educ. 2008, 85, 240–242. [Google Scholar] [CrossRef]
Figure 1.
Milk clot procedure done in candy plastic bags. (A) After preparation of the samples, they need to be placed inside a beaker to maintain the solutions in the same level. (B) After the reaction, the bags were placed on the bench for manipulation by the blind student. The marks “C” and “J” indicate the bags with the addition of water (control) and pineapple juice (experimental condition), respectively. It is important to note the diagonal cut in the opening of the bag where the enzyme was added (J bag) to help the blind students to distinguish one sample from the other. In the control sample the milk remained liquid, and in the sample containing pineapple juice, the milk clot. The student can feel the difference by touching the bags.

Figure 2.
Thermal denaturation of bromelain. The experiment was done by adding pineapple juice to samples containing gelatin in sol (liquid) phase. After mixing, the samples were placed in refrigerator for 30 min. (A) Control experiment done by addition of water where gelatin is able to set (gel state); (B) effect of native bromelain in which the sample is liquid due to hydrolysis; (C) the thermal denatured bromelain does not hydrolyze the gelatin that becomes a gel upon refrigeration.
Figure 3.
3D representation of graphs. The graphs were printed in a 180 g/m2 paper and the lines and curves were covered up with cold porcelain. The paper was glued in medium-density fiberboard (MDF) boards after the legends and numbers were written in Braille by using a positive slate. The rates are represented as the inverse of the time needed to reach the end of the reaction (min−1) since the product concentration cannot be determined. (A) Effect of substrate concentration: the rate of the reaction (Y axis) varies from 2 to 12 (min−1) and the substrate concentration indicated were: 0.2, 0.6, and 1.0 g/mL of milk. (B) Effect of enzyme concentration: the rate (Y axis) of the reaction varied from 0 to 30 h−1, and the numbers in Braille are for 5, 15, and 25 (h−1). The enzyme concentration varied from 0 to 1.4 mL of juice. (C) Effect of pH: The activity of the enzyme (Y axis) was calculated as a percentage of the highest value obtained in pH 4, and the numbers in the plot indicate the 0%, 40%, and 80% of activity. The pH ranged from 2 to 12, and the numbers in Braille are for pH 4, 8, and 12. (D) Effect of Inhibitor: shows the rate (Y axis) as 1, 3, 5, 7, and 9 min−1 as a function of inhibitor concentration (X axis): 0%, 40%, and 80% of inhibitor are indicated in Braille.
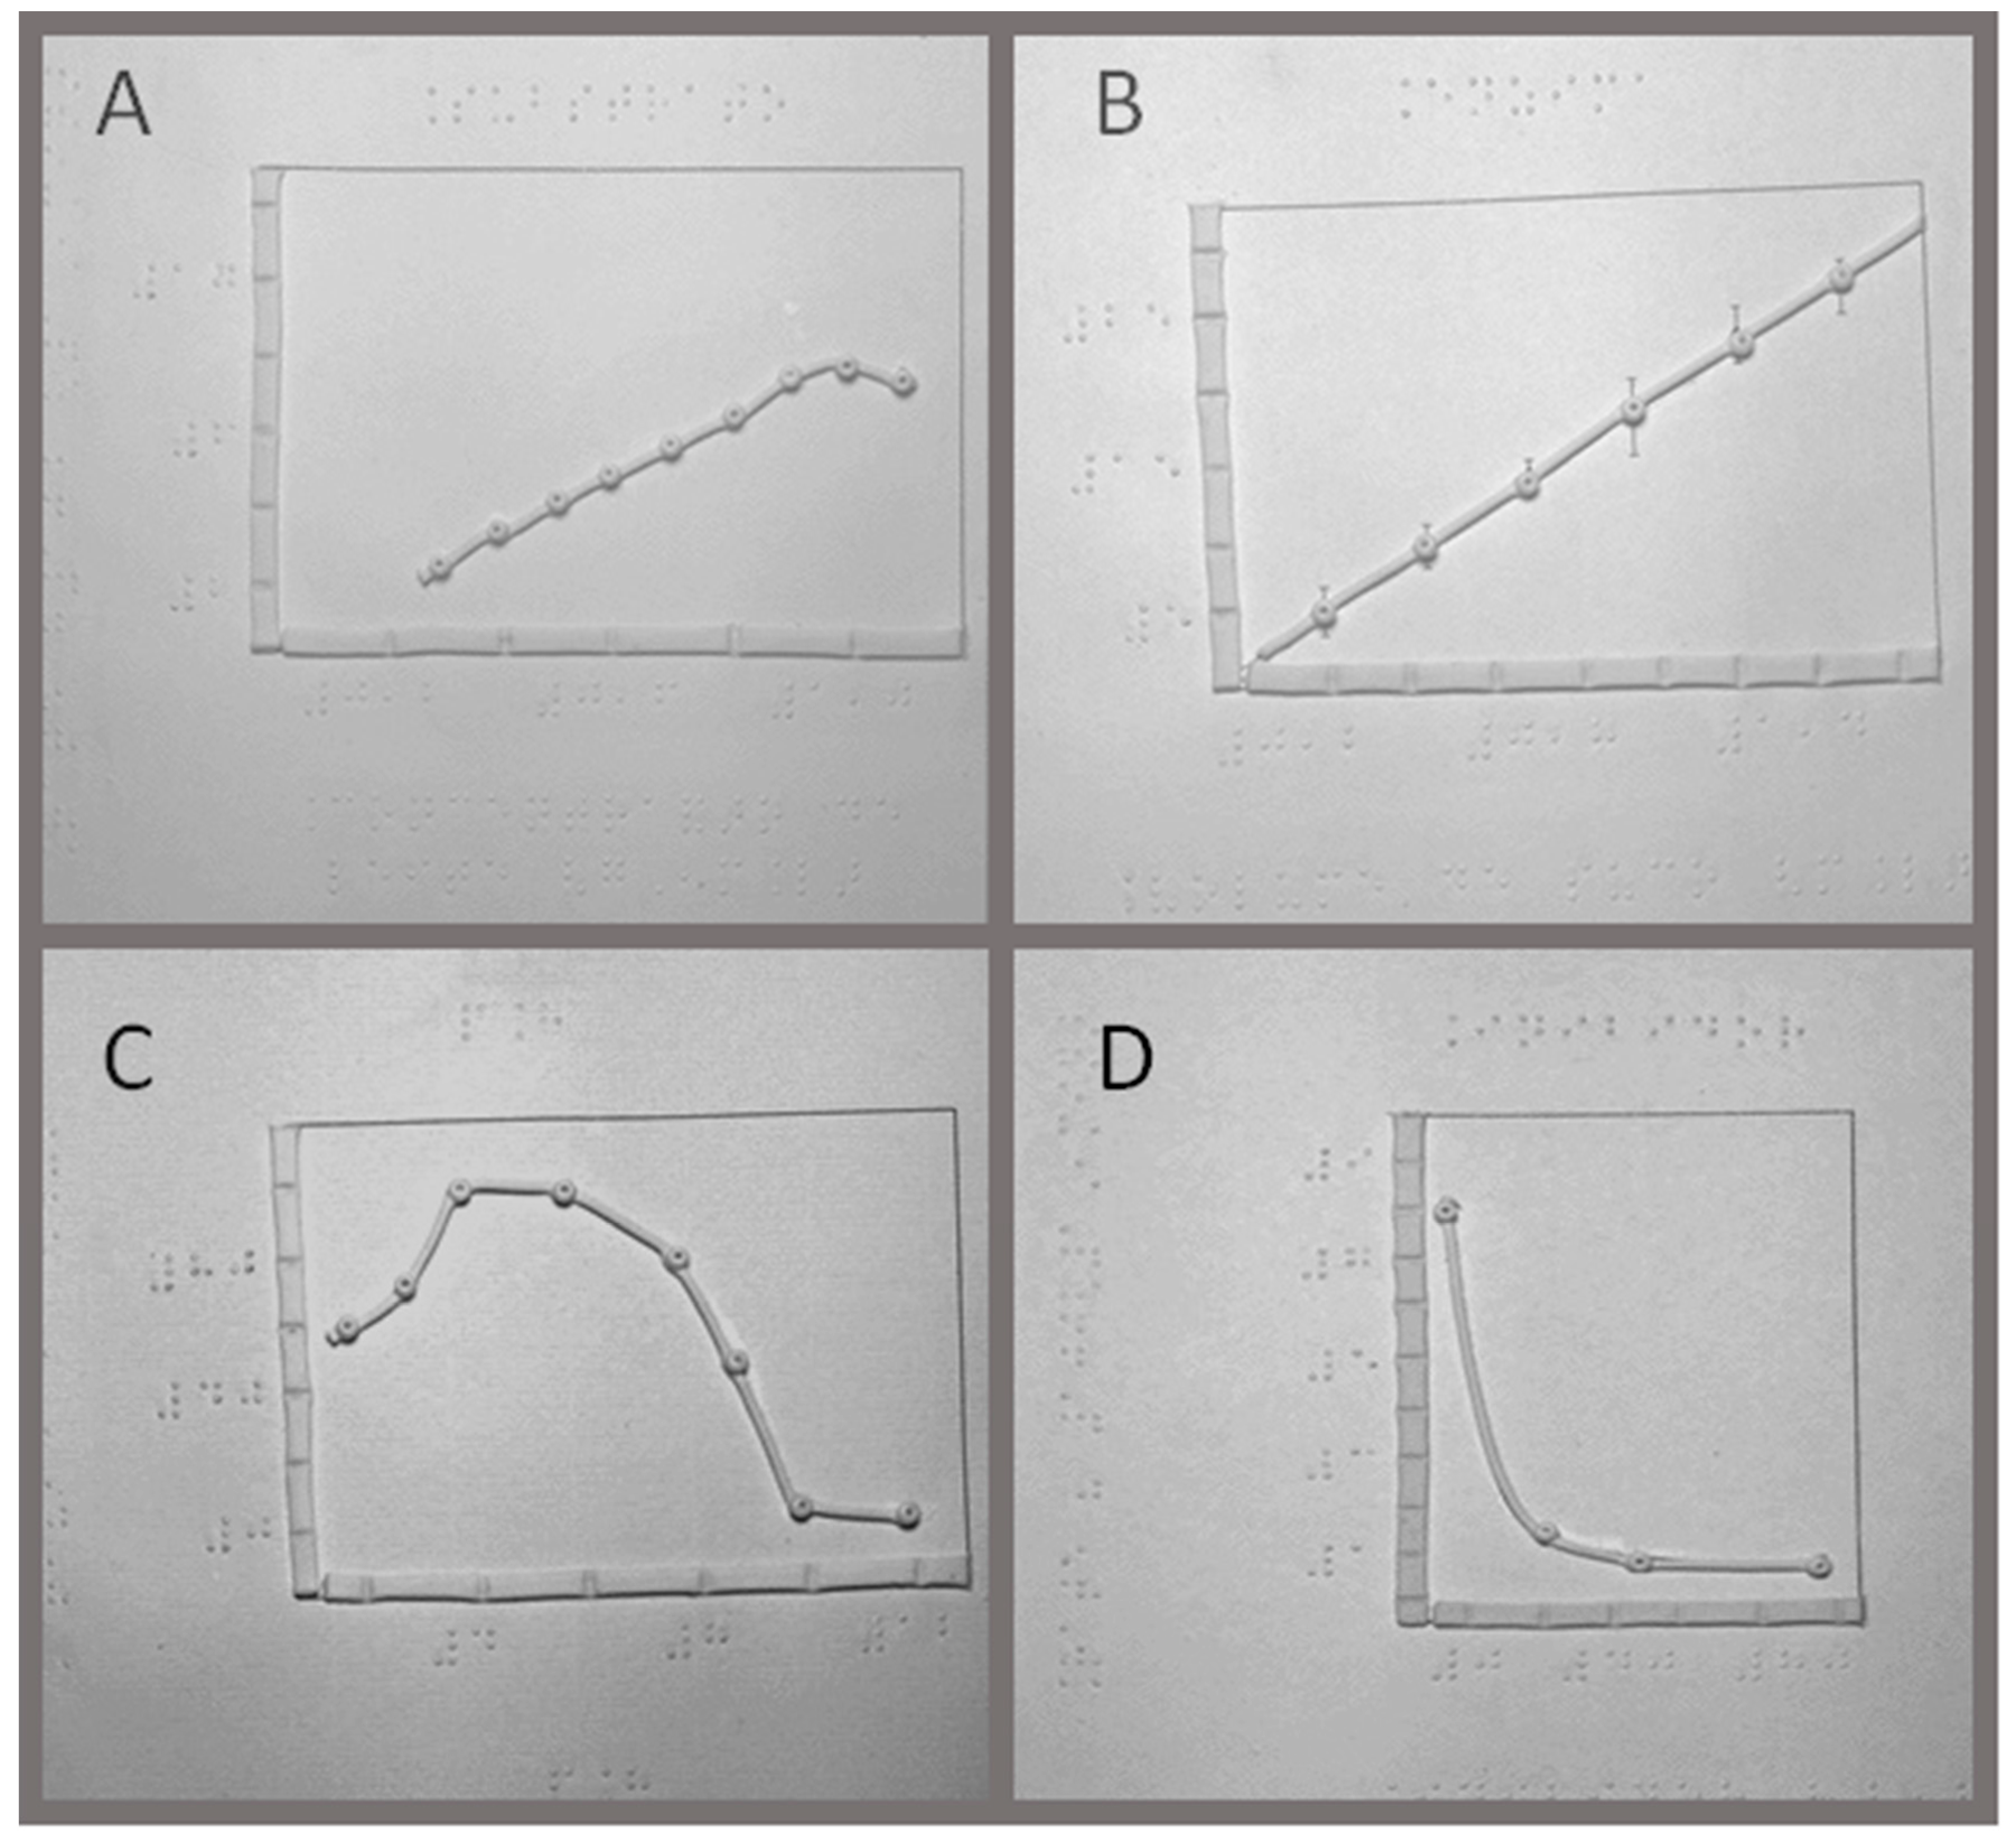
Figure 4.
Use of the 3D graph by a blind student. Two guides made of cold porcelain were used by the student to locate the data points in regarding to the axis.
Figure 4.
Use of the 3D graph by a blind student. Two guides made of cold porcelain were used by the student to locate the data points in regarding to the axis.

© 2017 by the authors. Licensee MDPI, Basel, Switzerland. This article is an open access article distributed under the terms and conditions of the Creative Commons Attribution (CC BY) license (http://creativecommons.org/licenses/by/4.0/).
Share and Cite
MDPI and ACS Style
De Oliveira, F.S.; Nascimento, A.S.d.; Bianconi, M.L. Teaching Enzyme Activity to the Visual Impaired and Blind Students. Technologies 2017, 5, 52. https://doi.org/10.3390/technologies5030052
AMA Style
De Oliveira FS, Nascimento ASd, Bianconi ML. Teaching Enzyme Activity to the Visual Impaired and Blind Students. Technologies. 2017; 5(3):52. https://doi.org/10.3390/technologies5030052
Chicago/Turabian StyleDe Oliveira, Felipe Sales, Agatha Santos do Nascimento, and Maria Lucia Bianconi. 2017. "Teaching Enzyme Activity to the Visual Impaired and Blind Students" Technologies 5, no. 3: 52. https://doi.org/10.3390/technologies5030052
Note that from the first issue of 2016, this journal uses article numbers instead of page numbers. See further details here.