Article

Development of a High-Speed Current Injection and Voltage Measurement System for Electrical Impedance Tomography-Based Stretchable Sensors

1
Autonomous System and Robotics Research Centre, University of Salford, Manchester M5 4WT, UK
2
Research Centre E. Piaggio, University of Pisa, 56122 Pisa, Italy
3
Department of Information Engineering, University of Pisa, 56122 Pisa, Italy
*
Author to whom correspondence should be addressed.
Technologies 2017, 5(3), 48; https://doi.org/10.3390/technologies5030048
Submission received: 12 July 2017 / Revised: 20 July 2017 / Accepted: 21 July 2017 / Published: 26 July 2017
(This article belongs to the Special Issue Wearable Technologies)

Abstract

:
Electrical impedance tomography (EIT) is an imaging method that can be applied over stretchable conductive-fabric materials to realize soft and wearable pressure sensors through current injections and voltage measurements at electrodes placed at the boundary of a conductive medium. In common EIT systems, the voltage data are serially measured by means of multiplexers, and are hence collected at slightly different times, which affects the real-time performance of the system. They also tend to have complicated hardware, which increases power consumption. In this paper, we present our design of a 16-electrode high-speed EIT system that simultaneously implements constant current injection and differential potential measurements. This leads to a faster, simpler-to-implement and less-noisy technique, when compared with traditional EIT approaches. Our system consists of a Howland current pump with two multiplexers for a constant DC current supply, and a data acquisition card. It guarantees a data collection rate of 78 frames/s. The results from our conductive stretchable fabric sensor show that the system successfully performs voltage data collection with a mean signal-to-noise ratio (SNR) of 55 dB, and a mean absolute deviation (MAD) of 0.5 mV. The power consumption can be brought down to 3 mW; therefore, it is suitable for battery-powered applications. Finally, pressure contacts over the sensor are properly reconstructed, thereby validating the efficiency of our EIT system for soft and stretchable sensor applications.

1. Introduction

Electrical impedance tomography (EIT) is a method in which an image of the internal conductivity distribution of an object is reconstructed from potential measurements made at the electrodes placed around its boundary [1,2]. In a typical procedure, a low-frequency or DC drive current is injected between two of these electrodes, and the resulting voltage data are collected from the remaining electrodes. The current injection and voltage measurements are then systematically repeated until every electrode pair has served for current injection. Once the voltage data are collected, the reconstruction of the conductivity is performed by solving the Laplacian elliptic partial differential equation [1]. Then, a finite element (FE) model of the sensor is computed, resulting in an image of the conductivity distribution.
EIT is mainly used in clinical applications for patient monitoring [3,4]; other applications include damage detection [5] and pressure sore prevention [6]. Recently, EIT has been also employed for showing the internal impedance distribution of conductive fabrics that respond to touch with local changes in conductivity, and was therefore used for developing an artificial skin as a large-area pressure sensor [7]. Such sensors have the advantage of being stretchable, and can be placed over surfaces with a different topology. In [8,9], an EIT-based sensor was placed over a mannequin arm in order to detect different types of touches. This demonstrated that these sensors have the potential of being used as wearable devices, and can now be used in robotic applications, whereby a robotic system is equipped with sensors that do not interfere with its mechanics.
However, EIT still presents a major drawback; it is considered an inverse problem, as described in [1]. Thus, EIT systems are mathematically severely ill-posed and non-linear, and are very sensitive to small changes in potential at the boundary measurements. Therefore, the image reconstruction of the internal conductivity of the body under examination is apt to errors, meaning EIT applications suffer from a low spatial resolution.
The spatial resolution can be improved by increasing the number of electrodes [10]; this creates more information available for solving the inverse problem. However, this solution affects the time required for the data collection, and therefore decreases the temporal resolution of the system.
The general approach to compensate for such a drawback is to develop data collection systems that are faster and less sensitive to noise.
Various methods have been used to increase the temporal resolution of EIT systems. In [11], the authors use a frequency-division multiplexing approach; they simultaneously inject currents at different frequencies from all the electrodes and measure the resulting voltage. In [12], a similar approach is also presented, where a fast EIT system is achieved via parallel current excitation that uses orthogonal signals. The drive currents can be then isolated, as they present diverse frequencies. Nonetheless, these approaches require synchronous analogue detection hardware and digital processing techniques that complicate the system design and increase the cost and power consumption. In [13], a fast EIT system is presented; it injects a switched DC current pulse into the drive electrode pairs and measures the voltage waveform, whereby parallel data acquisition is taken during the half part of the cycle. The problem with such a system is that, in order to achieve a fast response, the measurement time has to be small, limiting the measurement sensitivity.
A temporal resolution of 45 Hz is reported for an EIT-based sensor in [14], alongside a power consumption of roughly 22 mW. In [15], the use of a current of 10 mA at 2 kHz over a resistive material of 1 Ohm/sq results in a power loss of about 175 mW. In these approaches, the use of multiple analog switch controllers for current injection and voltage measurements complicates the hardware. Additionally, bearing in mind wearable applications, electronics should give minimum power consumption and be fit for battery-powered operation. In this paper, we present our electronic design of a printed circuit board (PCB) for 16-electrode high-speed EIT sensor applications. A video of our EIT sensor setup is available as Supplementary Materials. It works by serially injecting a constant unidirectional DC current and collecting differential voltages concurrently from all the electrodes at each current injection cycle. Parallel data acquisition consents for a higher data capture rate; therefore, this design allows for an increased temporal resolution. It also decreases the electrical common-mode noise, as the voltage data are collected in the differential mode. Another advantage of this design is that it does not have a complex hardware setup. This makes the system low-cost and of a low power consumption; thus it is more suitable for wearable applications.
The remainder of this paper is organized as follows: the electronic design of our PCB is presented in Section 2. In Section 3, we present our 16-electrode sensor system. In Section 4, we begin by showing the data acquisition frame rate along with an analysis of the voltage data; we then show different images corresponding to pressure inputs on the stretchable sensor. Finally, Section 5 concludes the paper.

2. Hardware Implementation

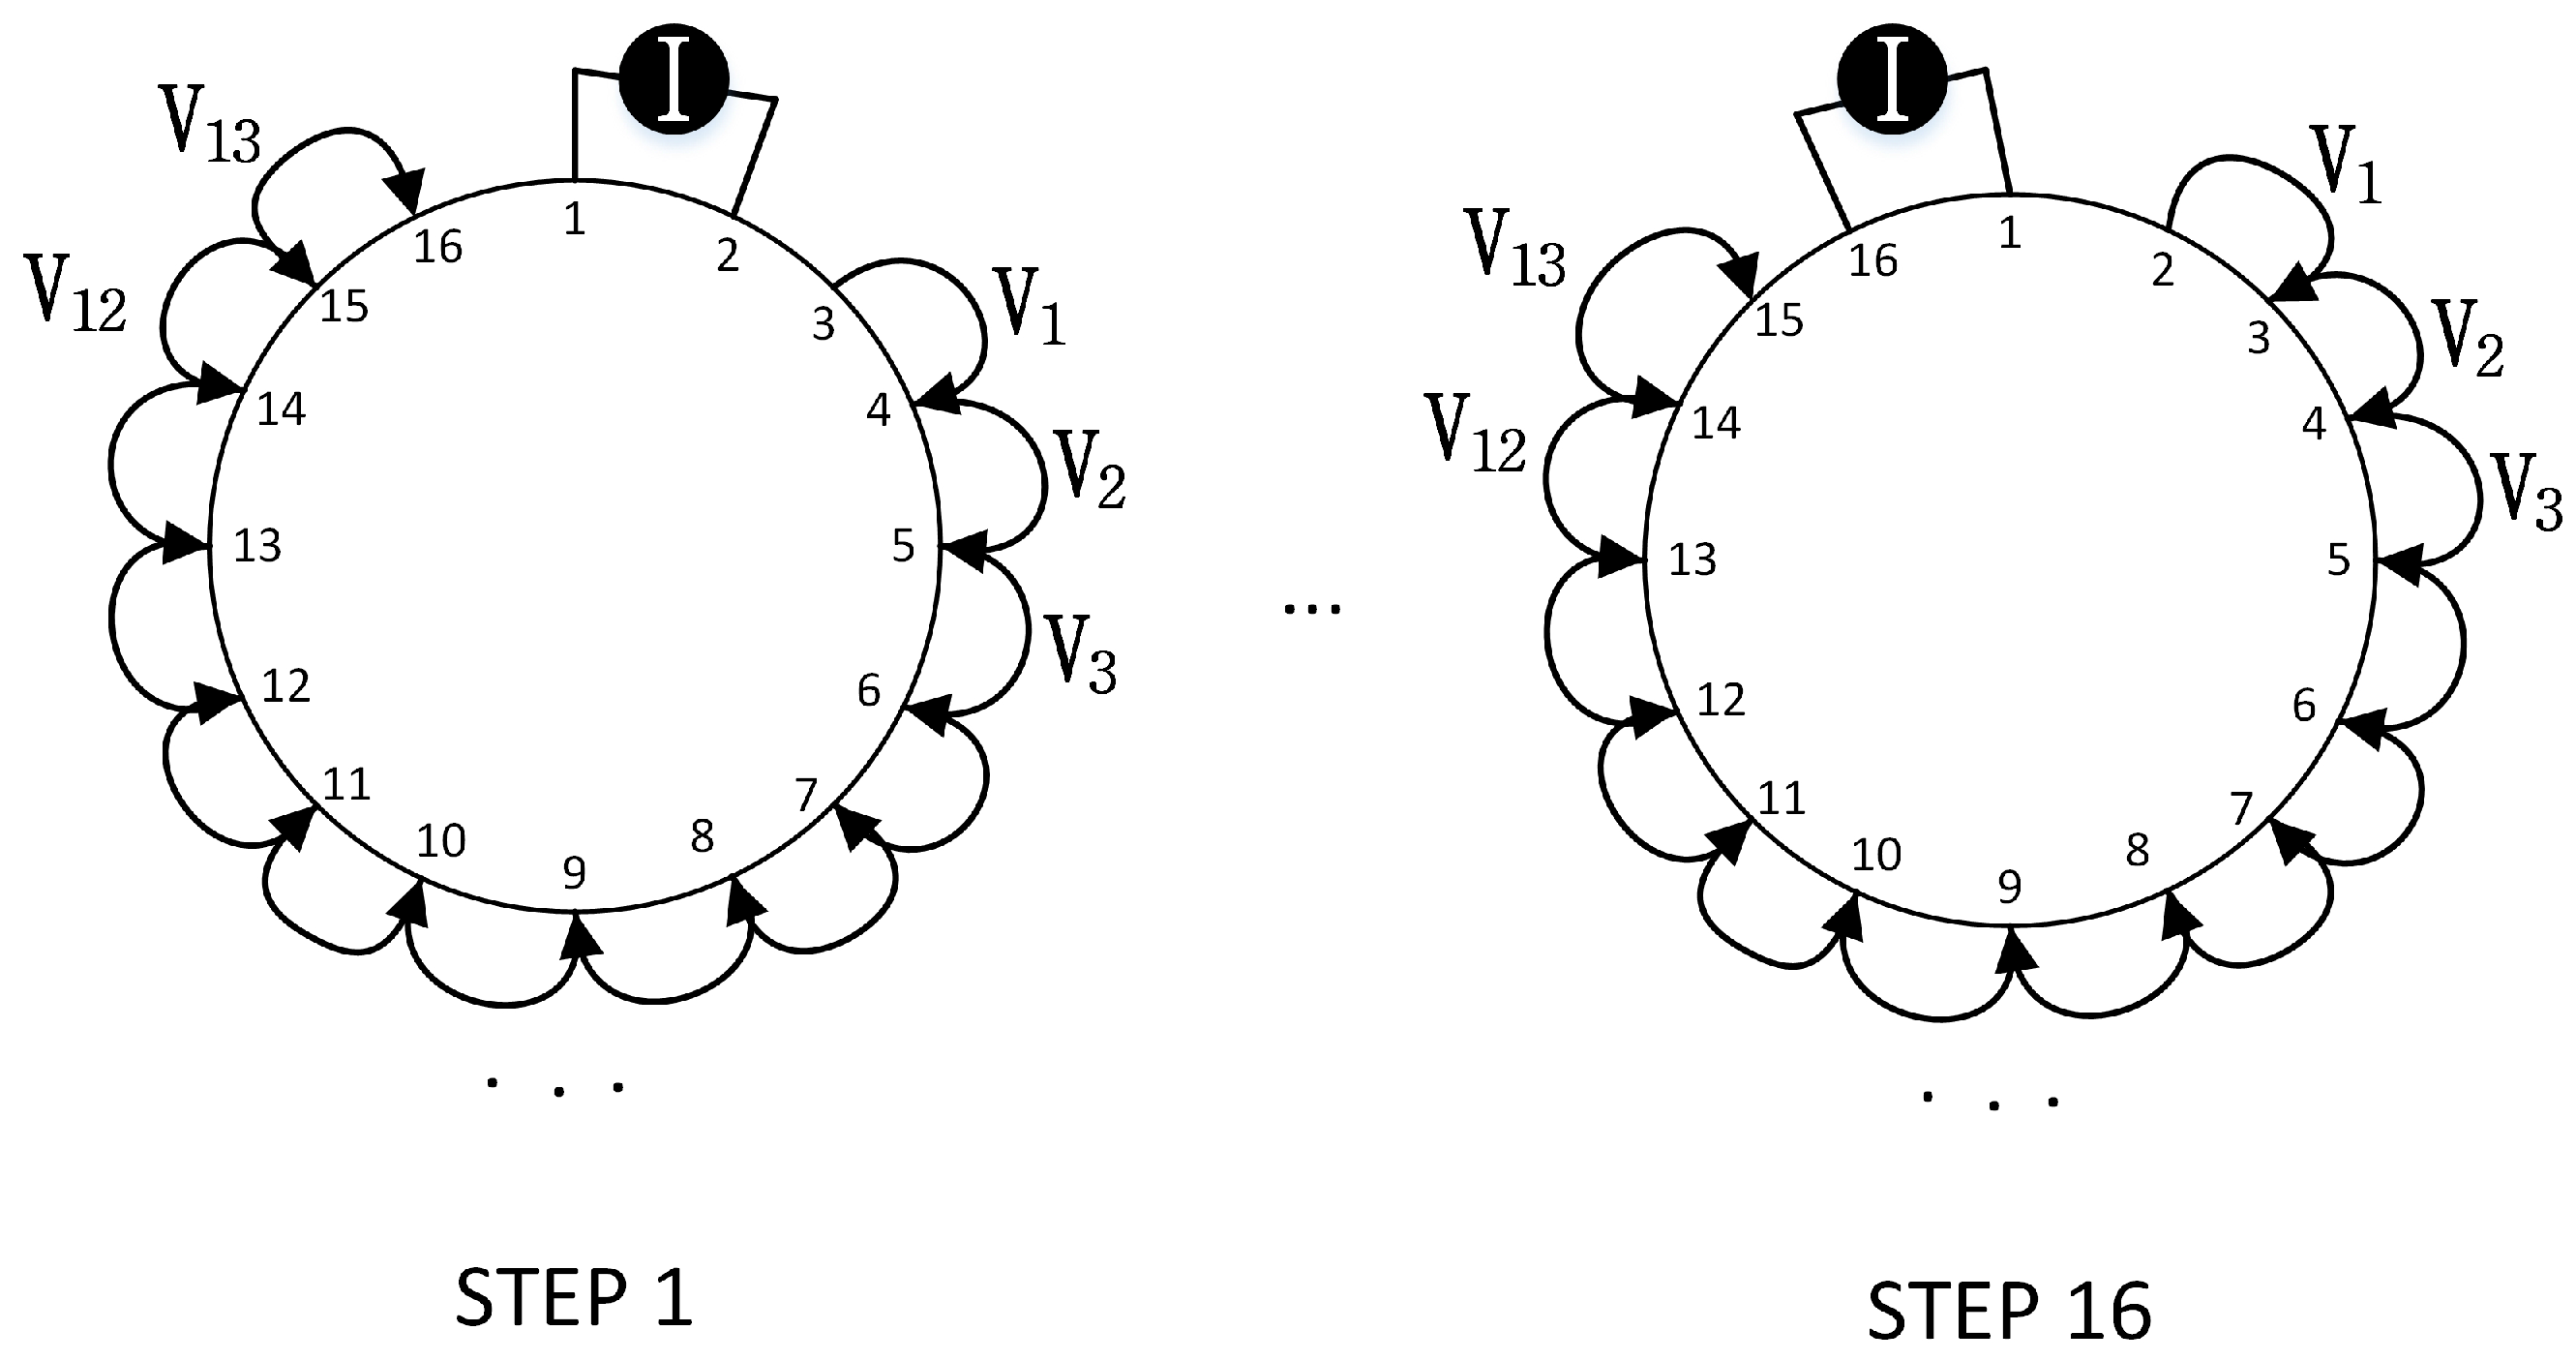
In EIT, a certain number of electrodes are located at the periphery of a conductive body. These electrodes serve for the application of either a small alternating or a DC current, and for performing voltage measurements; then, an image showing the internal conductivity is reconstructed using the voltage data and a FE model of the system. In 
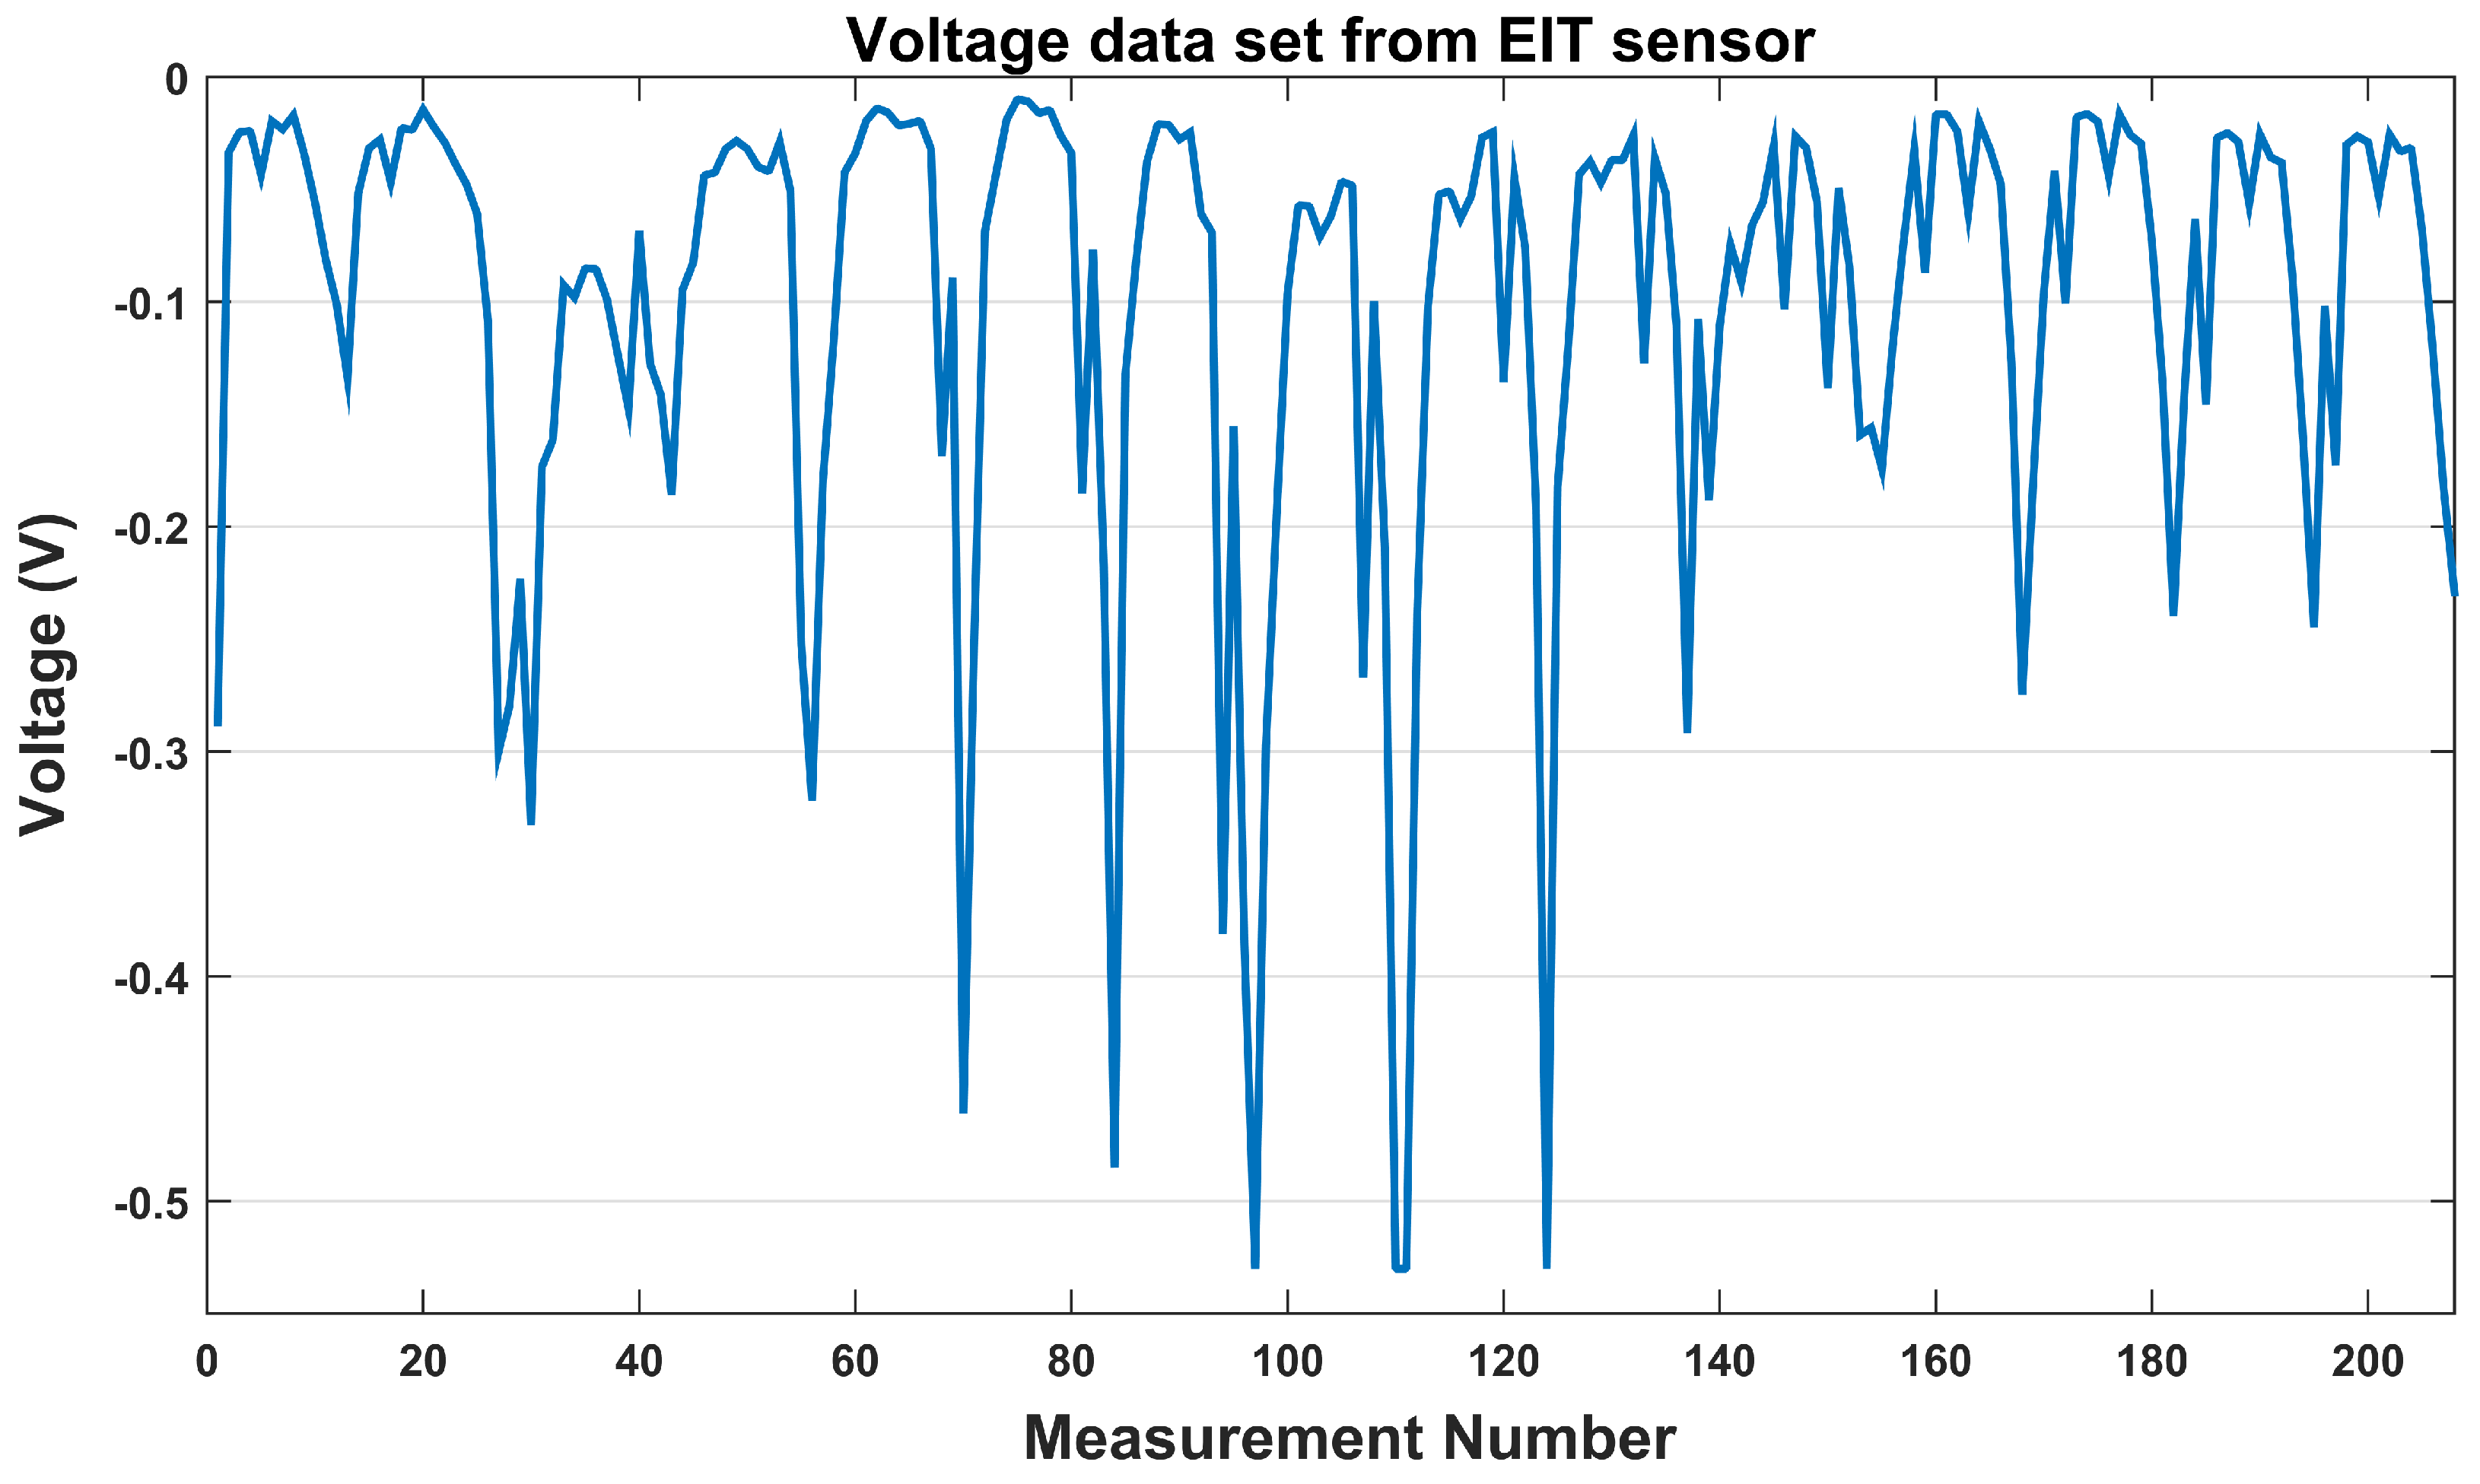
Figure 1 is shown a typical EIT current injection and voltage measurement cycle. In order to scan between all electrodes and obtain a full voltage data set, the current injection and voltage measurement are systematically repeated until every electrode pair has served for the current injection. To reduce the effects of noise due to the contact impedance, voltage measurements are not performed at electrodes carrying injected current. Therefore, for a generic L-electrodes system, the number of measurements at the boundary is K = L ( L 3 ) . The voltage data sets are in the form of V b = ( V b 1 , , V b K ) , where V b is the vector containing the voltage measurements and K is the number of measurements. For a 16-electrode system, K = 208 . However, the total number of independent measurement is halved due to the reciprocity principle [16], as we have a symmetrical commutation of current injection and potential measurement.

Electronic Circuit

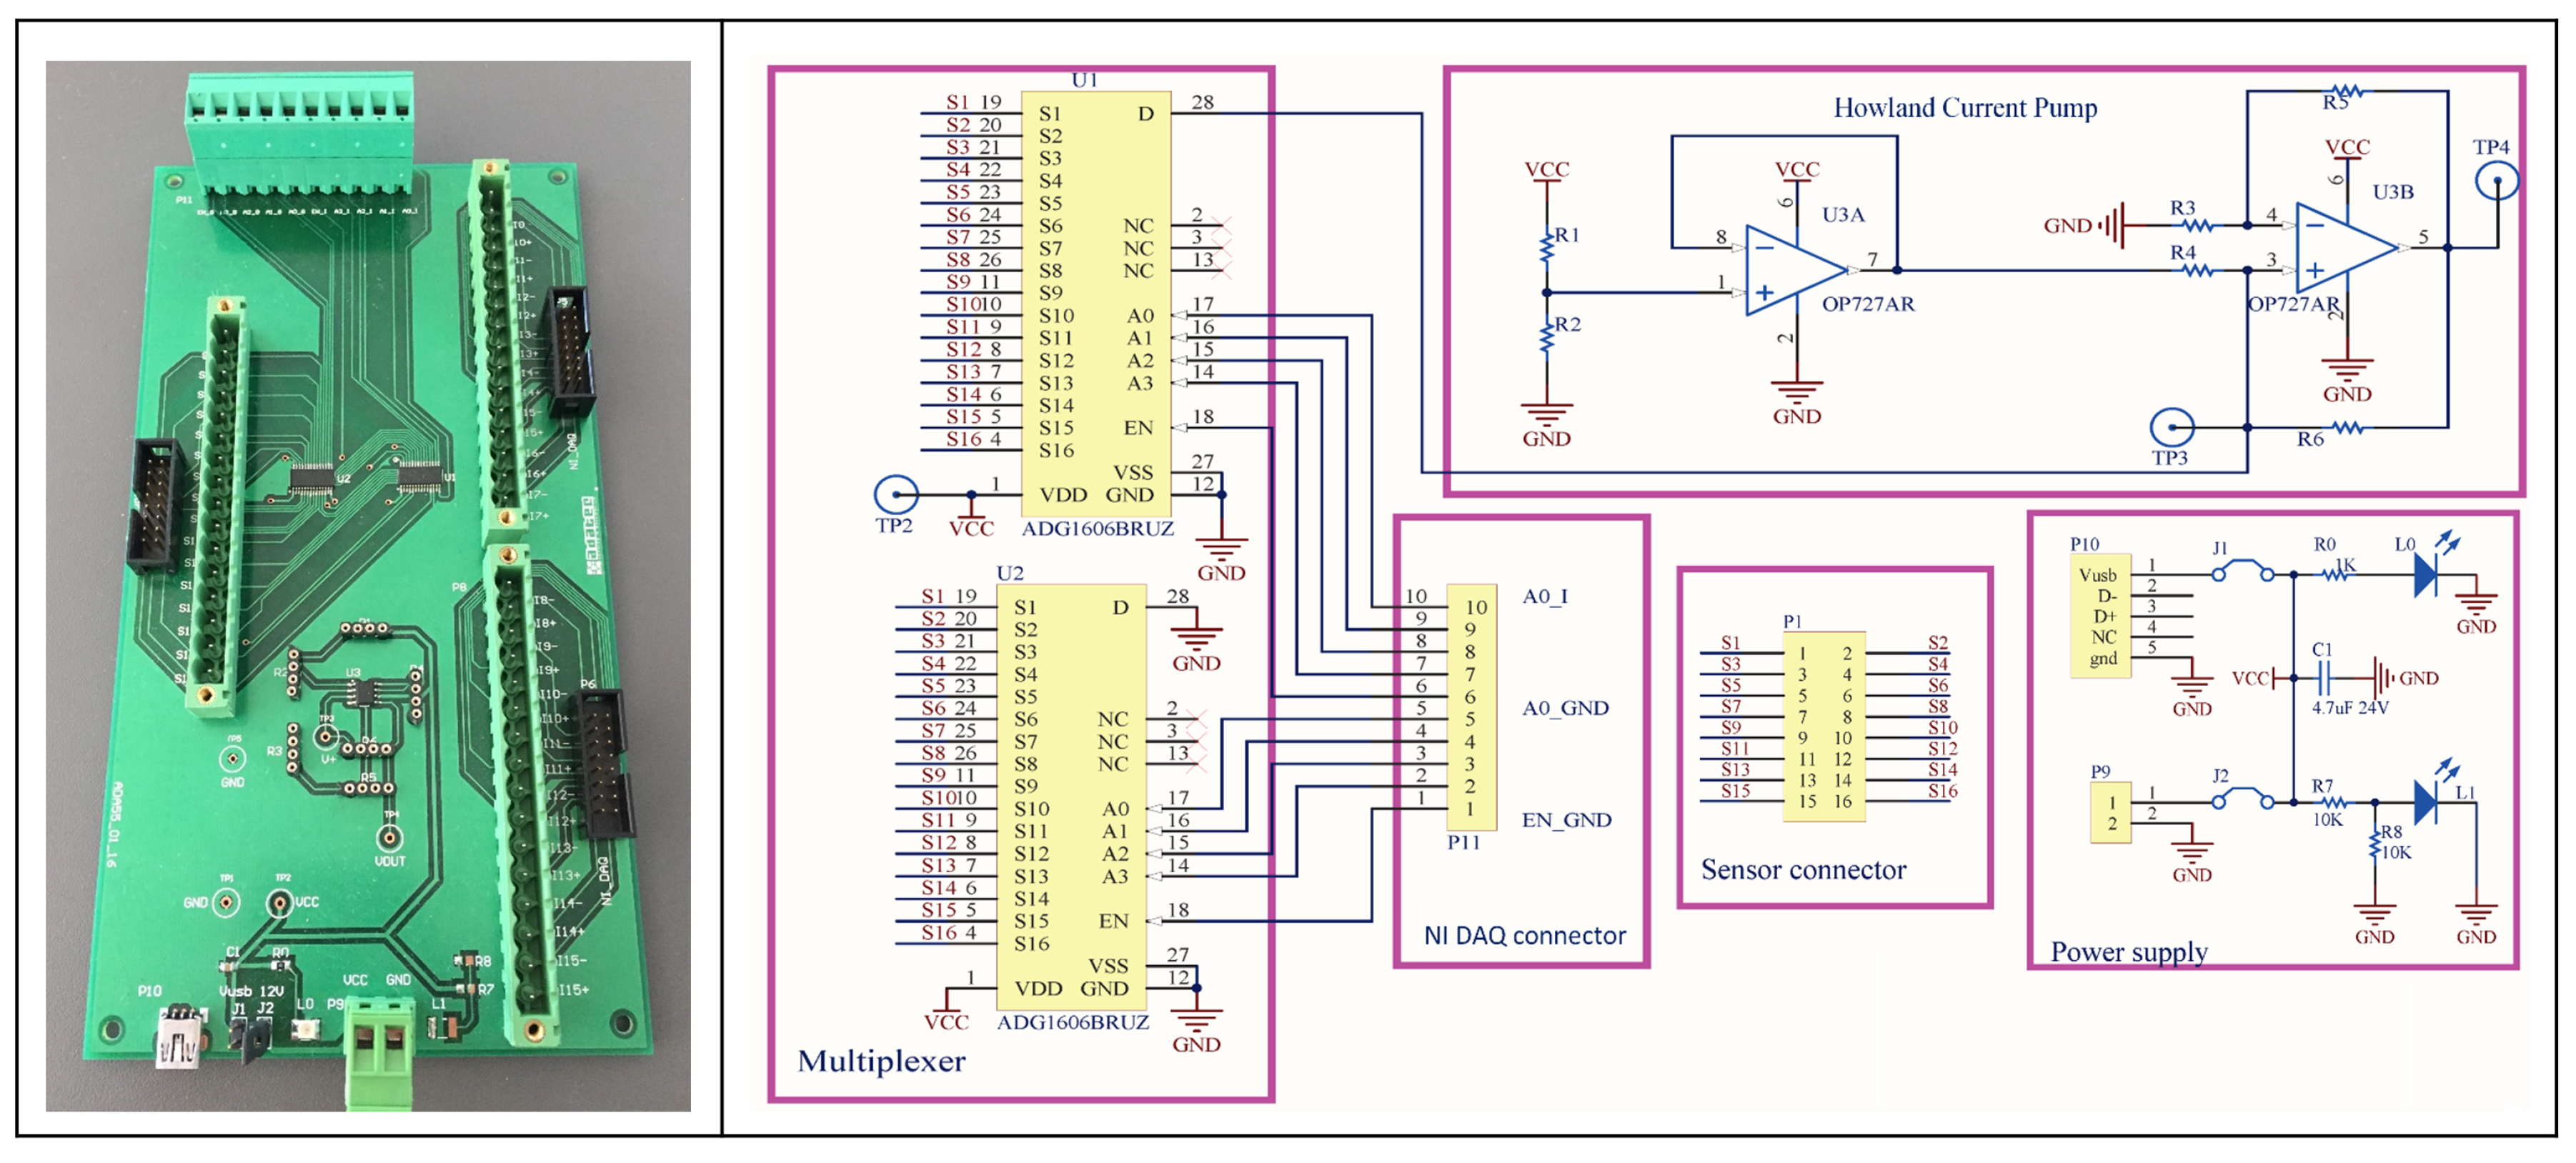
Our hardware system for current injection and voltage measurement is a customized PCB, as shown in Figure 2. It presents a power supply connector, a two-multiplexer mechanism connected to a Howland current pump constant current generator, a sensor block for connection with the sensor electrodes, and a connector for the National Instruments Data Acquisition (NI DAQ) USB card. The PCB can be powered with either USB or a wall block power supply.
The two multiplexers serve for the rotation of the current supply between the electrodes, and are digitally controlled by the DAQ card. They are two 16:1 ADG1606 multiplexers, presenting a typical on resistance of 4.5 Ω and a transition time, when switching from one address state to another, of 143 ns. With 16 channels, the multiplexers each need to be controlled by 4 digital-bit variables and 1 enabling variable, for a total of 10 variables. The first of the multiplexers has its input connected to the current source, while the latter is connected to ground; their outputs are then connected to the different electrode pairs.
The Howland current pump [17] is made of an Operational amplifier (Opamp), and provides a high-output impedance constant current source. The circuit is able to supply a constant DC current, independent of the connected load resistivity, to various loads. The Opamp for the current generator is an OP727 dual-Opamp, with a good common-mode rejection ratio (CMRR) CMRR of 85 dB, rail-to-rail, and a low supply current of 300 μ A/amplifier. The DAQ card is a NI USB6353, which serves for both the multiplexer control and the parallel collection of the voltage data. The DAQ has a high input impedance, a multichannel maximum sample rate of 1.00 MS/s, and an ADC resolution of 16 bits. The DAQ is used for the differential voltage readings, where one input channel is connected to the positive input of the device’s programmable gain instrumentation amplifier (PGIA), and the other is connected to the negative input of the PGIA; low settling times at all gains ensure the maximum resolution of the ADC is used. Differently to other works, we do not use any multiplexers for the voltage readings, but collect the data simultaneously from all the electrodes, thus decreasing electrical noise and the settling time. Furthermore, our design guarantees the possibility of switching between different types of voltage reading modalities (i.e., collecting differential voltage data between either adjacent or non adjacent electrode pairs).
For the management of the DAQ card, we use the MATLAB Data Acquisition Toolbox to collect data and generate the 10 bit digital signal for the control of the two multiplexers. This approach allows for reading data into MATLAB for immediate analysis.
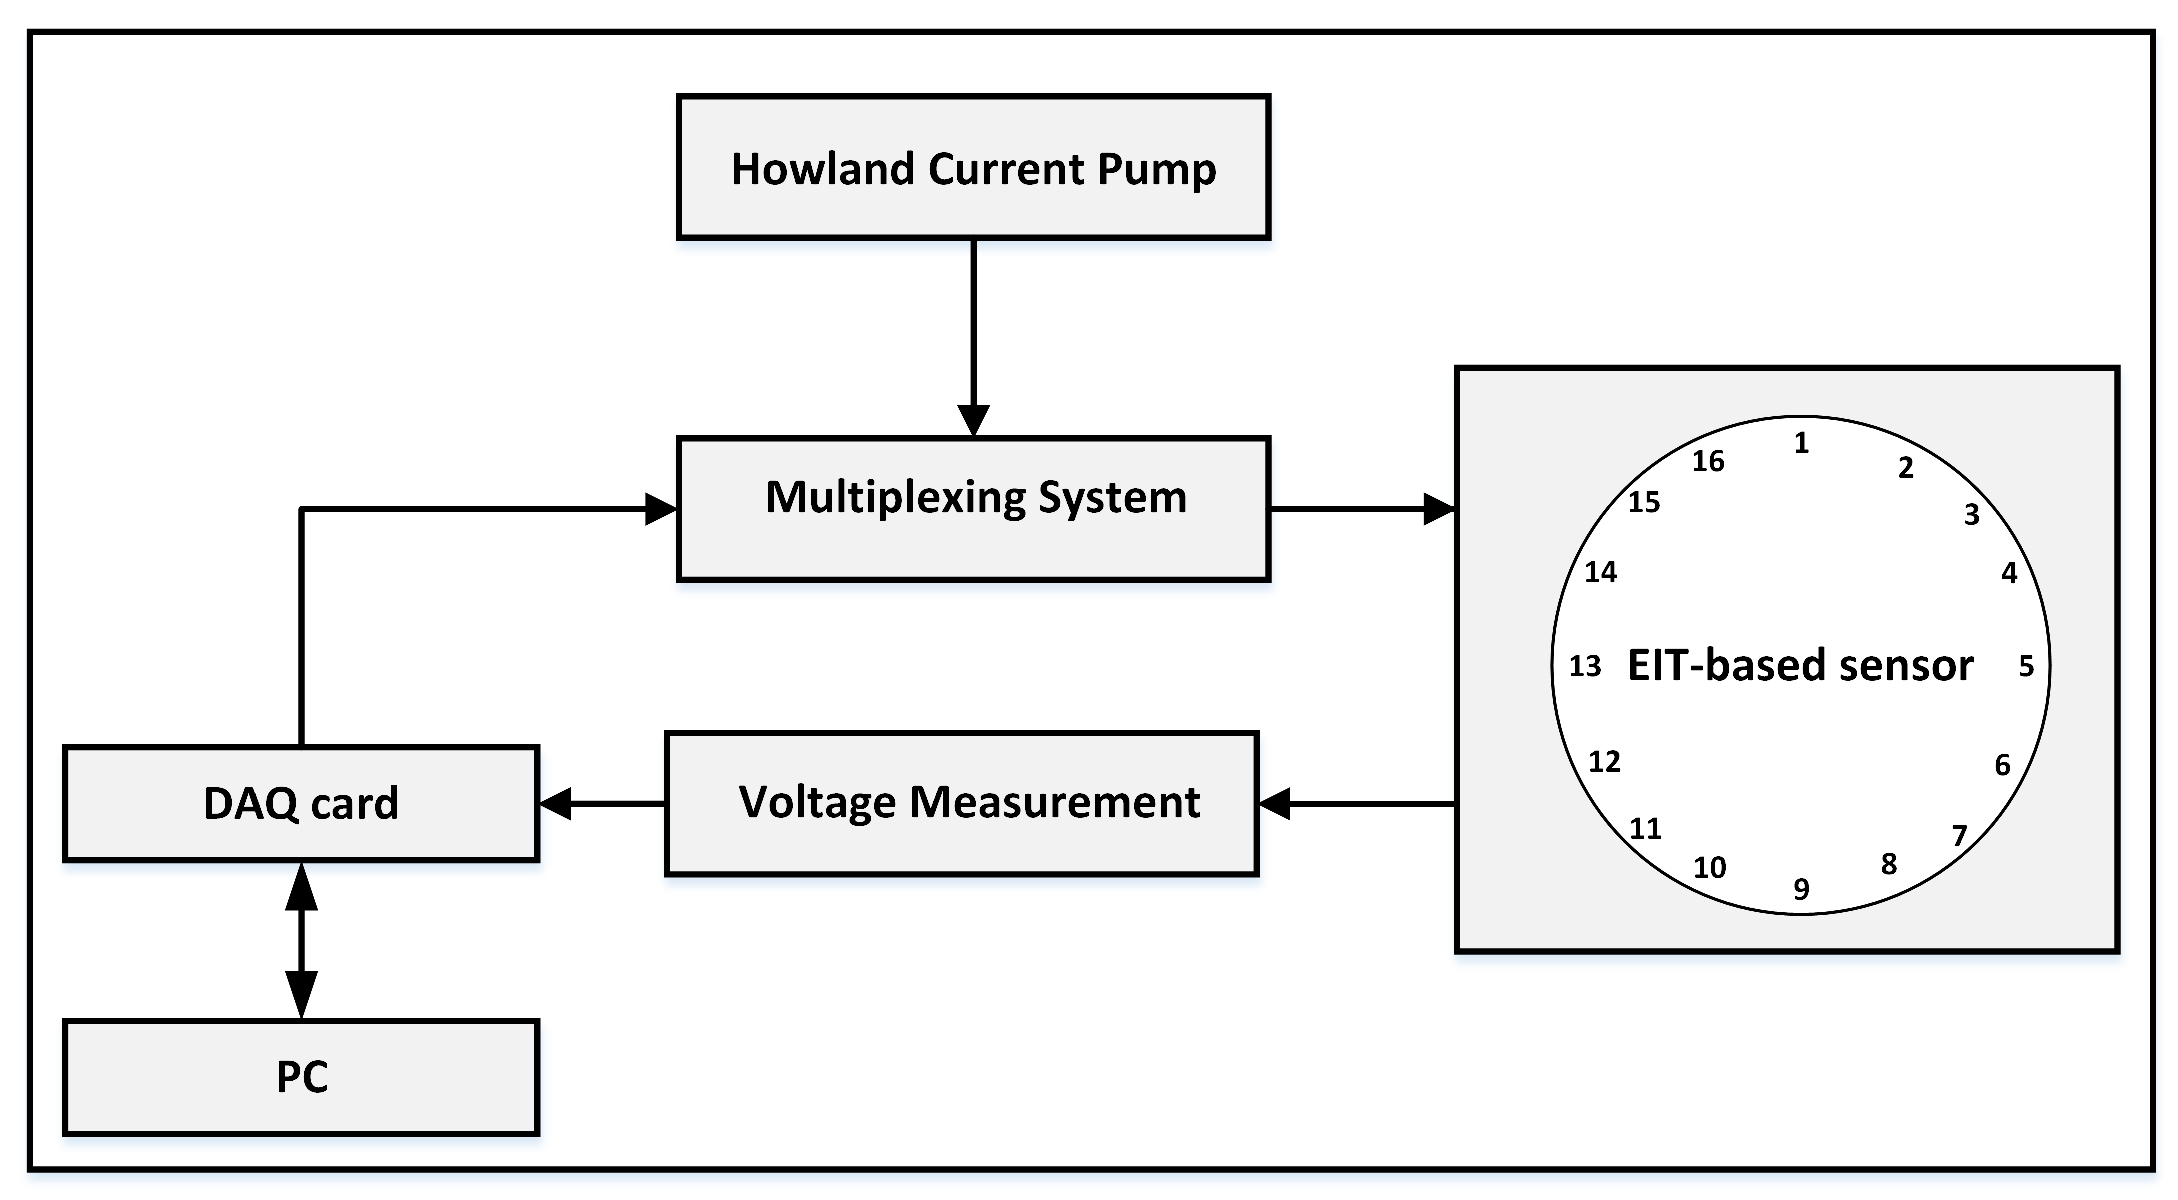
To further clarify the working principle of the system, a block diagram of our sensor system setup is shown in Figure 3.

3. EIT-Based Stretchable Sensor

Our EIT-based sensor is realized using a thin, stretchable piezoresistive fabric material that translates touch pressure into local changes in its resistivity. We have taken inspiration from the work of [9], and have followed our previous work [18], in which we developed the first prototype of an eight-electrode pressure-responsive sensor based on EIT.
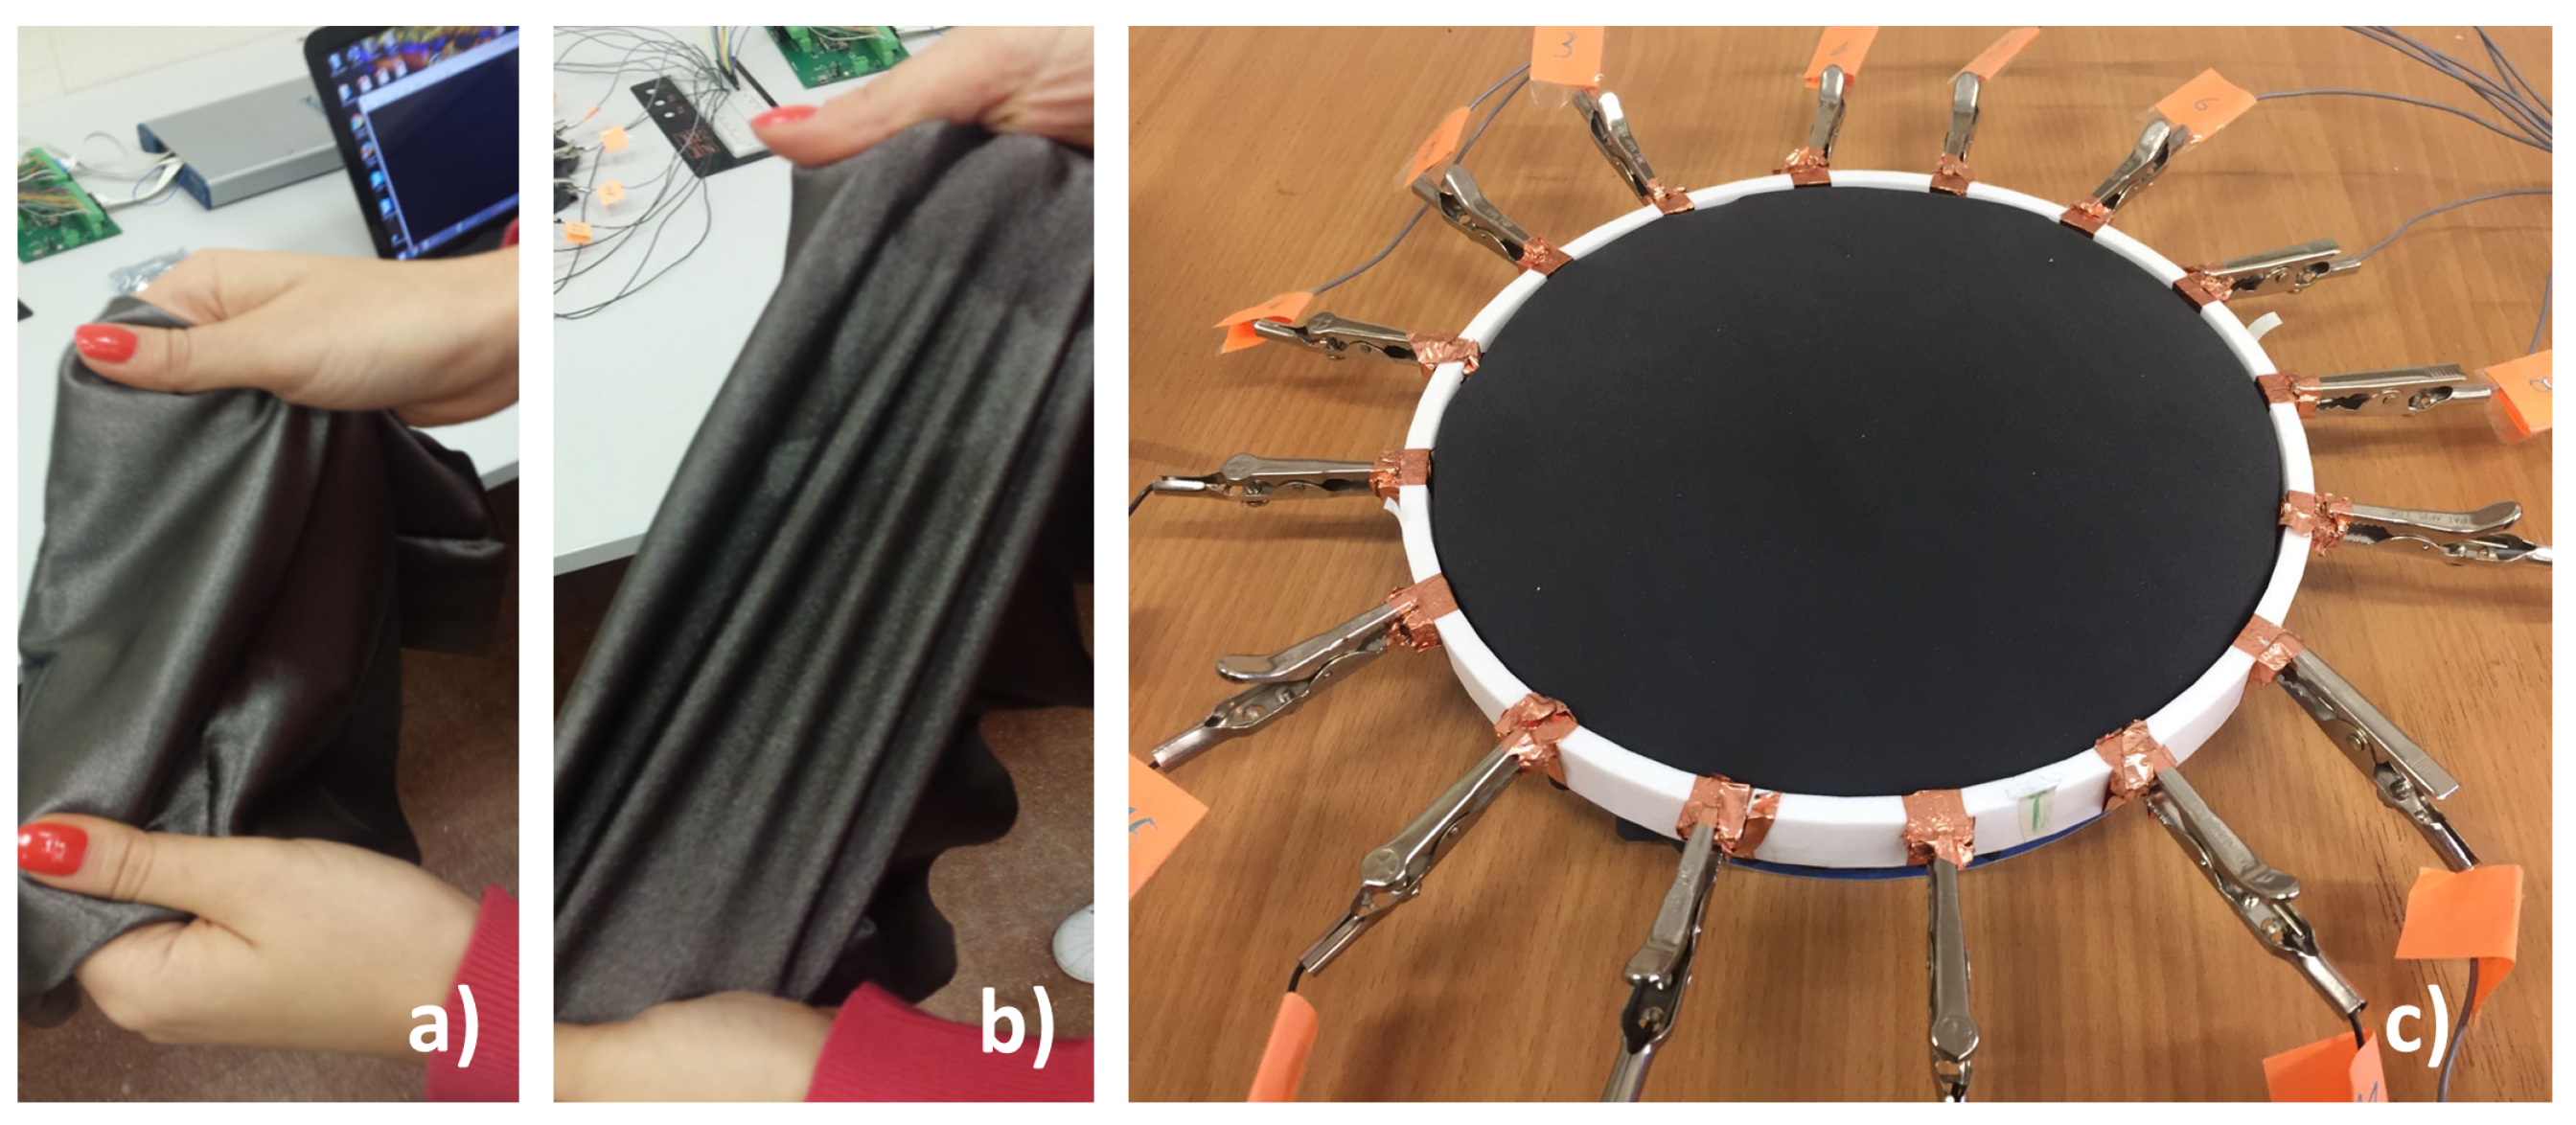
In this paper, we present our 16-electrode sensor, which is based on a conductive stretchable fabric from the Eeonyx Corporation, made with nylon and coated with conductive doped polypyrrole (Figure 4a,b). The material has a surface resistance of 30 K Ω , and it is low-cost and lightweight. A 3D-printed circular frame made of two disc layers is used to house the conductive sheet. The frame presents 16 extrusions, where conductive copper stripes are placed to create the electrodes. The conductive fabric is then placed between the two discs, firmly in contact with the surrounding electrodes, as shown in Figure 4c.
Although a mathematical framework for an EIT-based pressure-sensor membrane was presented in [19], this model was also based on the hypothesis of incompressibility, which is not sufficient for the conductive fabric employed in this work. Here, we have relied on the model of [1], which presents a more general approach to solve the EIT inverse problem.
The image of the pressure contacts over the sensor is reconstructed by comparing two voltage data sets: V 0 is used as a background reference and V 1 is the resulting potential measured when pressure is applied. Additionally, as the DAQ card is constantly updating V 1 , this method guarantees that no initial calibration is needed.

Image Reconstruction

The image reconstruction is carried out using a MATLAB program based on the EIDORS package [20], which is available under a General Public License. After the image ( x O ^ ) 
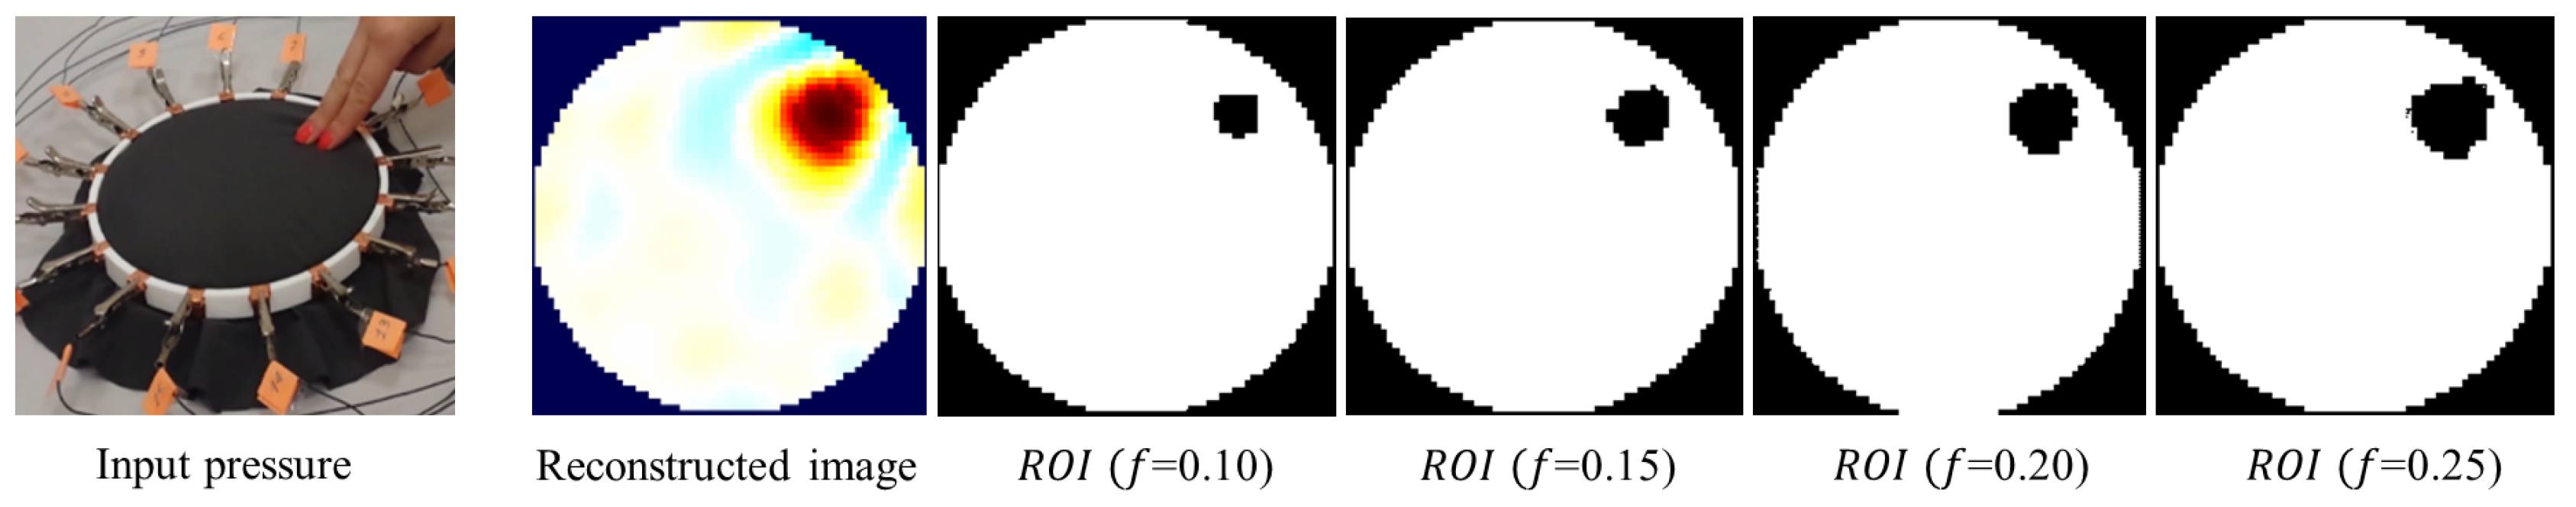
of the conductivity changes is reconstructed, it requires post-processing, as it presents artefacts due to noise and possible electrode movement. To minimize these effects, we work on the image pixel values [ x O ^ ] i and select the region of interest (ROI) in which the maximum amount of conductivity change has taken place. The processed image ( x P ^ ) is found as follows:
[ x P ] ^ i = [ x O ^ ] i if [ x O ^ ] i f · m a x ( x O ^ ) 0 otherwise
where [ x P ] ^ i are the pixel values of ( x P ^ ), and f is the threshold for the selection. The ROI is therefore the region of ( x O ^ ) for which the pixels of ( x P ^ ) are non-zero.
Is it clear that, because the choice of f determines the size of the ROI, it has a great impact on the final image, as shown in Figure 5. A number of studies have been conducted regarding the best choice of the threshold factor [7,21], but still heuristic selection is very common. In our case, we choose f = 0.10, as it performed best in our experiments.

4. Measurement Results

4.1. Voltage Data Parameters

The tests shown here were conducted using the adjacent stimulation method for the current injection and measurement pattern because of its well-known use in EIT literature. In this method, two neighbours’ electrodes are used for the current stimulation, while voltage data is read between the remaining adjacent electrode pairs, as seen in Figure 1. Other types of strategies can be used, but these are outside the scope of this paper. An explanation on the different drive pattern typologies can be found in [22].
The tests presented here were performed by using a current of I = 32 μ A and a power supply of 16 V. This configuration gives a power consumption of about 10 mW, which is far lower than that presented in literature. This value can be further reduced to 3 mW when using a current of 10 μ A supplied with a power supply of 5 V.
In order to judge the quality of the resulting signal, we use the SNR:
S N R = 20 log 10 | E [ V i ] | V a r ( V i )
where E [ V i ] is the mean of multiple measurements for each channel and V a r ( V i ) is the variance between these measurements.
In Table 1, the mean SNR and the mean absolute deviation (MAD) among different measurement sets are shown for both tested currents. The results demonstrate that, in order to further reduce the power consumption, the drive current amplitude must be decreased without greatly affecting the system performance.

4.2. Boundary Data Collection

We chose a sample time for the voltage readings of 62,500 samples/s and selected the multiplexers’ input and output channels for the 16 current injections through the digital output voltages of the DAQ. Additionally, the total number of collected samples for each channel was selected via software to be 800, which made it 50 for each injection step; this number guaranteed a data collection rate of 78 Hz, which was adequate to have a temporal resolution suitable for EIT touch-sensing applications.
Figure 6 shows an example of the voltage data set acquired through the first DAQ differential channel, namely the difference between electrodes 1 and 2 at each current injection step. The profile of the boundary data potentials indicates the effective multiplexers’ channel switching with a precise conveyance of the control digital bits. Additionally, the image shows that choosing a number of samples for each channel equal to 800 is a good compromise between reaching the static conditions at each time step and having a fast data set update rate. In fact, it is visible that the effects of transients are negligible after just 25 samples. For each current injection time step, the mean value of the samples is calculated after the static conditions are reached. This is then used as the final value for calculating the 208 voltage data set, as seen in Figure 7. In order to qualitatively demonstrate the quality of the hardware setup and the voltage data, Figure 8 shows the reconstructed images when a pressure input is applied in different positions over the sensor. In the reconstructed figures, a red colour indicates a positive change in the conductivity, while a blue colour represents the ringing artefacts, which are bands or “ghosts” near the edges, typical of linear filters such as EIT systems.

5. Conclusions

A high-speed EIT system that concurrently implements constant current injection and differential potential measurements has been developed for EIT-based sensor applications.
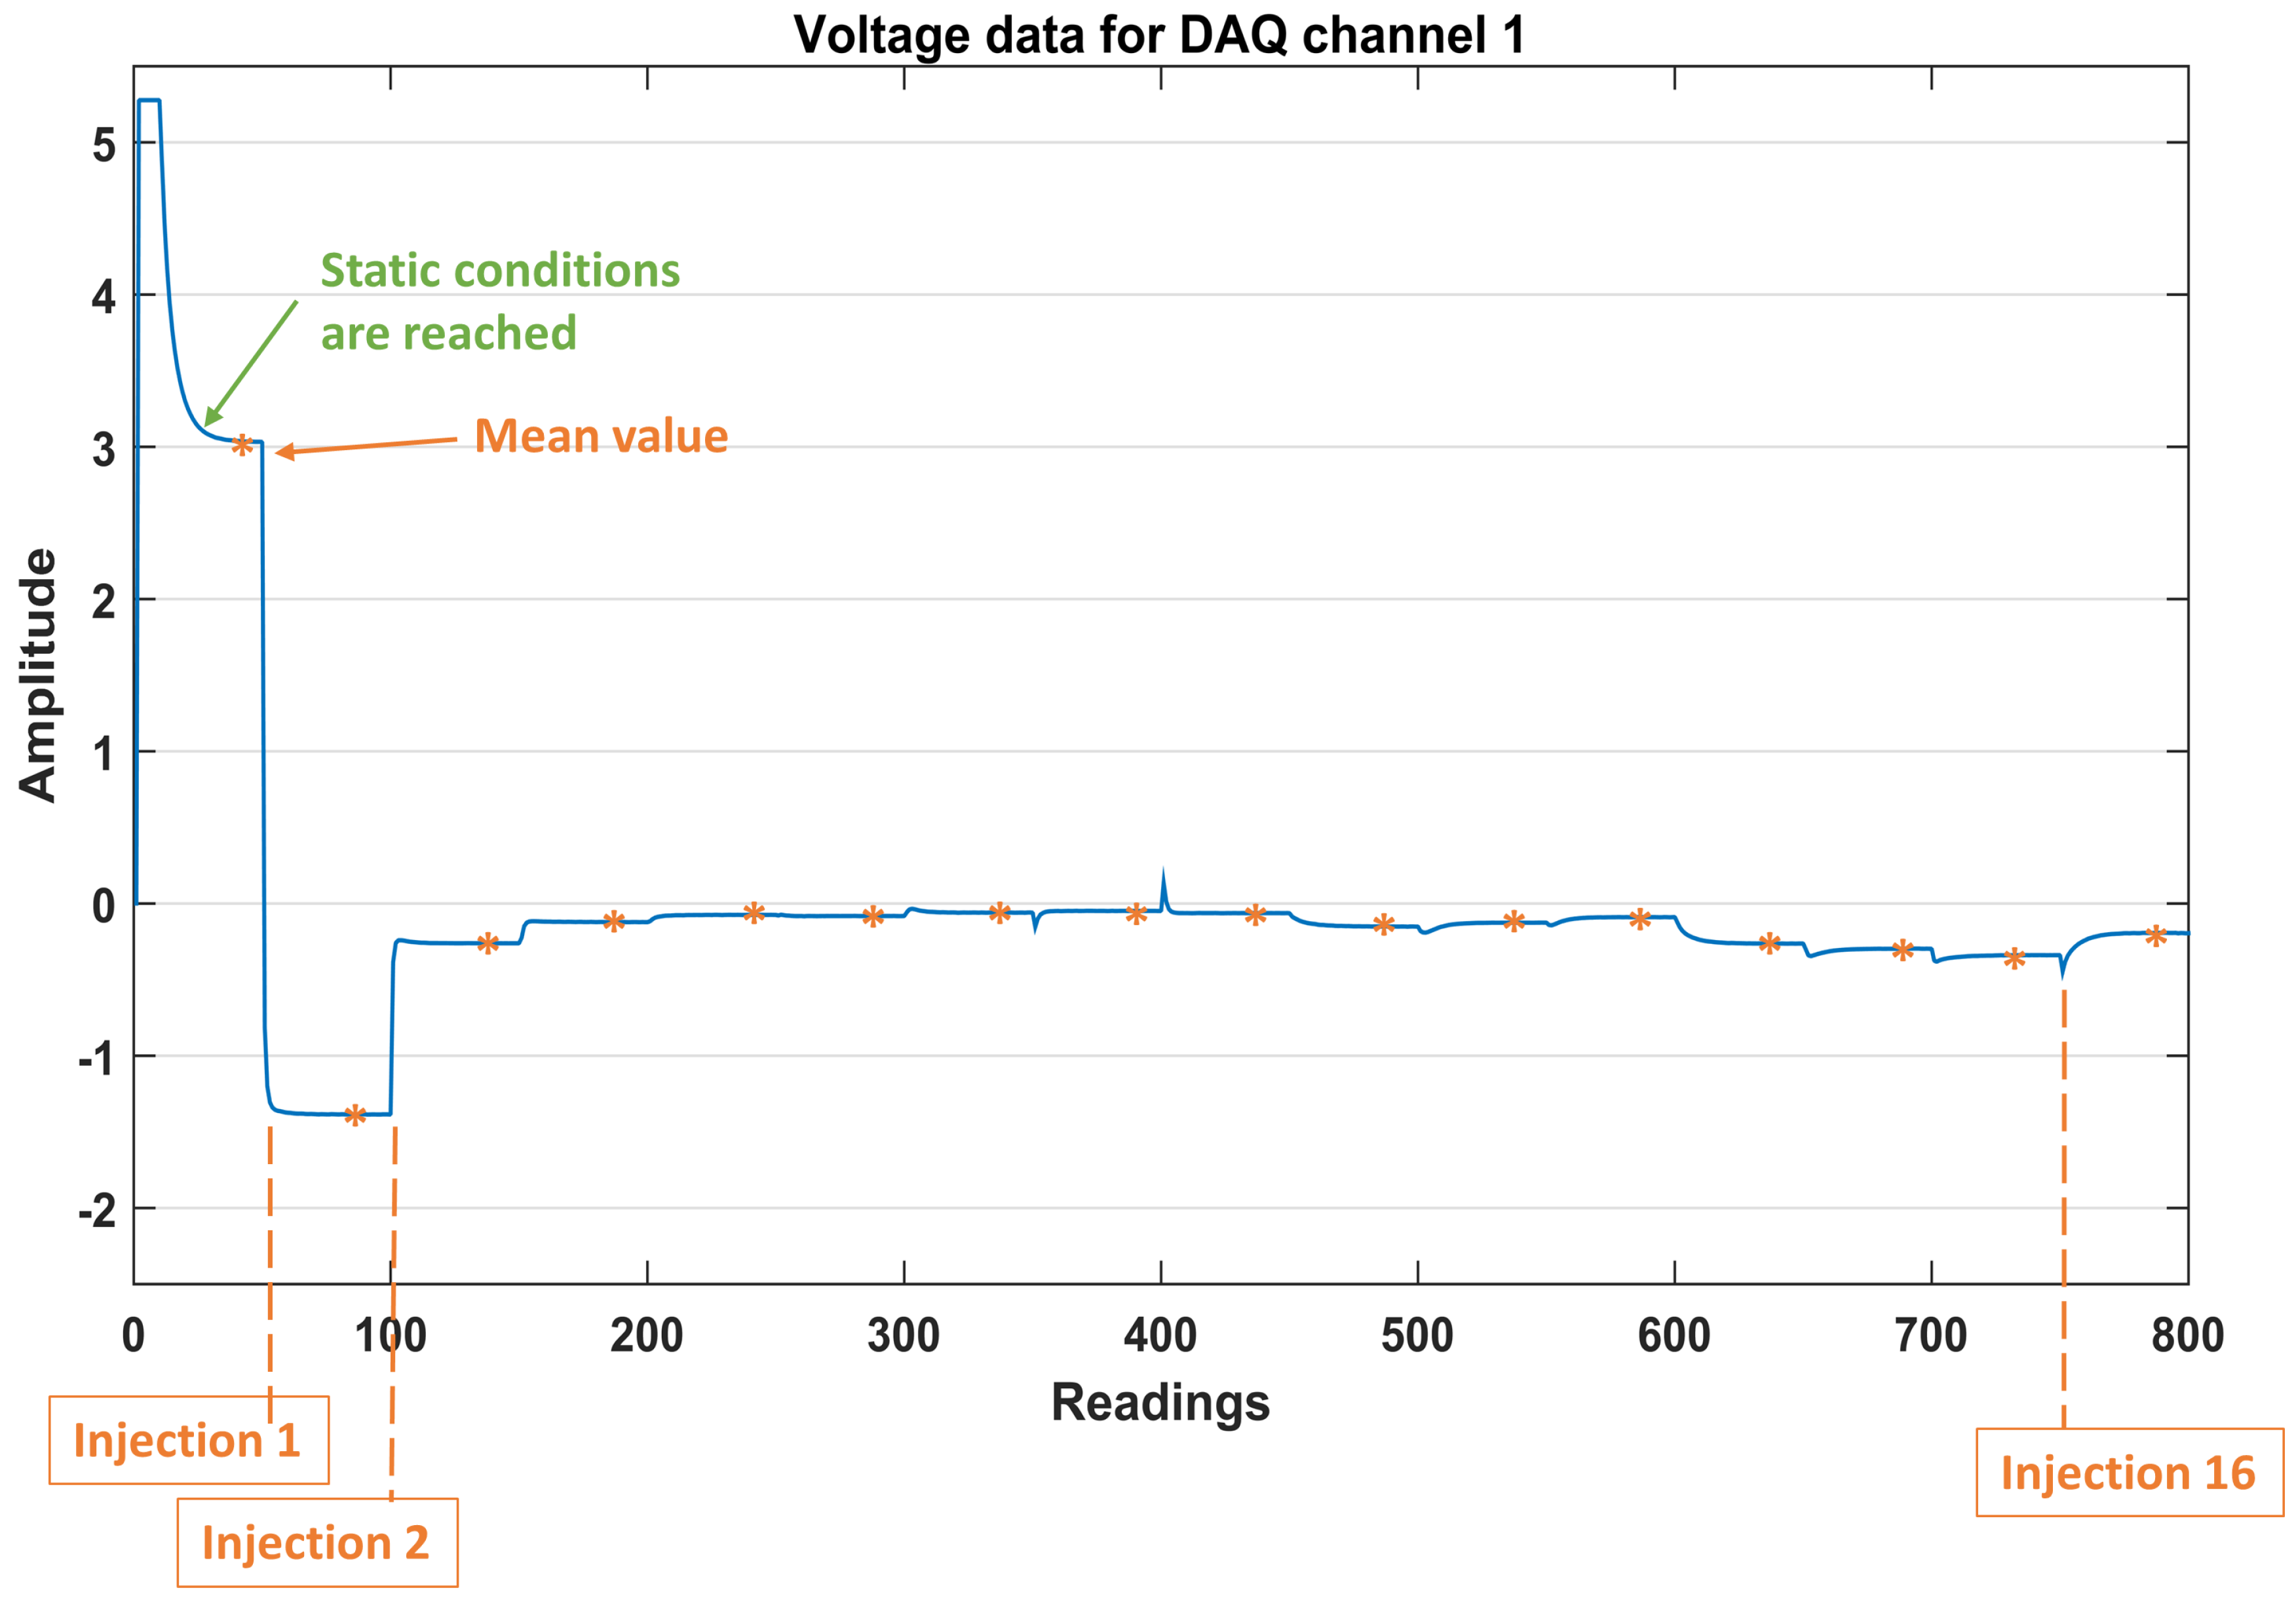
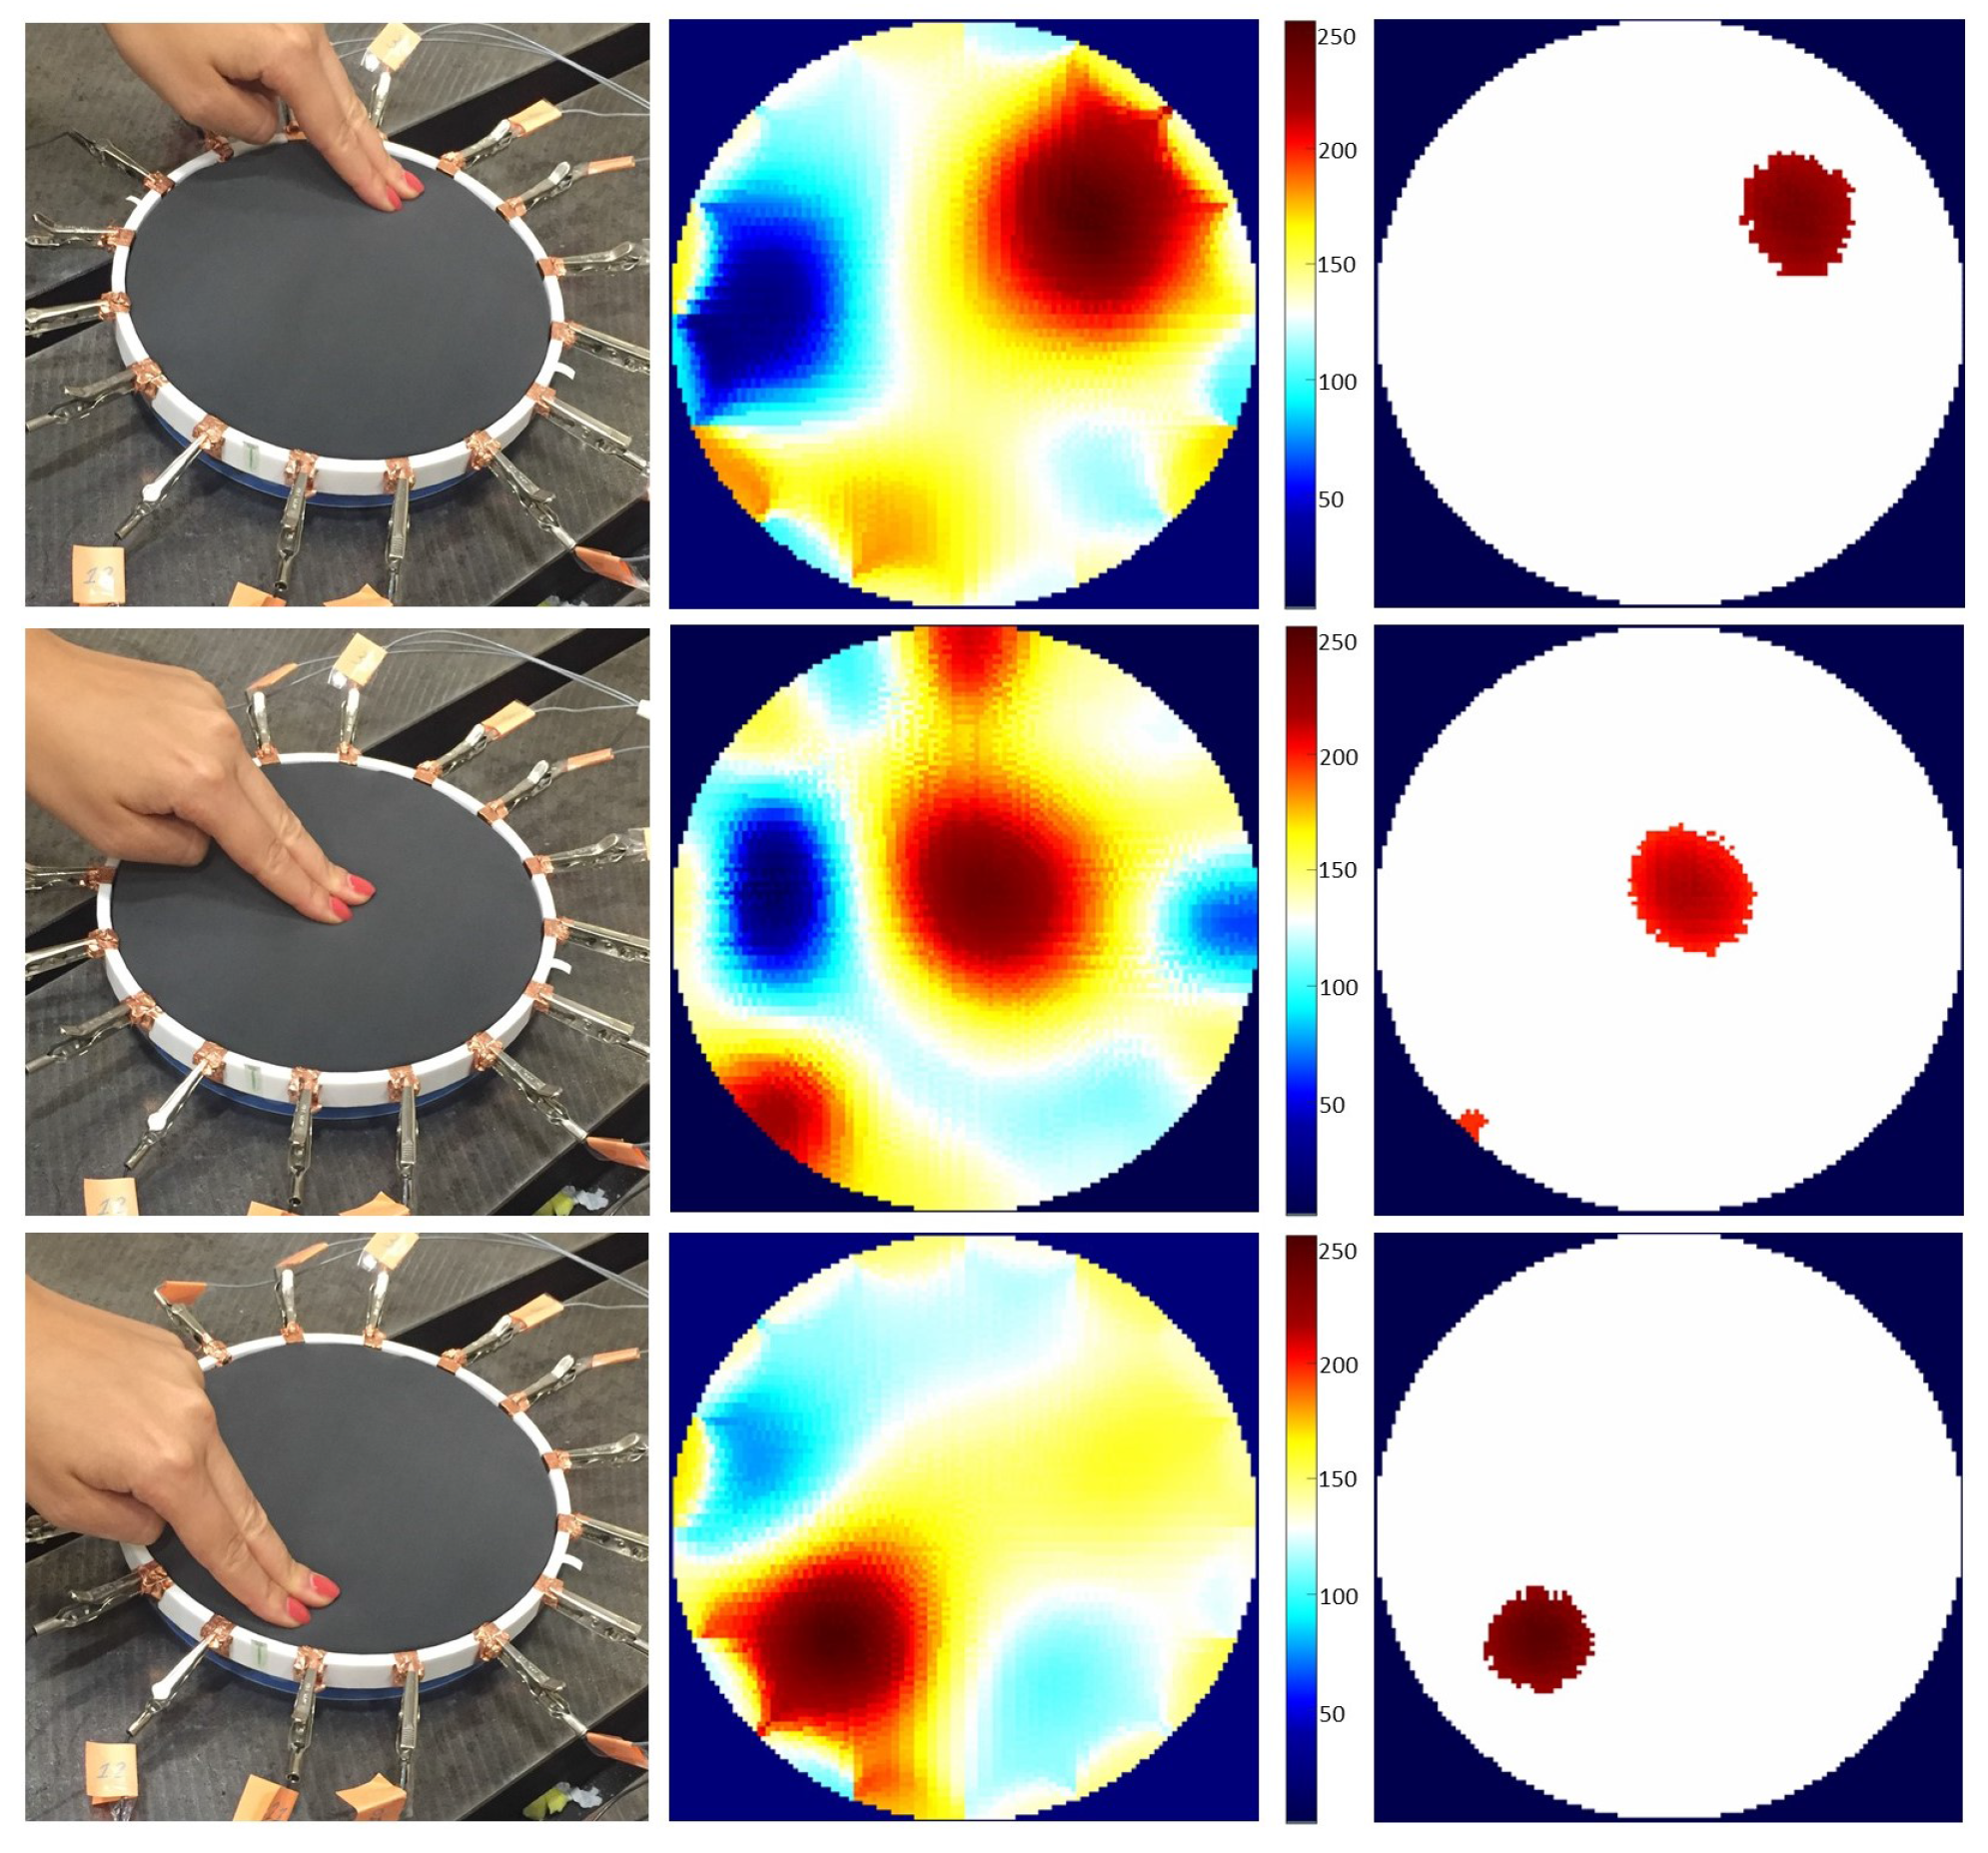
Our customized PCB design implements a Howland current pump and two analog multiplexers for the constant current injection. They are controlled using a 10 bit digital signal originating from the DAQ. The voltage data measured at the electrodes placed around the fabric sensor show the multiplexers operating in the required sequence, and also show that the data is successfully acquired for reconstructing the image of the pressure input on the stretchable sensor. The reconstructed images for different contact points over the sensor demonstrate the efficiency of our EIT-based sensor.
Our system is able to capture data at 78 frames/s and its power consumption can be brought down to 3 mW when using a current of 10 μ A supplied at 5 V.
The advantages of this approach in contrast to those found in the literature are the following: (a) the less complicated hardware design makes it low-cost and more suitable for wearable systems, and (b) it has a low power consumption. Furthermore, our design is advantageous for touch-sensing applications, as its high speed guarantees that the voltage data collection is complete before any noticeable change in conductivity occurs.

Supplementary Materials

The following are available online at https://www.mdpi.com/2227-7080/5/3/48/s1: Video S1: EIT Sensor.

Acknowledgments

The research leading to these results has received funding from the People Programme (Marie Curie Actions) of the European Union Seventh Framework Programme FP7/2007-2013/ under REA grant agreement number 608022.

Author Contributions

Stefania Russo, Nicola Carbonaro and Alessandro Tognetti developed the PCB; Stefania Russo performed the experiments, analyzed the data and wrote the paper, in collaboration with Nicola Carbonaro and Alessandro Tognetti. Samia Nefti-Meziani supervised the work. All authors have read and approved the final manusript.

Conflicts of Interest

The authors declare no conflict of interest.

References

  1. Holder, D.S. Electrical Impedance Tomography: Methods, History and Applications; Institute of Physics, IoP Publishing: Bristol, UK; Philadelphia, PA, USA, 2004. [Google Scholar]
  2. Bayford, R.H. Bioimpedance tomography (electrical impedance tomography). Annu. Rev. Biomed. Eng. 2006, 8, 63–91. [Google Scholar] [CrossRef] [PubMed]
  3. Smith, R.W.; Freeston, I.L.; Brown, B.H. A real-time electrical impedance tomography system for clinical use-design and preliminary results. IEEE Trans. Biomed. Eng. 1995, 42, 133–140. [Google Scholar] [CrossRef] [PubMed]
  4. Bodenstein, M.; David, M.; Markstaller, K. Principles of electrical impedance tomography and its clinical application. Crit. Care Med. 2009, 37, 713–724. [Google Scholar] [CrossRef] [PubMed]
  5. Tallman, T.; Gungor, S.; Wang, K.; Bakis, C. Damage detection and conductivity evolution in carbon nanofiber epoxy via electrical impedance tomography. Smart Mater. Struct. 2014, 23, 045034. [Google Scholar] [CrossRef]
  6. Knight, R.; Lipczynski, R. The use of EIT techniques to measure interface pressure. In Proceedings of the Twelfth Annual International Conference of the IEEE, Philadelphia, PA, USA, 1–4 November 1990. [Google Scholar]
  7. Silvera-Tawil, D.; Rye, D.; Soleimani, M.; Velonaki, M. Electrical impedance tomography for artificial sensitive robotic skin: A review. IEEE Sens. J. 2015, 15, 2001–2016. [Google Scholar] [CrossRef]
  8. Silvera Tawil, D.; Rye, D.; Velonaki, M. Interpretation of the modality of touch on an artificial arm covered with an EIT-based sensitive skin. Int. J. Robot. Res. 2012, 31, 1627–1641. [Google Scholar] [CrossRef]
  9. Nagakubo, A.; Alirezaei, H.; Kuniyoshi, Y. A deformable and deformation sensitive tactile distribution sensor. In Proceedings of the IEEE International Conference on Robotics and Biomimetics, Sanya, China, 15–18 December 2007. [Google Scholar]
  10. Tang, M.; Wang, W.; Wheeler, J.; McCormick, M.; Dong, X. The number of electrodes and basis functions in EIT image reconstruction. Physiol. Meas. 2002, 23, 129. [Google Scholar] [CrossRef] [PubMed]
  11. Granot, Y.; Ivorra, A.; Rubinsky, B. Frequency-division multiplexing for electrical impedance tomography in biomedical applications. Int. J. Biomed. Imaging 2007. [Google Scholar] [CrossRef] [PubMed]
  12. Gevers, M.; Gebhardt, P.; Westerdick, S.; Vogt, M.; Musch, T. Fast electrical impedance tomography based on code-division-multiplexing using orthogonal codes. IEEE Trans. Instrum. Meas. 2015, 64, 1188–1195. [Google Scholar] [CrossRef]
  13. Wilkinson, A.J.; Randall, E.; Cilliers, J.; Durrett, D.; Naidoo, T.; Long, T. A 1000-measurement frames/second ERT data capture system with real-time visualization. IEEE Sens. J. 2005, 5, 300–307. [Google Scholar] [CrossRef]
  14. Tawil, D.S. Artificial skin and the interpretation of touch for human-robot interaction. Ph.D. thesis, University of Sydney, New South Wales, Australia, 2012. [Google Scholar]
  15. Yao, A.; Soleimani, M. A pressure mapping imaging device based on electrical impedance tomography of conductive fabrics. Sens. Rev. 2012, 32, 310–317. [Google Scholar] [CrossRef]
  16. Geselowitz, D.B. An application of electrocardiographic lead theory to impedance plethysmography. IEEE Trans. Biomed. Eng. 1971, 38–41. [Google Scholar] [CrossRef]
  17. Sheingold, D. Impedance & admittance transformations using operational amplifiers. Lightning Empiricist 1964, 12, 1–8. [Google Scholar]
  18. Russo, S.; Meziani, S.N.; Gulrez, T.; Carbonaro, N.; Tognetti, A. Towards the Development of an EIT-based Stretchable Sensor for Multi-Touch Industrial Human-Computer Interaction Systems. In Proceedings of the International Conference on Cross-Cultural Design, Toronto, ON, Canada, 17–22 July 2016. [Google Scholar]
  19. Ammari, H.; Kang, K.; Lee, K.; Seo, J.K. A Pressure Distribution Imaging Technique with a Conductive Membrane using Electrical Impedance Tomography. SIAM J. Appl. Math. 2015, 75, 1493–1512. [Google Scholar] [CrossRef]
  20. Adler, A.; Lionheart, W.R. Uses and abuses of EIDORS: An extensible software base for EIT. Physiol. Meas. 2006, 27, S25. [Google Scholar] [CrossRef] [PubMed]
  21. Naushad, A.; Rashid, A.; Mazhar, S. Analysing the performance of EIT images using the point spread function. In Proceedings of the International Conference on Emerging Technologies (ICET), Islamabad, Pakistan, 8–9 December 2014. [Google Scholar]
  22. Shi, X.; Dong, X.; Shuai, W.; You, F.; Fu, F.; Liu, R. Pseudo-polar drive patterns for brain electrical impedance tomography. Physiol. Meas. 2006, 27, 1071. [Google Scholar] [CrossRef] [PubMed]
Figure 1. First and last steps of the current injection and voltage measurement sequence are shown for our 16-electrode system. For each step, the current is injected between two electrode pairs, while those remaining are used to measure the corresponding voltages. The process is repeated until every adjacent electrode pair has served for current injection.
Technologies 05 00048 g001
Figure 2. On the left, our customized printed circuit board (PCB) is shown. On the right, schematics of the PCB in our proposed electrical impedance tomography (EIT) system, with the sensor connection block, two multiplexers, and a Howland current pump are shown. The board can be supplied with either USB or a wall block power supply.
Technologies 05 00048 g002
Figure 3. Block diagram of the EIT-based sensor system for current injection and voltage measurement.
Technologies 05 00048 g003
Figure 4. Our EIT-based stretchable sensor. In (a), the conductive fabric material in shown, and (b) shows the material when stretched. In (c), the conductive fabric is placed between the two 3D printed discs.
Technologies 05 00048 g004
Figure 5. Examples of reconstructed images after a conductivity change has taken place on the stretchable pressure sensor. From left to right, the raw reconstructed image with a positive conductivity change (in red), and the region of interest (ROI) with different threshold factors f.
Technologies 05 00048 g005
Figure 6. Measured voltage output signal on DAQ channel 1, obtained with 16 sequential DC current excitation signals. Mean values were calculated at each injection time step for each channel after the static conditions were reached, and contributed to creating the final voltage data set.
Technologies 05 00048 g006
Figure 7. An example of a 208 voltage data set for a typical 16-electrode EIT system.
Technologies 05 00048 g007
Figure 8. Reconstructed images for a pressure input applied in different locations over the sensor. On the right is the final image showing the ROI representing the maximum conductivity change. A red colour indicates an increase in the conductivity.
Technologies 05 00048 g008
Table 1. Mean signal-to-noise ratio (SNR; dB) and mean absolute deviation (MAD; mV) in the case of two different current amplitudes.
I = 32 μ AI = 10 μ A
SNR5549
MAD0.50.4

