Brief Report

Ant Colony Algorithm for Energy Saving to Optimize Three-Dimensional Bonding Chips’ Thermal Layout

1
Key Laboratory of Advanced Technique & Preparation for Renewable Energy Materials, Ministry of Education, Yunnan Normal University, Kunming 650500, China
2
Chongqing Key Laboratory of Nonlinear Circuits and Intelligent Information Processing, Southwest University, Chongqing 400715, China
*
Authors to whom correspondence should be addressed.
Technologies 2023, 11(5), 122; https://doi.org/10.3390/technologies11050122
Submission received: 7 August 2023 / Revised: 27 August 2023 / Accepted: 7 September 2023 / Published: 10 September 2023
(This article belongs to the Section Construction Technologies)

Abstract

:
The thermal effect and heat dissipation have a significant impact on three-dimensional stacked chips, and the positional layout of the chip’s three-dimensional layout directly affects the internal temperature field. One effective way is to plan the overall layout of three-dimensional integrated circuits by considering the thermal effect and layout utilization. In this paper, an ant colony algorithm is used to search for the most planned paths and achieve the overall layout optimization by considering the effects of power, temperature, and location on the thermal layout and using feedback optimization of pheromone concentration. The simulation results show that the optimization of the thermal layout of 3D integrated circuits can be well realized by adjusting the algorithm parameters. The maximum temperature, temperature gradient, and layout scheme verify reliability and practicability. It improves the utilization rate of chips, optimizes the layout, realizes energy conservation, and reduces resource waste.

1. Introduction

Chip layout stands as an intricate and time-intensive phase within the chip design process. The challenge lies in orchestrating the integration of essential functionalities within constrained space, all while minimizing power consumption, enhancing performance, and optimizing area utilization—collectively referred to as power, performance, and area (PPA) considerations. This endeavor must also navigate the intricacies of density constraints and wiring congestion, further compounding its complexity. As such, addressing these multifaceted demands has remained a persistent focal point of both industry concern and dedicated research. In the realm of two-dimensional network distribution, a multitude of researchers have turned to the Reinforcement Learning paradigm to tackle the chip layout conundrum [1,2,3,4,5,6]. This approach capitalizes on model training to attain a configuration that delivers the minimal PPA. By doing so, it paves the way for holistic optimization, encompassing factors such as convergence rate, chip dimensions [7,8], algorithm precision, and other pivotal aspects. The refinement of the training model plays a pivotal role in honing the chip layout, effecting improvements across various dimensions.
In the midst of rapid modern society development, the issues of energy consumption and resource wastage hold significant importance. Researchers have consistently directed their focus toward achieving efficient resource and energy utilization. In the age of artificial intelligence, the collaboration of machine learning, neural networks, and Internet of Things technology has exerted a crucial influence on green energy advancement. The concurrent progress of society through efficient artificial intelligence development has both propelled the chip industry’s growth and presented it with challenges. Simultaneously, the swift evolution of the chip sector has engendered heightened complexity in the functionalities of modern chips and an associated increase in chip size. This growth has spurred the development of intricate process technology, thereby giving rise to cost-related concerns. These concerns encompass not just elevated manufacturing costs but also escalated design expenses. Furthermore, the exchange of data between chips has burgeoned exponentially, surpassing the capacities of traditional chip packaging methods. This scenario underscores the critical role of research into three-dimensional bonded chips, a vital enabler of energy efficiency and rapid industry progression in the post-Moore era [9,10,11,12].
In comparison to conventional two-dimensional integrated chips, three-dimensional bonded chips adopt a vertical stacking approach that accommodates multiple device layers. This arrangement reduces the count of global interconnections and minimizes the length of direct connections through vertical interconnections. Owing to their augmented chip density, three-dimensional bonded chips exhibit enhanced versatility. Nevertheless, the practice of chip stacking introduces a pronounced challenge in heat dissipation. The stacking configuration facilitates heat accumulation, substantially elevating the heat flow density per unit area. Without effective dissipation mechanisms, the propensity for overheating or even failure due to chip stacking increases, thereby engendering chip thermal reliability issues. Hence, during the structural design phase, conducting topology optimization and parameter fine-tuning for the chip becomes paramount. These actions yield an optimized heat distribution outcome, mitigating potential thermal problems. Additionally, investigating diverse power distributions in multi-tier stacking holds paramount significance for the comprehensive design of 3D packaging and the attainment of a more judicious chip layout.
In the era of artificial intelligence, intelligent algorithms have played a crucial role in the development of human society. Numerous intricate combinatorial optimization challenges have arisen across diverse fields, including medicine [13,14], the military [15], and industry [16,17]. Faced with these substantial optimization tasks, conventional methods require traversing the entire search space, thus falling short of quick resolutions. To address such intricate optimization problems, intelligent algorithms inspired by biological population dynamics or natural phenomena have emerged. These algorithms, including the genetic algorithm, differential evolution, ant colony optimization, particle swarm optimization, and simulated annealing, have been widely adopted. They effectively alleviate industry pain points and significantly enhance operational efficiency, standing as key players within the realm of swarm intelligence theory. The ant colony algorithm, initially employed to tackle the Traveling Salesperson Problem (TSP), has demonstrated remarkable prowess. Its suitability for digital image processing stems from its discrete and parallel attributes. Leveraging these traits, the algorithm has yielded impressive optimization outcomes across domains like image feature extraction, edge detection, compression, segmentation, and classification. It has also garnered success in network routing, robotics, trajectory planning, and data mining. As a biomimetic metaheuristic optimization approach, the ant colony algorithm has showcased its aptitude for resolving multifaceted combinatorial optimization problems. This ability to collaboratively address complex challenges through the synergy of simple entities has garnered significant attention from researchers. Hence, this paper employs the classical ant colony algorithm to optimize three-dimensional layouts. In the context of thermal layout optimization, the algorithm exhibits improved outcomes compared to initial layouts [18]. However, it is worth noting that optimization algorithms themselves often possess certain limitations. For instance, while the genetic algorithm demonstrates strong ergodicity [19], it tends to yield suboptimal solutions. Similarly, although the simulated annealing algorithm excels in global optimization [20], it is prone to getting trapped in local optima. In contrast, the ant colony optimization algorithm adopts a recursive approach, emulating ant colony behaviors. Each individual perceives local information, providing feedback and constructing optimal layout schemes through traversal methods. Diverging from the single-item sharing mechanism of genetic particle swarm algorithms [21,22,23], the ant colony optimization algorithm introduces a positive feedback mechanism that introduces novel solutions for tackling complex problems. Through continuous local adjustments, convergence can be achieved by appropriately setting parameters [24]. In addition, another population based on the optimization biomimetic bacterial foraging optimization algorithm (BFO) and reheat problem distribution can result in a large computational load of the optimization algorithm and slow convergence speed [25]. As such, this paper employs the ant colony algorithm to ascertain the optimal layout for three-dimensional stacked chips.
The structure of the entire text is organized as follows: Section 1 functions as the introduction, furnishing an initial overview of the subject matter. In Section 2, a comprehensive presentation ensues, introducing the chip layout rules and the step-by-step implementation of the algorithm. Advancing, Section 3 underscores the algorithm’s outcomes, showcased alongside simulation displays, enhancing the clarity of visualization. Ultimately, the concluding section encapsulates the pivotal insights and discoveries of the article, bringing the study to its conclusion.

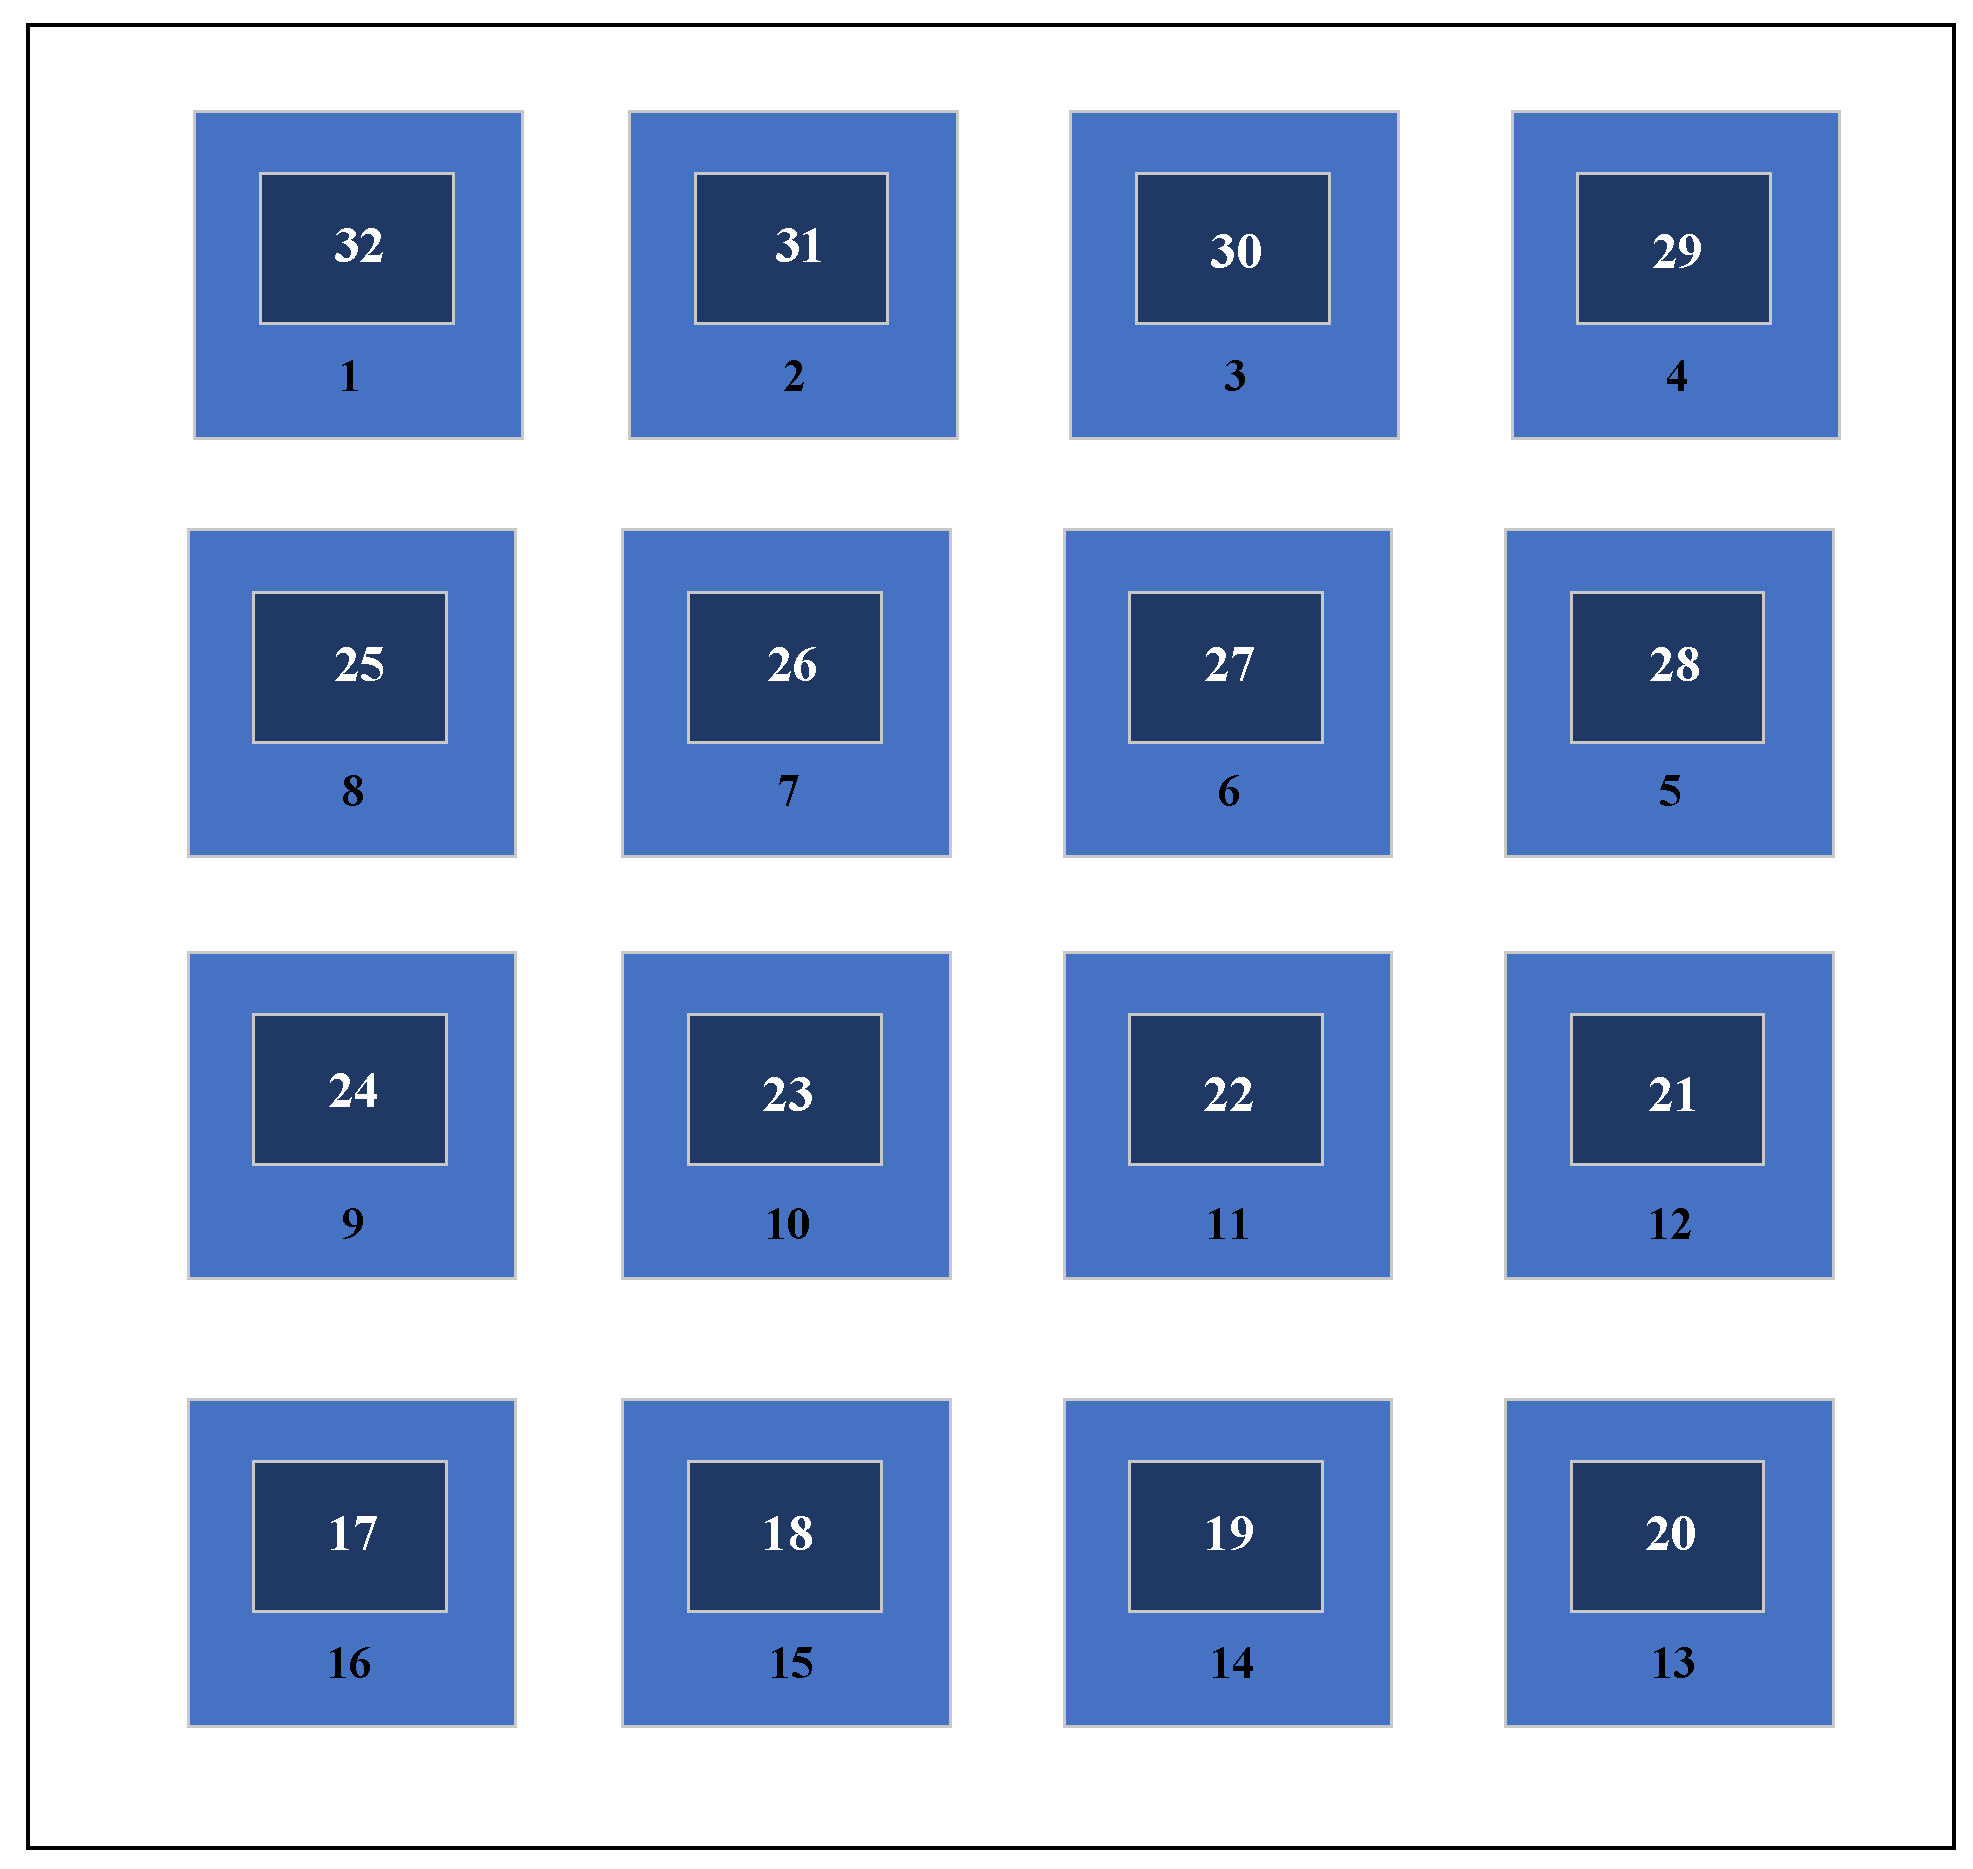
2. Description of Chip Layout

In this paper, a 4 × 4 chip layout is adopted, and 32 chips are stacked in two layers, as shown in Figure 1. In order to facilitate calculation, we denote that the chip materials are the same, the shapes are not exactly the same, and the power consumption is completely different. The bottom chip numbers are from 1 to 16, the power of each chip is 0.02–0.17 W, the chip size is 6   mm × 6   mm × 4   mm , the labels of the top coding chips are from 17 to 32, and the corresponding power of each chip is 0.06–0.21 W. The size of all the bottom chips is 8   mm × 8   mm × 4   mm . A heat source is set at the center of each chip, the ambient temperature is set to 25 °C, and the convective heat transfer coefficient is set to 10 W/m2K. The heat generation rate is applied to the unit as a bulk load, and the heat generation rate of the chip is equal to the power per unit volume of the chip.

2.1. Establishment of Ant Colony Optimization Model

The ant colony algorithm is rooted in the natural behavior of ants foraging for food, specifically addressing the shortest path problem they encounter [26,27]. In this algorithm, a collection of ants, functioning as agents, leverages external pheromone cues to collaboratively tackle intricate problems. This approach embodies the ant colony optimization algorithm, a potent meta-heuristic technique utilizing positive feedback principles to enhance optimization processes. Distinguished by its reliance on both pheromone and heuristic data, this algorithm stands apart from other biomimetic evolutionary methods. What sets ant colony optimization algorithms apart is their formidable robustness and adept search capabilities, enabling them to navigate uncharted territories effectively. These algorithms excel at exploring domains devoid of prior knowledge. They achieve optimal solutions through the synergy of individual ant efforts and group-level cooperation and communication. The algorithm’s strength lies in its distinctive positive feedback mechanism, rapidly amplifying pheromone accumulation along favorable paths while disregarding less promising routes. However, an inherent trade-off exists within this approach. While it empowers the algorithm to converge towards local optimal solutions, it also leaves it susceptible to being ensnared within such local minima. This dual nature—both advantageous and limiting—defines the algorithm’s behavior. Through parameter adjustments, the risk of entrapment in local optima can be mitigated, offering a degree of control over its convergence behavior. In this context, the concentration of pheromones is modeled based on the thermal effect stemming from the inter-chip distances. These pheromone concentrations guide agents in deducing layout solutions and reassembling the lowest temperature configurations. This process unfolds across numerous iterations, allowing the agents to progressively converge upon an optimal layout scheme.
In the algorithm, ants will randomly walk within a certain range, so they need to traverse all points in space. The primary components of the ACA include pheromone updating and probabilistic path selection. The pheromone level on a path is updated based on the quality of solutions found. This is carried out to amplify the attractiveness of good paths and diminish the attractiveness of poor paths. Let the scale of the ant colony be m , the number of chip layouts be n , the distance between the underlying chips i and j be d i j , the pheromone concentration accessed between i and j at time t be τ i j , and the pheromone concentration on each chip path at the initial time be the same; let τ i j 0 = τ 0 . The agent k determines the next chip to visit according to the pheromone concentration between each chip. The probability of selecting path i , j is given with
P i j k = τ i j t α × η i j t β s a l l o w k τ i s t α × η i s t β , s a l l o w k 0 , s a l l o w k
where a l l o w k indicates the list of data access allowed; α and β , respectively, denote the pheromone importance factor and expectation elicitation factor. α is the pheromone heuristic factor that represents the number of pheromones present on the path; more pheromones means more ants pass through the path, and vice versa, a small number of ants pass through. β is the expectancy heuristic factor that represents the consideration of the ants in choosing the importance of the node of the path; the higher its value, the higher the chances of moving to that point. Let η i j t = 1 d i j denote the heuristic function from i to j . Therefore, the pheromone concentration formula is updated to
τ i j t + 1 = 1 ρ τ i j t + Δ τ i j Δ τ i j = k = 1 m Δ τ i j k , 0 < ρ < 1
where Δ τ i j k denotes the pheromone concentration of the k -th ant from the i to j path. Let ρ indicate the information volatilization factor, i.e., the evaporation rate. After each iteration, a fraction of the pheromone evaporates to mimic real-world information decay.
In this paper, we utilize the local information of the ant’s path to calculate the released pheromone concentration; the volatilization process of pheromone traces is a process in which the concentration of pheromone traces on each connection is automatically and gradually weakened, and this volatilization process is mainly used to avoid the algorithm from concentrating to the local optimal region too quickly, which helps to expand the search area; it is shown as follows:
Δ τ i j k = θ d i j , k -th   ant   from   i   to   j 0 ,   otherwise
The pheromone level on a path is updated based on the quality of solutions found. This is carried out to amplify the attractiveness of good paths and diminish the attractiveness of poor paths.

2.2. The Selection of Fitness Function

The thermal superposition model proposed by Balwant et al. is utilized in this paper [28]; the temperature T i 0 of each chip and the influence of chip j on chip i are calculated, which is expressed with T j i . Therefore, the total temperature of a chip can be expressed as T i = T i 0 + j i n T j i , where n denotes the total number of chip stacks.
According to the thermal superposition model, the calculation formula of chip temperature shows as
T i 0 = 12.5 × 1 + 6.31 × A i / B i , 0 2.78 0.5
A i and B i , 0 separately means the power of the i -th chip and the power of the corresponding top chip.
In addition, the calculation formula of the heat-affected temperature of the chip is
T i j = 0.02 × A i / B i , 0 × 1 + 6.82 × d i j / R i 0.05 1.5
d i j is the distance between chips i and j , and R i is the equivalent radius of chip i .
It is also necessary to calculate the heat transferred from the upper chip to the lower chip. The heat conduction formula can be obtained as follows:
Q = δ S Δ T / Δ L
where Q is the heat flow of the chip; δ and S represent the heat conduction coefficient and heat transfer area, respectively; Δ T is the temperature difference between the upper and lower chips; Δ L represents the upper and lower heat conduction distance. Then, the ant colony algorithm is used to calculate the optimal layout of the bottom layer and find the layout scheme with the lowest temperature [29,30]. At this time, the temperature of the top layer is also the lowest temperature, so the thermal layout optimization of stacked chips is realized.

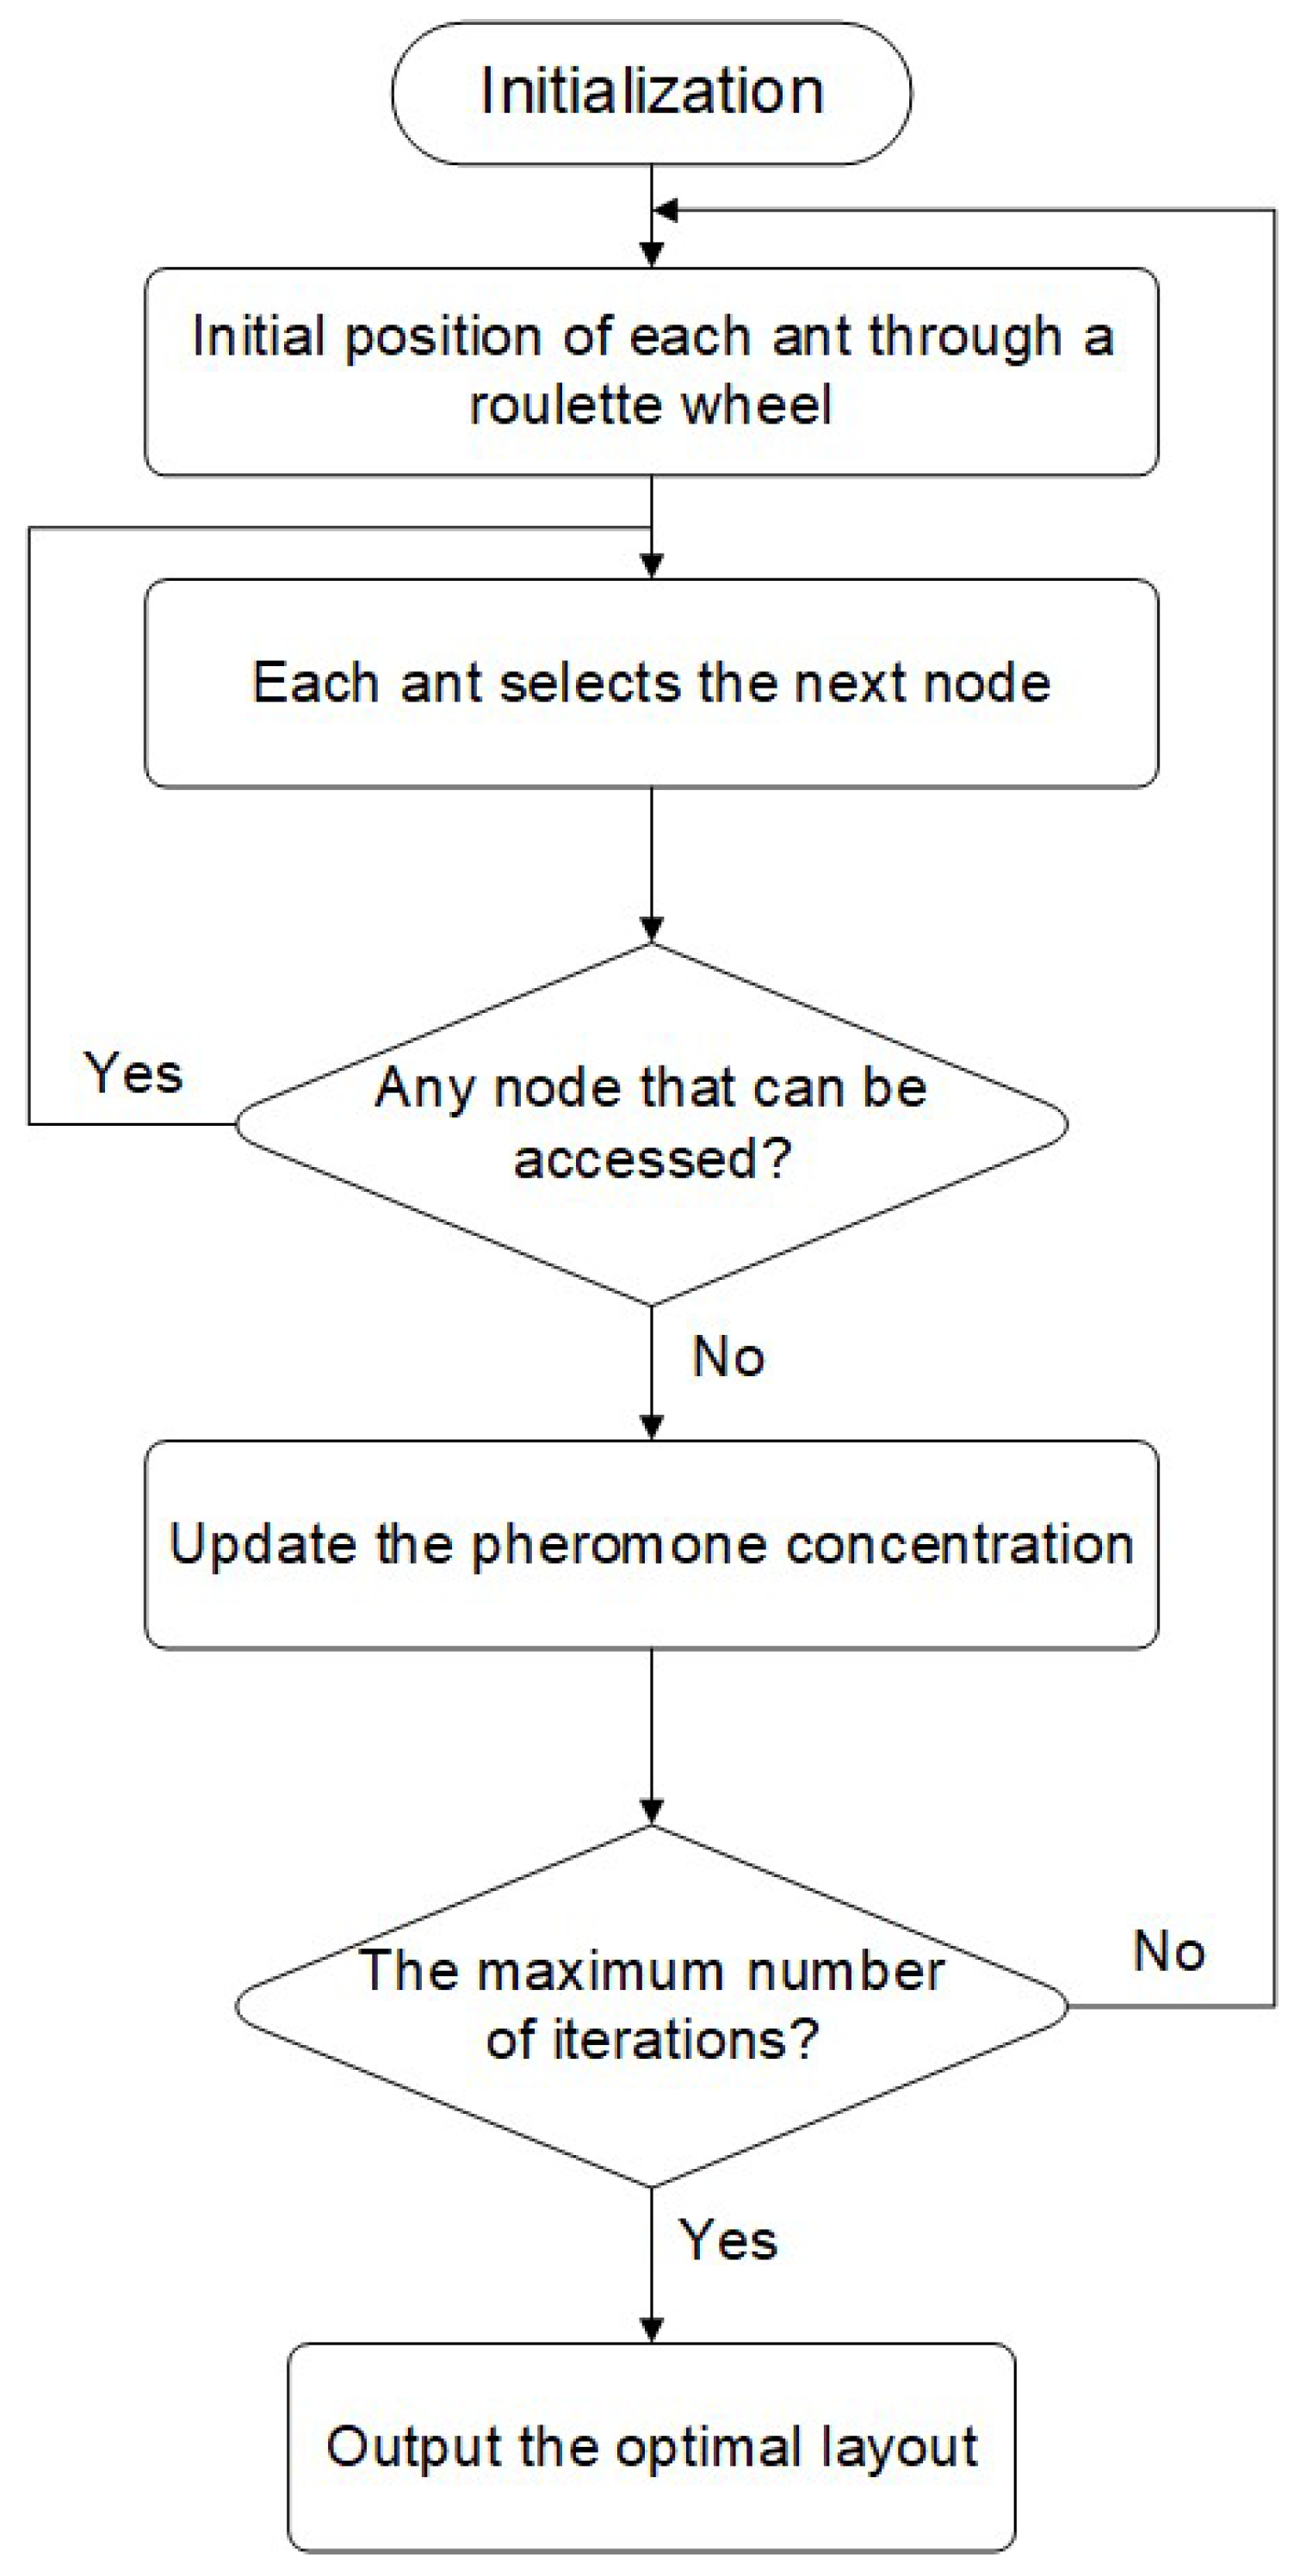
2.3. Algorithm Steps

Algorithm steps are provided in Figure 2.
(1) Initialize the parameters of the algorithm, and initialize the ant colony scale m , pheromone importance factor α , heuristic function importance factor β , total pheromone release θ , and maximum number of iterations (itermax). The algorithm runs for a specified number of iterations (itermax) or until a termination condition is met, such as convergence. According to the layout of the chip stack and the heat transfer formula, the parameters of the ant colony optimization algorithms are reasonably set to ensure the rate of convergence of the algorithm and the quality of the global optimal solution.
(2) Build a solution space, allocate the initial position of each ant through a roulette wheel, and randomly place each ant at different starting points, as well as calculate the transfer probability of each ant, adapt the pheromone concentration volatility coefficient according to the heat transfer and layout of the chip—each ant selects the next node through the adapted pheromone concentration and heuristic function calculation—and update the parameter information of each layout.
(3) Update the pheromone concentration according to the path of each ant, and record the optimal solution in the current number of iterations, that is, the scheme with the lowest temperature.
(4) Judge the termination conditions. If the maximum number of iterations is reached, terminate the calculation. Otherwise, reinitialize the pheromone concentration matrix of the ant and return to step 2.
(5) Output the optimal layout, and the whole algorithm ends.

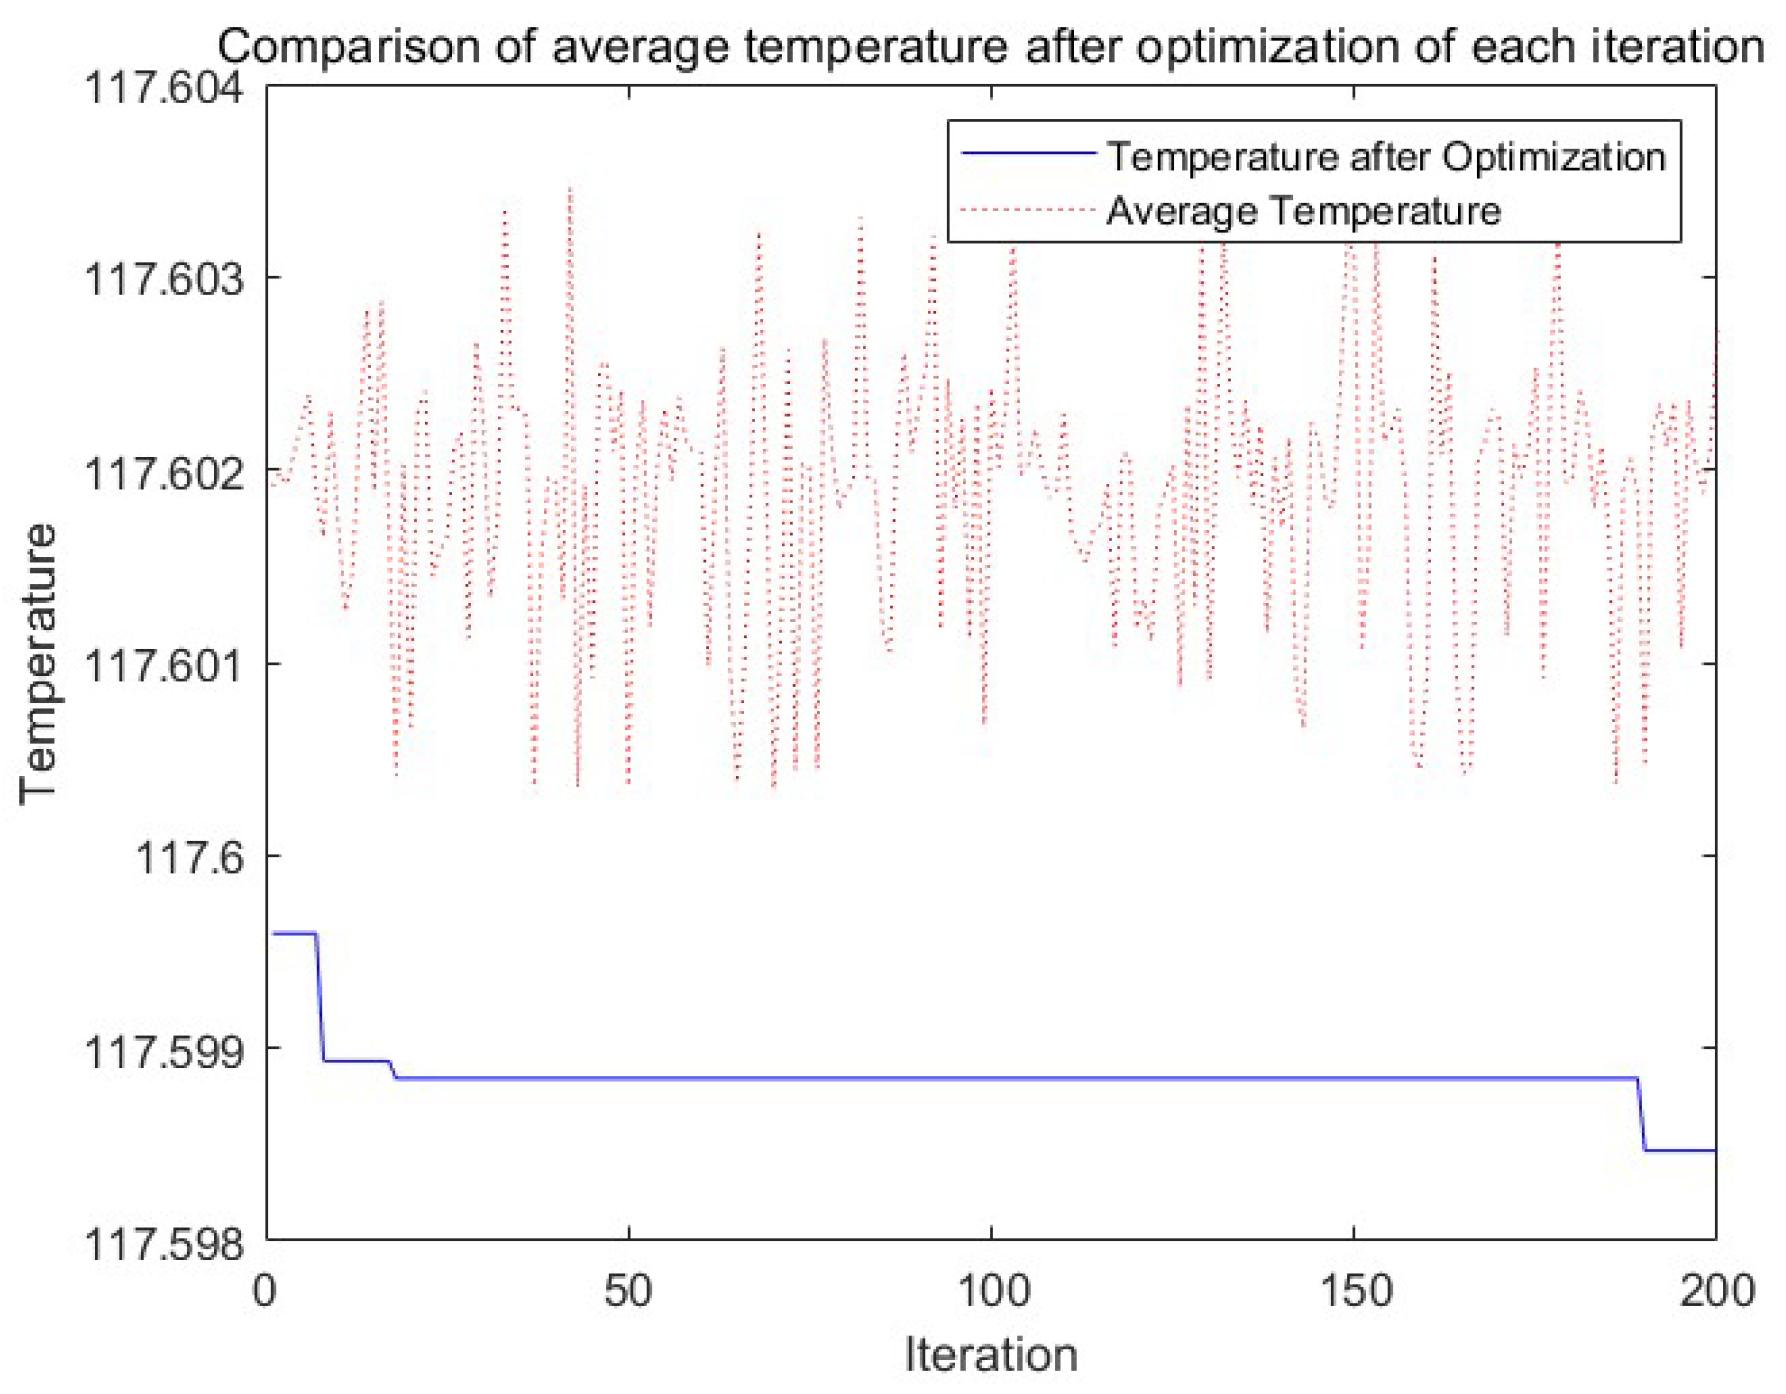
3. Simulation Results and Analysis of the Algorithm

In this experiment, MATLAB software is used to optimize the three-dimensional stack layout. Through adjusting the parameters of the algorithm, the convergence of the algorithm can be realized at the 126th iteration, as shown in Figure 3. The red dotted line indicates the average temperature of each iteration. It can be seen that the temperature of the optimized layout of the algorithm decreases significantly. The bottom temperature layout of the chip is [1,2,3,4,5,6,7,8,9,10,11,12,13,14,15,16].
In addition, the optimized layout is shown in Figure 4. Through MATLAB simulation, the chip layout can be converted into a two-dimensional temperature distribution diagram, and the optimized temperature thermodynamic diagram of each chip can be obtained, as shown in the figure.

4. Conclusions

As a heuristic bionic evolutionary algorithm, ant colony optimization algorithms can adjust important parameters through simulation. In this paper, we study and use ant colony optimization algorithms to realize the thermal layout optimization of 3D stacked chips. MATLAB simulation experiments show that the algorithm can achieve fast convergence at 126 iterations in the three-dimensional package structure of 32-chip stacking, which effectively achieves a more uniform temperature distribution for thermal layout optimization, and the global temperature is significantly reduced to 117.59 °C. This provides a research basis for energy conservation and effective utilization of resources. In future research, improvements in algorithms can further achieve more accurate and faster thermal layout optimization.

Author Contributions

Conceptualization, B.S. and Z.Z.; methodology, B.S.; validation, B.S. and Z.Z.; formal analysis, Z.Z.; investigation, B.S.; re-sources, writing—original draft preparation, B.S.; writing—review and editing, B.S., Z.Z. and P.Y.; visualization, B.S.; supervision, Z.Z. and P.Y.; project administration, P.Y.; funding acquisition, P.Y. All authors have read and agreed to the published version of the manuscript.

Funding

This research was funded by the Foundation of Key Laboratory of Advanced Technique & Preparation for Renewable Energy Materials, Ministry of Education, Yunnan Normal University.

Institutional Review Board Statement

Not applicable.

Informed Consent Statement

Not applicable.

Data Availability Statement

Data sharing not applicable.

Conflicts of Interest

The authors declare no conflict of interest.

References

  1. Chung, W.C.; Cheng, P.Y.; Li, Z.; Ho, T.Y. Module Placement under Completion Time Uncertainty in Micro-Electrode-Dot-Array Digital Microfluidic Biochips. IEEE Trans. Multi-Scale Comput. Syst. 2018, 4, 811–821. [Google Scholar] [CrossRef]
  2. Arpan, C.; Piyali, D.; Rajat, K.P. A New Fluid-Chip Co-Design for Digital Microfluidic Biochips Considering Cost Drivers and Design Convergence. IEEE Trans. Multi-Scale Comput. Syst. 2018, 4, 548–564. [Google Scholar]
  3. Sung, T.T.; Ryu, B. SoC RATES: System-on-Chip Resource Adaptive Scheduling using Deep Reinforcement Learning. arXiv 2021, arXiv:2104.14354. [Google Scholar] [CrossRef]
  4. Ning, Y.; Jie, Y.; Ye, T. Thermal Chips Layout Method in MCM Based on an Improved Particle Swarm Algorithm. In Proceedings of the 2019 Chinese Control and Decision Conference (CCDC), Nanchang, China, 3–5 June 2019. [Google Scholar] [CrossRef]
  5. Zhou, Y.; Chen, Y.; Gao, H.; Li, C.; Luo, H.; Li, W.; He, X. A Layout Optimization Method to Reduce Commutation Inductance of Multi-Chip Power Module Based on Genetic Algorithm. In Proceedings of the 2021 IEEE Workshop on Wide Bandgap Power Devices and Applications in Asia (WiPDA Asia), Wuhan, China, 25–27 August 2021; pp. 247–252. [Google Scholar] [CrossRef]
  6. Al Razi, I.; Le, Q.; Evans, T.M.; Mukherjee, S.; Mantooth, H.A.; Peng, Y. PowerSynth Design Automation Flow for Hierarchical and Heterogeneous 2.5-D Multichip Power Modules. IEEE Trans. Power Electron. 2021, 36, 8919–8933. [Google Scholar] [CrossRef]
  7. Chung-Kuan, C.; Kahng, A.B.; Kang, I.; Wang, L. RePlAce: Advancing Solution Quality and Routability Validation in Global Placement. IEEE Trans. Comput. Aided Des. Integr. Circuits Syst. 2018, 38, 1717–1730. [Google Scholar] [CrossRef]
  8. Lu, J.; Chen, P.; Chang, C.C.; Sha, L.; Huang, D.J.H.; Teng, C.C.; Cheng, C.K. ePlace: Electrostatics based placement using Nesterov’s method. In Proceedings of the 2014 51st ACM/EDAC/IEEE Design Automation Conference, San Francisco, CA, USA, 1–5 June 2014. [Google Scholar]
  9. Fukushima, T.; Bea, J.; Mariappan, M.; Koyanagi, M.; Son, H.-Y.; Suh, M.-S.; Byun, K.-Y.; Kim, N.-S.; Lee, K.-W.; Koyanagi, M. 3D memory chip stacking by multi-layer self-assembly technology. In Proceedings of the 2013 IEEE International 3D Systems Integration Conference (3DIC), San Francisco, CA, USA, 2–4 October 2013. [Google Scholar]
  10. Nayini, M.; Questad, D.; Farooq, M. Finite Element Method (FEM) simulation based analysis for optimal chip layout of a 2.5D flip chip package. In Proceedings of the 2018 IEEE SOI-3D-Subthreshold Microelectronics Technology Unified Conference (S3S), Burlingame, CA, USA, 15–18 October 2018. [Google Scholar]
  11. Budhathoki, P.; Knechtel, J.; Henschel, A.; Elfadel, I.A.M. Integration of thermal management and floorplanning based on three-dimensional layout representations. In Proceedings of the 2013 IEEE 20th International Conference on Electronics, Circuits, and Systems (ICECS), Abu Dhabi, United Arab Emirates, 8–11 December 2013. [Google Scholar]
  12. Doan, N.A.V.; Robert, F.; Smety, Y.D.; Milojevic, D. MCDA-based methodology for efficient 3D-design space exploration and decision. In Proceedings of the 2010 International Symposium on System on Chip, Tampere, Finland, 29–30 September 2010. [Google Scholar]
  13. Beura, S.; Majhi, B.; Dash, R. Mammogram classification using two dimensional discrete wavelet transform and gray-level co-occurrence matrix for detection of breast cancer. Neurocomputing 2015, 154, 1–14. [Google Scholar] [CrossRef]
  14. Jiao, Z.; Gao, X.; Wang, Y.; Li, J. A deep feature based framework for breast masses classification. Neurocomputing 2016, 197, 221–231. [Google Scholar] [CrossRef]
  15. Dimarogonas, D.V.; Frazzoli, E.; Johansson, K.H. Distributed event-triggered control for multi-agent systems. IEEE Trans. Autom. Control. 2011, 57, 1291–1297. [Google Scholar] [CrossRef]
  16. Li, W.; Gao, S. Prospective on energy related carbon emissions peak integrating optimized intelligent algorithm with dry process technique application for China’s cement industry. Energy 2018, 165, 33–54. [Google Scholar] [CrossRef]
  17. Guo, W.; Deng, F.; Meng, Z.; Hua, L.; Mao, H.; Su, J. A hybrid back-propagation neural network and intelligent algorithm combined algorithm for optimizing microcellular foaming injection molding process parameters. J. Manuf. Process. 2020, 50, 528–538. [Google Scholar] [CrossRef]
  18. Kim, J.; Schoeller, H.; Cho, J.; Park, S. Effect of oxidation on indium solderability. J. Electron. Mater. 2008, 37, 483–489. [Google Scholar] [CrossRef]
  19. Mirjalili, S. Genetic algorithm. In Evolutionary Algorithms and Neural Networks; Springer: Cham, Switzerland, 2019; pp. 43–55. [Google Scholar]
  20. Sivanandam, S.N.; Deepa, S.N. Genetic algorithm optimization problems. In Introduction to Genetic Algorithms; Springer: Berlin/Heidelberg, Germany, 2008; pp. 165–209. [Google Scholar]
  21. Qasim, T.; Zia, M.; Minhas, Q.A.; Bhatti, N.; Saleem, K.; Qasima, T.; Mahmood, H. An ant colony optimization based approach for minimum cost coverage on 3-D grid in wireless sensor networks. IEEE Commun. Lett. 2018, 22, 1140–1143. [Google Scholar] [CrossRef]
  22. Tibaldi, M.; Pilato, C.; Ferrandi, F. Automatic Generation of Heterogeneous SoC Architectures with Secure Communications. IEEE Embed. Syst. Lett. 2021, 13, 61–64. [Google Scholar] [CrossRef]
  23. Manogaran, G.; Alazab, M. Ant-inspired recurrent deep learning model for improving the service flow of intelligent transportation systems. IEEE Trans. Intell. Transp. Syst. 2021, 22, 3654–3663. [Google Scholar] [CrossRef]
  24. Yang, Z.Q.; Pan, Z.L. Optimization of 3D Stacking Chip Thermal Layout Based on Genetic Particle Swarm Algorithm. Electron. Process Technol. 2019, 5, 249–252, 260. (In Chinese) [Google Scholar] [CrossRef]
  25. Mishra, S. A hybrid least square-fuzzy bacterial foraging strategy for harmonic estimation. IEEE Trans. Evol. Comput. 2005, 9, 61–73. [Google Scholar] [CrossRef]
  26. Cheng, H.C. Thermal Chip Placement in MCMs Using a Novel Hybrid Optimization Algorithm. IEEE Trans. Compon. Packag. Manuf. Technol. 2012, 2, 764–774. [Google Scholar] [CrossRef]
  27. Lee, J. A reliability-driven placement procedure based on thermal-force model. Microelectron. Reliab. 2006, 46, 973–983. [Google Scholar] [CrossRef]
  28. Lall, B.S.; Ortega, A.; Kabir, H. Thermal design rules for electronic components on conducting boards in passively cooled enclosures. In Proceedings of the 1994 4th Intersociety Conference on Thermal Phenomena in Electronic Systems (I-THERM), Washington, DC, USA, 4–7 May 1994; pp. 50–61. [Google Scholar]
  29. Rencz, M. Thermal issues in stacked die packages. In Proceedings of the Semiconductor Thermal Measurement and Management IEEE Twenty First Annual IEEE Symposium, San Jose, CA, USA, 15–17 March 2005; pp. 307–312. [Google Scholar]
  30. Szabo, P.; Poppe, A.; Farkas, G.; Szekely, V.; Courtois, B.; Rencz, M. Thermal characterization and compact modeling of stacked die packages. In Proceedings of the Thermal and Thermomechanical Proceedings 10th Intersociety Conference on Phenomena in Electronics Systems, 2006, ITHERM 2006, San Diego, CA, USA, 30 May–2 June 2006; pp. 251–257. [Google Scholar]
Figure 1. Chip layout before optimization.
Technologies 11 00122 g001
Figure 2. Algorithm flowchart.
Technologies 11 00122 g002
Figure 3. Algorithm convergence.
Technologies 11 00122 g003
Figure 4. Three-dimensional layout scheme.
Technologies 11 00122 g004
Disclaimer/Publisher’s Note: The statements, opinions and data contained in all publications are solely those of the individual author(s) and contributor(s) and not of MDPI and/or the editor(s). MDPI and/or the editor(s) disclaim responsibility for any injury to people or property resulting from any ideas, methods, instructions or products referred to in the content.

