
Performance Analysis of 2D and 3D Bufferless NoCs Using Markov Chain Models


Department of Electrical and Computer Engineering and Informatics, Frederick University, Nicosia 1036, Cyprus
Technologies 2022, 10(1), 27; https://doi.org/10.3390/technologies10010027
Submission received: 31 December 2021
/
Revised: 28 January 2022
/
Accepted: 29 January 2022
/
Published: 2 February 2022
(This article belongs to the Special Issue MOCAST 2021)
Abstract
:Performance analysis and design space exploration of bufferless Networks-on-Chip is done mainly through time-consuming cycle-accurate simulation, due to the chaotic nature of packet deflections, which have thus far prevented the development of an accurate analytical model. In order to raise the level of abstraction as well as capture the inherently probabilistic behavior of deflection routing, this paper presents a methodology for employing Markov chain models in the analysis of the behavior of bufferless Networks-on-Chip. A formal way of describing a bufferless NoC topology as a set of discrete-time Markov chains is presented. It is demonstrated that by combining this description with the network average distance, it is possible to obtain the expectation of the number of hops between any pair of nodes in the network as a function of the flit deflection probability. Comparisons between the proposed model and cycle-accurate simulation demonstrate the accuracy achieved by the model, with negligible computational cost. The useful range of the proposed model is quantified, demonstrating that it has an error of less than 10% for a significant proportion (between 33 and 75%) of the injection rate range below saturation. Finally, a simple equation for comparing mesh topologies with a “back-of-the-envelope” calculation is introduced.
1. Introduction
Networks-on-Chip have long been the dominant design paradigm for multi- and many-core architectures [1] and an active field of research for decades [2]. They emerged in the quest for a communication architecture that would provide the scalability required for high-performance heterogeneous systems [3]. Such systems are essential for the implementation of demanding applications such as cloud-based 3D real-time vision [4], convolutional neural networks [5], etc. Originally, NoC router architectures were quite similar to the ones found in off-chip interconnection networks [6]. Later efforts started taking into account the distinctive characteristics of the on-chip environment, in order to improve router performance, area and power consumption. One of the main such differences between on-chip and off-chip networks is the availability of links and buffers. NoC researchers focused on developing various router architectures unique to the on-chip environment in an effort to leverage the availability of links versus the scarcity of buffers. Many of these router architectures attempted to optimize the router buffer size and utilization [7,8,9,10].
On one extreme, Ref. [11] proposed eliminating buffers altogether from the router architecture, resulting in a bufferless router. Bufferless routers rely on deflecting packets that cannot be forwarded to a productive port (occupied by another packet) since packets cannot be stored. The result of this is that bufferless NoCs do not suffer from deadlock but may instead suffer from livelock, when the packets are continuously deflected from their path to the destination, adding to network congestion and causing more packet deflections. The packet deflections add hops to the path of the packet, which no longer follows the shortest distance to the destination. This leads to increased network latency, not because packets remain in buffers, unable to proceed towards their destination, but because they collide with other packets and are scattered around the network. They also require a priority metric in order to resolve conflicts arising from packets requesting the same output port, which can lead to long internal datapaths [11]. Later bufferless architectures focused on improving this limitation [12], and 3D bufferless routers were also proposed [13]. While the problem of livelock causes saturation at high packet injection rates, bufferless NoCs were shown to be superior in terms of power compared to buffered NoCs [11,12]. They were also shown to possess other attractive properties, such as the ability to tolerate faults [14], and to require only approximate priority comparison [15], further simplifying output port selection logic. Hybrid buffered–bufferless routers have also been proposed [16].
2. Related Work
In both on-chip and off-chip networks, the evaluation of performance and exploration of alternative topologies is important, starting from a high abstraction level. A number of NoC cycle-accurate simulators have been developed in order to replace the more time-consuming RTL simulations. However, even with higher ratios of simulation time versus real time, simulations face the challenge of determining an adequate simulation time for the network to reach a steady state. For this reason, various approaches have been used to model worst-case delay and performance in NoCs with deterministic routing. Among them are models based on scheduling theory [17], network calculus [18], dataflow analysis [19] and statistical physics [20].
However, the above models are only suitable for buffered networks. The chaotic nature of deflections in bufferless routing makes the quest for an analytical model for deflection routing even more challenging. Previous work has identified that the most important parameter in bufferless networks is the mean distance between the source and destination node, based on the topology and the spatial distribution of traffic [21]. The authors demonstrate how this single metric can be used to compare candidate architectures. However, this single metric cannot be used to estimate actual latency based on the injection rate—in other words, under specific load conditions. Moreover, it does not provide any insight into the network saturation point. The reason is that the above approach, while surprisingly accurate and efficient, does not take into account the probabilistic and, therefore, difficult-to-predict nature of deflections. In fact, the authors in [21] state without exaggeration that “Due to the exceedingly complex spatial and temporal interference patterns of packets across the network in adaptive routing networks, an accurate analytic latency model seems to be out of reach”. Simulation remains the only method for determining network latency under non-zero load conditions.
In this paper, we extend the first attempt made in our previous work [22] to use stochastic processes to capture the inherently probabilistic nature of bufferless routing. Specifically, we include additional traffic patterns and evaluate the accuracy of the proposed model to gain insight about, as well as quantify, its useful range and limitations. Furthermore, results presented in this paper show the impact of bufferless network topology regularity on latency, besides the already established average distance. A simpler metric that can be used as a proxy for the average distance is also proposed for evaluating mesh topologies.
In particular, while the proposed model has a specific range in terms of network injection rate and uses a number of assumptions, comparisons with simulation results show that it achieves higher accuracy, very close to simulation, at least for the useful low injection rate range for various topologies. Therefore, it is the most promising approach, at least for the time being. The model is based on a novel methodology for modeling the bufferless NoC as a set of Markov Chains. The key features of the model are:
- It estimates expected latency (number of hops) between individual nodes, as well as the average for a given topology and traffic pattern, more accurately than current state-of-the-art static models.
- It raises the level of abstraction from cycle-accurate simulation, reducing the estimation time by at least four orders of magnitude, from minutes and hours to milliseconds.
Furthermore, our experimental results clearly demonstrate that the regularity of the network topology is in fact the metric that affects both the average distance and the saturation injection rate. We propose a simple equation that can be used for “back-of-the-envelope” calculations in order to evaluate alternative topologies in an even simpler manner than using the average distance model.
The rest of the paper is organized as follows: Section 3 describes the methodology behind the proposed model, which is evaluated through comparisons with cycle-accurate simulations in Section 4. Discussion concerning the range of injection rates for which the model is accurate is also included in Section 4. The paper concludes with Section 5, which summarizes the results and discusses future work.
3. Proposed Methodology
Our methodology attempts to model the two main components that affect the network latency—the network topology and the traffic pattern—in a way that also incorporates the probabilistic effect of deflections that leads to the non-linear response of the network under load as a function of the injection rate.
3.1. Topology Modeling
We model a bufferless NoC topology as a set of discrete-time Markov chains [23]. Specifically, for every source–destination pair in a given topology—for example, a 4 × 4 mesh—we can model the process of transmitting a flit from a source to a destination core as a number of states, where every state represents the distance from the destination core, while transitions between states represent the distance covered by a flit, as shown in Figure 1. In this way, we do not need to represent all nodes in the NoC as states, but only the total possible distances. For example, a flit transmission from source (1, 0) to destination (2, 2) would correspond to the same Markov chain shown in Figure 1. The Markov property that the transition to the next state does not depend on previous states (memoryless) clearly holds for the case of deflection routing, since routing decisions are made on each node (router). The transition between states is determined as follows.
In each state (distance), there is a probability, which we call the deflection probability P(A) = , that a flit will be deflected to a node with a higher distance to its destination. This distance is the distance of the previous state plus one. Likewise, a flit has transition probability P() = 1 − that it will be routed closer to its destination and in the next cycle will be in a node (state) with a distance equal to the previous state distance minus one. However, there are three states that are exceptions. Firstly, the state with the maximum distance has transition probability one to a state with a distance lower by one, because it is impossible for a flit to be deflected further (it is already at the node with the maximum distance from its destination). Secondly, the state that corresponds to the destination has probability one that it will transition to itself (absorbing state) since the flit has reached its destination. Thirdly, if a flit is deflected at the destination node router because another flit has priority for ejection, it must traverse a circular path to return to the destination router. Note that, in bufferless routing, it is impossible for a flit to remain at the same distance in two consecutive cycles due to the absence of buffering and, therefore, there is no transition from a state to itself except in the absorbing state.
Figure 2 illustrates the proposed methodology of encoding routing paths with deflections using the concrete example of Figure 1. The example shows the same transition probability in all states, and while clearly this is not perfectly true, as we demonstrate in our exploration of deflection probability in Section 4, simulations show small variation and our aim is to obtain the average latency across nodes; therefore, we can consider it as the average transition probability.
Definition 1.
The maximum shortest distance from a node (vertex) u in a network topology is the maximum among the minimum distances of all other nodes from u.
This definition is consistent with [24] for a graph, but we consider individual nodes and do not extend it to the entire graph (network). It can also be seen as the minimum distance of the farthest node in the graph from u. Formally,
For example, in the case of Figure 2, d(0, 0) = d(0, 3) = d(3, 0) = d(3, 3) = 6 (nodes indicated as circles). Each node has a unique maximum shortest distance, and depending on the regularity of the topology, multiple nodes may share the same maximum shortest distance. For a mesh topology, the possible maximum shortest distances depend on the diameter of the network. As shown in Figure 3, for a 4 × 4 mesh, there are three possible maximum distances for all sixteen nodes: four nodes have a maximum distance of six hops (network maximum), eight nodes have a maximum shortest distance of five hops, and the four inner nodes have a maximum shortest distance of four hopes. The maximum distance for each node can be used to separate the nodes in the topology into distance classes.
Definition 2.
A distance class is a set of nodes in the topology that have the same maximum shortest distance.
From the above definition, it is clear that the union of all distance classes is the set of all nodes in the network and that each distance class corresponds to a unique Markov transition matrix. Even though distance classes are technically sets and not proper classes, we prefer the term “class” in this context to emphasize the fact that they are defined by a common distance property.
After obtaining the Markov chain transition matrices for the given topology, known operations for the expectation can be used, which greatly simplify the analysis of the network latency. More specifically, the expectation in a Markov chain is given by adding all the elements in the corresponding row of matrix N given by [25]:
where Q is the transition matrix without the row and column of the absorbing state. N is called the fundamental matrix of the transition matrix P, and the expectation of the Markov chain is given by adding the elements of each row to obtain the expectation vector. In order to add the elements in each row, we multiply N with the vector j, and obtain the expectation vector:
The expectation vector gives the expected latency for the class of destination nodes described by the transition matrix from all possible node distances in the network. However, there are likely different numbers of nodes that correspond to those particular distances based on the specific topology, as demonstrated in the example of Figure 2. For example, nodes (0, 0), (1, 1), (2, 2) and (3, 3) have two nodes from which they are one hop away, three nodes from which they are two hops away, four nodes from which they are three hops away, three nodes from which they are four hops away, two nodes from which they are five hops away and one node from which they are six hops away.
We define the node distances vector v of each matrix Q as the vector whose elements correspond to the number of nodes that have a particular distance (hops plus one) in the network from the nodes that correspond to Q (Figure 3). Thus, the 4 × 4 mesh topology (for a given deflection probability) has been completely defined by the set . This is an additional advantage of the proposed methodology, wherein regular topologies are “compressed” in the proposed model. More formally, given a network N = {V, E} where the set of vertices, V, corresponds to the nodes (PEs and routers), and E is the edges corresponding to the bidirectional links, we determine a minimum set of Markov Chains and node distance vectors so that .
An important advantage of the proposed methodology is that by modeling the NoC topology as a set of Markov Chains and distance vectors obtained by distance classes, any topology can be abstracted away and therefore the proposed methodology can easily describe both 2D and 3D networks and is not necessarily limited to mesh topologies.
3.2. Traffic Modeling
In order to obtain the expected latency, besides the network topology, the traffic pattern must also be modeled. The traffic pattern is essentially defined as the number of packets that each node sends to other nodes. It can be modeled as a probability distribution. For example, in uniform random traffic, each node sends to all other nodes with equal probability, and is therefore a uniform probability distribution. Essentially, we use the average distance model proposed in [21], formulated as vector and matrix operations in order to combine it with our model. Since this probability distribution determines the number of packets exchanged among source–destination pairs, we model it as a vector of weights w. The elements of the vector are essentially the probabilities of the distribution, normalized so that the inner product w∙v divided by N is equal to one, in order to be consistent with the definition of probability. Then, the mean expected latency in the class of nodes corresponding to the particular transition matrix is given by the inner product of vector ex and vector v divided by the total number of source–destination pairs:
where ∘ is the Hadamard (element-wise) product operator between two vectors, ”“ is the inner product operator and N is the total number of nodes in the network (sixteen for a 4 × 4 mesh).
Therefore, the mean expected latency for the entire network is given by the equation:
where N is the total number of nodes in the network, m is the number of distance classes in the topology, Wi is the number of nodes with a specific maximum distance, and EXi is the expectation calculated for that class of nodes.
One of the most important insights of the proposed methodology is that, due to the symmetry of most common topologies, which are regular, it is not necessary to model every source–destination pair as a unique Markov chain. The steps of the methodology are as follows:
- Given a NoC topology, determine node distance classes and therefore the minimum number of Markov Chains.
- Fill each Markov chain transition matrix with the transition probabilities.
- Use Equations (1)–(3) to obtain the expectations for each source–destination node pair.
- Use Equation (4) to obtain the mean expected latency for the entire network based on the traffic pattern.
Determining the minimum number of Markov chains requires an analysis of the target topology. On one extreme, if nodes are arranged in a Spidergon [1], then they all have a minimum distance of one hop and a maximum distance of two hops. This can be modeled with a single Markov chain. On the other extreme, a highly irregular topology may require a Markov chain for each source–destination pair. To use the previous formulation, what must be determined is the cardinality of the set of all maximum shortest distances in the NoC. The cardinality of the set is equal to the minimum number of Markov chains required.
4. Experimental Results
Evaluating the accuracy of the proposed model requires comparison with the current state of the art. Since high-level models typically trade off accuracy for calculation or execution time, the model will be successful if it is less accurate than simulation but more accurate than the average distance model over as wide a range of injection rates as possible. Therefore, we perform cycle-accurate simulations and compare the latency observed in simulation with the one predicted by the proposed model and the average distance model, for a range of injection rates between near-zero and until saturation due to livelock begins. Using the equations in the procedure described in Section 3 requires a priori knowledge of the deflection probability . Our use of cycle-accurate simulation is twofold: firstly to obtain insight into , and secondly to compare the proposed model with simulation in order to evaluate the proposed model.
4.1. Deflection Probability Simulation
is dependent on the flit injection rate γ and the traffic pattern. The first is the number of flits injected per clock cycle per node (flit distribution in time) and the second is the rate at which a source node sends to other nodes (flit distribution in space). As already mentioned, we take the traffic pattern into account by adopting the average distance model [21].
In order to tackle the deflection probability, we used simulation to gain insight into its relation with γ. We performed simulations using HNoCs [26], a cycle-accurate simulator. The simulator was modified to support bufferless routing and to measure the deflection probabilities in every router. This was done using the frequentist definition of probability. The deflection probability is measured by counting the deflected flits and total flits in every node and dividing the two. Using the mean deflection probability of the simulations in the proposed model would yield highly accurate results, but then it would defeat the point of the foregoing simulation. We generated heat maps, such as the ones in Figure 4, for a 4 × 4 NoC to measure for every node and compare it with γ.
We reached the conclusion, after repeated simulations using various topologies, that, for the low injection rates where the network is not saturated, the average is approximately equal to γ, and we use γ as the deflection probability in our results in Section 3. Clearly, the deflection probability varies with the location of the node and the traffic pattern, as can be seen from Figure 4. In our simulations, we assume dimension order (xy) routing for flits when there are no deflections. However, directly using the deflection probability obtained from simulation would defeat the purpose of the model. This is currently a limitation of the proposed work, but, as will be shown in the next subsection, the assumption that the deflection probability is the same for all nodes and equal to the injection rate leads to accurate latency prediction until the network begins to saturate.
However, at injection rates where the network begins to saturate, the deflection probability depends on the previous state of the network (old flits that have not reached their destination). In this case, rapidly grows higher than γ and we expect our model to start to diverge.
4.2. Average Latency Analysis
We evaluate the proposed model’s predictive ability by comparing the expected latency given by the model with the same latency obtained by cycle-accurate simulation. We consider various topology, injection rate and traffic pattern combinations. We use the assumptions discussed previously that = γ and that is the same for all states (average deflection probability).
Figure 5, Figure 6 and Figure 7 show the average latency in hops for three typical 3D NoC topologies, 4 × 4 × 4 (Figure 5), 8 × 4 × 2 (Figure 6) and 8 × 8 × 1 (Figure 7), for rising injection rates comparing simulation, the average distance model [21] and the proposed model under the assumption that = γ, for uniform random traffic.
As shown in Figure 5, Figure 6 and Figure 7, our results are almost surprisingly accurate in the network’s high-performance injection rate region. Specifically, in the low injection rates, there is a high-accuracy region where the model estimate is very close to the simulation results. Above a certain injection rate threshold, , saturation begins. We refer to this value as the critical injection rate or as the saturation injection rate. The proposed model, even though it captures the non-linear relationship between the injection rate and the latency, nevertheless diverges for γ > because the assumption of the deflection probability being approximately equal to the injection rate evidently no longer holds. However, the model does accurately predict the network latency over a wide range of injection rates before saturation and can be improved in the future by gaining more insight about the nature of deflections and adjusting the deflection probability. As expected, the proposed model’s accuracy is higher than that of the average distance model and lower than that of the cycle-accurate simulation. Furthermore, the proposed model perfectly agrees with the average distance model for = 0 (zero-load), and can therefore be viewed as a generalization of the average distance model.
Simulation results obtained using other synthetic traffic patterns are similar. This is not surprising since the proposed model indirectly takes traffic patterns into account in Equation (4), and, at low injection rates, the traffic pattern does not greatly affect the deflection probability as long as traffic remains non-bursty. Bursty traffic increases the average and our assumption no longer holds. We intend to incorporate bursty traffic into our model in future work by exploring and quantifying the relation between the temporal distribution of traffic and Pd. In Figure 8, Figure 9 and Figure 10, results are shown for a bit-complement traffic (BCT) pattern. More specifically, Figure 8 shows results for a 4 × 4 × 4 topology and BCT, Figure 9 for an 8 × 4 × 2 topology and BCT and Figure 10 for a 8 × 8 × 1 topology and BCT.
The results for BCT highlight the same pattern: a high-accuracy region and then the gradual divergence between the hops predicted by the proposed model and simulation results. The BCT traffic patterns have a higher average distance, leading to saturation at lower , which is clearly dependent on both the topology and the traffic pattern. Furthermore, it seems that the more regular the topology, the higher the proposed model’s accuracy. This is explored further in the next subsection.
4.3. Model Accuracy Evaluation
Even though the above comparisons show promise, we attempt to further quantify and evaluate the usefulness of the proposed model. For this reason, we explore the accuracy as a function of the injection rate and compare it with the average distance model, with the simulation results assumed as perfectly accurate. We also attempt to quantify the injection rate range for which the model tends to be accurate, and therefore useful. Figure 11 plots the percentage absolute errors of the proposed model and the average distance model compared to simulation against the injection rate for URT and Figure 12 for BCT. The other topologies and traffic patterns follow similar trends and are summarized in Table 1.
The above figures show that there is a slight oscillation in the proposed model error in the low injection rates, where both models exhibit low error. This is to be expected due to the randomness of high-level simulation. In the “medium” injection rates, the proposed model consistently exhibits lower error rates than the average distance model and yet both models exhibit a similar rising trend as the injection rate keeps increasing.
Table 1 summarizes in more detail the results illustrated in Figure 11 for γ < . Besides the percentage error, the absolute error and the normalized error are shown for URT. The absolute error is the absolute difference between the estimated and simulated latency, and the normalized error is the absolute error divided by the average distance in the topology.
The results of Table 1 illustrate the high accuracy of the model for γ < . Regarding the URT traffic pattern, for the 4 × 4 × 4 topology, the normalized error is within 3.33% of simulation, for the 8 × 4 × 2 topology within 6.88% and for the 8x8x1 within 9.26%. For the BCT traffic pattern, saturation begins at a lower and therefore the loss of accuracy begins more rapidly, and we do not show values above the saturation injection rate. Below the saturation rate, the accuracy is high in the case of BCT in most cases within 5%. The only exception is BCT in 4 × 4 × 4, with a percentage error of 16.6 per cent. Even this error value is quite acceptable given the high-level nature of the model and the assumptions. Running on an Intel i7-7500U at 2.7 GHz using Octave, the estimation time is 30 to 60 milliseconds, several orders of magnitude faster compared to simulation, which takes from several minutes to even hours.
In order to explore the useful range of injection rates for the model, as well as gain insight into the relationship between topology, traffic pattern and saturation injection rate, we look for a metric that expresses how regular a topology is—in other words, how evenly spread are the nodes of the network in the mesh dimensions.
Thus, a simple metric for the topology regularity of a mesh with N nodes distributed in d dimensions is the ratio of the arithmetic over the geometric mean of the number of nodes in each dimension, defined as follows:
where is the number of vertices in dimension i, and d is the total number of dimensions.
By this definition, a topology with equal nodes in each dimension, such as 4 × 4 × 4, has R equal to 1, since the arithmetic and geometric means of a set of equal numbers are equal. On the other hand, the greater the number of nodes in one particular dimension compared to the others, the higher the R metric, since the arithmetic mean is greater than or equal to the geometric mean. Specifically, R(8 × 4 × 2) = (8 + 4 + 2)/3/4 = 7/6 and R(8 × 8 × 1) = (8 + 8 + 1)/3/4 = 17/12. The reason that we do not use the more common inverted ratio of the geometric over the arithmetic mean instead is that, as will be shown, we intend to use R as a proxy for the average distance and, thus, it is easier to use in order to compare alternative topologies.
We define the injection rate for which a model error is less than 10% compared to simulation as the injection rate upper bound for this model and the useful range of the model as the ratio . By this definition, we can quantify the usefulness of each model for a given topology and traffic pattern. We consider 10% to be a reasonable limit for accuracy for such a high-level model.
Table 2 explores the accuracy of the model compared to the injection rate in order to determine the useful range of the model, as well as to gain insight concerning the topology and traffic pattern relationship with the network saturation point as defined by the threshold injection rate . The topologies and traffic patterns are arranged in increasing average distance.
Table 2 clearly shows that the proposed model extends the range of the average distance model by an average of 19.75% in the above topologies and traffic patterns. The lowest range extension is by 8% for 8 × 4 × 2 and BCT traffic and the highest is by 42% for a 4 × 4 × 4 topology and URT.
Another conclusion that can be drawn from Table 2 is the clear connection between the average network distance and the topology regularity as defined in Equation (5). In fact, closer inspection shows that the ratio of the average distance over the regularity for a given traffic pattern is almost identical for all specific topologies. In other words, multiplying the topology regularity by the average distance of the topology and traffic pattern with regularity equal to one yields the particular topology/traffic pattern average distance with high precision. Average distance and, therefore, topology regularity are also highly inversely correlated with . It can be seen that average distance alone cannot predict either or the useful range of the models. This relationship between average distance , topology regularity R and is further explored in Table 3.
As Table 3 illustrates, the topology regularity can be used to compare different mesh topologies in terms of zero-load latency and critical injection rate as effectively as the average distance. This is important because R is simpler to calculate, using Equation (3), than the average distance for a given mesh topology, even if it does not provide a sense of the actual number of hops. Essentially, the proposed work also provides a formula for simple “back-of-the-envelope” calculations for evaluating mesh NoC bufferless topologies. We stress, though, that this simple formula is limited to mesh topologies, while our methodology for modeling bufferless NoCs using Markov chains can be applied to any topology, regular or irregular.
Finally, the inverse correlation between R and is also clear, if harder to quantify. Preliminary calculations indicate that is approximately inversely proportional to the square of R for URT and the cube for BCT. However, for now, there is no approach other than simulation that can accurately determine the network saturation injection rate. This is also a limitation of the proposed model, which we plan to address in future work, as discussed in Section 5.
5. Conclusions and Future Work
A novel methodology for estimating latency in deflection routing networks based on stochastic processes is presented. The proposed methodology extends the zero-load average distance model by incorporating the probabilistic nature of deflection routing. The bufferless network is modeled as a set of Markov chains that capture the network topology. The proposed model is shown to be accurate for the range of injection rates where the network exhibits high performance, showing promising results as an approach. Furthermore, a simple equation reflecting the network topology regularity is proposed and its effectiveness in evaluating candidate topologies with simple “back-of-the-envelope” calculations is demonstrated.
In agreement with the maxim that “all models are wrong, but some models are useful”, future work is aimed at tackling the existing limitations of the model. This leads to three directions: firstly, being able to predict the beginning of saturation where the model starts to diverge; secondly, gaining more insight into deflection probability, which would lead to more accurate estimation after saturation begins—this only requires a modification of the value of the transition probability in our model and can be readily applied; finally, we are currently exploring the effect of bursty traffic (the temporal distribution of traffic) on the deflection probability in order to incorporate it into our model.
Funding
This research received no external funding.
Institutional Review Board Statement
Not applicable.
Informed Consent Statement
Not applicable.
Data Availability Statement
Not applicable.
Conflicts of Interest
The author declares no conflict of interest.
Abbreviations
| NoC | Network-on-Chip |
| URT | Uniform Random Traffic |
| BCT | Bit-Complement Traffic |
| ADM | Average Distance Model |
References
- Tatas, K.; Siozios, K.; Soudris, D.; Jantch, A. Designing 2D and 3D Network-on-Chip Architectures; Springer: New York, NY, USA, 2014. [Google Scholar]
- Bohr, M.T. Interconnect scaling—The real limiter to high performance ULSI. In Proceedings of the International Electron Devices Meeting, Washington, DC, USA, 10–13 December 1995; pp. 241–244. [Google Scholar]
- Swarbrick, I.; Gaitonde, D.; Ahmad, S.; Jayadev, B.; Cuppett, J.; Morshed, A.; Gaide, B.; Arbel, Y. Versal Network-on-Chip (NoC). In Proceedings of the 2019 IEEE Symposium on High-Performance Interconnects (HOTI), Santa Clara, CA, USA, 14–16 August 2019. [Google Scholar]
- Ivanov, M.; Sergyienko, O.; Tyrsa, V.; Lindner, L.; Flores-Fuentes, W.; Rodríguez-Quiñonez, J.C.; Hernandez, W.; Mercorelli, P. Influence of data clouds fusion from 3D real-time vision system on robotic group dead reckoning in unknown terrain. IEEE/CAA J. Automatica Sinica 2020, 7, 368–385. [Google Scholar] [CrossRef]
- Choi, W.; Duraisamy, K.; Kim, R.G.; Doppa, J.R.; Pande, P.P.; Marculescu, D.; Marculescu, R. On-Chip Communication Network for Efficient Training of Deep Convolutional Networks on Heterogeneous Manycore Systems. IEEE TC 2018, 67, 672–686. [Google Scholar] [CrossRef] [Green Version]
- Guerrier, P.; Greiner, A. A Generic Architecture for On-Chip Packet-Switched Interconnections. In Proceedings of the Design, Automation and Test in Europe Conference and Exhibition (DATE), Paris, France, 27–30 March 2000. [Google Scholar]
- Jafari, F.; Lu, Z.; Jantsch, A.; Yaghmaee, M.H. Buffer Optimization in Network-on-Chip Through Flow Regulation. IEEE TCAD 2010, 29, 1973–1986. [Google Scholar] [CrossRef] [Green Version]
- Ramanujam, R.; Soteriou, V.; Lin, B.; Li-Shiuan, P. Design of a High-Throughput Distributed Shared-Buffer NoC Router. In Proceedings of the International Symposium on Networks-on-Chip (NOCS), Grenoble, France, 3–6 May 2010; pp. 69–78. [Google Scholar]
- Wang, L.; Zhang, J.; Yang, X.; Wen, D. Router with Centralized Buffer for Network-on-Chip. In Proceedings of the Great Lakes Symposium on VLSI (GLSVLSI), Orange County, CA, USA, 6–8 June 2009; pp. 469–474. [Google Scholar]
- Kodi, A.; Louri, A.; Wang, J. Design of energy-efficient channel buffers with router bypassing for network-on-chips (NoCs). In Proceedings of the 2009 10th International Symposium on Quality Electronic Design, San Jose, CA, USA, 16–18 March 2009; pp. 826–832. [Google Scholar]
- Moscibroda, T.; Mutlu, O. A Case for Bufferless Routing in On-Chip Networks. In Proceedings of the 36th Annual International Symposium on Computer Architecture, New York, NY, USA, 11–15 June 2009; pp. 196–207. [Google Scholar]
- Fallin, C.; Craik, C.; Mutlu, O. Chipper: A low-complexity bufferless deflection router. In Proceedings of the 17th IEEE International Symposium on High Performance Computer Architecture, San Antonio, TX, USA, 12–16 February 2011; pp. 144–155. [Google Scholar]
- Feng, C.; Lu, Z.; Jantch, A.; Zhang, M. A 1-Cycle 1.25 GHz Bufferless Router for 3D Network-on-Chip. IEICE Trans. Inf. Syst. 2012, E95D, 1519–1522. [Google Scholar] [CrossRef] [Green Version]
- Feng, C.; Lu, Z.; Jantsch, A.; Zhang, M.; Xing, Z. Addressing transient and permanent faults in NoC with efficient fault-tolerant deflection router. IEEE Trans. Large Scale Int. Syst. TVLSI 2013, 21, 1053–1066. [Google Scholar] [CrossRef] [Green Version]
- Tatas, K. High-performance 3D NoC bufferless router with approximate priority comparison. In Proceedings of the 7th International Conference on Modern Circuits and Systems Technologies (MOCAST), Thessaloniki, Greece, 7–9 May 2018. [Google Scholar]
- Tatas, K.; Savva, S.; Kyriacou, C. 3DBUFFBLESS: A Novel Buffered-Bufferless Hybrid Router for 3D Networks-on-Chip. In Proceedings of the 27th International Symposium on Power and Timing Modeling, Optimization and Simulation (PATMOS 2017), Thessaloniki, Greece, 25–27 September 2017. [Google Scholar]
- Audsley, N. Applying new scheduling theory to static priority pre-emptive scheduling. Softw. Eng. J. 1993, 8, 284–292. [Google Scholar] [CrossRef] [Green Version]
- Qian, Z.L.Y.; Dou, W. Analysis of worst-case delay bounds for on-chip packet switching networks. IEEE Trans. Comput. Aided Des. Integr. Circuits Syst. 2010, 29, 802–815. [Google Scholar] [CrossRef] [Green Version]
- Bekooij, M.; Hoes, R.; Moreira, O.; Poplavko, P.; Pastrnak, M.; Mesman, B.; Mol, J.D.; Stuijk, S.; Gheorghita, V.; van Meerbergen, J. Dataflow analysis for real-time embedded multiprocessor system design. In Dynamic and Robust Streaming in and between Connected Consumer-Electronic Devices; Springer: Berlin/Heidelberg, Germany, 2005; pp. 81–108. [Google Scholar]
- Bogdan, P.; Marculescu, R. Non-stationary traffic analysis and its implications on multicore platform design. IEEE Trans. Comput. Aided Des. Integr. Circuits Syst. 2011, 30, 508–519. [Google Scholar] [CrossRef]
- Weldezion, A.Y.; Grange, M.; Jantsch, A.; Tenhunen, H.; Pamunuwa, D. Zero-load predictive model for performance analysis in deflection routing NoCs. Microprocess. Microsyst. 2015, 39, 634–647. [Google Scholar] [CrossRef] [Green Version]
- Tatas, K. Towards an Analytical Model of Latency in Deflection Routing: A Stochastic Process Approach for Bufferless NoCs. In Proceedings of the 10th International Conference on Modern Circuits and Systems Technologies (MOCAST), Thessaloniki, Greece, 5–7 July 2021. [Google Scholar]
- Brémaud, P. Markov Chains: Gibbs Fields, Monte Carlo Simulation and Queues, 2nd ed.; Springer: Berlin/Heidelberg, Germany, 2020. [Google Scholar]
- Selvi, T.; Vaidhyanathan. Maximum Distance in Graphs. IJMTT 2018, 58, 16–19. [Google Scholar] [CrossRef]
- Haggstrom, O. Finite Markov Chains and Algorithmic Applications; Cambridge University Press: Cambridge, UK, 2002. [Google Scholar]
- Ben-Itzhak, Y.; Zahavi, E.; Cidon, I.; Kolodny, A. HNOCS: Modular open-source simulator for Heterogeneous NoCs. In Proceedings of the International Conference on Embedded Computer Systems (SAMOS), Samos, Greece, 16–19 July 2012; pp. 51–57. [Google Scholar]
Figure 1.
A 4 × 4 NoC mesh, with source−destination pair and corresponding Markov chain. Initial state is S4 (3 hops plus flit ejection) and absorbing state is S0.
Figure 1.
A 4 × 4 NoC mesh, with source−destination pair and corresponding Markov chain. Initial state is S4 (3 hops plus flit ejection) and absorbing state is S0.
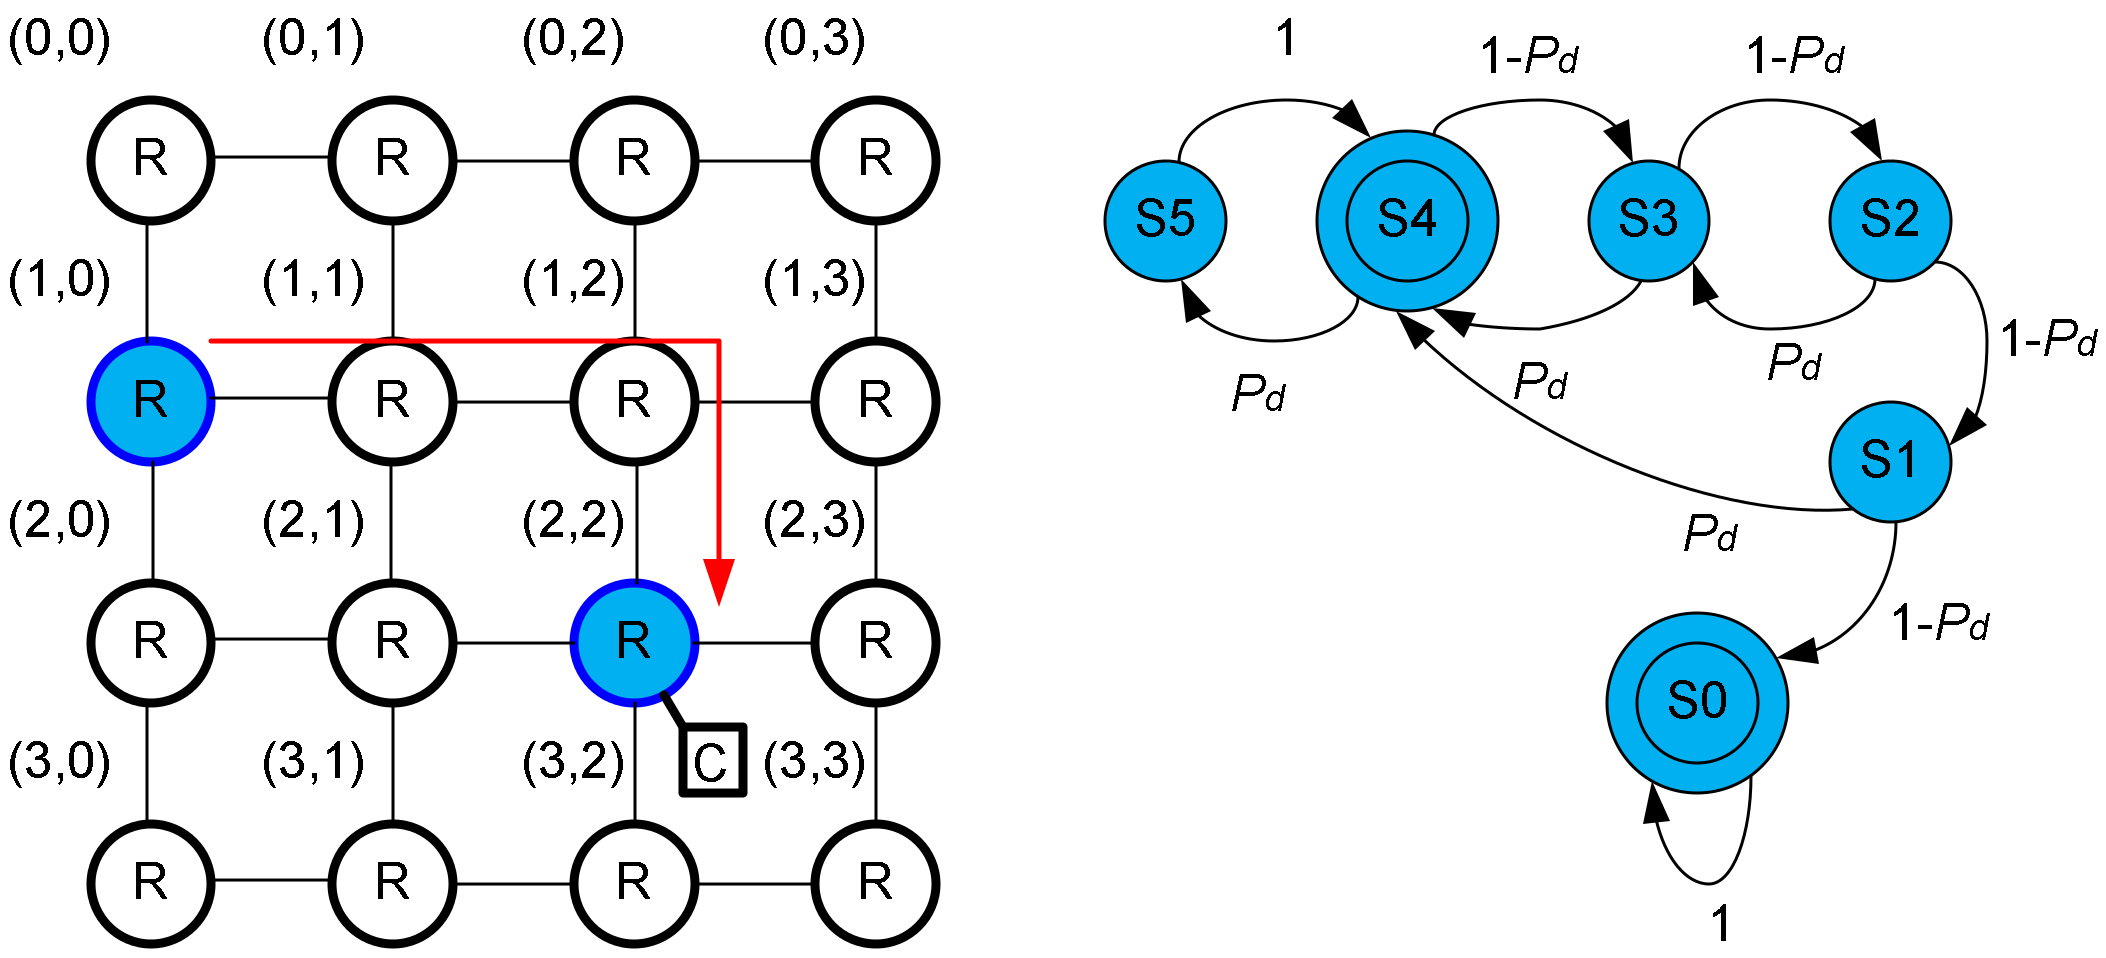
Figure 2.
Markov chain transition matrices for a 4 × 4 2D NoC topology. The source−destination pair of Figure 1 corresponds to the third row of the second transition matrix. The three distance classes of nodes are indicated using different node symbols.
Figure 2.
Markov chain transition matrices for a 4 × 4 2D NoC topology. The source−destination pair of Figure 1 corresponds to the third row of the second transition matrix. The three distance classes of nodes are indicated using different node symbols.
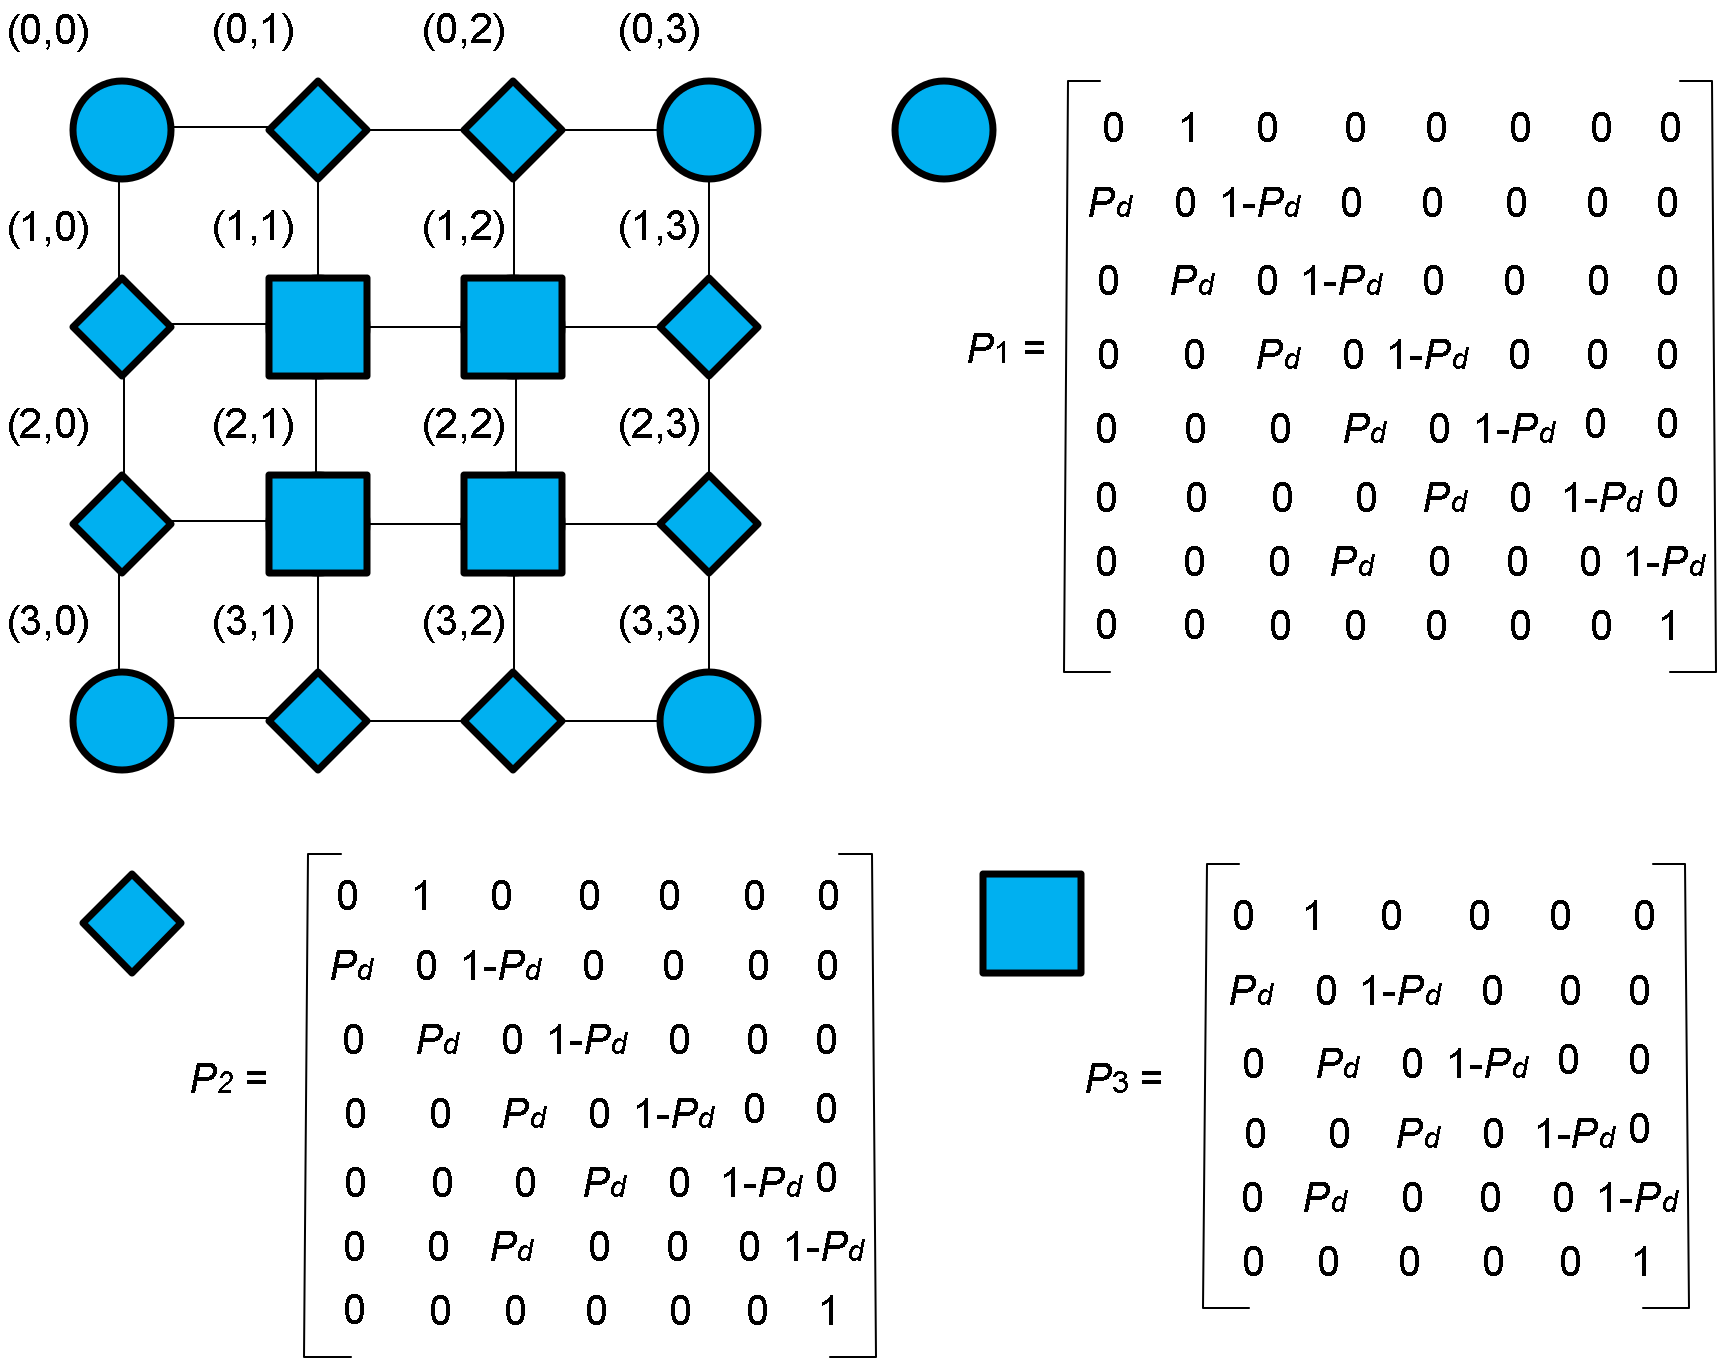
Figure 3.
P and Q matrices for nodes marked as circles and corresponding node distances vector .
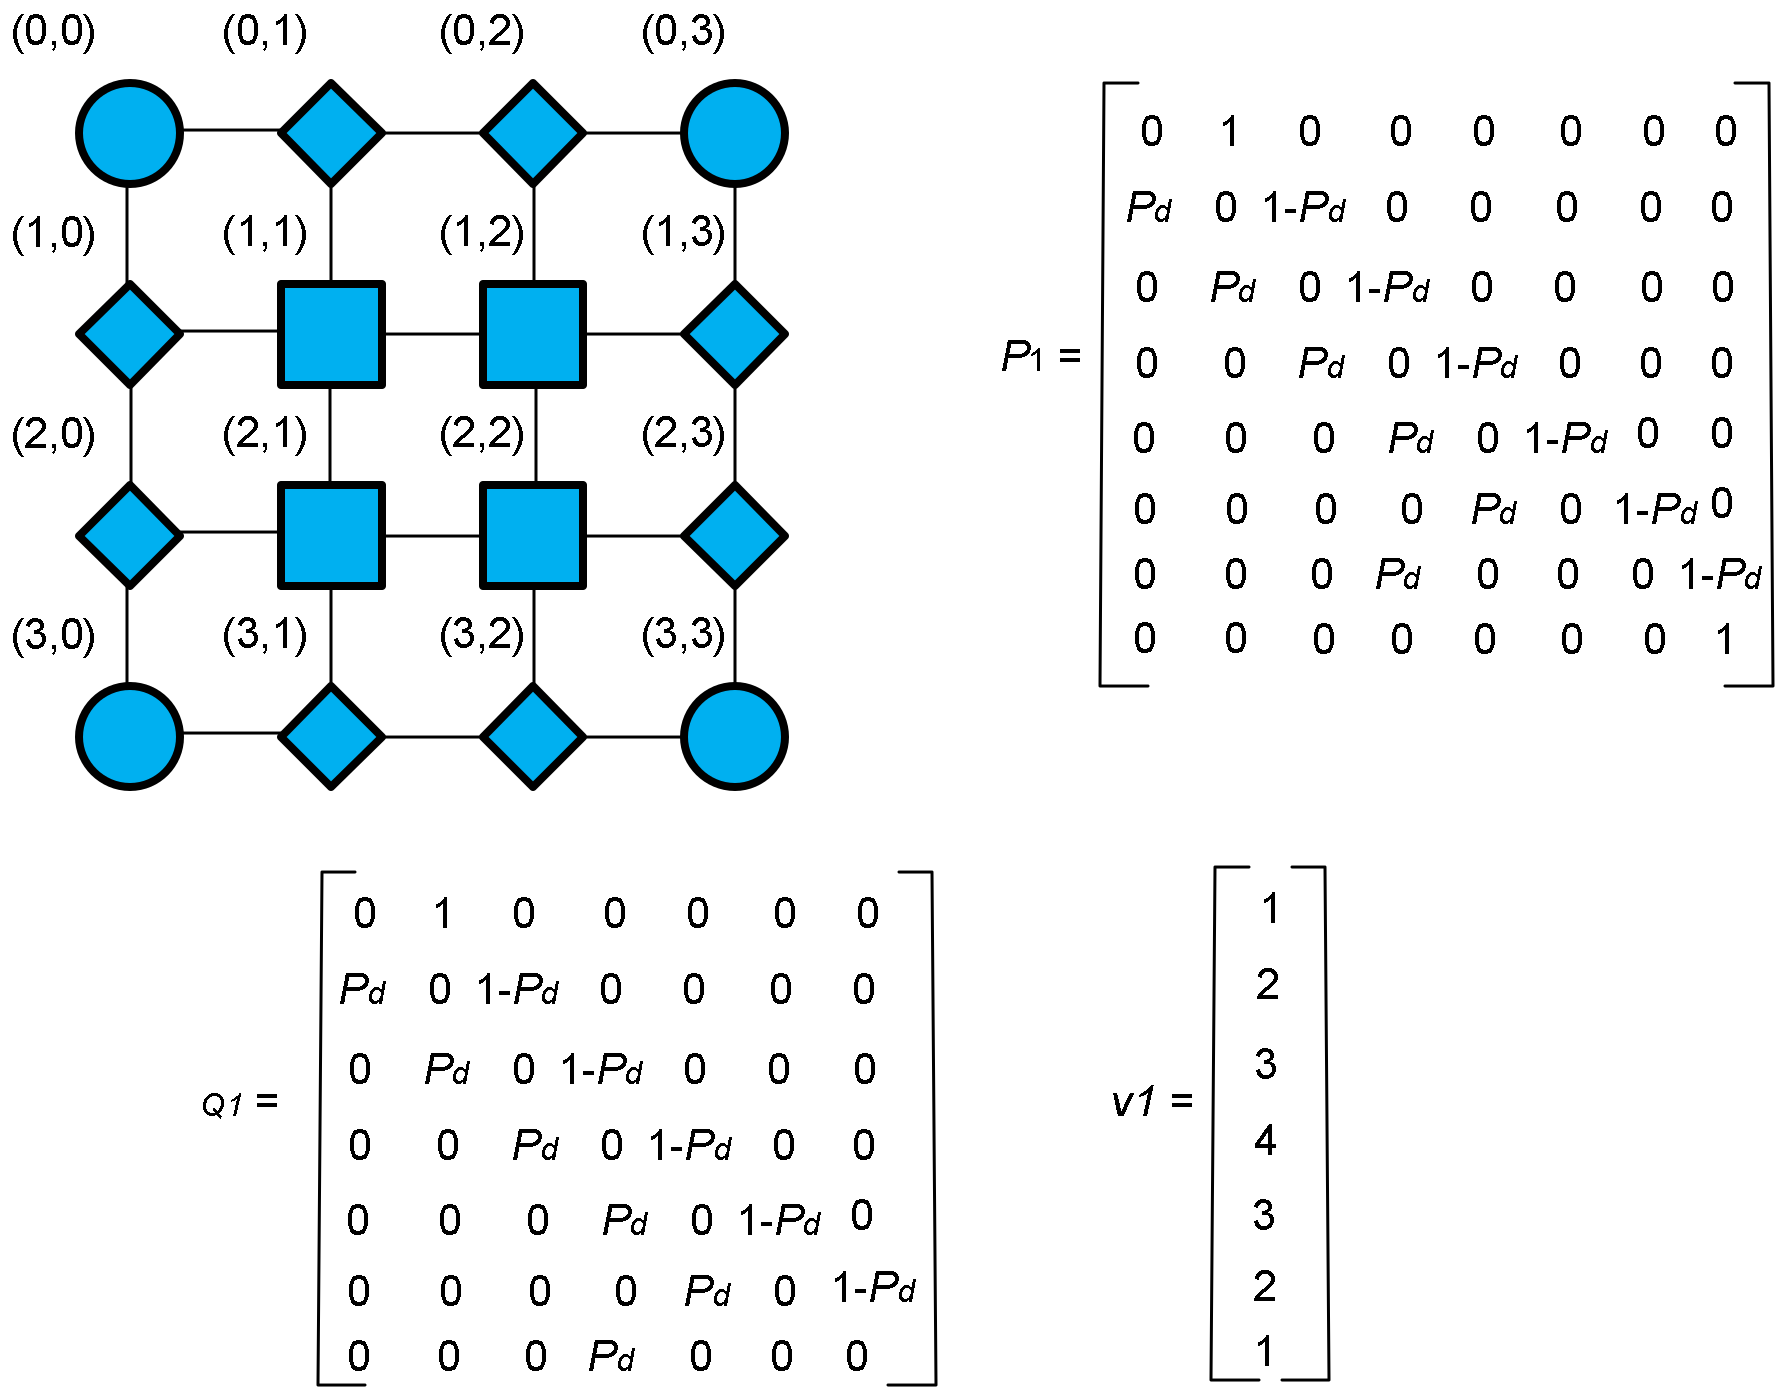
Figure 4.
Deflection frequencies heat map for 4 × 4 × 1 NoC with uniform random traffic and injection rates 0.04 and 0.06 flits/cycle/node. The average deflection probability is close to the injection rate for injection rates up to 0.12 flits/cycle/node for this topology.
Figure 4.
Deflection frequencies heat map for 4 × 4 × 1 NoC with uniform random traffic and injection rates 0.04 and 0.06 flits/cycle/node. The average deflection probability is close to the injection rate for injection rates up to 0.12 flits/cycle/node for this topology.

Figure 5.
Average estimated latency vs. flit injection rate comparison between simulation, the proposed model and the average distance model for a 4 × 4 × 4 NoC topology and uniform random traffic. The high-accuracy region, the beginning of saturation and the model divergence are clearly marked.
Figure 5.
Average estimated latency vs. flit injection rate comparison between simulation, the proposed model and the average distance model for a 4 × 4 × 4 NoC topology and uniform random traffic. The high-accuracy region, the beginning of saturation and the model divergence are clearly marked.
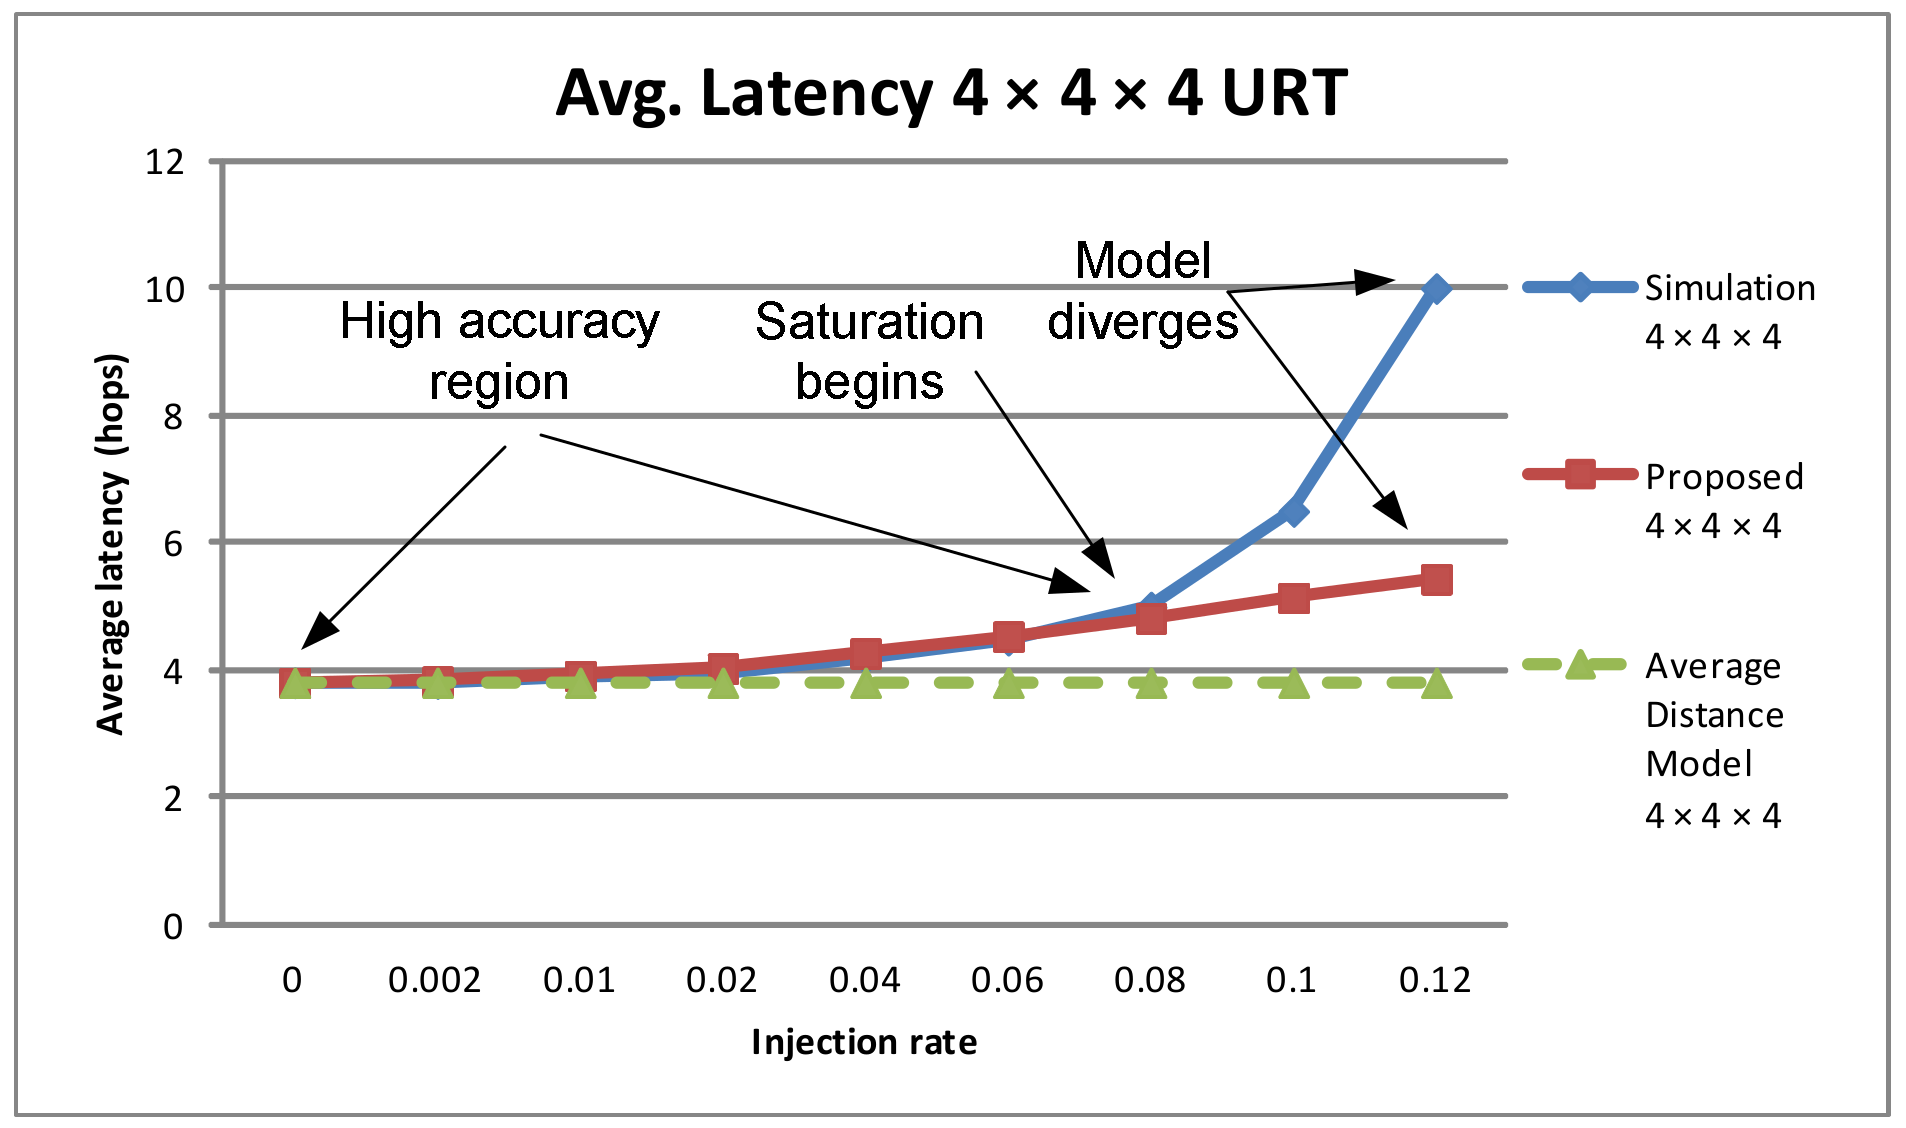
Figure 6.
Average estimated latency vs. flit injection rate comparison between simulation, the proposed model and the average distance model for a 8 × 4 × 2 NoC topology and uniform random traffic.
Figure 6.
Average estimated latency vs. flit injection rate comparison between simulation, the proposed model and the average distance model for a 8 × 4 × 2 NoC topology and uniform random traffic.

Figure 7.
Average estimated latency vs. flit injection rate comparison between simulation, the proposed model and the average distance model for 8 × 8 × 1 topology and uniform random traffic.
Figure 7.
Average estimated latency vs. flit injection rate comparison between simulation, the proposed model and the average distance model for 8 × 8 × 1 topology and uniform random traffic.
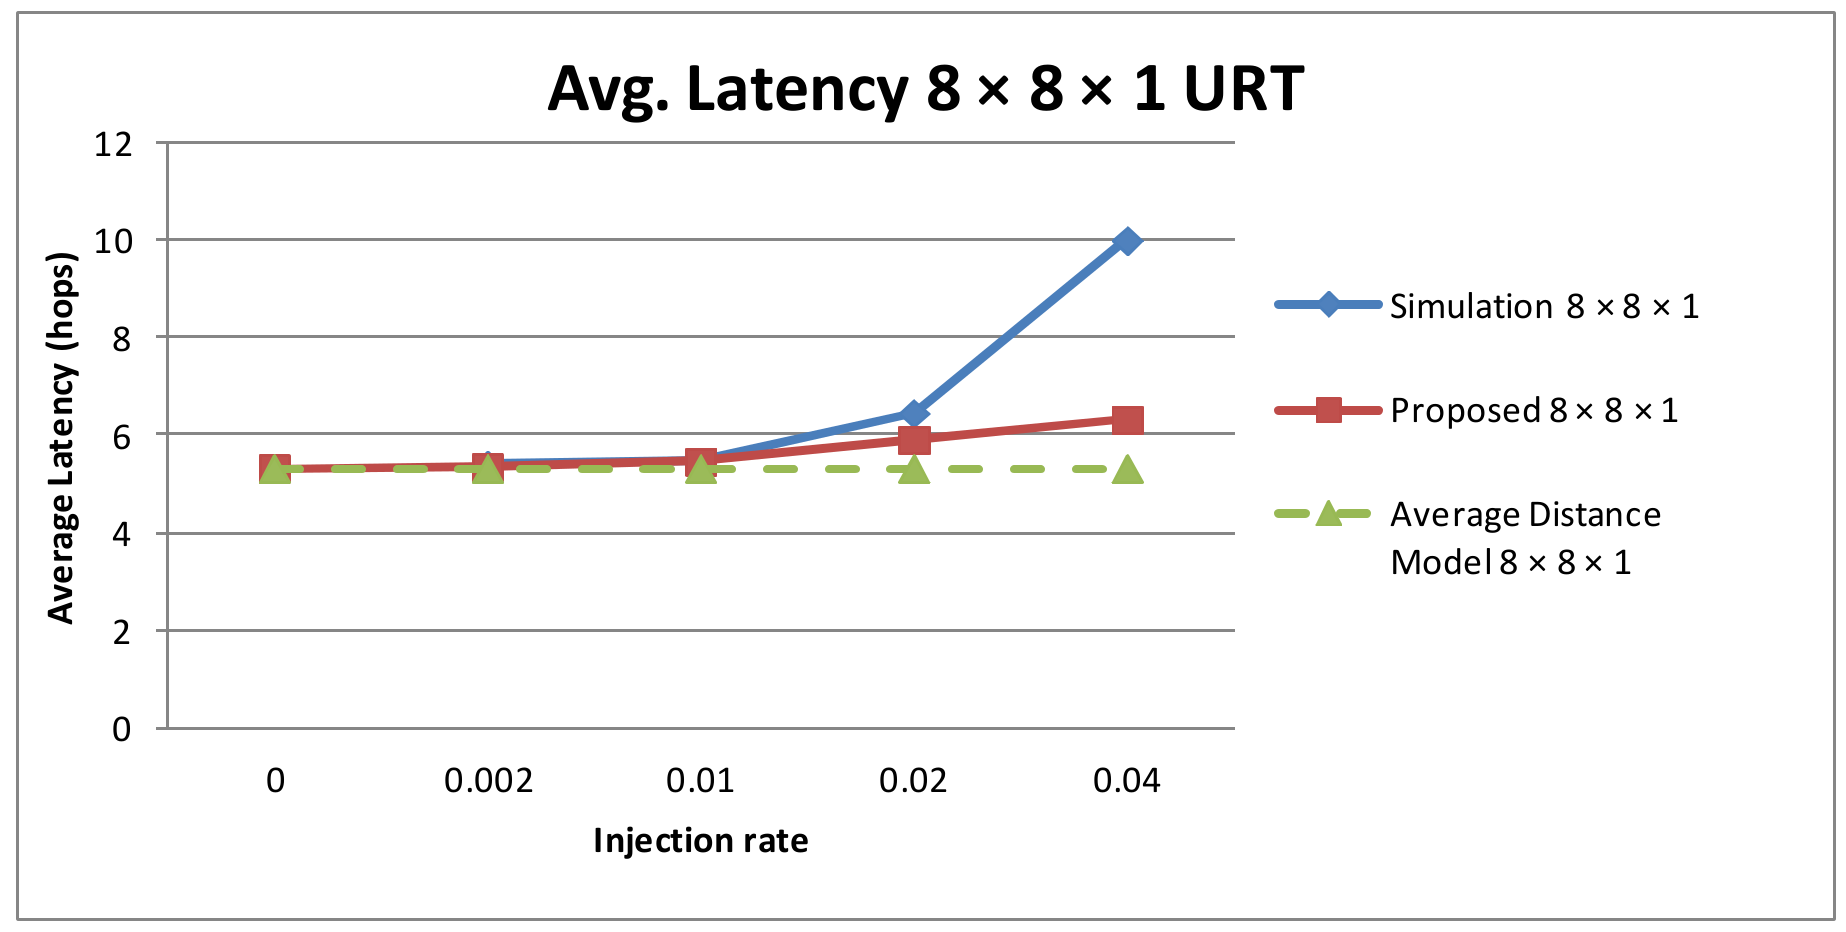
Figure 8.
Average estimated latency vs. flit injection rate comparison between simulation, the proposed model and the average distance model for a 4 × 4 × 4 NoC topology and bit-complement traffic.
Figure 8.
Average estimated latency vs. flit injection rate comparison between simulation, the proposed model and the average distance model for a 4 × 4 × 4 NoC topology and bit-complement traffic.
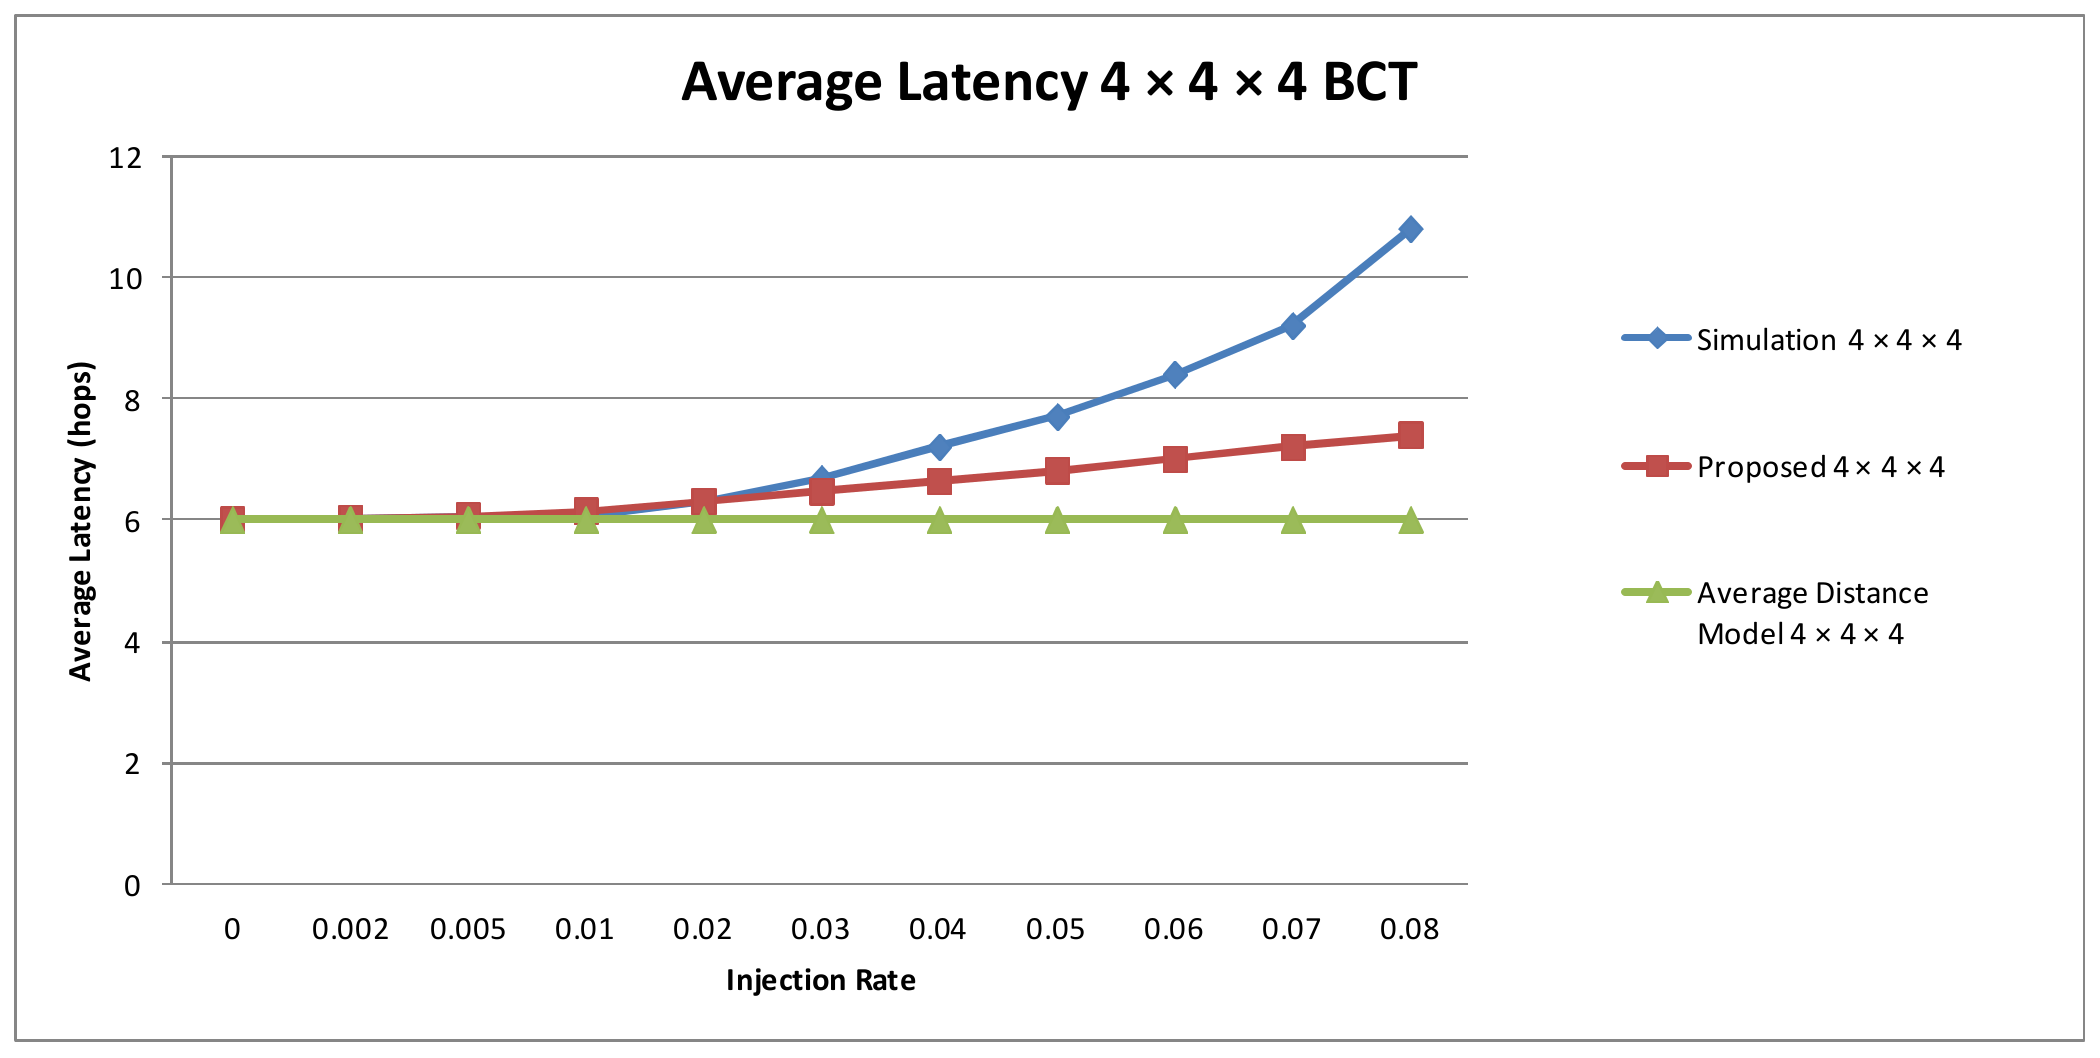
Figure 9.
Average estimated latency vs. flit injection rate comparison between simulation, the proposed model and the average distance model for a 4 × 4 × 4 NoC topology and bit-complement traffic.
Figure 9.
Average estimated latency vs. flit injection rate comparison between simulation, the proposed model and the average distance model for a 4 × 4 × 4 NoC topology and bit-complement traffic.

Figure 10.
Average estimated latency vs. flit injection rate comparison between simulation, the proposed model and the average distance model for three NoC topologies and bit-complement traffic.
Figure 10.
Average estimated latency vs. flit injection rate comparison between simulation, the proposed model and the average distance model for three NoC topologies and bit-complement traffic.

Figure 11.
Percentage error vs. injection rate comparison between the proposed and the average distance model for 4 × 4 × 4 topology and uniform random traffic.
Figure 11.
Percentage error vs. injection rate comparison between the proposed and the average distance model for 4 × 4 × 4 topology and uniform random traffic.

Figure 12.
Percentage error vs. injection rate comparison between the proposed and the average distance model for 4 × 4 × 4 topology and bit-complement traffic.
Figure 12.
Percentage error vs. injection rate comparison between the proposed and the average distance model for 4 × 4 × 4 topology and bit-complement traffic.


Table 1.
Proposed model vs. simulation.
| Topology | γ | Absolute Error URT/BCT | Percentage Error (%) URT/BCT | Normalized Error (%) URT/BCT |
|---|---|---|---|---|
| 4 × 4 × 4 | 0.002 | 0.0945/0.0296 | 2.48/0.49 | 2.48/0.49 |
| 0.01 | 0.0824/0.1005 | 2.11/1.66 | 2.16/1.67 | |
| 0.04 | 0.0434/0.5588 | 1.04/7.76 | 1.13/9.31 | |
| 0.06 | 0.1403/1.3748 | 3.34/16.60 | 3.68/23.24 | |
| 0.08 | 0.127 | 2.83 | 3.33 | |
| 8 × 4 × 2 | 0.002 | 0.2385/0.0299 | 5.32/0.42 | 5.36/0.43 |
| 0.01 | 0.2006/0.0695 | 4.36/0.92 | 4.51/0.99 | |
| 0.04 | 0.208 | 4.42 | 4.68 | |
| 0.06 | 0.14 | 2.8 | 3.15 | |
| 0.08 | 0.306 | 5.36 | 6.88 | |
| 8 × 8 × 1 | 0.002 | 0.29/0.0379 | 5.47/0.47 | 5.54/0.47 |
| 0.01 | 0.35/0.4073 | 6.46/4.74 | 6.61/5.09 | |
| 0.04 | 0.49 | 7.65 | 9.26 |
Table 2.
Model error exploration.
| Topology/Traffic Pattern | Average Distance | Topology Regularity (R) | ADM | Proposed | Range ADM | Range Proposed | |
|---|---|---|---|---|---|---|---|
| 4 × 4 × 4/URT | 3.8 | 1 | 0.04 | 0.09 | 0.12 | 33% | 75% |
| 8 × 4 × 2/URT | 4.44 | 1.1667 | 0.04 | 0.06 | 0.08 | 50% | 75% |
| 8 × 8 × 1/URT | 5.33 | 1.41667 | 0.015 | 0.02 | 0.06 | 25% | 33% |
| 4 × 4 × 4/BCT | 6 | 1 | 0.03 | 0.05 | 0.08 | 37.5% | 62.5% |
| 8 × 4 × 2/BCT | 7 | 1.1667 | 0.015 | 0.018 | 0.04 | 37.5% | 45% |
| 8 × 8 × 1/BCT | 8 | 1.41667 | 0.009 | 0.011 | 0.025 | 36% | 44% |
Table 3.
Relationship between average distance, regularity and saturation injection rate.
| Topology/Traffic Pattern | R | |||
|---|---|---|---|---|
| 4 × 4 × 4/URT | 3.8 | 1 | 3.8 | 0.12 |
| 8 × 4 × 2/URT | 4.44 | 1.1667 | 3.8 | 0.08 |
| 8 × 8 × 1/URT | 5.33 | 1.41667 | 3.76 | 0.06 |
| 4 × 4 × 4/BCT | 6 | 1 | 6 | 0.08 |
| 8 × 4 × 2/BCT | 7 | 1.1667 | 6 | 0.04 |
| 8 × 8 × 1/BCT | 8 | 1.41667 | 5.65 | 0.025 |
Publisher’s Note: MDPI stays neutral with regard to jurisdictional claims in published maps and institutional affiliations. |
© 2022 by the author. Licensee MDPI, Basel, Switzerland. This article is an open access article distributed under the terms and conditions of the Creative Commons Attribution (CC BY) license (https://creativecommons.org/licenses/by/4.0/).
Share and Cite
MDPI and ACS Style
Tatas, K. Performance Analysis of 2D and 3D Bufferless NoCs Using Markov Chain Models. Technologies 2022, 10, 27. https://doi.org/10.3390/technologies10010027
AMA Style
Tatas K. Performance Analysis of 2D and 3D Bufferless NoCs Using Markov Chain Models. Technologies. 2022; 10(1):27. https://doi.org/10.3390/technologies10010027
Chicago/Turabian StyleTatas, Konstantinos. 2022. "Performance Analysis of 2D and 3D Bufferless NoCs Using Markov Chain Models" Technologies 10, no. 1: 27. https://doi.org/10.3390/technologies10010027
Note that from the first issue of 2016, this journal uses article numbers instead of page numbers. See further details here.