1. Introduction
Unified Modeling Language (UML) is a robust visual mechanism for describing processes and systems. UML is useful across a wide variety of software engineering scenarios, such as modeling structural information, interactions between system components, use cases, workflows, and more [
1]. There are several variations of UML diagrams; this work focuses specifically on UML class diagrams.
Class diagrams are visualizations of structural information in an object-oriented software system. The object-oriented programming paradigm emphasizes separating a computer program into components that accomplish tasks via sending messages to one another.
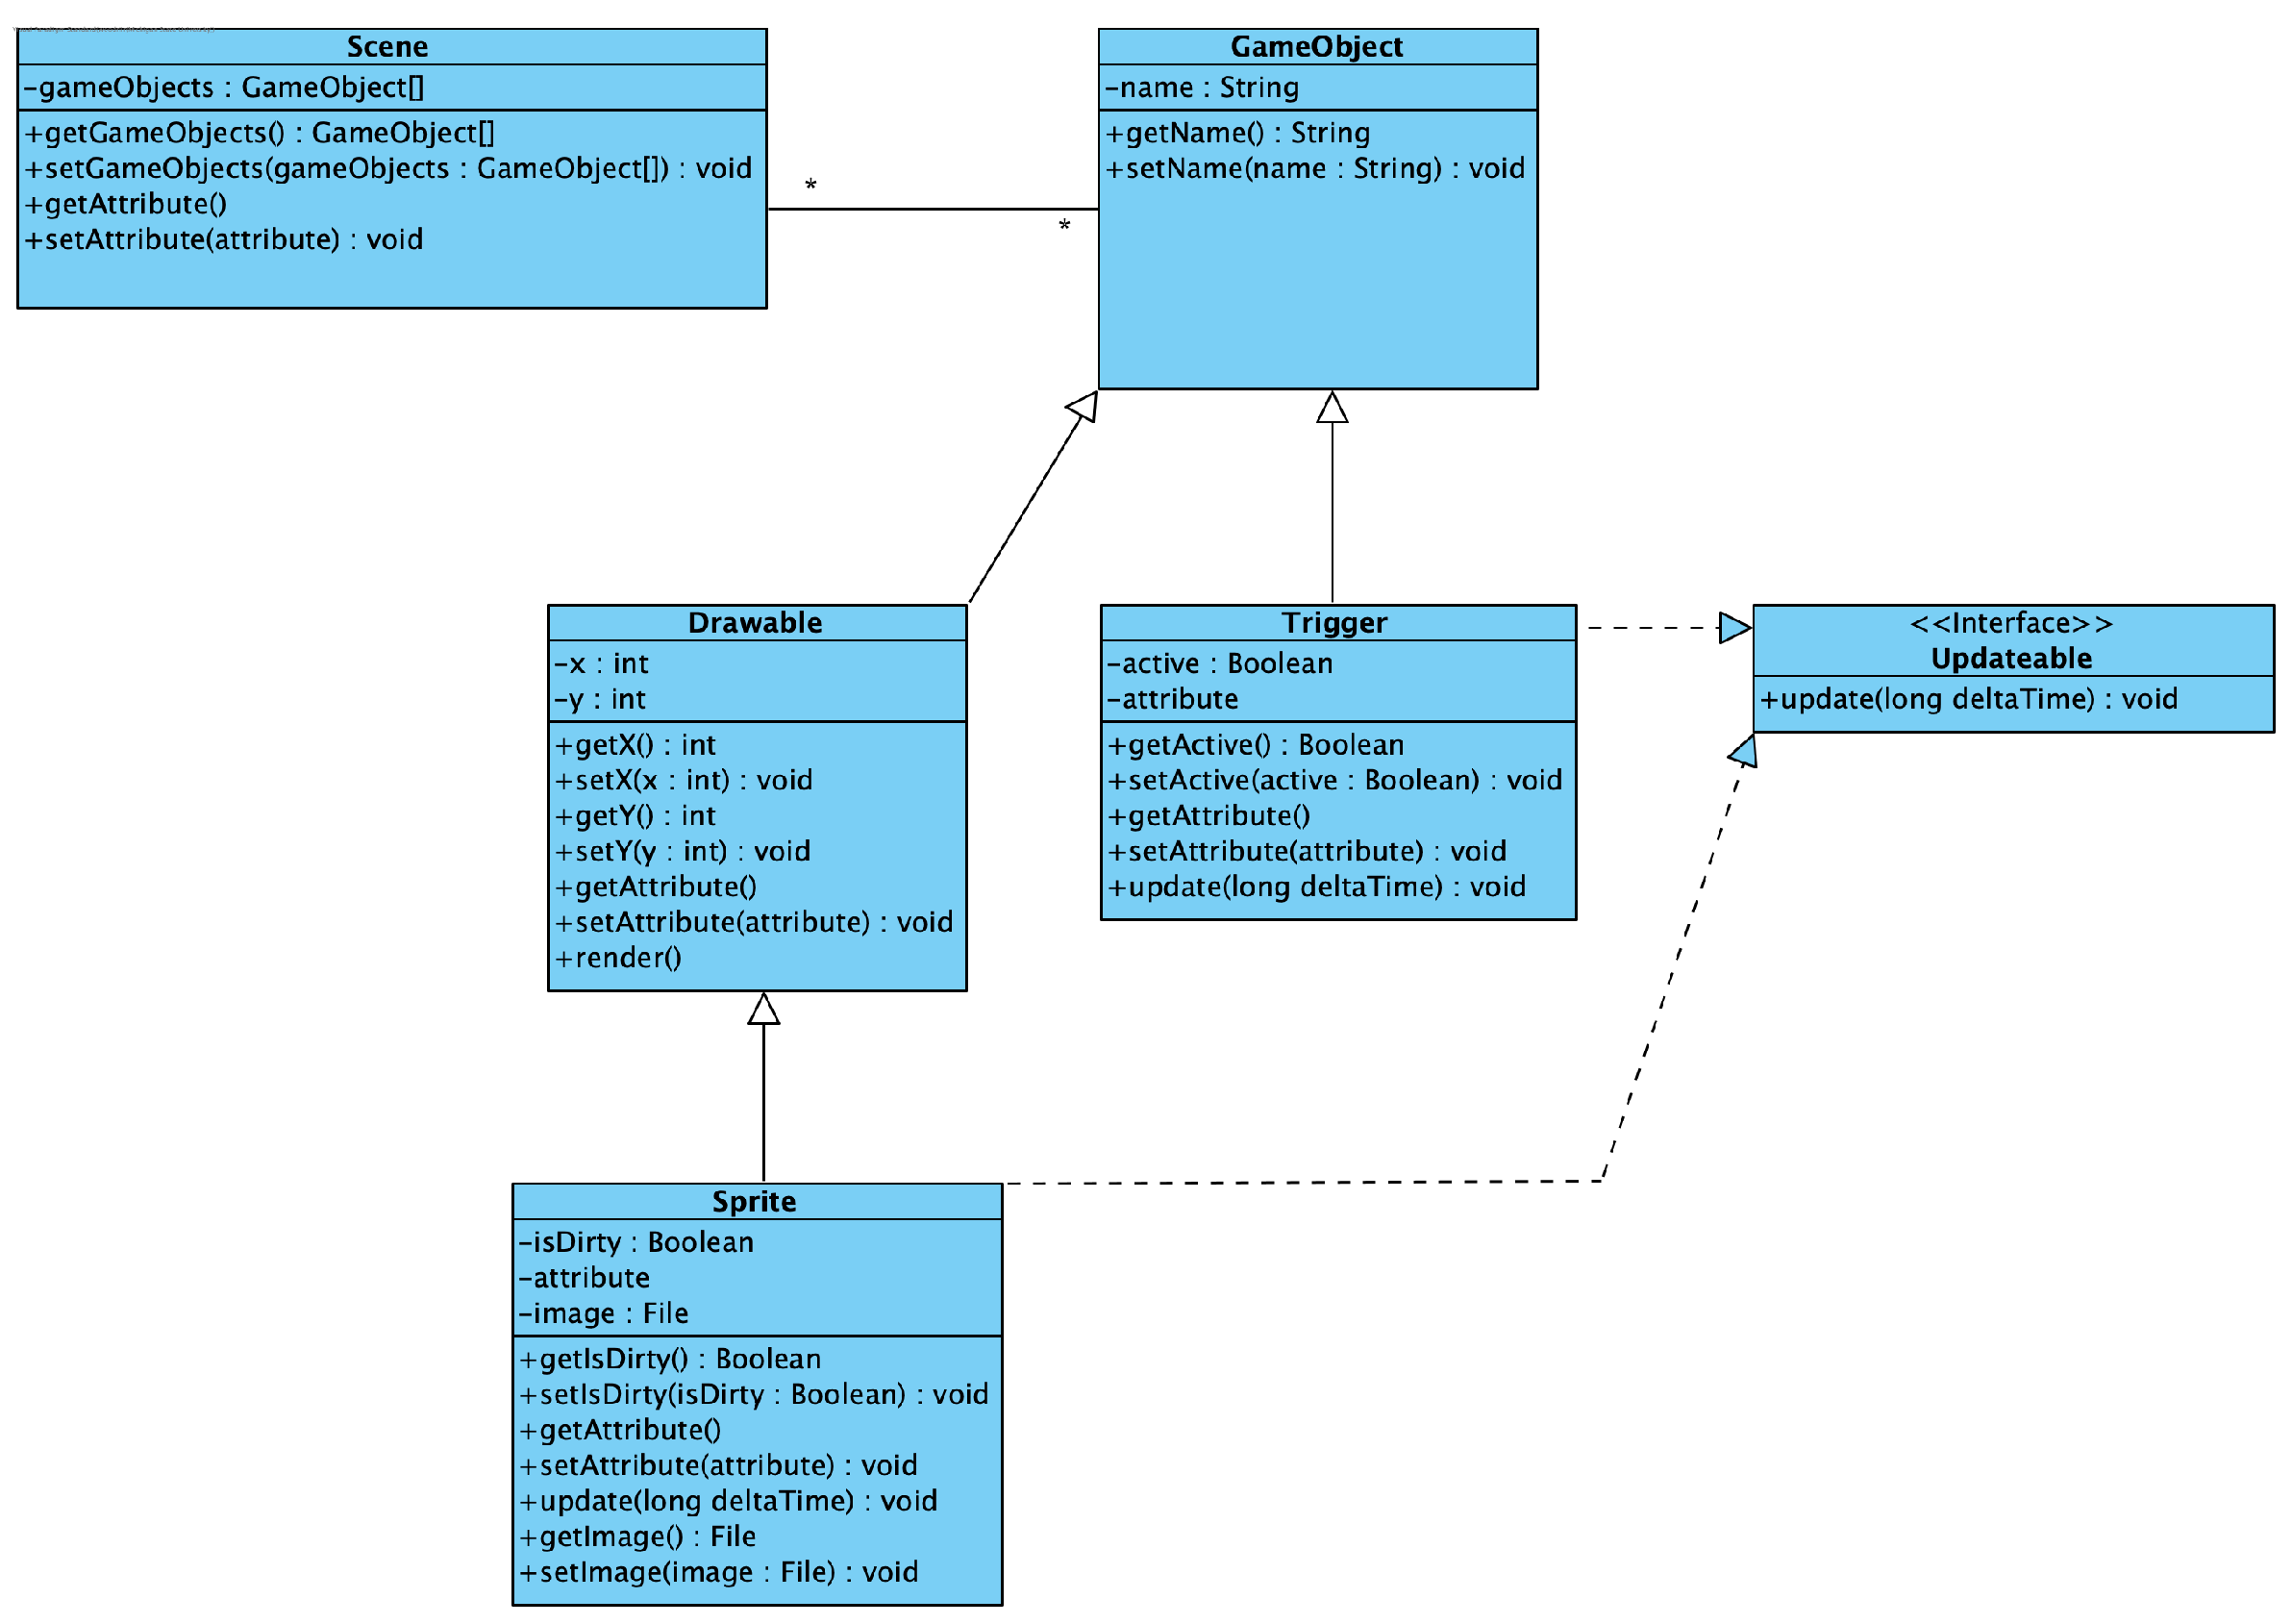
Figure 1 is an example UML class diagram [
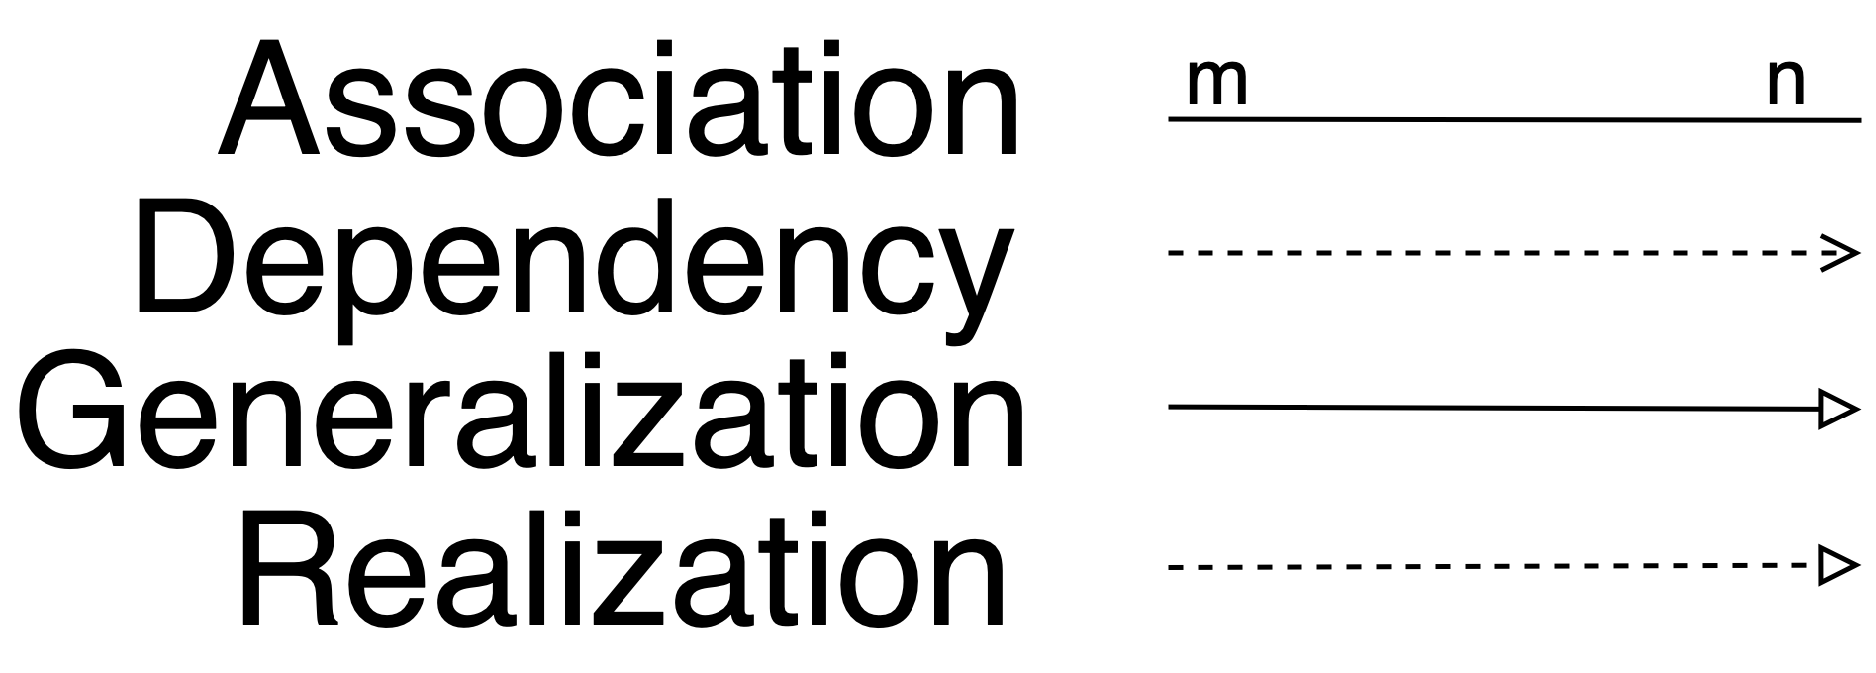
1]. Classes—the blueprints for software objects—are represented by rectangles. Relationships between the classes are represented by various lines and arrows. Each line has an optional line ending and the line and ending together designates a particular relationship between the entities of those types. There are four relationships depicted in this manner. The first indicates that a change to one entity changes the connected entity (dependency). The next specifies that an entity can ask another to perform some behavior (association). Another declares that an entity is a less specific type of another entity (generalization). The final one stipulates that an entity provides behavior specified in some other entity (realization) [
1].
Figure 2 provides the specific lines and line endings for each.
Unfortunately, while the use of visualizations for the conveyance of information is a common practice, it does not always yield perfect results. Humans are not uniform in the acuity of their senses, nor the commonality of their perceptions of some stimuli. Rules for best practices in the design of visualizations that are highly usable for the majority of people are well understood, but even visualizations designed with those rules in mind may not be enough to convey information completely for all people. While teaching undergraduate software engineering courses, the authors of this paper have encountered students who struggle with recognizing relationships between software objects portrayed via UML class diagrams. Student struggles may be due to their newness to the task, perceptual difficulties and misconceptions, or due to visual impairments.
Sonification of information is one way to bridge this gap. The use of sonification techniques and related audio graphs has been shown to aid in conveying information across a wide variety of domain areas. For instance, researchers have found that the presentation of general purpose graphs such as scatterplots [
2], line graphs [
3], shapes [
4], and relational graphs (graphs of relationships modeled with nodes and edges) [
5] through sonifications can increase user understanding and retention. Sonification techniques have been used in a broad range of fields; for instance, among many other areas it has been used for exploring and better understanding electroencephalograms (EEGs) [
6], neural networks [
7], and astronomical images [
8]. It demonstrates a high level of versatility as a mechanism to supplement or replace visual data.
Unfortunately, sonification mechanisms are not as well understood or as well formulated as visualization techniques. General guidelines exist, such as those in Herman, et al. [
9], yet user perception and preference of stimuli can cause issues in sonification designs. Users may, for instance, perceive a rising frequency as an increasing magnitude, while others perceive the same stimuli as being indicative of a decreasing magnitude [
10,
11]. Additionally, researchers have found that listeners may attach connotations to sounds, and that the stimuli chosen to represent data should sound the way listeners expect [
12,
13].
It is therefore necessary to investigate user perceptions of audio properties as they relate to specific tasks before their use in a sonfication. For the representation of UML class diagrams, the specific tasks are recognition of a stimuli as an entity, recognition of the entity type, and recognition of the relationships between entities.
This paper details the methods and results of a two-part study designed to determine the baseline ability of users to determine positional relationships between objects in a two-dimensional Cartesian space. The information gained from this study will be used in the creation of a sonification for UML class diagrams to provide an additional modality in the conveyance of this type of information. This paper is an extension of our prior work [
14], and extends that work by providing additional related work, prior study information, and further discussion.
2. Materials and Methods
Two studies were performed. The first study examined sonification of the subtask of identifying entity types. The second study focused on user perception of the relationship between entities.
2.1. Study One—
Determining User Perception of Audio Stimuli as Geometric Shapes
UML (and other) visualizations convey information with geometric primitives such as simple shapes, lines, and arrows. The researchers sought to determine if such primitives could be conveyed via the fairly simple audio properties of pitch and amplitude, after some user training. A simple mapping was created for a two-dimensional space, whereby amplitude was linearly mapped to the
x-axis and pitch is mapped linearly to the
y-axis. Functions for the mapping were
With these mappings, the frequency range of the
y-axis is 220 Hz to 880 Hz. Normally accepted human hearing range is 20 Hz–20,000 Hz, though the upper limit does decrease with age [
15,
16]. Amplitude functions provide a stereo effect whereby the minimum
x-value is portrayed as full amplitude in the left ear and zero amplitude in the right, center of the
x-axis is portrayed as equal amplitude of the signal in both ears, and full amplitude in the right ear with zero amplitude in the left for maximum
x-value. A number of other mappings were considered, including a variety of stereo panning mappings and the use of a logarithmic scale for pitch. While the authors do intend to evaluate these options in future studies, they opted for this simple mapping in these initial studies, given users were given an unlimited amount of training and familiarization time.
A software application was created that presents a two-dimensional space to a user. Subjects were presented with 10 shapes. These shapes were composed of 6 or fewer line segments representing convex polygons. Convex polygons are polygons wherein a line between any two points in the polygon is completely contained in the polygon. A Planar PCT2485 touch-screen display was used to present the two-dimensional space. The space itself measured 18.1 cm by 18.1 cm. Users were able to push buttons on a Korg nanoPAD2 midi device to control the playing and pausing of shapes, as well as speed and direction the sonification of the shape was played (either clockwise or counter-clockwise). The audio was produced by a computer connected to a Behringer HA4700 multi-channel headphone amplifier. This setup allowed each listener to control volume individually. Researchers were able to monitor the sounds presented to participants to ensure the systems were working properly. Subjects used Sony Professional series MDR-7506 stereo headphones for the audio playback.
Participants were given as much time to practice and grow acclimated with the setup as they wished. On-screen buttons for playing the center coordinate audio, values around the edge of the plane, and random points were provided. During the practice time subjects were able to play a random point, select on the touchscreen the position they perceived it to be located, and then see the actual position. They were also allowed to play sample shapes and view the result. Once the subjects felt ready, they would indicate that readiness to the researcher who would begin the presentation of the study shapes.
Five test shapes were initially presented to each participant. Shapes were all composed of line segments. When one line segment ended, a small click was played to indicate to the user that the direction was changing. Subjects could repeat the shape as many times as they wanted, play it in a clockwise or counter-clockwise direction, slow or increase the speed of playback, and control volume on their own. When they were comfortable that they knew the shape being presented, they would attempt to draw the shape as they perceived it and were then shown the correct shape. After five attempts the researcher would tell the subject they would no longer be shown the correct shape for the remaining 10 shapes. After the final 10 attempts, the session ended without the participants being shown the actual shapes to prevent future subjects from participating with incoming bias or knowledge.
Shapes used were equilateral, isosceles, and scalene triangles, squares, rectangles, diamonds, and randomly chosen four to six line segment polygons.
2.2. Study Two—User Perception of Stimuli in Relation to a Cartesian Space
The first study examined the ability of users to recognize geometric shapes presented via the mappings of Equations (1)–(3). The task proved to be very difficult for users. The second study was designed to determine if any baseline commonality exists between user perception of these audio properties in relation to a two-dimensional space. For the presentation of UML class diagrams, with the relatively small number of visual primitives used, the ability to recognize shapes portrayed by the mechanisms of the first study could be replaced by other psychoacoustic properties such as timbre differences. For instance, position of an entity could be represented via the prior described mappings but an entity of one type might be portrayed with a cello and another type by a flute. Users need only be able to recognize the relative positions and timbre of entities presented.
The second study examined the ability to recognize relationships between entities represented via audio in a two-dimensional Cartesian space. The study was comprised of two parts. The first part measured how closely users could discern a specific point in the two-dimensional sonification space. The second part examined the ability to choose two points, and more importantly, measured how accurately they perceived the relationship between the two points.
The experiment setup was the same as the first study, with the exception that sonification stimuli were different. The experiment software randomly chose one or two points depending on the test and waited for the user to select where they perceived that point to be by touching the touch-screen with a stylus. The intended point and the user-selected point were then shown. The intended point or points were represented by a solid circle and the users’ selected point or points were represented by a concentric circle target.
2.2.1. Study Two Part One—Single Point Presented
Users were given as much time as they felt they needed to practice. During practice, users would press a button on-screen to play a point. They would then select where they perceived the point to be in the space by touching a corresponding coordinate system on the screen. Users were able to play the center point of the space, a range of values equally spaced around the entire space, and could replay the sound representing the point as many times as they wished.
Once participants felt comfortable they indicated to the researcher that they were ready to begin the test. Ten points were presented to each participant. Each point was presented as a one-second-long audio note. After the selection of a point, they were shown the intended point. A cumulative score was kept that summed the error distance (in pixels) between the presented and selected points. A perfect score would then be 0, indicating that participants had no error between the point and the intended point. Participants were told to keep their scores as low as possible, and the current 10 best scores were presented on a best scores page shown to users before testing. At any time the participants were able to replay the center point or range of values around the presentation plane. The software interface is presented in
Figure 3 (the figure shows the two-point test described in the next section as opposed to the single-point).
2.2.2. Study Two Part Two—Two Points Presented
The second study evaluated the participants’ ability to perceive relationships between entities presented with audio stimuli. This ability is measured by presenting two points to users and asking them to select the approximate location of each. Prior to this two-point test, participants were asked to complete the same task as those in part one. Once they finished the first part of the study they were allowed to practice this two point task until they felt they were ready to begin.
Points were presented with a duration of either 0.125, 0.25, 0.5, 1.0, and 2.0 s. For the 10 trials, each duration length was selected twice but at random. The same duration is used for the presentation of the first and second point in each test. Participants were asked to listen to both points before selecting the two points on the screen. Ten trials were presented, with the users being shown the intended results and selected points after each trial.
4. Discussion
4.1. Study One
The authors wish to convey UML diagrams via audio properties. To that end, the authors hypothesized that the simple audio parameters of pitch and amplitude could be used to convey geometric shapes in a two-dimensional Cartesian space. However, participants were unable to consistently recognize specific shapes. User errors were too varied to perform useful formal analysis. For instance, even though participants were informed that all shapes presented would be closed polygonal shapes made up of a small number of line segments, users often perceived open shapes. Many users struggled to discern changes in the direction of line segments even after the sentinel clicking sound, signifying a change.
Ultimately this study resulted in the authors reformulating their hypothesis. Drawings of shapes reproduced by the participants were inconsistent, bordering on random, and a thorough analysis of the drawings and their inconsistencies was not performed. The authors suspect that alternative psychoacoustic properties such as timbre may be better leveraged to indicate entity types. For instance, if listeners can discern relative positions between entities, a specific type of entity may be represented by a cello waveform and another type by an oboe waveform. For such a mechanism to work, researchers first needed to determine if the presentation of positions via audio allowed users to accurately perceive such relationships. This need led to the design of the second study.
4.2. Study Two
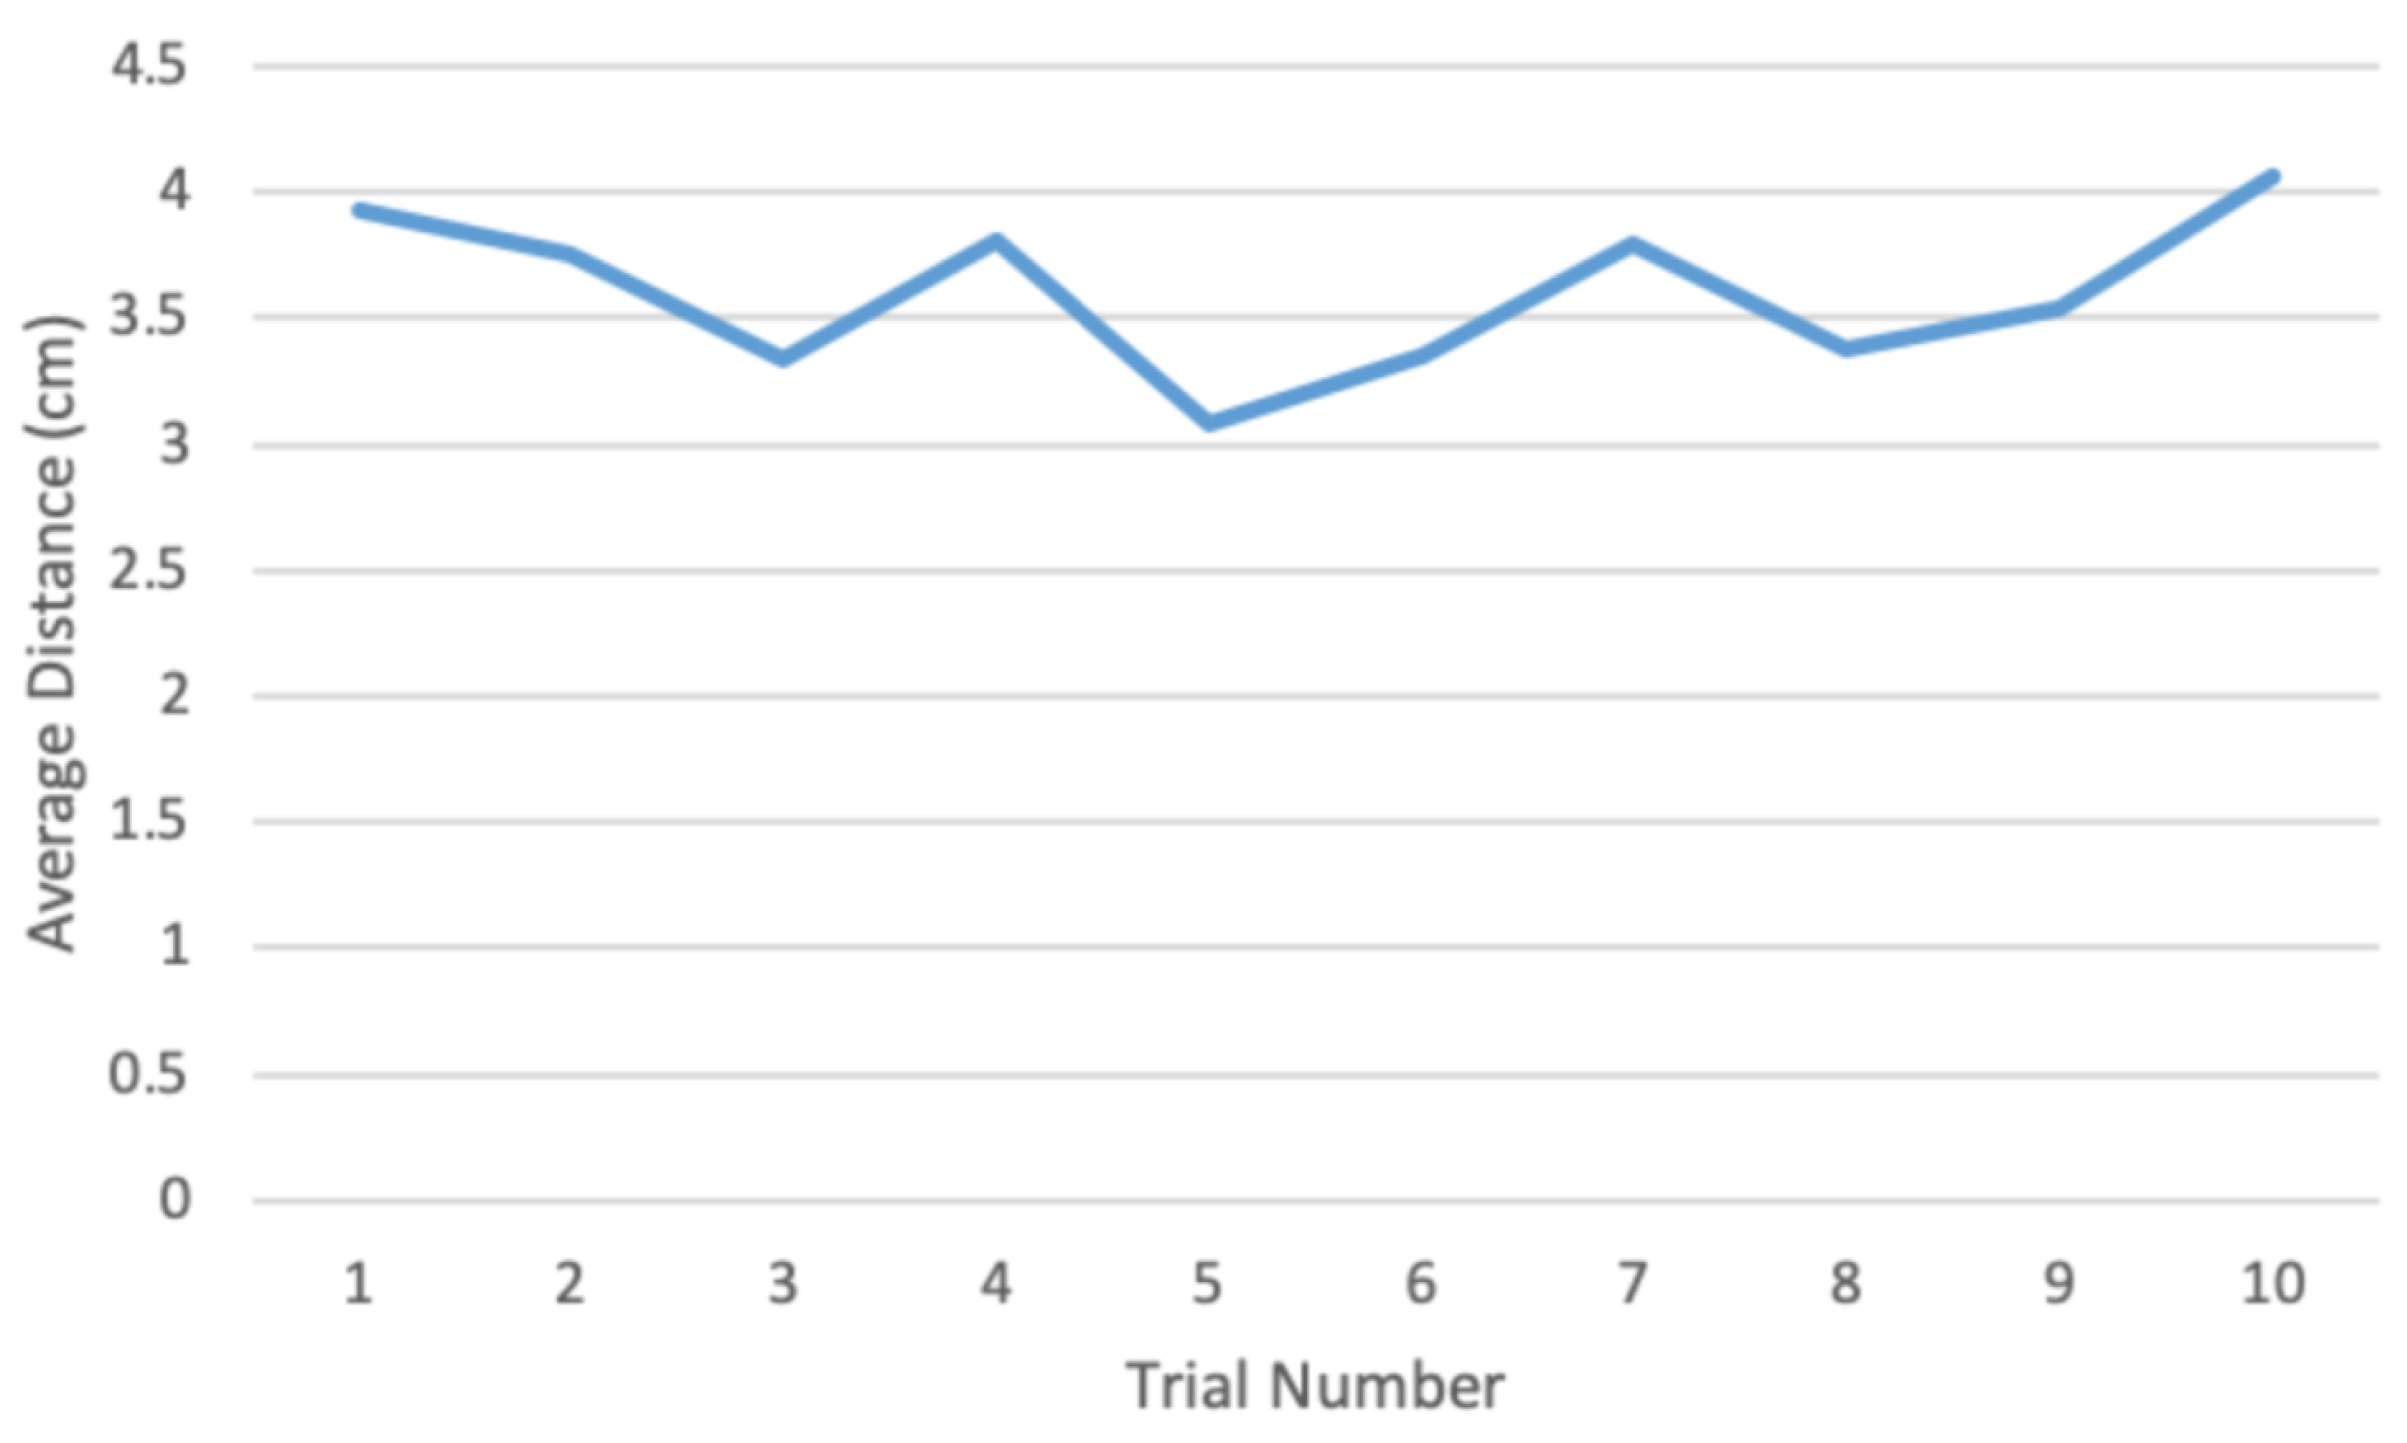
Study two shows that participants can discern relative locations between two points with reasonable accuracy. Stimuli duration of a second yields the best results, with shorter duration resulting in higher error. Participants tend to rotate the relationship between the points slightly counter-clockwise; while this should be revisited in future studies it is possibly an artifact of the choice of a linear scale for the y-axis instead of an exponential one.
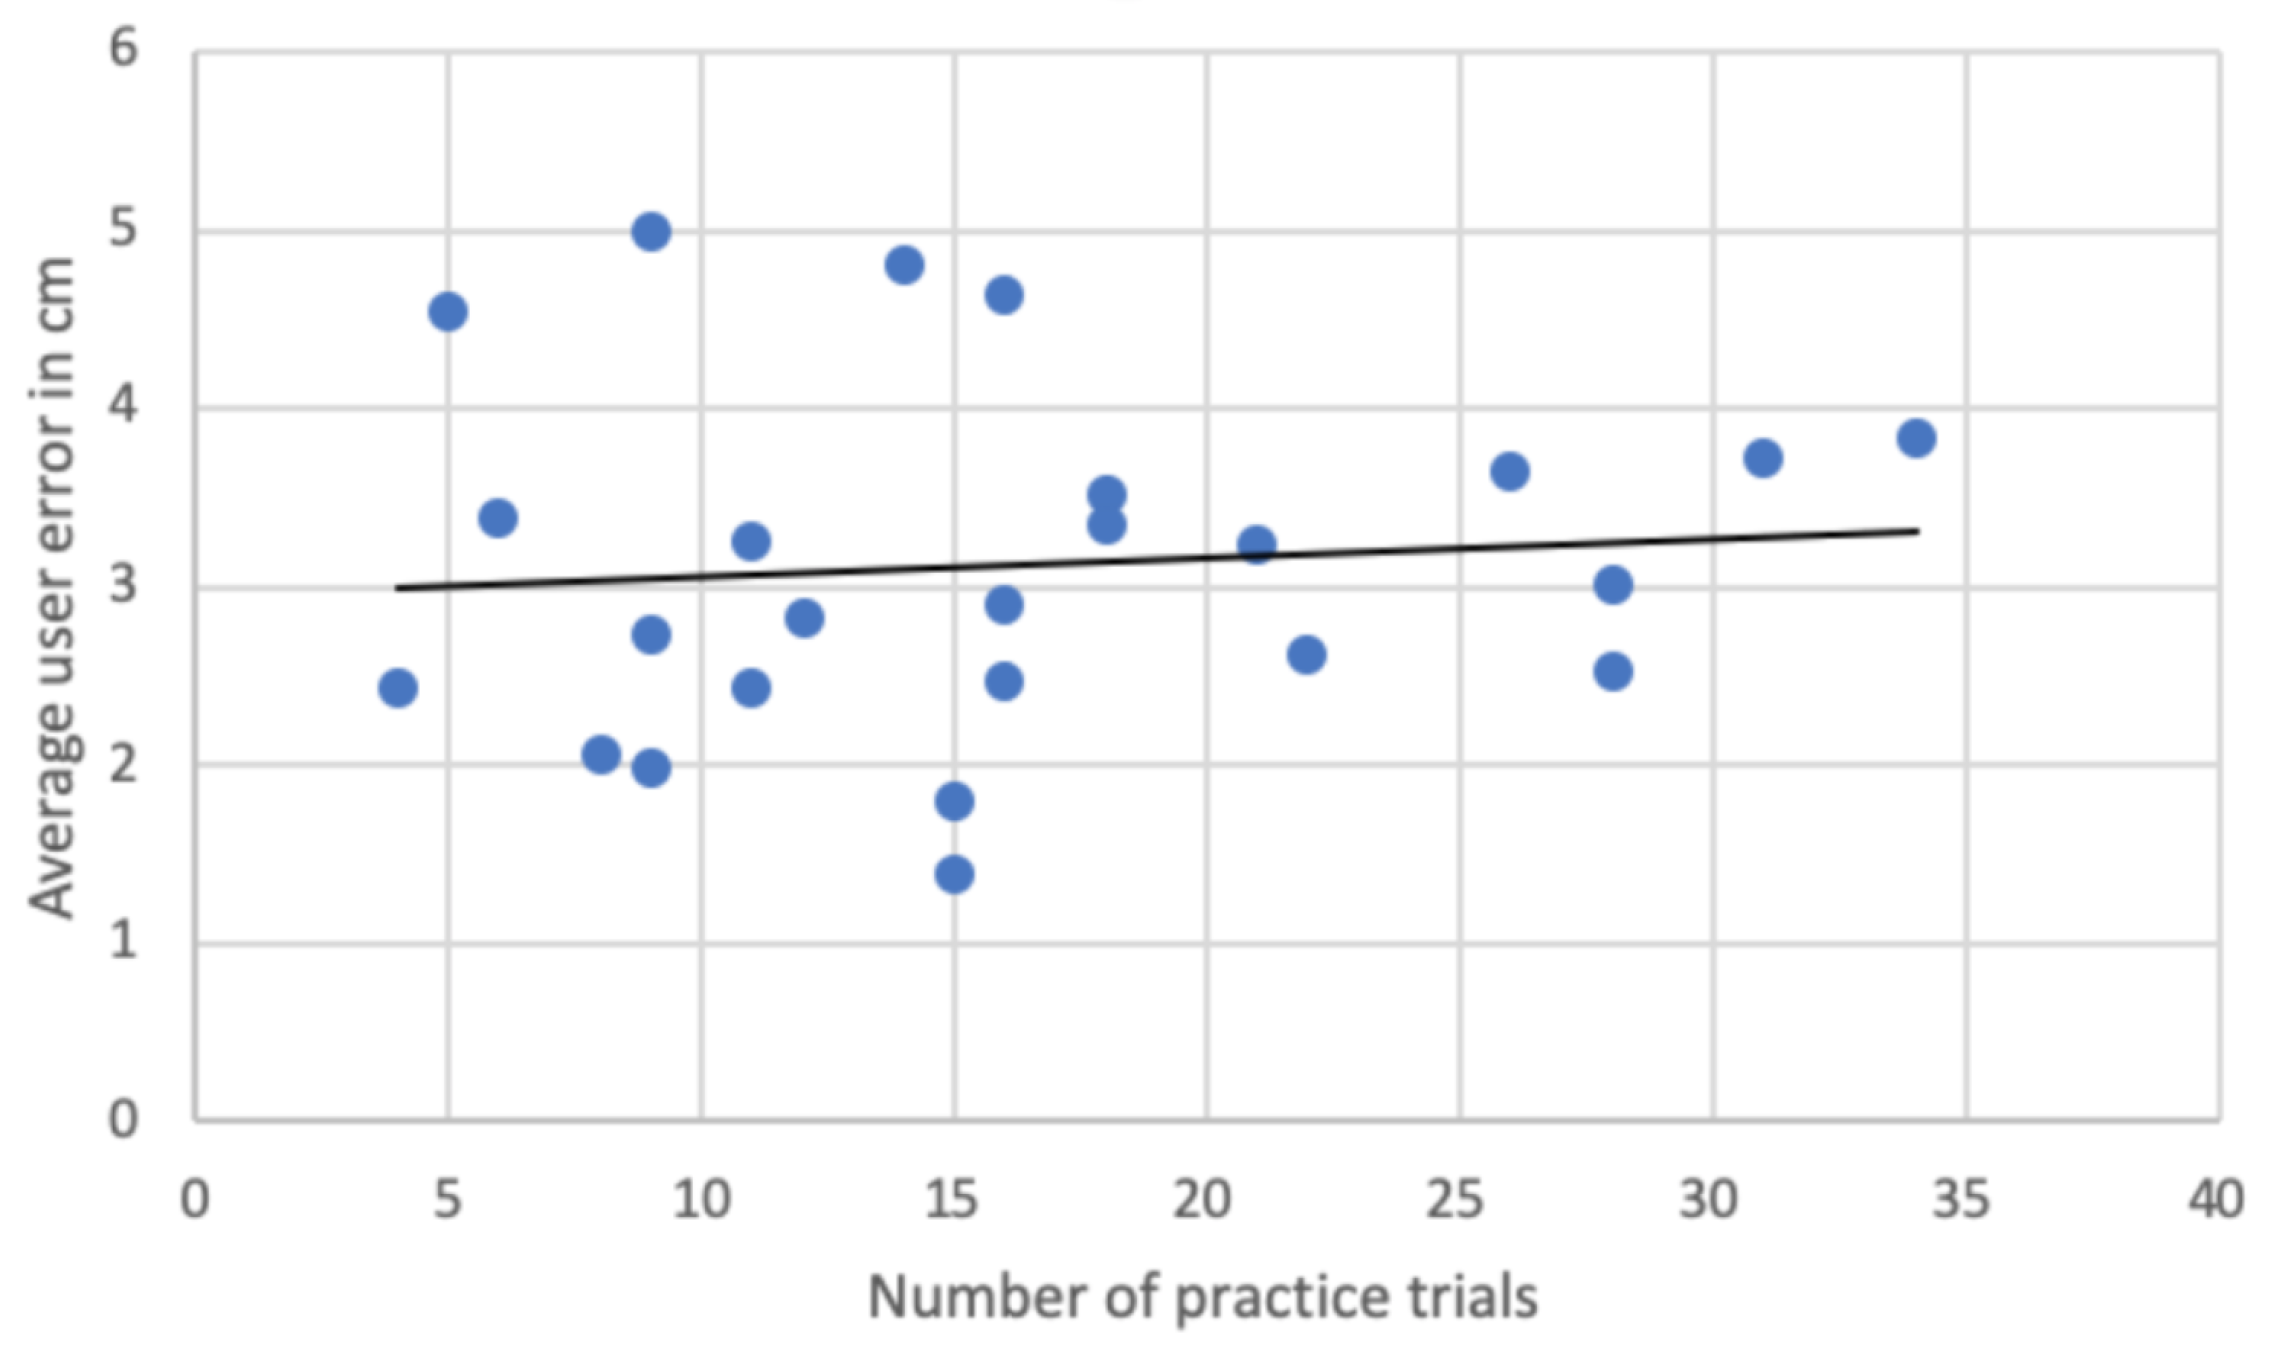
Division of the space could yield better results. Participant accuracy was not low, particularly given that they were being asked to select a very small point (pixels measured 0.2175 mm × 0.2175 mm). Division of the plane into a grid and asking users to select the correct cell could portray enough positional information while making the task easier for the users. Precision enhancements might result from other frequency and amplitude mappings, and these could be evaluated in the future if a more fine-grain approach is required. At this stage the current mappings are suited well enough for presentation of structured relationships given a grid-based system.
These results indicate that presentation of UML class diagrams, or supplemental UML information may be conveyed via the chosen psychoacoustic properties. For instance, it may be possible to sonify the relationships between UML classes in a class diagram by presenting each class as a point in space via the properties of pitch and amplitude and “connecting” the points via a sound of a specific timbre (perhaps a cello or flute) alternating between point positions. Care should be taken to determine the number of concurrent sounds participants can perceive and how changing the number of sounds affects user accuracy. Those limits are not clear. Many people can discern individual instruments in a symphony consisting of dozens of simultaneous sounds. The human auditory system is capable of very high bandwidth. Further study is needed to begin to tap into that sensory capability.

