Article

Investigating the Influence of Green Credit on Operational Efficiency and Financial Performance Based on Hybrid Econometric Models

Finance School, Hunan University of Commerce, Changsha 410205, China
*
Author to whom correspondence should be addressed.
Int. J. Financial Stud. 2017, 5(4), 27; https://doi.org/10.3390/ijfs5040027
Submission received: 16 May 2017 / Revised: 16 July 2017 / Accepted: 11 September 2017 / Published: 10 November 2017

Abstract

:
To understand the role of green credit in maintaining economic sustainability, we develop theoretical hypotheses including expectation, supervision and capital allocation channels to explain the impacts of green credit. Then, we use hybrid econometric models by using Chinese-listed enterprises in the energy-saving and environmental sectors from 2007 to 2015 as the research sample to verify the above hypotheses. The empirical results show that: (1) the average value of financial performance and operational efficiency is relatively low, and the endogenous abilities of those enterprises have not yet been established; (2) the issuance of green loans does not improve public expectations of enterprises in the green industry, thus the expectation channel is not supported; (3) the issuance of green loans does not necessarily improve the enterprise’s operational efficiency and financial performance, thus the supervision channel hypotheses are not supported; and (4) green loans lead to an increase in financing costs, management costs, operation costs, and expenditure on R&D, thus, the capital allocation hypothesis is partly supported. Based on the empirical analysis, we also provide some countermeasures to strengthen the roles of green credit to support the development of energy-saving and environmental enterprises.

1. Introduction

China has achieved great economic success during recent decades, but the Great Acceleration, which was proposed by Steffen et al. (2007), has caused high energy consumption and the deterioration of the environment. According to the 2016 State of Environment Report released on 5 June 2017, the environment of China continues to deteriorate. There are only 84 cities among 338 cities that have acceptable air quality. The average PM2.5 in the city of Beijing has reached 73 μg/m3. According to the report of the Global Green Economy Index (GGEI) 2016 (Tamanini 2017), the importance of green development has been recognized by China, and the investment in the green economy is continuously increasing, but the performance and improvement in efficiency of the green economy is not significant. Concerning the sustainability of economic development, the public is paying increasing attention to energy saving and environmental protection. Chinese President Xi Jinping also pointed out that it is important to protect the environment while pursuing economic and social progress in a keynote speech at the 2017 Davos World Economic Forum. Aiming to provide some insights into developing a green economy, we investigate the operational efficiency and performance of green countermeasures from a microeconomic level by using data from Chinese-listed enterprises.
Among the variety of countermeasures to develop a green economy, green credits as a financial tool have played an important role in realizing green development and economic sustainability. Green credits encourage loans to environmentally friendly industries and limit loans to industries that cause damage to the environment. By optimizing the credit structure, improving the quality of credit services, and facilitating a green development mode, green credit can promote a green economy with recycling. It is widely accepted that green loans and other types of green finance are crucially important for the sustainability of economic development. In the United Kingdom, the UK Green Investment Bank and Infrastructure loan guarantees provide Government funding and support for energy saving projects (House of Commons Environmental Audit Committee 2015). The United States has enacted the Comprehensive Environmental Response, Compensation, and Liability Act to make sure that loans issued by commercial banks are not related to projects that cause pollution. Meanwhile, there are many financial institutions, such as the Bank of America Corporation and the Crédit Agricole Corporate and Investment Bank, that have adopted the Equator Principles when issuing loans (Eisenbach et al. 2014; Wörsdörfer 2015). In China, an economic structure with high pollution, high consumption and high emissions poses huge damage to the environment and to potential economic growth. By considering international experiences, the Chinese government has implemented some policies to boost the development of green credits. For example, on 31 August 2016, the People’s Bank of China (PBC), along with six other government departments, issued the Guidelines for Establishing the Green Financial System. These guidelines provide an overall strategy for developing green finance. Commercial banks are also actively engaged in green loans. According to data released by the China Banking Regulatory Commission (CBRC), by June 2016, green loans issued by the 21 main commercial banks in China had reached 7260 billion Yuan, and the proportion of green loans accounted for 9% of total loans. Overall, the amount of green loans issued to the energy-saving and environmental industries were1690 billion Yuan and 5570 billion Yuan, respectively.
Because a large number of green loans are allocated to the energy-saving and environmental industries, commercial banks, supervisors, investors and other market participants are all interested in whether green loan have promoted financial performance and operational efficiency. Most of the current literature focuses on the implementation process (see, e.g., Cairns and Lasserre 2006; Zhang et al. 2011; Liu et al. 2015; Abdel Aleem et al. 2015), the role of green finance in environmental protection (see, e.g., Carraro et al. 2012; Wang and Zhi 2016; Linnenluecke et al. 2016), and green finance risk and management (see, e.g., Kellogg and Charnes 2000; Criscuolo and Menon 2015; Ng and Tao 2016), and some studies explore the evaluation methods and the impact of environmental performance on financial performance (see, e.g., Dobre et al. 2015; Kocmanová et al. 2016; Jin et al. 2017; Shen 2017). According to the above literature, although the impact of the project on the environment is difficult to evaluate, and there are some conflicts of interest for commercial banks, the green loan has gained importance and has been implemented by more and more countries and commercial banks. With the implementation of green credit and frameworks such as the Equator Principles, some enterprises or industries which destroy the environment have been prohibited from the credit market, and environmental protection behaviours have been encouraged, thus the environment is protected or improved by the green credit. While the existing literature has studies about green credit from different aspects, they are not concerned about the efficiency and performance of green credit from a microeconomic level. To fill the gap in the current studies, we develop theoretical hypotheses to explain the channels whereby green loans influence energy-saving and environmental enterprises. Based on the evaluation results of financial performance and operational efficiency, we also apply a dynamic panel data model to examine the influence of green loans on financial performance and operational efficiency by using Chinese-listed enterprises as the research sample. Finally, we provide some suggestions to develop green loans based on our empirical results.
The remainder of this paper is organized as follows. Section 2 develops the theoretical hypotheses. Section 3 designs hybrid econometric models for hypotheses verification. Section 4 provides the data and makes a preliminary analysis. Section 5 conducts the empirical study. Section 6 provides the policy implications. The final part concludes the paper.

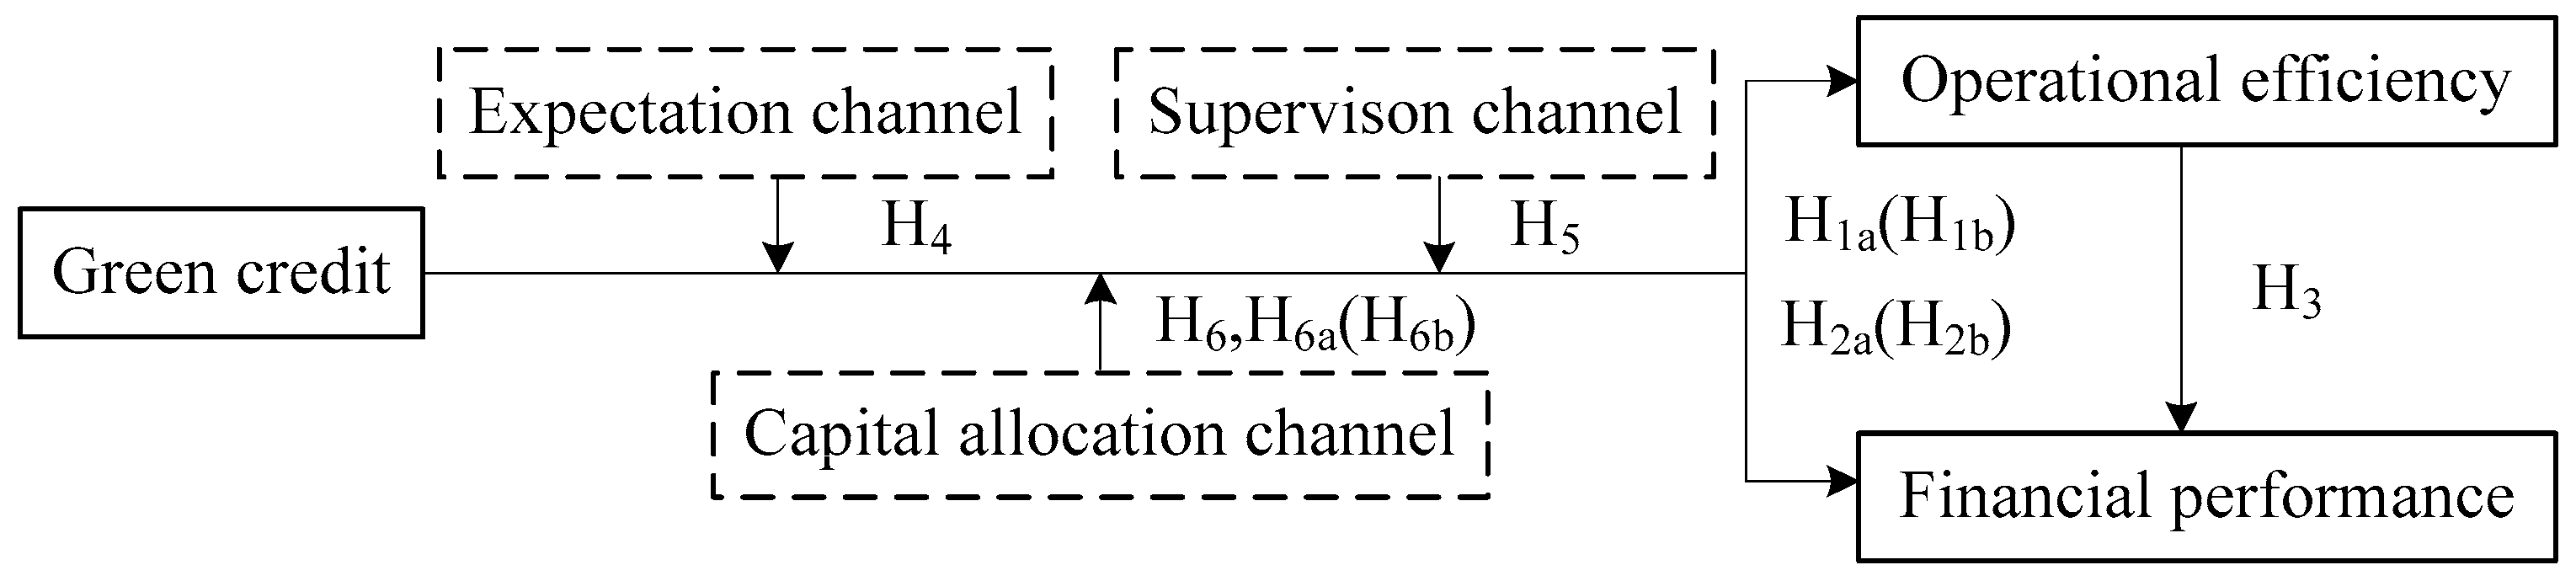
2. Hypotheses Development

To analyse the impact of green loans on energy-saving and environmental enterprises, our study developed several hypotheses regarding the existing literature and our inferences.

2.1. The Supporting Role of Green Credit on Energy-Saving and Environmental Enterprises

Green credits are one type of financial support method for energy-saving and environmental enterprises. Much of the previous literature has studied the role of debt financing as one type of financial support. Some scholars insist that debt financing may have a positive effect on corporate profitability and boost its financial performance (see, e.g., Modigliani and Miller 1958; Park 2000; Davydov 2016). Some scholars argue that debt financing may hurt corporate financial performance (see, e.g., Lewis et al. 2001; Chava and Purnanandam 2011; Jandik and Makhija 2005), while other scholars propose that moderate debt financing can improve corporate performance, but the high level of debt financing could lead to poor corporate performance. The influence of debt financing is dependent on the level, types and terms of the debt (see, e.g., Campello 2006; Barry and Mihov 2015; Liu et al. 2017). As green credits have only been implemented in recent years, scholars mainly discuss their importance and development countermeasures. Few have systematically studied their influence on operational efficiency and the performance of energy-saving and environmental enterprises. Green credit belongs to debt financing, thus, its function or role is similar to that of traditional debt. By referring to the previous literature, we developed hypotheses H1–H3 (as shown in Figure 1). We developed the hypotheses for the influencing mechanism in Section 2.2, Section 2.3 and Section 2.4.
H1a(H1b). 
Green credits can increase (decrease) the enterprise’s operational efficiency.
H2a(H2b). 
Green credits can increase (decrease)the enterprise’s financial performance.
H3. 
Higher operational efficiency leads to a higher financial performance.

2.2. Expectation Channel Hypothesis

Issuing a green credit to an enterprise indicates that this enterprise has done well in energy saving or environment protection. The public has realized the importance of green development. Under the pressure of environmental protection, some supervisory rules have been implemented to pursue green development. On the one hand, under the efficient market hypothesis, the asset price and return reveals information about the enterprise, including investor’s expectations on future financial performance (see, e.g., Fama 1970; Chen and Yeh 1997; Fama and French 1988; Milionis 2007; Lee et al. 2010; Urquhart and McGroarty 2016).Researchers have provided increasing evidence that the Chinese security market is gradually becoming a more efficient market (see, e.g., Zhuang et al. 2015; Kot and Tam 2016). Once an enterprise has been issued a green credit, the signal that the enterprise is certified to participate in environmentally related industries is sent to the market, and this signal is helpful for increasing optimistic expectations for the enterprise, thereby increasing the investment in the enterprise or providing more favourable lending terms and more tax benefits to the enterprise (see, e.g., Gao and Mei 2013; Li and Lu 2015; Bajo et al. 2016). Meanwhile, the optimistic expectations could also expand the visibility and reputation of the enterprise, thus, the enterprise may experience faster development and improved operational efficiency and financial performance. Therefore, we propose the following hypothesis (as shown in Figure 1):
H4. 
The impact of green credit is realized by the expectation channel.

2.3. Supervision Channel Hypothesis

Enterprises with loans need to pay the principal, and the creditor can also supervise the operation of the enterprises, thus, a green loan can play a supervisory role on these enterprises (see, e.g., Modigliani and Miller 1958; Park 2000; Campello 2006; Barry and Mihov 2015; Davydov 2016; Liu et al. 2017). First, the issuance of a green credit requires the corporation to meet certain conditions in terms of environmental protection and corporate performance. These conditions force managers to continuously decrease credit risks and increase operational performance. Second, green credit is a means to alleviate the conflicts of interest between managers and shareholders. Generally, debt financing can decrease the free cash flow controlled by managers, restrict the over-expansion of any self-interested behaviour, and restrain their impulse for over-investment. Third, managers look to their positions to fulfil their desire for reputation, but their reputation and the corporate market price will be affected as long as the corporation is at risk of financial distress. Thus, the debt could reduce the possibility of a capital chain rupture caused by managerial empire building. Based on the above literature and inferences, we propose the following hypothesis:
H5. 
The impact of green credit is realized by the supervision channel.

2.4. Capital Allocation Channel Hypothesis

The energy conservation and environmental protection industries belong to the category of strategic emerging industries. Whether an enterprise is able to continue its technological leadership is associated with its market competitiveness. After an enterprise acquires a green loan, particularly a long-term loan, free cash flow will increase (see, e.g., Gul and Tsui 1997; Xu and Li 2008; Park and Jang 2013), and as a result, the expenditure on R&D may also increase with the issuance of the green credit. Generally, more capital allocation to R&D will improve an enterprise’s technical efficiency, thus, the issuance of a green loan may lead to operational improvements and better business performance. Meanwhile, the increase in corporate cash flow might improve its product sales, staff incentives and marketing promotions, thus improving market share and achieving better business performance. Moreover, due to the uncertain results of R&D and over-investment in business promotion caused by an increase in free cash flow (see Xu and Li 2008; Park and Jang 2013), increases in research and development expenses and costs does not necessarily lead to better operational efficiency and financial performance. Based on the above analysis, we propose the following hypotheses:
H6. 
The impact of green credit is realized by the capital allocation channel.
H6a(H6b). 
Increased R&D and other expenditure promote (decrease) the enterprise’s performance.

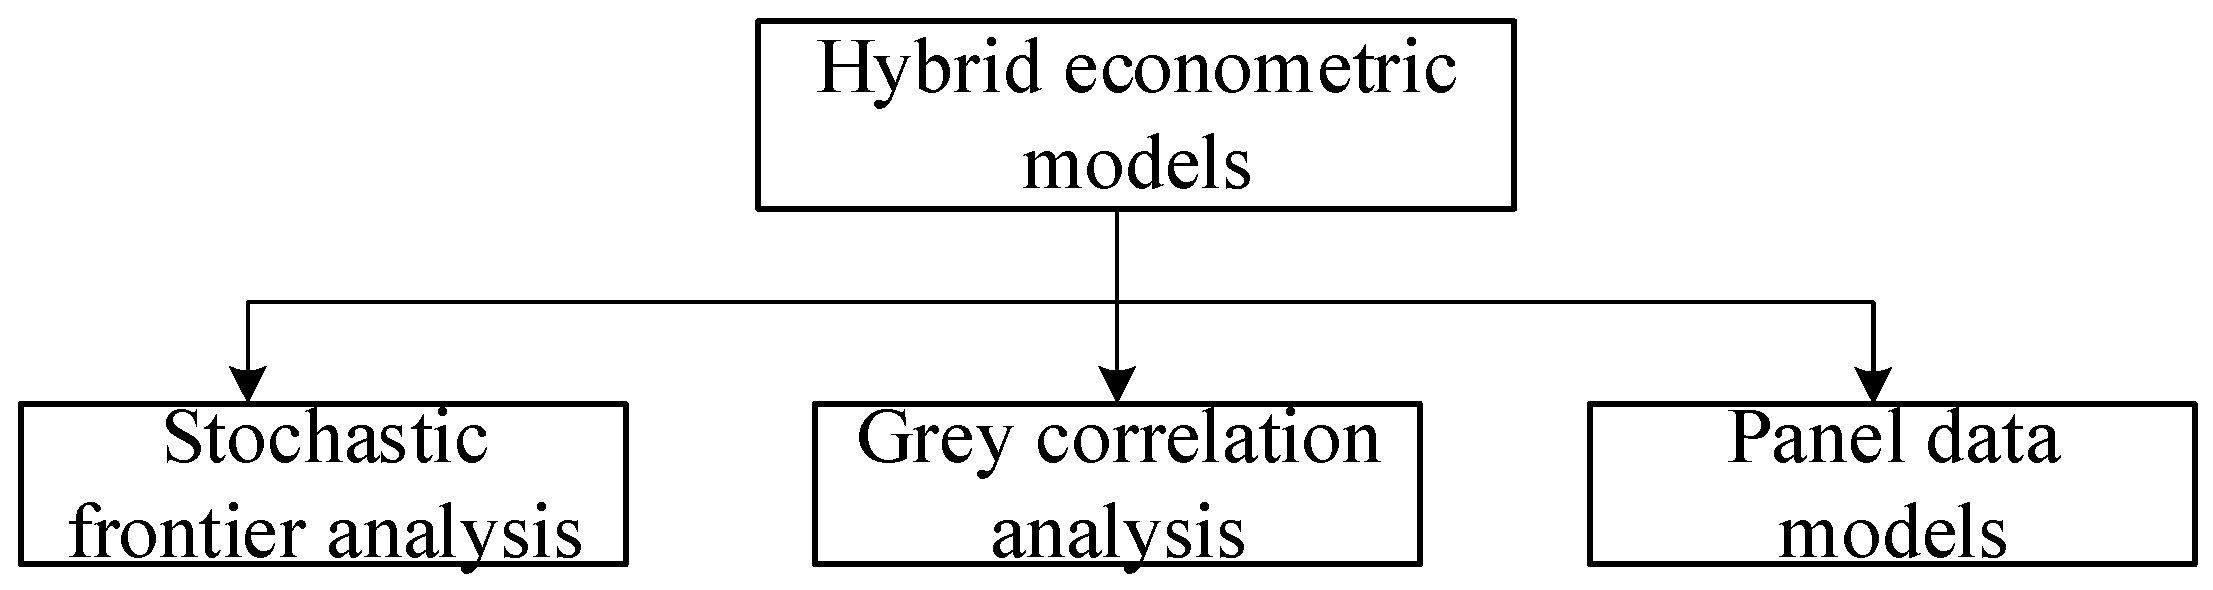
3. Design of Hybrid Econometric Models

To investigate the influence of green credit on the operational efficiency and financial performance of energy-saving and environmental industries, we apply a hybrid econometric model consisting of grey correlation, stochastic frontier analysis and dynamic panel data models in our study (as shown in Figure 2). The grey correlation analysis and stochastic frontier analysis are used to evaluate financial performance and operational efficiency, and a dynamic panel data model is adopted to investigate the influence of green credit on financial performance and operational efficiency of the listed enterprises. The specific purpose of each individual econometric model is described in Section 3.1, Section 3.2 and Section 3.3.

3.1. Operational Efficiency Evaluation Based on Stochastic Frontier Analysis

An operational efficiency evaluation reveals the ratio of the resource inputs to the outputs of the listed energy-saving and environmental enterprises. The typical methods for measuring the operational efficiency are DEA (data envelopment analysis) and SFA (stochastic frontier analysis). In the Chinese stock market, there are whitewash statement behaviours for some listed enterprises, and these behaviours may lead to a statistical error (Luo and Ouyang 2014). To alleviate the negative effect of whitewash statement behaviour on the measurement of operational efficiency, the SFA method with a random inefficiency item is applied to measure the operational efficiency. The stochastic frontier production function model is given by:
L n N P i = X i β + v i u i
In Equation (1), NPi stands for the net profit of the energy-saving and environmental enterprise i. X is an input variable that includes the scale of liquidity assets, fixed assets, total operating cost and the number of employees. The noise component is vi, and ui is the inefficiency component. ρ(i,j) = 0. The operational efficiency (OE) of energy-saving and environmental enterprises is calculated as:
O E i = E ( N P i | u i ) E ( N P i | u i = 0 , X i ) = N P i exp ( X i β + v i ) = exp ( X i β + v i + u i ) exp ( X i β + v i ) = exp ( u i )
In Equation (2), when OEi = 1, the enterprise i reaches maximum efficiency, and the enterprise i generates maximum output by using the resources. The value of OEi is between 0 and 1, and a larger value of OEi denotes that the enterprise is more efficient.

3.2. Financial Performance Evaluation Based on the Grey Correlation Method

It is more accurate to evaluate financial performance by using combined financial indicators, thus we use four groups of financial indicators to measure the financial performance of energy-saving and environment enterprises. The financial indicators include profitability, growth ability, operational ability and solvency ability. Because some behaviours of enterprises are difficult to directly observe, we used grey correlation analysis, which is based on the grey system to evaluate the overall financial performance of the energy-saving and environmental enterprises. For the evaluated object i, (i = 1,2,...,m), the financial indicators(j = 1,2,...,n) and the indicator metrics are denoted as:
V = ( V i j ) m n   [ V 11 V 12 V 1 n V 21 V 22 V 2 n V m 1 V m 2 V m n ]
In Equation (3), m is the number of sample enterprises. n equals 22, representing the 22 finance indicators that are listed in Table 1 (from pro1 to sol5). By taking the following steps, we evaluated the financial performance of the research samples.
Step 1: Select the evaluation indicators and the value of optimal indicators. The financial indicators are listed in Table 1. The optimal value of each indicator vector is V0 = (V01, V02,…, V0n). For the cost-type indicators and income-type indicators, the optimal value is the minimal and maximal value of all samples, respectively.
Step 2: Normalize the original finance indicators. For cost-type and income-type indicators, the normalization is given by: Xij = (Vijbj)/(ajbj), and Xij = (aj − Vij)/(ajbj), i = 1, 2,…, m. j = 1, 2,…, n. bj is the minimal of j indicator, and aj is the maximum of the indicator. After normalization, we obtained the transformed matrix X:
X = ( X i j ) m n   [ X 11 X 12 X 1 n X 21 X 22 X 2 n X m 1 X m 2 X m n ]
Step 3: Calculate the correlation between the value of each indicators and optimal indicators. The value of optimal reference indicator V0 = (V01, V02,…, V0n) and the indicators needing to be compared are Xi = (Xi1, Xi2,…, Xin), i = 1,2,…,m. Thus, the correlation ξij is denoted as:
ξ i j = min i   min j | X 0 j X i j | + ρ   min i   min j | X 0 j X i j | | X 0 j X i j | + ρ   min i   min j | X 0 j X i j |
In Equation (5), ρ is the discrimination coefficient. To realize the balance between distinguishing the effect and stabilizing the model, we assign ρ to the value of 0.5 by referring to Chang and Lin (1999) and Jia et al. (2015), thus, the correlation matrix is displayed as:
E = ( ξ i j ) m n   [ ξ 11 ξ 12 ξ 1 n ξ 21 ξ 22 ξ 2 n ξ m 1 ξ m 2 ξ m n ]
Step 4: Calculate the integrated correlation between each sample and optimal sample by comparing the actual finance indicator of enterprise i with optimal indicator at time point k.
γ i = w j = 1 n ξ i j   i = 1 , 2 , , m
where γi is the grey correlation degree between Vi and V0, representing the multivariable comprehensive results of the finance performance. When γi = 1, the enterprise i obtains the optimal performance. In Equation (7), w is the weight. We used the entropy weight method to acquire the objective w, which measures the information content of the financial indicators. By defining the scaled matrix Rn,m, we can obtain the weight of indicator j:
H j = k i = 1 m f i j ,   ( j = 1 , 2 , , m )
w j = 1 H j m j = 1 m H j ,   ( j = 1 , 2 , , m )
where k = ln n , f i j = R i j / i = 1 n R i j , and when f i j = 0 , f i j ln f i j = 0 . By taking the above steps, we can evaluate the comprehensive finance performance of the energy-saving and environmental enterprises.

3.3. Examining the Influence of Green Credit Based on Dynamic Panel Data Models

Considering the fact that the financial performance and operational efficiency of energy-saving and environmental enterprises is generally influenced by their own lagged value, we used a dynamic panel data model to examine the influence of green credits. The basic dynamic panel data model is given by:
Y i , t = μ + ρ Y i , t 1 + X i , t β + u i , t
Yi,t is the dependent variable of unit i at time t. Yi,t−1 is the lagged dependent variable of unit i at time t. For the different models, Yi,t represents the financial performance, operational efficiency and other dependent variables according to different hypotheses provided in Section 2. Xi,t is the independent variable. The specific setting of variable Yi,t and Xi,t is discussed in Section 5.2. In our study, the sample period is from 2007 to 2015, the length of time being relatively short, and thus, we use the difference GMM method to estimate the coefficient of dynamic panel data models, and the AR test and the Sargon test in the following study confirm that the difference GMM estimator is valid. Additionally, the market environment is changing very quickly, industrial policy, technology development and competition all cause a rapid change in the economy, thus the individual effects are often related to the different time period, thus it is not appropriate to use the system GMM estimator.

4. Data Sources and Preliminary Analysis

We focused on the influence of green credits on the operational efficiency and financial performance of enterprises in the energy-saving and environmental industries. The financial data and trading data are from the Wind database. In the Wind database, there is a list of enterprises related to the energy-saving and environment industry; this includes 274 enterprises. These industries are comprised of CDM projects, wind power generation, nuclear power generation, environmental conservation, building energy conservation, garbage power, green energy-saving lighting, tail gas treatment, sewage treatment, new energy production, new energy vehicles and new coal chemical industries. By checking the main operational business, we deleted samples where the main operational business was not closely related to energy-saving and environment protection. The final sample consists of 254 enterprises. The sample period is from 2007 to 2015. The data frequency is annual. Since the enterprises’ listing dates are not consistent, our data is unbalanced panel data. To evaluate the financial performance and operational efficiency of the sample enterprises, we use financial variables related to profitability, operational ability, solvency ability and growth ability, and the specific variables are displayed in Appendix A (Table A1).
Because the initial listing dates of each enterprise are not consistent, the models in our paper are unbalanced panel data models. After removing the extreme values of the double tail 1 percent, there are 1524 observatory points on cross-sections. The descriptive results of variables are shown in Appendix B (Table A2).
Table A2 shows the basic financial performance of the energy-saving and environmental enterprises. The profitability variables indicate that the sample enterprises have obtained relatively high profits, while to judge their growth ability, we found the average growth rate of earnings per share is −59.09%, and the average growth rate of operating profit is 3.47%. These results show that the enterprises have difficulty in realizing sustainable development. To analyse the expectations for the sample enterprises, we used CAR (cumulative abnormal return) as the proxy variable. Since the actual date of loan issuing cannot be traced, we do not distinguish the pre-issuance and post issuance period, and take the whole trading year as the event window. Additionally, the normal return of the enterprise i is not based on its intrinsic value. In our study, the main purpose of calculating CAR is to evaluate the investors’ expectation of the enterprise with a green loan, rather than the investment return, thus, we used the market portfolio return to reveal the investors’ average expectations, and the exceeding amount of the market return (Ri,tRm,t) is considered as the investors’ expectation of enterprise i. The yearly CAR of each listed enterprise is calculated with the following equation:
C A R i = t = 1 n A R i , t = t = 1 n ( R i , t R m , t )
where, ARi,t is the abnormal return, and Ri,t is the daily stock return of enterprise i at time t. Rm,t is the market return at time t; here, we use the Shanghai (securities) composite index to calculate the market return. According to the efficient market theory, the stock return reveals all types of information about the enterprises; thus, a higher value of CAR stands for more optimistic expectations for the enterprise. Using Equation (11), we obtain the CAR of each sample enterprise, and the histogram of CAR is shown in Figure 3.
The average value of CAR is −0.03%. Meanwhile, we also found that many enterprises have negative values of CAR, therefore, we made a preliminary judgement that investors and market participants do not have optimistic expectations for energy-saving and environmental enterprises. Considering the previous analysis of the profitability and growth ability of these enterprises, we found that the financial performance and operational efficiency of the sample enterprises have not met public expectation.

5. Empirical Results Analysis

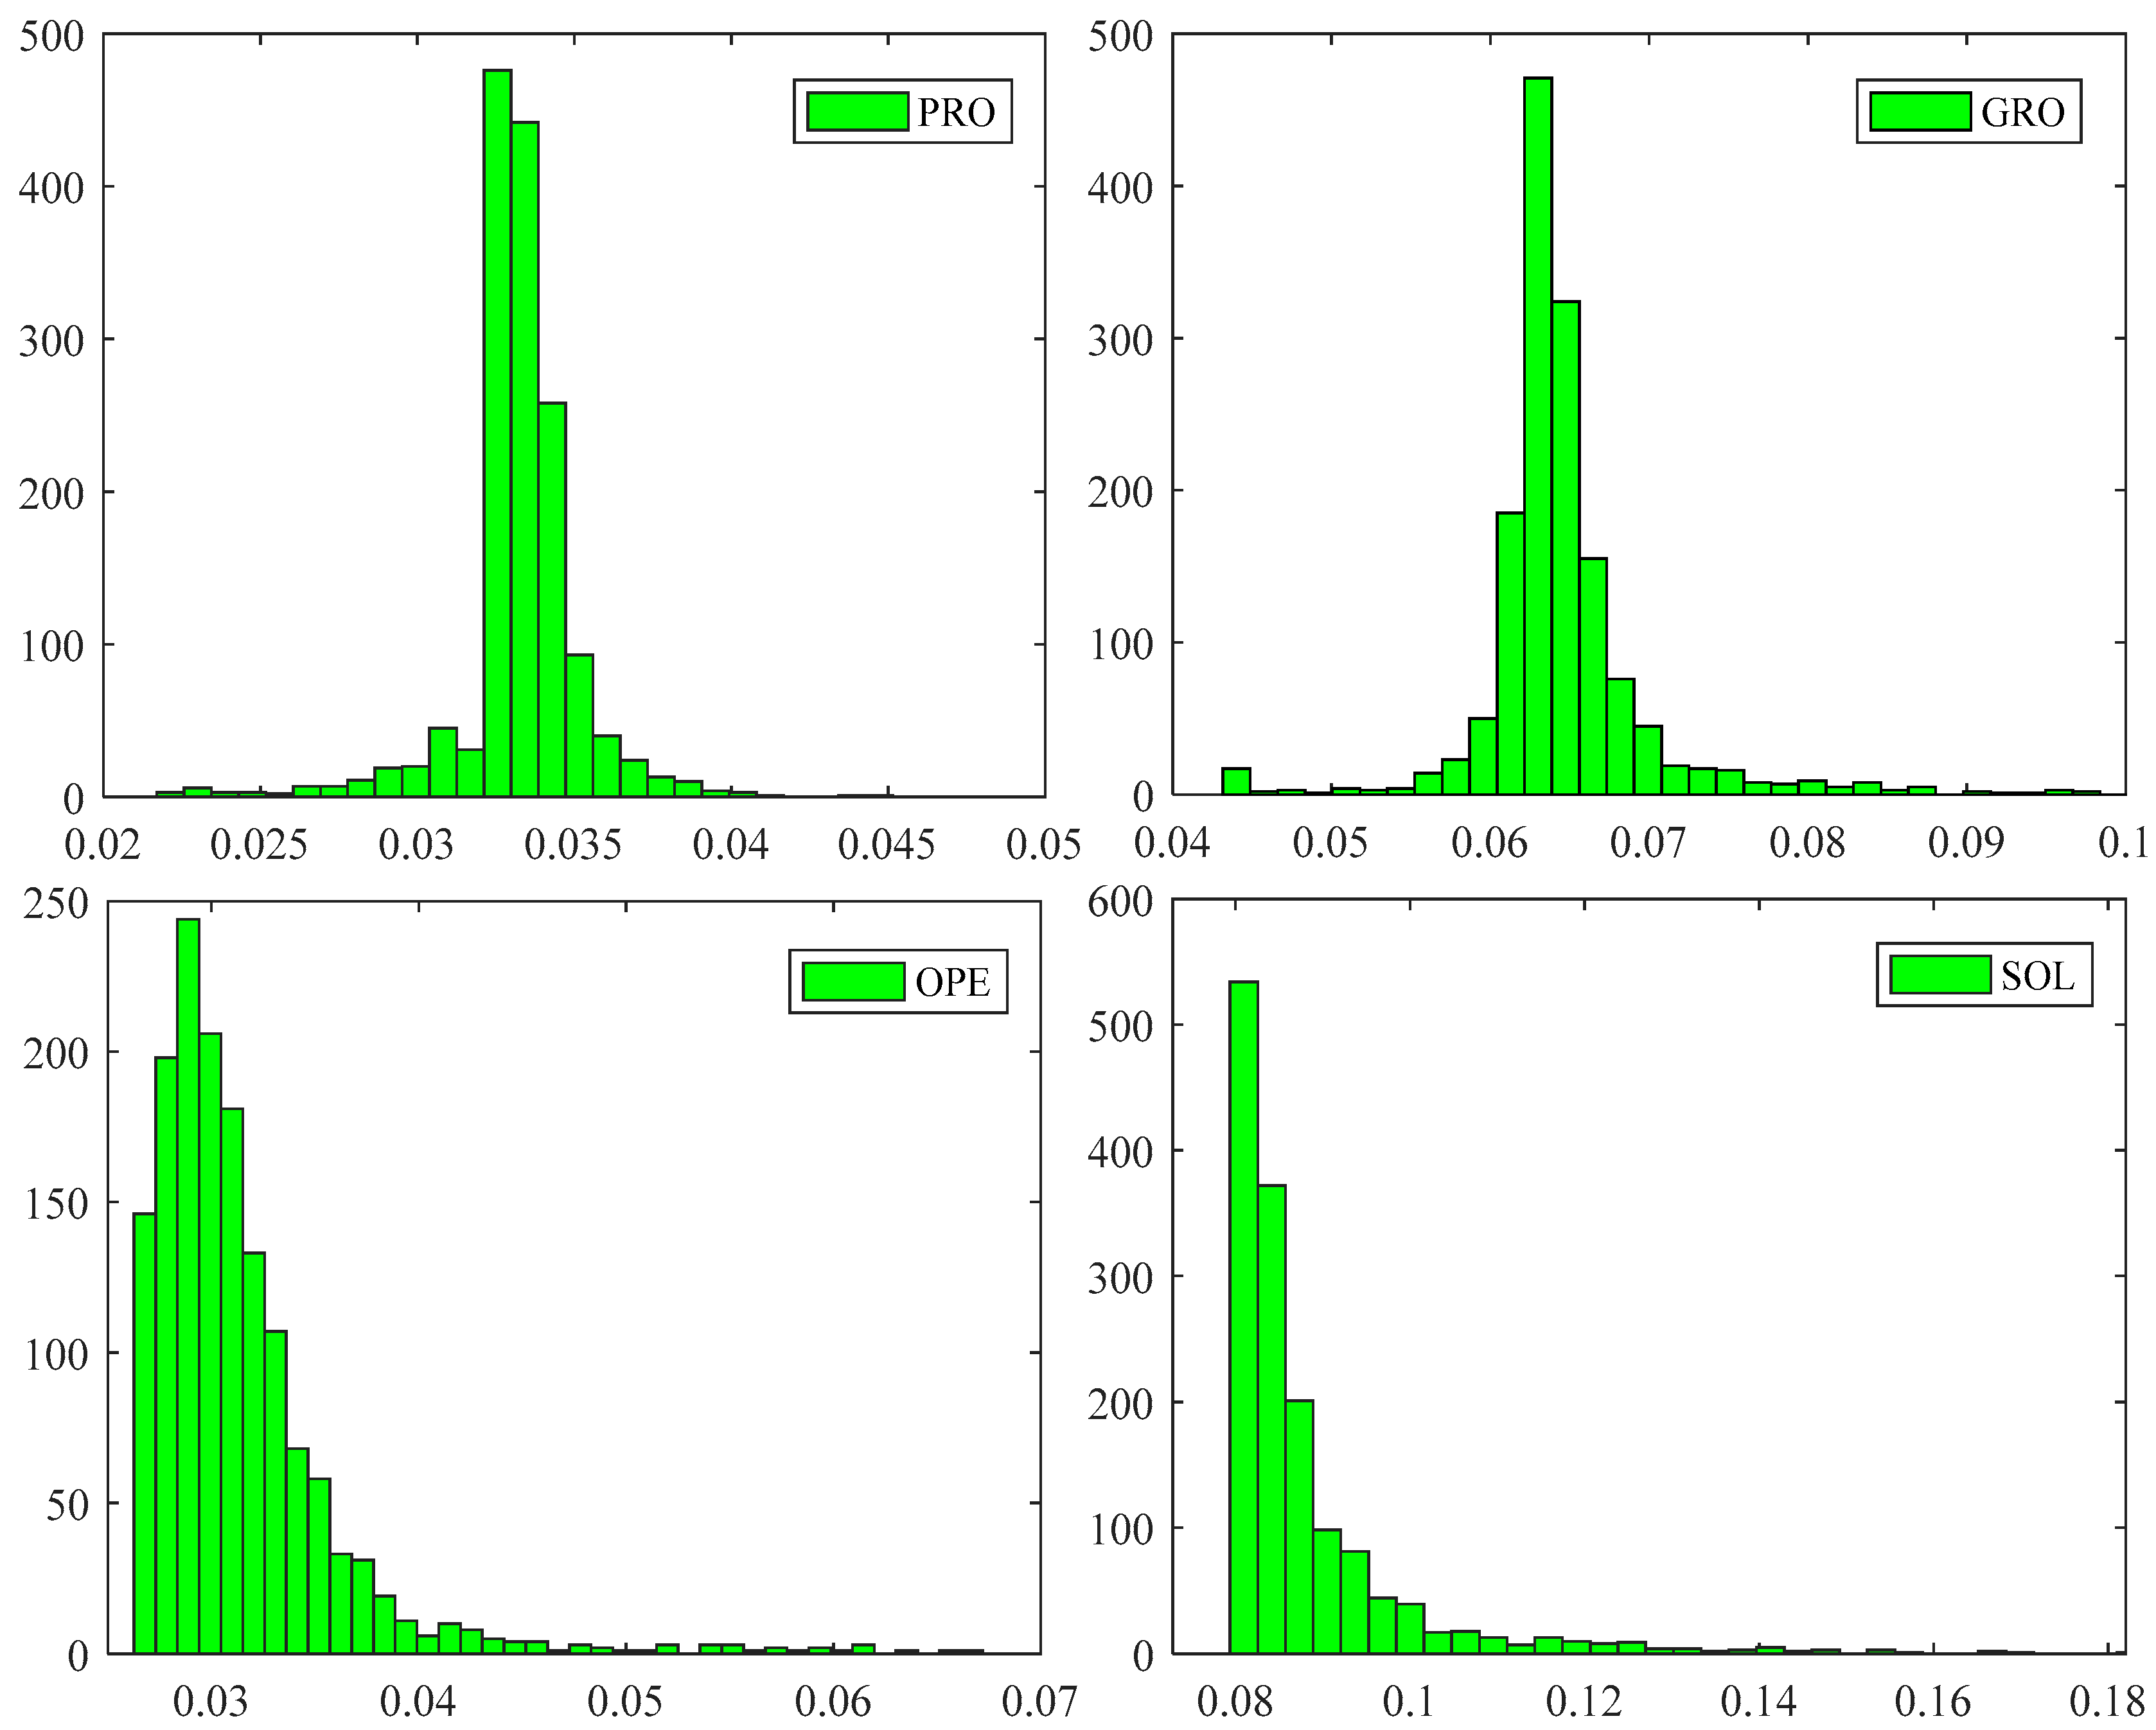
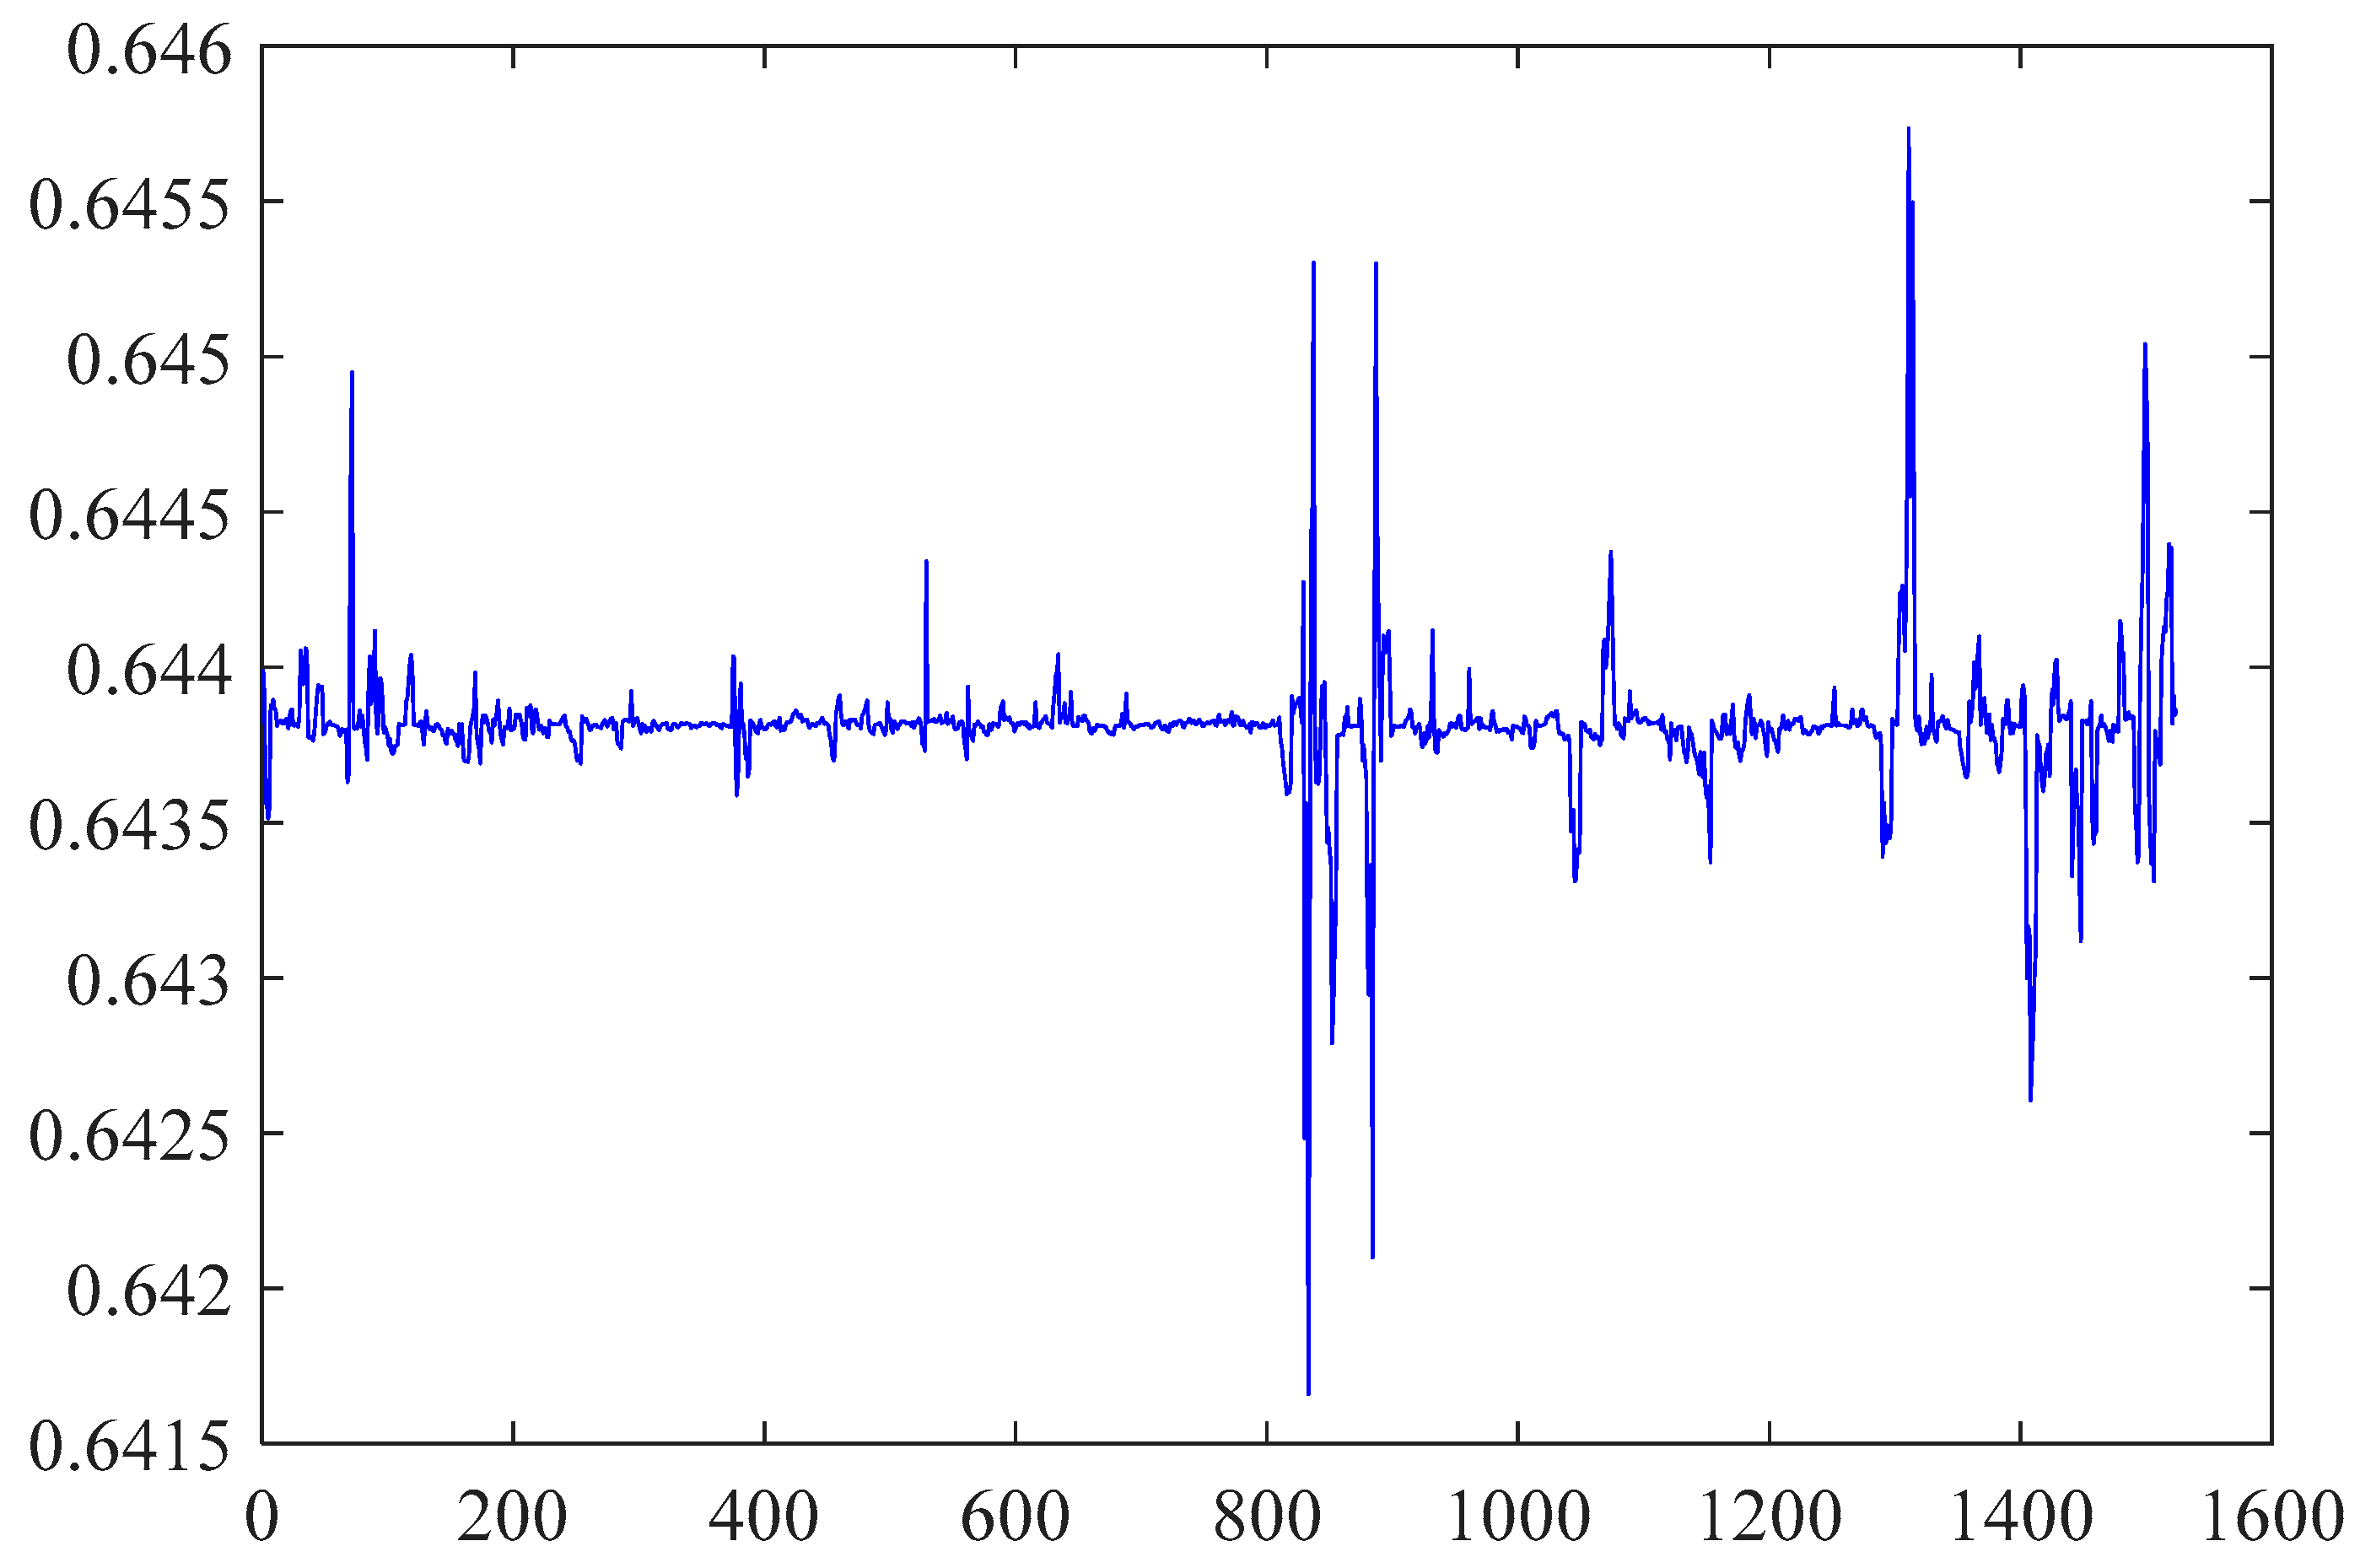
5.1. Evaluation Results of Financial Performance and Operational Efficiency

By using the grey correlation analysis described in Section 3.1, we calculated the comprehensive financial performance of energy-saving and environmental enterprises. The results are displayed in Table 1 and Figure 4 and Figure 5.
Table 1 shows descriptive statistics for financial performance. Figure 4 shows the financial performance of energy-saving and environmental enterprises. Figure 5 shows the comprehensive financial performance for the sample enterprises. The left part of Figure 5 is the financial performance of each sample enterprise, and the right part of Figure 5 is a histogram of financial performance. From the results, we found that the energy-saving and environmental enterprises have not realized their full potential, the average value of PER (finance performance) is 0.215, which is far from the maximum value of 1. The value of variables PRO (profitability), GRO (growth ability), OPE (operation ability) and SOL (solvency ability) also show that the financial performance is not good for those enterprises.
To evaluate the operational efficiency of the energy-saving and environmental enterprises, we used stochastic frontier analysis as described in Section 3.2. The input variables are total current assets (sasset), fixed assets (fiasset), number of total employees (noemp) and operating cost (opcost). The output of the production is the net profit (neprof) of the sample enterprises. Judging by the histogram in Figure 5, the inefficiency item is assumed to obey the half normal distribution and truncated normal distribution. We used the maximum likelihood to estimate the parameters of the SFA models. The results are illustrated in Table 2.
For a different assumption of inefficient items, the estimation results are quite similar, thus, it is appropriate to choose the SFA model with a half normal distribution or truncated normal distribution. We used the SFA model with truncated distribution, and the results are shown in Figure 6.
In Figure 6, we find that the value of operational efficiency of each enterprise is very close. The operational efficiency line fluctuates slightly around the average value of 0.6438, which is less than the optimal value of 1; the maximum and minimum value of operation efficiency is 0.6457 and 0.6417, respectively. From the above analysis, it is seen that the operational efficiency of energy-saving and environmental enterprises is relatively low. The sample enterprises do not efficiently allocate their resources during the operational process. Thus, questions arise: As an important type of resource, is the green loan used properly? Does it enhance financial performance? To answer these questions, we provide some empirical evidence in Section 5.2.

5.2. Specific Models and Hypotheses Tests

To test the hypotheses in Section 2, we used the dynamic panel data model (DPM) to examine the relationship among green loans, operational efficiency and financial performance. The first group of models was constructed to examine the overall effect of green loans on financial performance. The modes are set as follows (Models I–V):
P E R i , t = α 1 P E R i , t 1 + α 2 s l o a n t + α 3 l l o a n t + α 4 f i a s s e t t + α 5 s h a r a t i o t + α 6 O E t + ε 1
P R O i , t = β 1 P R O i , t 1 + β 2 s l o a n t + β 3 l l o a n t + β 4 f i a s s e t t + β 5 s h a r a t i o t + β 6 O E t + ε 2
G R O i , t = χ 1 G R O i , t 1 + χ 2 s l o a n t + χ 3 l l o a n t + χ 4 f i a s s e t t + χ 5 s h a r a t i o t + χ 6 O E t + ε 3
O P E i , t = δ 1 O P E i , t 1 + δ 2 s l o a n t + δ 3 l l o a n t + δ 4 f i a s s e t t + δ 5 s h a r a t i o t + δ 6 O E t + ε 4
S O L i , t = ϕ 1 S O L i , t 1 + ϕ 2 s l o a n t + ϕ 3 l l o a n t + ϕ 4 f i a s s e t t + ϕ 5 s h a r a t i o t + ϕ 6 O E t + ε 5
The definitions of the variables are explained in Table A1. Equations (12)–(16) represents Models I–V, respectively. The second order of error item has no autocorrelation (as shown in the following Table 3, Table 4, Table 5, Table 6, Table 7 and Table 8), thus we apply the difference GMM (generalized method of moments) method to estimate the parameters of the above models. The instrument variables are set as lagged variables of Yi,t, and the results are displayed in Table 3 and Table 4.
From Table 3 and Table 4, the p-values of α2 and α3 are 0.620 and 0.955, respectively. The results show that green loans (both short-term loans and long-term loans) do not significantly improve the financial performance of energy-saving and environmental enterprises. For the sub-indicators of financial performance, only the long-term loan (lloant) has a slight effect on profitability (β3 = 0.000, p-value = 0.003). Thus, hypothesis H2a is partly verified, and H2b is not supported by the empirical study results. In Model I–IV, the coefficients of OEt (operation efficiency) are all positive and significant, thus, we concluded that the operational efficiency has a positive impact on the financial performance of the sample companies, and that hypothesis H3 is supported by empirical evidence.
To examine the expectation channel hypothesis, we constructed Models VI and VII (Equations (17) and (18)). In addition, by using the difference GMM method, we obtained the results shown in Table 5.
C A R i , t = φ 1 C A R i , t 1 + φ 2 s l o a n t + φ 3 l l o a n t + φ 4 f i a s s e t t + φ 5 s h a r a t i o t + φ 6 O E t + φ 7 P E R t + ε 6
C A R i , t = γ 1 C A R i , t 1 + γ 2 s l o a n t + γ 3 l l o a n t + γ 4 f i a s s e t t + γ 5 s h a r a t i o t + γ 6 O E t + γ 7 P R O t + γ 8 G R O t + γ 9 O P E t + γ 10 S O L t + ε 7
According to Table 5, the coefficients of variables sloan(short-term loan) and lloan(long-term loan) are −0.002 and −0.001, respectively, and the corresponding p-values are 0.162 and 0.480; thus, the green loans do not have a significant influence on the CAR, and the expectations for the sample enterprises are not promoted by green loans. Therefore, the expectation channel hypothesis (H4) is not supported by the empirical evidence. From Table 5, we also found that the growth ability has a positive effect on the CAR, which represents the expectations for the enterprises.
Next, we used model VIII (Equation (19)) to verify the supervision channel hypothesis.
O E i , t = β 2 s l o a n t + β 3 l l o a n t + β 4 f i a s s e t t + β 5 s h a r a t i o t + β 6 O E t 1 + ε 8
The estimation method is the same as the above models. Judging from Table 6, a green loan significantly decreases the efficiency item. With an increase in the green loan (sloant and lloant), the operational efficiency (OEt−1) could drop. Thus, the results indicate that the supervision of green loans is not functional for the sample enterprises, and the supervision channel hypothesis (H5) is not verified. Meanwhile, green credit has not caused a significant effect on the enterprises’ operational efficiency; thus, H1a (H1b) is not verified either.
Models IX–XIII were constructed to examine the resource allocation hypothesis. The specific models are per Equations (20)–(24). The results are displayed in Table 7 and Table 8.
r e r s i , t = η 1 s l o a n t + η 2 l l o a n t + η 3 f i a s s e t t + η 4 s h a r a t i o t + ε 9
s c o s t i , t = κ 1 s c o s t i , t 1 + κ 2 s l o a n t + κ 3 l l o a n t + κ 4 f i a s s e t t + κ 5 s h a r a t i o t + ε 10
m a c o s t i , t = λ 1 m a c o s t i , t 1 + λ 2 s l o a n t + λ 3 l l o a n t + λ 4 f i a s s e t t + λ 5 s h a r a t i o t + ε 11
f i n c o s t i , t = μ 1 f i n c o s t i , t 1 + μ 2 s l o a n t + μ 3 l l o a n t + μ 4 f i a s s e t t + μ 5 s h a r a t i o t + ε 12
o p c o s t i , t = ν 1 o p c o s t i , t 1 + ν 2 s l o a n t + ν 3 l l o a n t + ν 4 f i a s s e t t + ν 5 s h a r a t i o t + ε 13
The results show that a long-term green loan (lloant) significantly increases the expenses for R&D (rerst), the management cost (macostt−1), financing cost (ficostt−1) and operating cost (opcost), while the short-term green loan (sloant) has a positive effect on the sales cost, financing cost and operational cost. Thus, H6 and H6a are partially supported by empirical evidence. With the issuance of a green loan, the capital is partly allocated to the research department, but the financial performance (PERt) and operational efficiency (OEt−1) of the energy-saving and environmental enterprise is not improved. We found that the influence of green loans on R&D (rerst) is rather small (η2 = 0.002), thus, product innovation or technical development may not be well supported. At the same time, the green loan significantly increases the operating cost (opcost). The monetary resources are mostly distributed to support the enterprise’s operations, and this corporate behaviour leads to increased cost, therefore, the green loan has not significantly improved the financial performance (PERt) and operational efficiency (OEt−1) of the energy-saving and environmental enterprises. From Table 7 and Table 8, we also found that the operating cost (opcost) does not decrease with the issuance of the green loan, and the results also reveal that the supervisory role of the green loan is not well performed. From the empirical results, we found that the green loan causes resources to be allocated to energy-saving and environmental enterprises. For these enterprises, there are benefits from government policies. Their development is mostly driven by this external support rather than the enhancement of their endogenous ability, and market incentives are not the primary influencing factor when financial institutions make their green credit decision. Meanwhile, the function of the green loan, such as supervision, is not well performed, thus, green credits have not improved the operational efficiency and financial performance of energy-saving and environmental enterprises.
According to the empirical study, we found that the supporting role of green credit on enterprises in the energy-saving and environmental sectors has not been fully realized. The hypotheses verification is listed in Table 9.
On the whole, hypotheses H2, H2a, H3, H6 and H6a are partly supported, while hypotheses H1, H1a, H1b, H2b, H4, H5 and H6b are not verified (as shown in Table 9). Green credit can enhance the short-term profitability of enterprises, but does not have a significant impact on the financial performance and operational efficiency of those enterprises. After the issuance of the green credit, enterprises can increase their input in operations and R&D, but their operational efficiency is not improved partially due to the supervisory role of green credit not being realized. Meanwhile, green credit does not improve the public expectations for environmental enterprises.

6. Policy Implications

Based on the above conclusions, we firmly believe that for better realizing the role of green credit, it is critical to establish countermeasures to spread green credit and strengthen the endogenous development ability of those enterprises. Specific suggestions are described as follows:
(1)
Establish effective measures to strengthen the supporting role of green credit. A green economy with low energy consumption, low emissions, and low pollution levels has become an inevitable trend of economic development. It is necessary to establish effective incentive and restraint mechanisms to promote the driving force for green credit implementation. First, commercial banks could develop attractive green loan products with favourable interest rates to reduce the operating cost for energy-saving and environmental corporations. For example, commercial banks could generalize the experience of the ICBC (Industrial and Commercial Bank of China), which gives preferential loans and subsidies to support the green economy. Second, punishments or restraints should also be executed for those enterprises that cause damage to the environment. To avoid the phenomenon of bad money driving out good money, it is necessary to revise the current law and to clearly define green credit participators' rights and responsibilities. Meanwhile, the capital market and other financial markets could add the condition of using the green loan efficiently when the enterprise issues new shares or bonds. By establishing incentive and restraint mechanisms, green credit could be used more widely, and the enterprise’s financial performance and operational efficiency could also be enhanced.
(2)
Increase the content of information disclosure and improve public expectations. First, the enterprises should conduct voluntary disclosure. They can report the environmental costs and social performance indicators, thus making the public aware of what and how the enterprises are doing. This type of information disclosure is helpful for improving the public expectations of those enterprises. Second, the State Environmental Protection Department and banking supervisory departments should provide regular monitoring results to the public; the authorities' information could also be helpful for improving public expectations towards green related industries. Third, the supervisory departments and other government departments should increase the channels for green and environmental enterprises to report their performance, thus attracting more attention from the public to those enterprises. With the enhancement of expectation levels, more financial support and social resources could be brought to those enterprises.
(3)
Place the role of supervision of green credit on enterprises’ internal governance and operations. First, enterprise managers are supposed to focus on debt risk management, reduce unnecessary costs and inhibit overinvestment. Second, the supervisory role of green credit could be realized by optimizing the credit business process. Commercial banks or independent third parties could audit the green credit business and evaluate the green credit risk more strictly, thus executing more pressure on the enterprise managers to improve operational efficiency and financial performance. Third, commercial banks should also be more concerned about post-loan management. They could require the enterprise to report more details about the usage of the green credit and financial performance. As soon as they find potential problems with poor operations or environmental risk, the banks could take some early-warning measures and supervise the enterprises in improving their operations.
(4)
Enhance the R&D ability and core competence of the energy-saving and environmental enterprises. To spread the benefits of green credit and play a supporting role in the use of green credit, it is essential to develop technology for energy savings and emissions reduction. Enterprises should promote scientific cooperation with universities, and they could also establish their own R&D institutions and absorb advanced technology to boost their capability for technological innovation. Enterprises should also make full use of the policies issued by the government. In recent years, the central government as well as local governments has promulgated a series of fiscal and tax policies to support green credits and enterprises related to environmental protection. To cultivate their endogenous development ability, enterprises should take advantage of those policies and obtain external support as much as possible.

7. Conclusions

The government and the public has realized the importance of green development, and more and more green credit has been allocated to energy-saving and environmental protection industries However, the question of whether green loans have promoted the financial performance and operational efficiency of those enterprises has not been fully answered. In this paper, we investigated the influence of green credit on the operational efficiency and financial performance of enterprises in the energy-saving and environmental sectors by using hybrid econometric models. Because the supervision channel, capital allocation channel and expectation channel of green credit are not well performed in China, the supporting role of green credit is not as significant as we would expect. We also provide some policy implications to spread the use of green credit and strengthen the positive effect of green credit on enterprises. The core countermeasure is focused on strengthening the endogenous development ability of those enterprises. Because the data about green credit is difficult to obtain from commercial banks, we used the data of listed enterprises as an alternative way to conduct the empirical study. The data limitations could impact the empirical results to some degree. Additionally, it is hard to track the use of each green loan; we considered only the amount of the loans to investigate their impact. As more financial institutions are engaged in green credit, future research could overcome the above two limitations, use more detailed data about green credit and apply a dynamic track method, such as grounded theory, to investigate the influence of green credit on energy-saving and environmental enterprises.

Acknowledgments

This work is supported by National Natural Science Foundation of China (Grant No. 71503078).

Author Contribution

Changqing Luo provides the main idea, designs the research and analyzes the empirical results. Siyuan Fan develops the hypothesis and conducts the empirical research. Qi Zhang reviews the literatures and undertakes the English corrections.

Conflicts of Interest

The authors declare no conflict of interest.

Appendix A

Table A1. Economic meanings of the variables.
SymbolsEconomic Meaning (Unit)Computation Method
pro1Net profit margin (%)(Net Income/operation income) × 100%
pro2Gross profit margin (%)(Gross profit/operation income) × 100%
pro3Return on assets (%)(Net income/average total assets) × 100%
pro4Return on equity (%)(Net income/shareholder equity) × 100%
pro5Earnings per share(Chinese Yuan)((Profit-preferred dividends)/weighted average common shares) × 100%
gro1Growth rate of earnings per share (%)((Earning per share at t + 1 year-Earning per share at t year)/Earning per share at t year) × 100%
gro2Growth rate of operating revenue (%)((Operating revenue at t + 1 year-operating revenue at t year)/operating revenue at t year) × 100%
gro3Growth rate of operating profit (%)((operating profit at t + 1 year-operating profit at t year)/operating profit at t year) × 100%
gro4Growth rate of total assets (%)((total assets at t + 1 year-total assets at t year)/total assets at t year) × 100%
gro5Growth rate of net assets (%)((total assets at t + 1 year-total assets at t year)/total assets at t year) × 100%
gro6Growth rate of per share cash flow from operations (%)((per share cash flow from operations at t + 1 year-per share cash flow from operations at t year)/per share cash flow from operations at t year) × 100%
ope1Operating cycleinventory turnover days + Receivables Turnover days
ope2Inventory turnover ratioSales cost/average inventory
ope3Receivables turnover ratio Net receivable sales/average net receivables
ope4Current assets turnover ratioOperating revenue/current assets
ope5Fixed assets turnover ratioOperating revenue/fixed assets
ope6Total assets turnover ratioOperating revenue/average total assets
sol1Current ratioCurrent assets/current liabilities
sol2Quick ratioLiquidity assets/current liabilities
sol3Conservative quick ratio(cash + short term security + notes receivable + net accounts receivable)/current liability
sol4Debt asset ratioTotal liabilities/total assets
sol5Equity ratioShareholders’ equity/total assets
opcostOperation costOperation cost/10 million Chinese Yuan
sloanShort term loanShort term loan/10 million Chinese Yuan
lloanLong term loanLong term loan/10 million Chinese Yuan
debtTotal debtTotal debt/10 million Chinese Yuan
rersExpenditure on research and developmentExpenditure on research and development/10 million Chinese Yuan
ronincR&D expense ratio (%)(Expenditure on R&D/Operation income) × 100%
equityTotal investors equityTotal investors equity/10 million Chinese Yuan
sharatioShareholding ratio of largest 10 major shareholders (%)(Share held by top 10 shareholder/Total shares) × 100%
neprofNet profit Net profit/10 million Chinese Yuan
opincoperating revenueoperating revenue/10 million Chinese Yuan
sassetTotal current assetsTotal current assets/10 million Chinese Yuan
fiassetFixed assetsFixed assets/10 million Chinese Yuan
scostSelling expensesSelling expenses/10 million Chinese Yuan
macostManaging costsManaging costs/10 million Chinese Yuan
ficostFinancing expensesFinancing expenses/10 million Chinese Yuan
noempNumber of total employeesNumber of total employees/10 thousands

Appendix B

Table A2. Descriptive analysis results of the variables.
VariableMeanS.DMinMaxVariableMeanS.DMinMax
pro16.5416.15−100.00100.00sol31.181.090.105.68
pro221.6812.05−15.0055.00sol40.030.020.010.20
pro35.576.14−20.2831.62sol51.581.760.1210.00
pro46.2014.92−109.00114.00opcost78.41346.80−5.326563.00
pro50.310.48−1.351.87sloan11.3633.920.00498.80
gro1−59.09467.40−3001.001000.00lloan16.4284.310.001456.00
gro217.1735.81−79.09300.38debt76.46228.590.003007.00
gro33.47191.34−574.38700.58rers1.913.340.0083.71
gro417.2124.15−72.89103.42roninc7.050.007.057.05
gro515.8435.38−123.00155.51equity45.69126.75−27.252109.00
gro656.79367.84−1500.001600.00sharatio56.1417.230.0094.44
ope10.010.010.000.08neprof4.7325.03−59.87400.70
ope27.078.090.4351.41opinc81.59356.840.016614.00
ope317.5636.020.30209.52sasset50.75164.040.002699.00
ope41.461.050.306.73fiasset41.26131.330.001955.00
ope53.724.270.2023.18scost3.0520.150.00400.70
ope60.640.410.102.40macost4.0013.600.07242.80
sol11.741.440.117.83ficost1.595.65−4.7788.88
sol21.341.190.156.27noemp0.531.340.0019.60

References

  1. Abdel Aleem, Shady H. E., Ahmed F. Zobaa, and Hala M. Abdel Mageed. 2015. Assessment of energy credits for the enhancement of the Egyptian Green Pyramid Rating System. Energy Policy 87: 407–16. [Google Scholar] [CrossRef]
  2. Bajo, Emanuele, Thomas J. Chemmanur, Karen Simonyan, and Hassan Tehranian. 2016. Underwriter networks, investor attention, and initial public offerings. Journal of Financial Economics 122: 376–408. [Google Scholar] [CrossRef]
  3. Barry, Christopher B., and Vassil T. Mihov. 2015. Debt financing, venture capital, and the performance of initial public offerings. Journal of Banking & Finance 58: 144–65. [Google Scholar]
  4. Cairns, Robert D., and Pierre Lasserre. 2006. Implementing carbon credits for forests based on green accounting. Ecological Economics 56: 610–21. [Google Scholar] [CrossRef]
  5. Campello, Murillo. 2006. Debt financing: Does it boost or hurt firm performance in product markets? Journal of Financial Economics 82: 135–72. [Google Scholar] [CrossRef]
  6. Carraro, Carlo, Alice Favero, and Emanuele Massetti. 2012. Investments and public finance in a green, low carbon, economy. Energy Economics 34: S15–S28. [Google Scholar] [CrossRef]
  7. Chang, T. C., and S. J. Lin. 1999. Grey relation analysis of carbon dioxide emissions from industrial production and energy uses in Taiwan. Journal of Environmental Management 56: 247–57. [Google Scholar] [CrossRef]
  8. Chava, Sudheer, and Amiyatosh Purnanandam. 2011. The effect of banking crisis on bank-dependent borrowers. Journal of Financial Economics 99: 116–35. [Google Scholar] [CrossRef]
  9. Chen, Shu-Heng, and Chia-Hsuan Yeh. 1997. Toward a computable approach to the efficient market hypothesis: An application of genetic programming. Journal of Economic Dynamics and Control 21: 1043–63. [Google Scholar] [CrossRef]
  10. Criscuolo, Chiara, and Carlo Menon. 2015. Environmental policies and risk finance in the green sector: Cross-country evidence. Energy Policy 83: 38–56. [Google Scholar] [CrossRef]
  11. Davydov, Denis. 2016. Debt structure and corporate performance in emerging markets. Research in International Business and Finance 38: 299–311. [Google Scholar] [CrossRef]
  12. Dobre, Elena, Georgiana Oana Stanila, and Laura Brad. 2015. The Influence of Environmental and Social Performance on Financial Performance: Evidence from Romania’s Listed Entities. Sustainability 7: 2513–53. [Google Scholar] [CrossRef]
  13. Eisenbach, Sebastian, Dirk Schiereck, Julian Trillig, and Paschen Flotow. 2014. Sustainable Project Finance, the Adoption of the Equator Principles and Shareholder Value Effects. Business Strategy and the Environment 23: 375–94. [Google Scholar] [CrossRef]
  14. Fama, Eugene F. 1970. Efficient capital markets: A review of the theory and empirical work. The Journal of Finance 25: 383–417. [Google Scholar] [CrossRef]
  15. Fama, Eugene F., and Kenneth R. French. 1988. Permanent and temporary components of stock prices. Journal of Political Economy 96: 246–73. [Google Scholar] [CrossRef]
  16. Gao, Lei, and Bin Mei. 2013. Investor attention and abnormal performance of timberland investments in the United States. Forest Policy and Economics 28: 60–65. [Google Scholar] [CrossRef]
  17. Gul, Ferdinand A., and Judy S. L. Tsui. 1997. A test of the free cash flow and debt monitoring hypotheses: Evidence from audit pricing. Journal of Accounting and Economics 24: 219–37. [Google Scholar] [CrossRef]
  18. House of Commons Environmental Audit Committee. 2015. Green Finance: Twelfth Report of Session 2013–2014. Available online: http://www.parliament.uk/business/committees/committees-a-z/commons-select/environmental-audit-committee/publications/?type=&session=1&sort=false&inquiry=all (accessed on 23 February 2017).
  19. Jandik, Tomas, and Anil K. Makhija. 2005. Debt, debtstructure and corporate performance after unsuccessful takeovers: Evidence from targets that remain independent. Journal of Corporate Finance 11: 882–914. [Google Scholar] [CrossRef]
  20. Jia, Xiaoliang, Haizhong An, Wei Fang, Xiaoqi Sun, and Xuan Huang. 2015. How do correlations of crude oil prices co-move? A grey correlation-based wavelet perspective. Energy Economics 49: 588–98. [Google Scholar] [CrossRef]
  21. Jin, Suk Ho, Suk Jae Jeong, and Kyung Sup Kim. 2017. A Linkage Model of Supply Chain Operation and Financial Performance for Economic Sustainability of Firm. Sustainability 9: 139. [Google Scholar] [CrossRef]
  22. Kellogg, David, and John M. Charnes. 2000. Real-options valuation for a biotechnology company. Financial Analysts Journal 56: 76–84. [Google Scholar] [CrossRef]
  23. Kocmanová, Alena, Marie Pavláková Dočekalová, Stanislav Škapa, and Lenka Smolíková. 2016. Measuring Corporate Sustainability and Environmental, Social, and Corporate Governance Value Added. Sustainability 8: 945. [Google Scholar] [CrossRef]
  24. Kot, Hung Wan, and Lewis H. K. Tam. 2016. Are stock price more informative after dual-listing in emerging markets? Evidence from Hong Kong-listed Chinese companies. Pacific-Basin Finance Journal 36: 31–45. [Google Scholar] [CrossRef]
  25. Lee, Chien-Chiang, Jun-De Lee, and Chi-Chuan Lee. 2010. Stock prices and the efficient market hypothesis: Evidence from a panel stationary test with structural breaks. Japan and the World Economy 22: 49–58. [Google Scholar] [CrossRef]
  26. Lewis, Craig M., Richard J. Rogalski, and James K. Seward. 2001. The long-run performance of firms that issue convertible debt: An empirical analysis of operating characteristics and analyst forecasts. Journal of Corporate Finance 7: 447–74. [Google Scholar] [CrossRef]
  27. Li, Wenjing, and Xiaoyan Lu. 2015. Does institutional investor care firm environmental performance? Evidence from the most polluting Chinese listed firms. Journal of Financial Research 38: 97–112. [Google Scholar]
  28. Linnenluecke, Martina K., Tom Smith, and Brent McKnight. 2016. Environmental finance: A research agenda for interdisciplinary finance research. Economic Modelling 59: 124–30. [Google Scholar] [CrossRef]
  29. Liu, Jing-Yu, Yan Xia, Ying Fan, Shih-Mo Lin, and Jie Wu. 2015. Assessment of a green credit policy aimed at energy-intensive industries in China based on a financial CGE model. Journal of Cleaner Production 163: 293–302. [Google Scholar] [CrossRef]
  30. Liu, J. J., Jie Fu, and Dan-NingJi. 2017. Political connection, debt maturity and corporate investment efficiency. Modern Finance and Economics-Journal of Tianjin University of Finance and Economics 37: 90–103. [Google Scholar]
  31. Luo, Changqing, and Zisheng Ouyang. 2014. Estimating IPO Pricing Efficiency by Bayesian Stochastic Frontier Analysis: The ChiNext Market Case. Economic Modelling 40: 152–57. [Google Scholar] [CrossRef]
  32. Milionis, Alexandros E. 2007. Efficient capital markets: A statistical definition and comments. Statistics & Probability Letters 77: 607–13. [Google Scholar]
  33. Modigliani, Franco, and Merton H. Miller. 1958. The cost of capital, corporation finance and the theory of investment. The American Economic Review 48: 261–97. [Google Scholar]
  34. Ng, Thiam Hee, and Jacqueline Yujia Tao. 2016. Bond financing for renewable energy in Asia. Energy Policy 95: 509–17. [Google Scholar] [CrossRef]
  35. Park, Cheol. 2000. Monitoring and structure of debt contracts. The Journal of Finance 55: 2157–95. [Google Scholar] [CrossRef]
  36. Park, Kwangmin, and Soo Cheong (Shawn) Jang. 2013. Capital structure, free cash flow, diversification and firm performance: A holistic analysis. International Journal of Hospitality Management 33: 51–63. [Google Scholar] [CrossRef]
  37. Shen, Kao-Yi. 2017. Compromise between Short- and Long-Term Financial Sustainability: A Hybrid Model for Supporting R&D Decisions. Sustainability 9: 375. [Google Scholar] [CrossRef]
  38. Steffen, Will, Paul J. Crutzen, and John R. McNeill Ambio. 2007. The Anthropocene: Are humans now overwhelming the great forces of nature. AMBIO 36: 614–21. [Google Scholar] [CrossRef]
  39. Tamanini, Jeremy. 2017. The Global Green Economy Index (GGEI) 2016. Available online: http://dualcitizeninc.com/GGEI-2016.pdf (accessed on 25 May 2017).
  40. Urquhart, Andrew, and Frank McGroarty. 2016. Are stock markets really efficient? Evidence of the adaptive market hypothesis. International Review of Financial Analysis 47: 39–49. [Google Scholar] [CrossRef]
  41. Wang, Yao, and Qiang Zhi. 2016. The Role of Green Finance in Environmental Protection: Two Aspects of Market Mechanism and Policies. Energy Procedia 104: 311–16. [Google Scholar] [CrossRef]
  42. Wörsdörfer, Manuel. 2015. Equator Principles: Bridging the Gap between Economics and Ethics? Business and Society Review 120: 205–43. [Google Scholar] [CrossRef]
  43. Xu, Xiang-Yi, and Xin Li. 2008. Free cash flow, debt financing and corporate over-investment: An empirical research of Chinese listed companies. Soft Science 22: 124–27, 139. [Google Scholar]
  44. Zhang, Bing, Yan Yang, and Jun Bi. 2011. Tracking the implementation of green credit policy in China: Top-down perspective and bottom-up reform. Journal of Environmental Management 92: 1321–27. [Google Scholar] [CrossRef] [PubMed]
  45. Zhuang, Xiaoyang, Yu Wei, and Feng Ma. 2015. Multifractality, efficiency analysis of Chinese stock market and its cross-correlation with WTI crude oil price. Physica A Statistical Mechanics & Its Applications 430: 101–13. [Google Scholar]
Figure 1. Theoretical hypotheses.
Ijfs 05 00027 g001
Figure 2. Construction of hybrid econometric models.
Ijfs 05 00027 g002
Figure 3. Histogram of CAR.
Ijfs 05 00027 g003
Figure 4. Financial performance of energy-saving and environmental enterprises (sub-indicators).
Ijfs 05 00027 g004
Figure 5. Financial performance of energy-saving and environmental enterprises.
Ijfs 05 00027 g005
Figure 6. Operational efficiency of energy-saving and environmental enterprises (OE).
Ijfs 05 00027 g006
Table 1. Descriptive analysis result of financial performance.
VariableObsMeanStd. Dev.MinMax
PRO15240.0330.0020.0220.065
GRO15240.0660.0120.0430.129
OPE15240.0320.0070.0260.079
SOL15240.0910.0230.0790.238
PER15240.2150.0490.2000.601
Note: PRO, GRO, OPE, SOL and PER stand for the profitability, growth ability, operation ability and solvency ability of the energy-saving and environmental enterprises, respectively. PER is the overall finance performance indicator.
Table 2. Parameter estimation of stochastic frontier analysis.
VariablesCoef.Std. Err.zp > |z|[95% Conf. Interval]
Half normal modelsasset0.0260.0046.820.000[0.018, 0.033]
fiasset0.0240.00211.40.000[0.020, 0.028]
noemp−1.9840.236−8.390.000[−2.447, −1.521]
opcost0.0550.00229.980.000[0.051, 0.058]
Truncated normalsasset0.0260.0046.820.000[0.051, 0.058]
fiasset0.0240.00211.400.000[0.020, 0.028]
noemp−1.9840.236−8.390.000[−2.447, −1.521]
opcost0.0550.00229.980.000[0.051, 0.058]
Table 3. Influence of green credit on financial performance (based on DPD models).
VariablesModel IModel II(a)Model II(b)
Coef.Z (p > |z|)Coef.Z (p > |z|)Coef.Z (p > |z|)
PERt−10.4569.36(0.000)////
sloant−0.000−0.50(0.620)0.0000.20(0.839)//
lloant−0.000−0.06(0.955)0.0003.00(0.003)0.0003.28(0.001)
fiassett−0.000−0.49(0.621)−0.000−2.52(0.012)−0.000−4.40(0.000)
sharatiot0.0001.30(0.194)0.0002.04(0.041)0.0002.07(0.039)
OEt1.2150.14(0.005)3.4996.64(0.000)3.2616.75(0.000)
PROt−1//0.2172.39(0.017)0.2232.32(0.02)
constant0.0550.70(0.431)0.1902.42(0.015)0.1862.66(0.008)
AR(1)/−1.82(0.067)/−2.161(0.031)/−2.17(0.029)
AR(2)/1.31(0.189)/1.64(0.104)/1.63(0.103)
Sargon test/28.27(0.397)/13.23(0.430)/12.37(0.495)
Note: Model II(b) is the final model after the stepwise regression for Model II(a). The Sargon test does not reject the hypothesis that the instrument is valid.
Table 4. Influence of green credit on financial performance (based on DPD models).
VariablesModel IIIModel IVModel V
Coef.Z (p > |z|)Coef.Z (p > |z|)Coef.Z (p > |z|)
sloant−0.000−0.26(0.792)0.0001.41(0.158)−0.000−0.94(0.345)
lloant0.0000.18(0.856)−0.000−0.74(0.458)−0.000−0.36(0.719)
fiassett0.0000.72(0.469)0.0000.52(0.604)−0.000−0.61(0.541)
sharatiot0.0000.90(0.369)−0.000−0.86(0.388)0.0001.58(0.113)
OEt1.7750.51(0.003)0.5170.65(0.004)1.2960.38(0.004)
GROt−0.099−1.47(0.141)////
OPEt//0.6248.17(0.000)//
SOLt////0.53511.49(0.000)
constant0.0610.65(0.518)0.0430.91(0.363)−0.003−0.10(0.923)
AR(1)/−4.35(0.000)/−2.09(0.036)/−2.44(0.015)
AR(2)/−0.14(0.660)/−0.82(0.407)/1.68(0.092)
Sargon test/28.41(0.390)/26.40(0.496)/29.13(0.355)
Note: The Sargon test does not reject the hypothesis that the instrument is valid.
Table 5. Influence of green credit on market expectations (based on DPD models).
VariablesModelVIModel VII(a)Model VII(b)
Coef.Z (p > |z|)Coef.Z (p > |z|)Coef.Z (p > |z|)
CARt−1−0.128−4.03(0.000)−0.127−3.99(0.000)−0.118−3.75(0.000)
sloant−0.002−1.40(0.162)−0.002−1.39(0.165)//
lloant−0.0010.71(0.480)−0.0010.56(0.572)//
pert0.3820.64(0.525)////
fiassett−0.000−0.17(0.868)−0.000−0.23(0.818)//
sharatiot−0.003−1.38(0.168)−0.003−1.27(0.203)//
OEt89.3970.70(0.485)77.4370.59(0.556)//
PROt//0.1630.02(0.987)//
GROt//1.1592.32(0.020)1.1722.42(0.015)
OPEt//−14.424−0.85(0.393)/
SOLt//−0.740−0.50(0.617)//
constant−6.796−2.25(0.025)2.6986.25(0.804)0.1101.20(0.231)
AR(1) −2.13(0.033) −4.58(0.000) −4.63(0.000)
AR(2) −1.08(0.280) 1.02(0.308) −0.91(0.363)
Sargon test 26.23(0.506) 29.45(0.339) 28.97(0.362)
Note: Model VII(b) is the final model after the stepwise regression for Model VII(a). The Sargon test does not reject the hypothesis that the instrument is valid.
Table 6. Influence of green credit on operational efficiency (based on DPD models).
VariablesModel VIII(a)Model VIII(b)
Coef.Z (p > |z|)Coef.Z (p > |z|)
sloant−0.0008.51(0.000)−0.0008.55(0.000)
lloant−0.0003.45(0.001)−0.0003.51(0.000)
fiassett0.000−2.81(0.005)0.000−2.79(0.005)
sharatiot−0.0000.15(0.879)//
OEt−10.2732.38(0.017)0.2652.35(0.019)
constant0.0713.38(0.001)0.0723.35(0.001)
AR(1) 0.73(0.465) 0.73(0.466)
AR(2) −1.21(0.226) −1.21(0.227)
Sargon test 35.29(0.132) 35.33(0.131)
Note: Model VIII(b) is the final model after the stepwise regression for Model VIII(a). The Sargon test does not reject the hypothesis that the instrument is valid.
Table 7. Test results for the influence channel (Model IX).
sloantlloantfiassettsharatiotConstantAR(1)AR(2)Sargon Test
Model IX(a)−0.002(0.69)0.002(0.00)0.007(0.00)0.007(0.21)1.341(0.01)−4.58(0.00)1.02(0.308)35.28(0.132)
Model IX(b)/0.002 (0.00)0.008(0.00)/−1.963(0.43)−1.19(0.23)−0.98(0.32)37.25(0.091)
Note: Model IX(b) is the final model after the stepwise regression for Model IX(a). The Sargon test does not reject the hypothesis that the instrument is valid.
Table 8. Test results for the influence channel (Models X–XIII).
Model X(a)Model X(b)Model XI(a)Model XI(b)Model XIIModel XIII(a)Model XIII(b)
sloant0.023(0.088)0.023(0.082)−0.007(0.435)/0.006(0.008)1.363(0.000)1.268(0.000)
lloant0.001(0.919)/−0.017(0.012)−0.018(0.009)0.008(0.081)0.578(0.000)0.517(0.000)
fiassett0.015(0.005)2.84(0.005)0.042(0.000)0.041(0.000)0.025(0.000)−0.064(0.268)/
sharatiot−0.014(0.424)/−0.008(0.500)/0.025(0.000)−0.012(0.954)/
scostt−10.879(0.000)0.879(0.000) // /
macostt−1 0.823(0.000)0.823(0.000)/ /
ficostt−1 /0.260(0.000) /
opcost //0.939(0.000)0.936(0.000)
constant0.248(0.751)−0.193(0.430)−0.225(0.573)−0.149(0.774)−0.365(0.285)−8.243(0.042)−6.796(0.025)
AR(1)−1.18(0.235)−1.19(0.236)−0.523(0.601)−0.682(0.547)−1.097(0.273)−2.146(0.032)−2.132(0.033)
AR(2)−0.99(0.324)−0.99(0.324)−1.028(0.304)−1.029(0.304)−0.808(0.419)−1.081(0.279)−1.081(0.279)
Sargon test28.79(0.496)28.98(0.362)29.50(0.337)27.75(0.424)38.08(0.077)27.44(0.440)27.58( 0.433)
Note: Models X(b), XI(b) and XIII(b) are the final models after the stepwise regression for Models X(a), XI(a) and XIII(a). The Sargon test does not reject the hypothesis that the instrument is valid.
Table 9. Hypotheses verification.
HypothesisConclusion
H1a: Green credits can increase the enterprises’ operational efficiency.Not verified
H1b: Green credits can decrease the enterprises’ operational efficiency.Not verified
H2a: Green credits can increase the enterprises’ financial performance.Partly supported
H2b: Green credits can decrease the enterprises’ financial performance.Not verified
H3: A higher operational efficiency leads to a higher financial performance.Partly supported
H4: The impact of green credit is realized by the expectation channel.Not verified
H5: The impact of green credit is realized by the supervision channel.Not verified
H6: The impact of green credit is realized by the capital allocation channel.Partly supported
H6a: Increased R&D and other expenditure promote the enterprise performance.Partly supported
H6b: Increased R&D and other expenditure decrease the enterprise performance.Not verified

