Survey of the Current Activities in the Field of Modeling the Space Debris Environment at TU Braunschweig

Abstract
:
1. Introduction
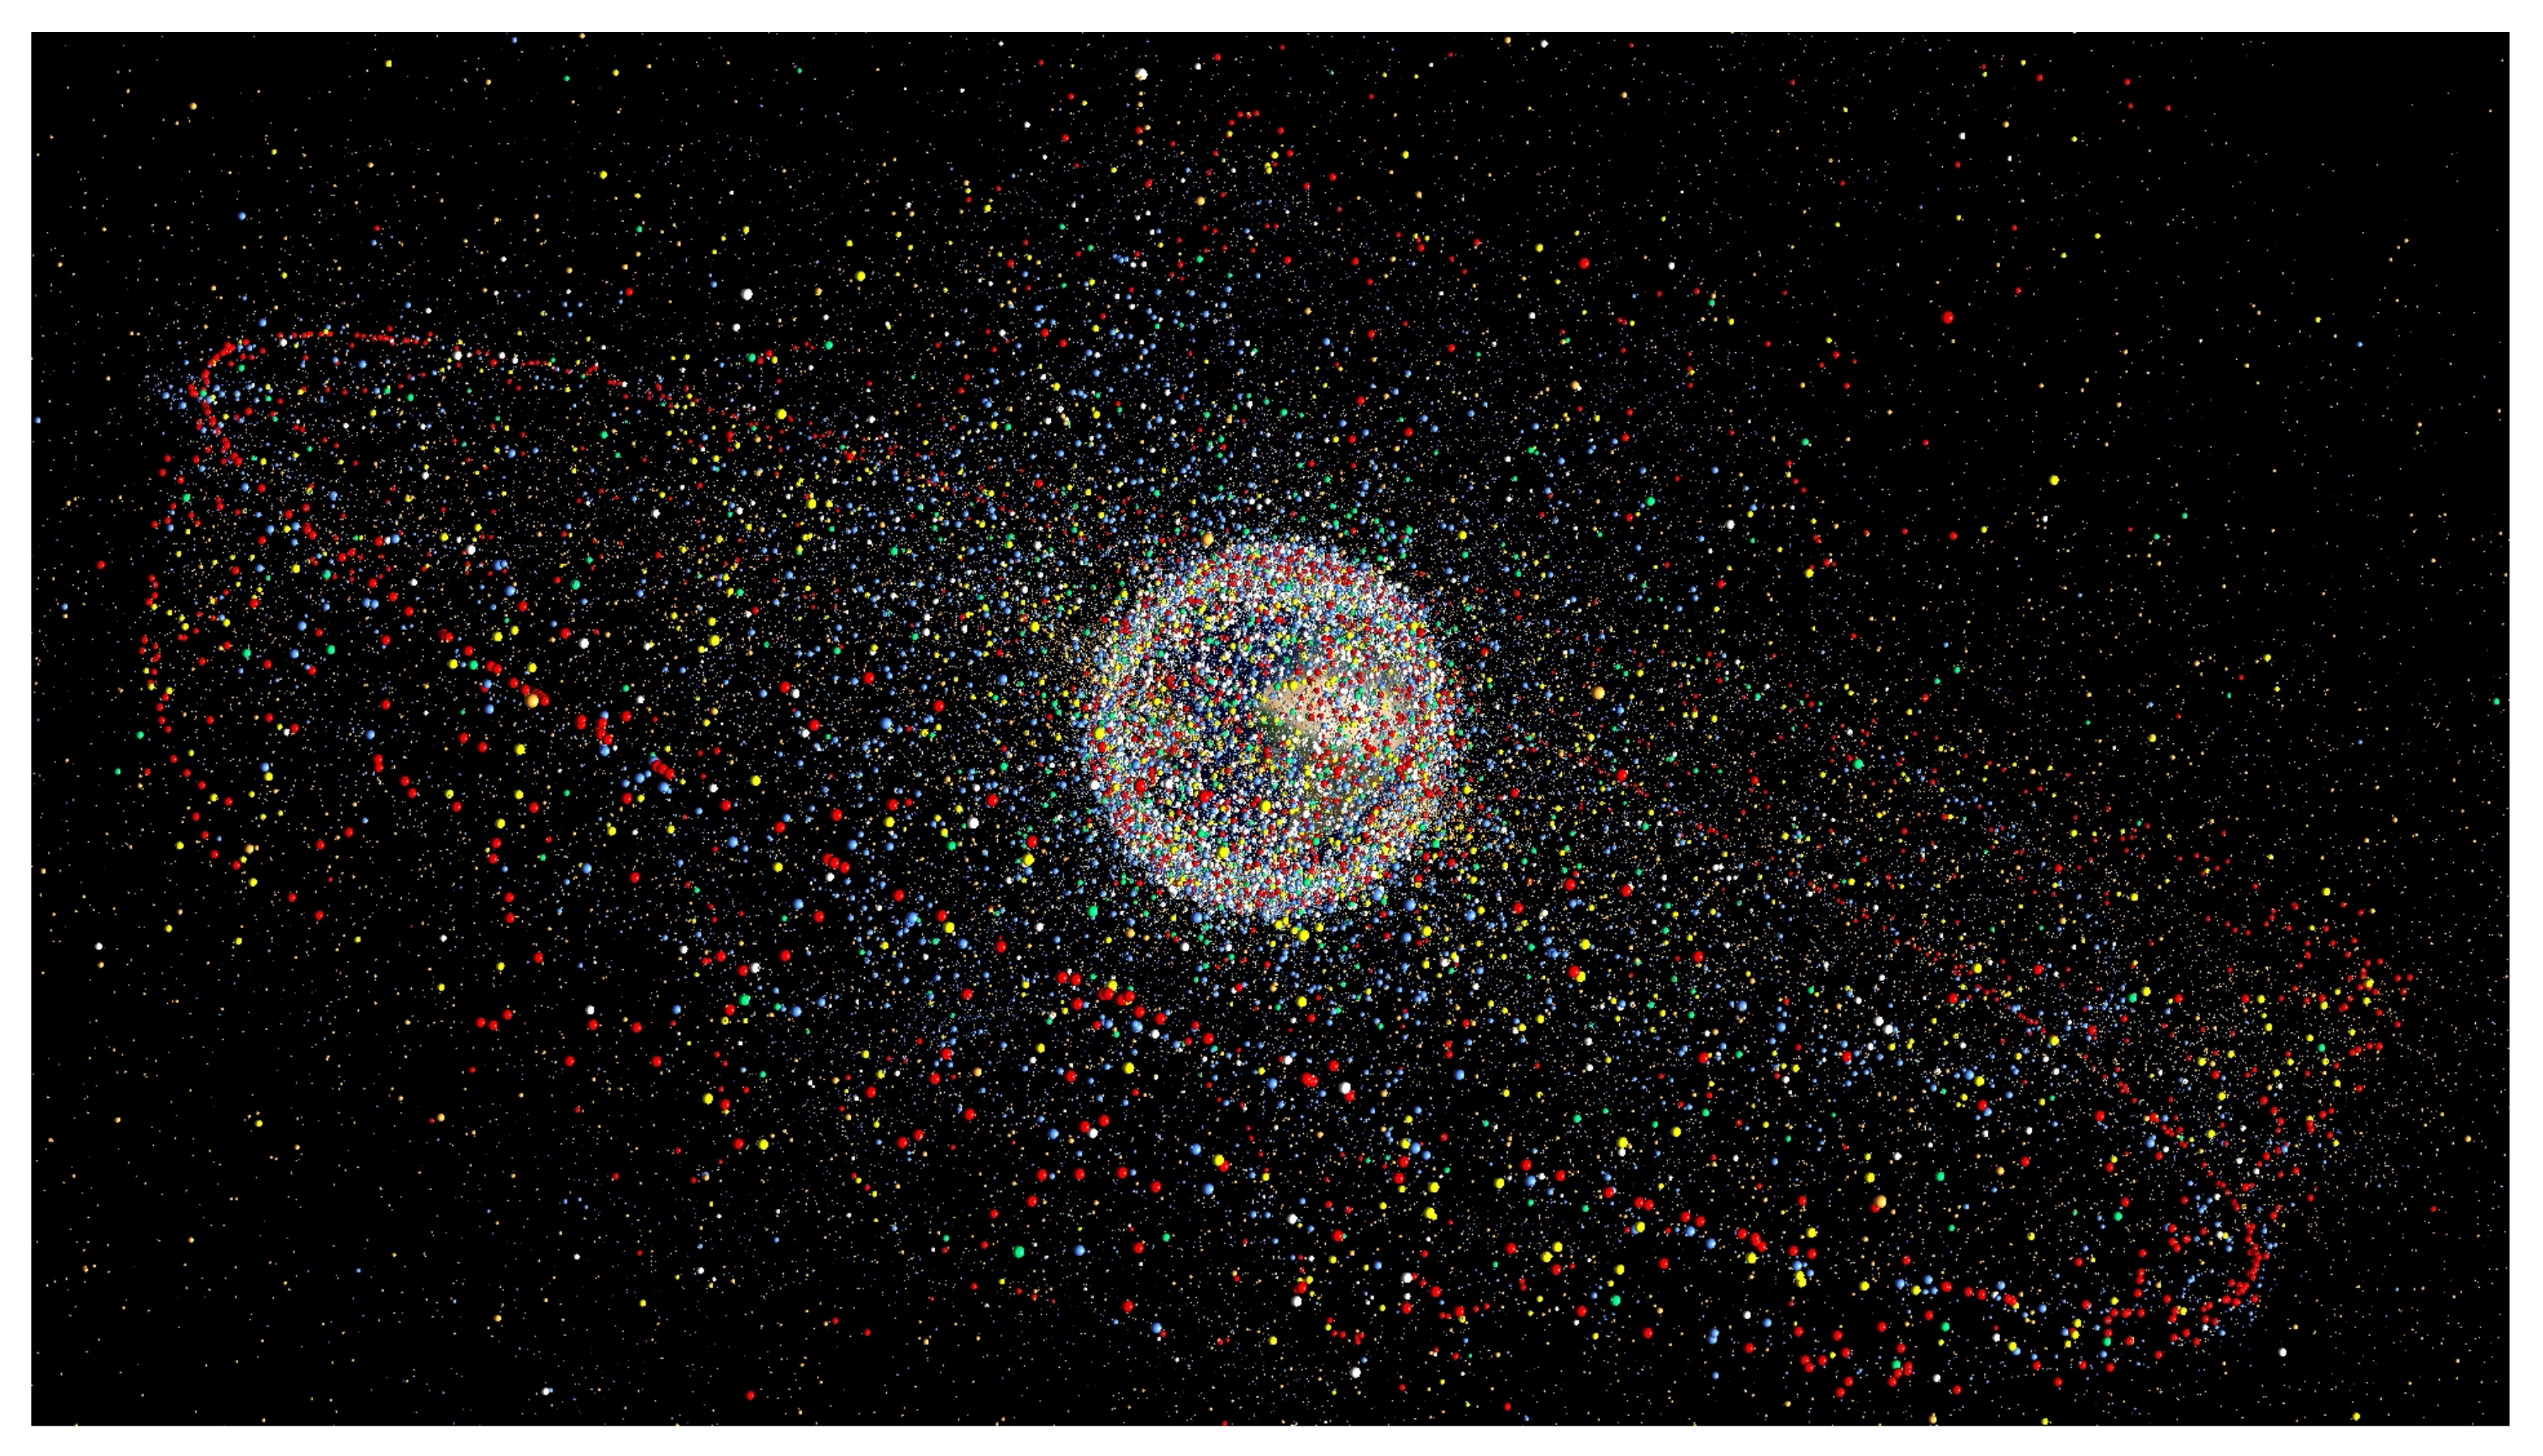
2. Fragmentation Events
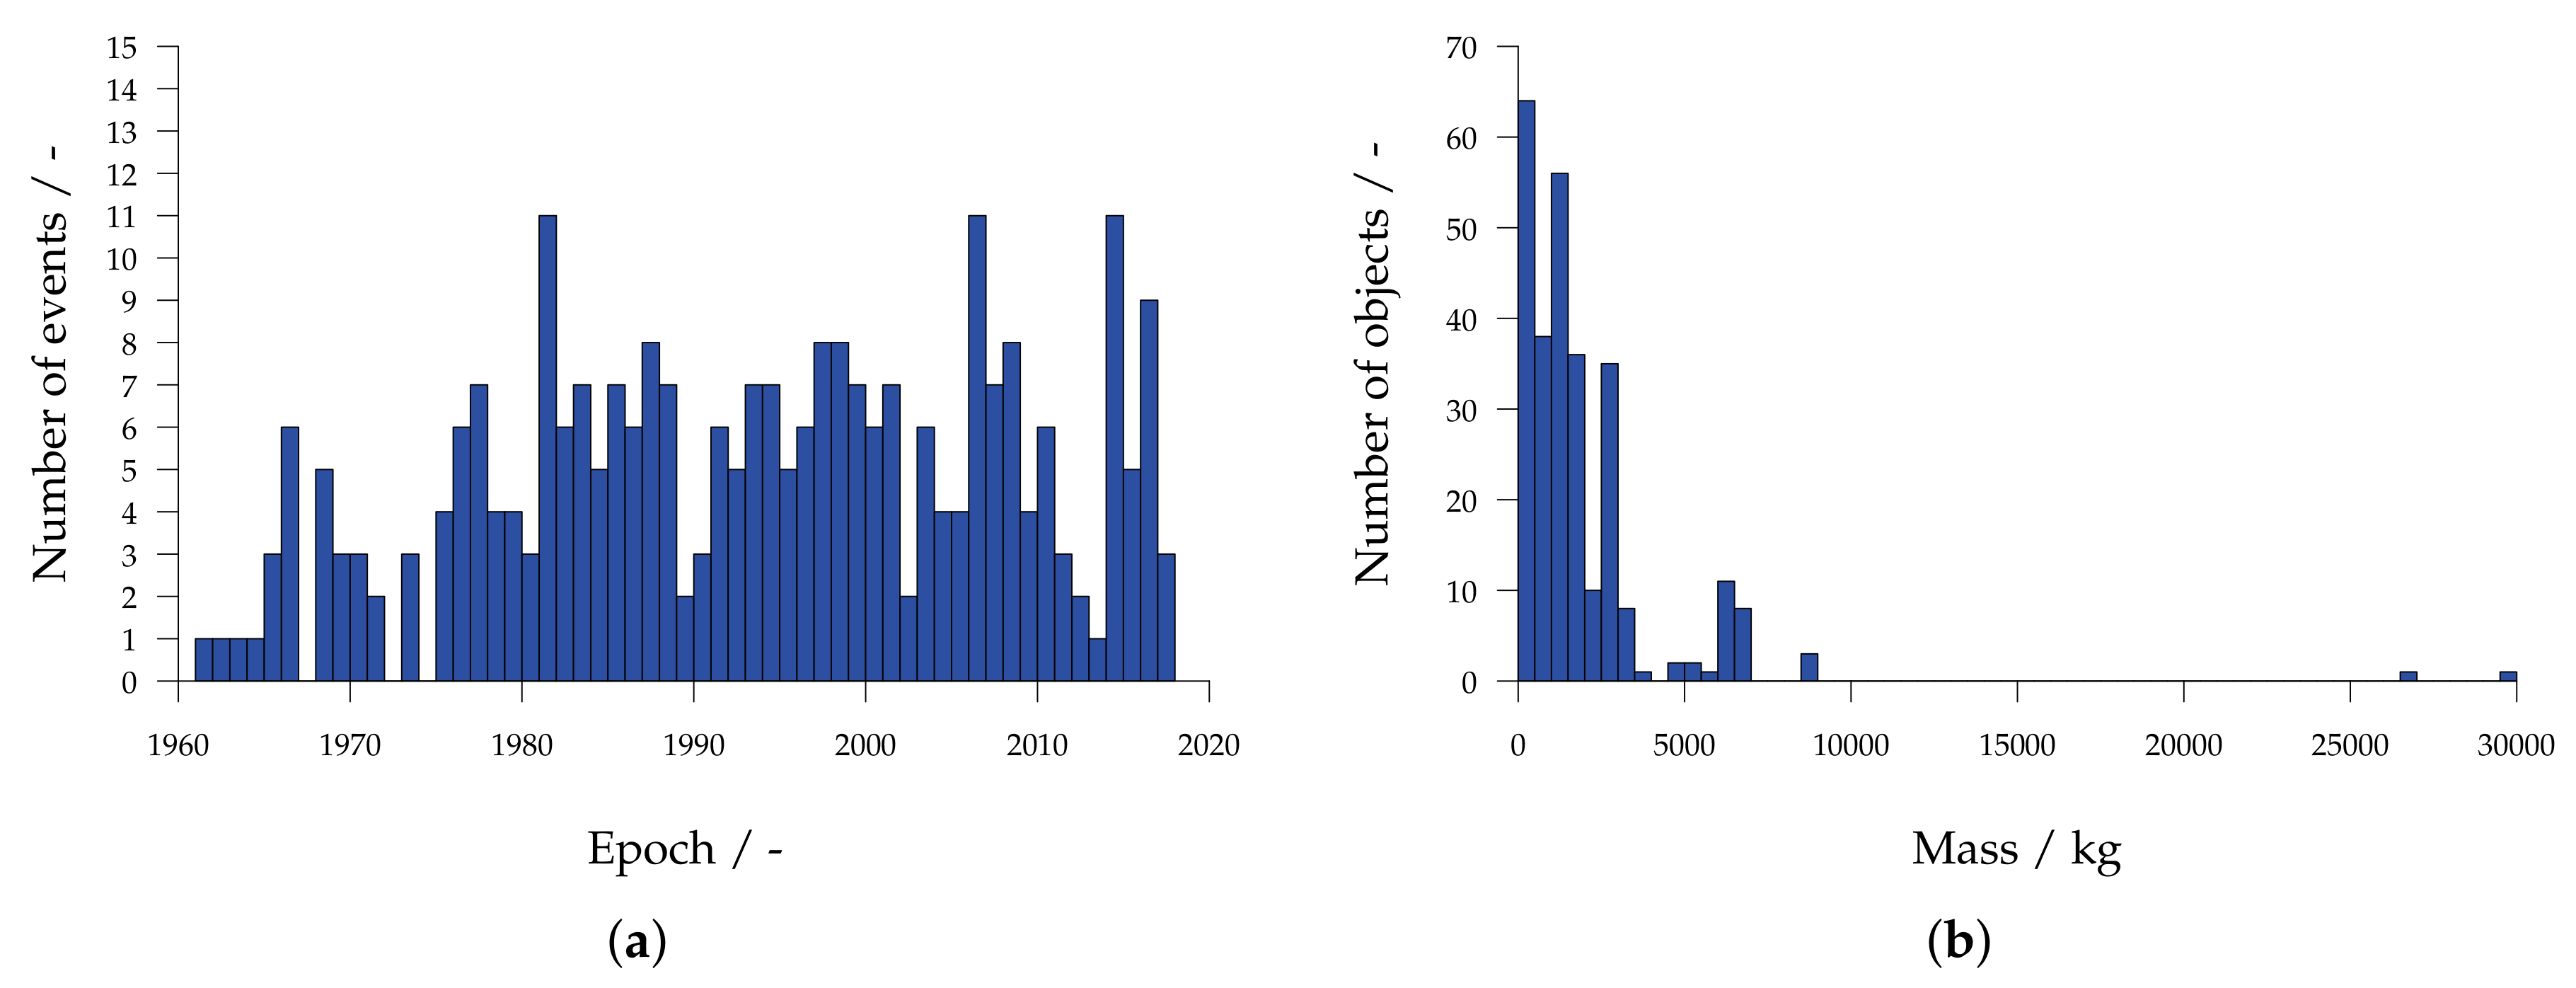
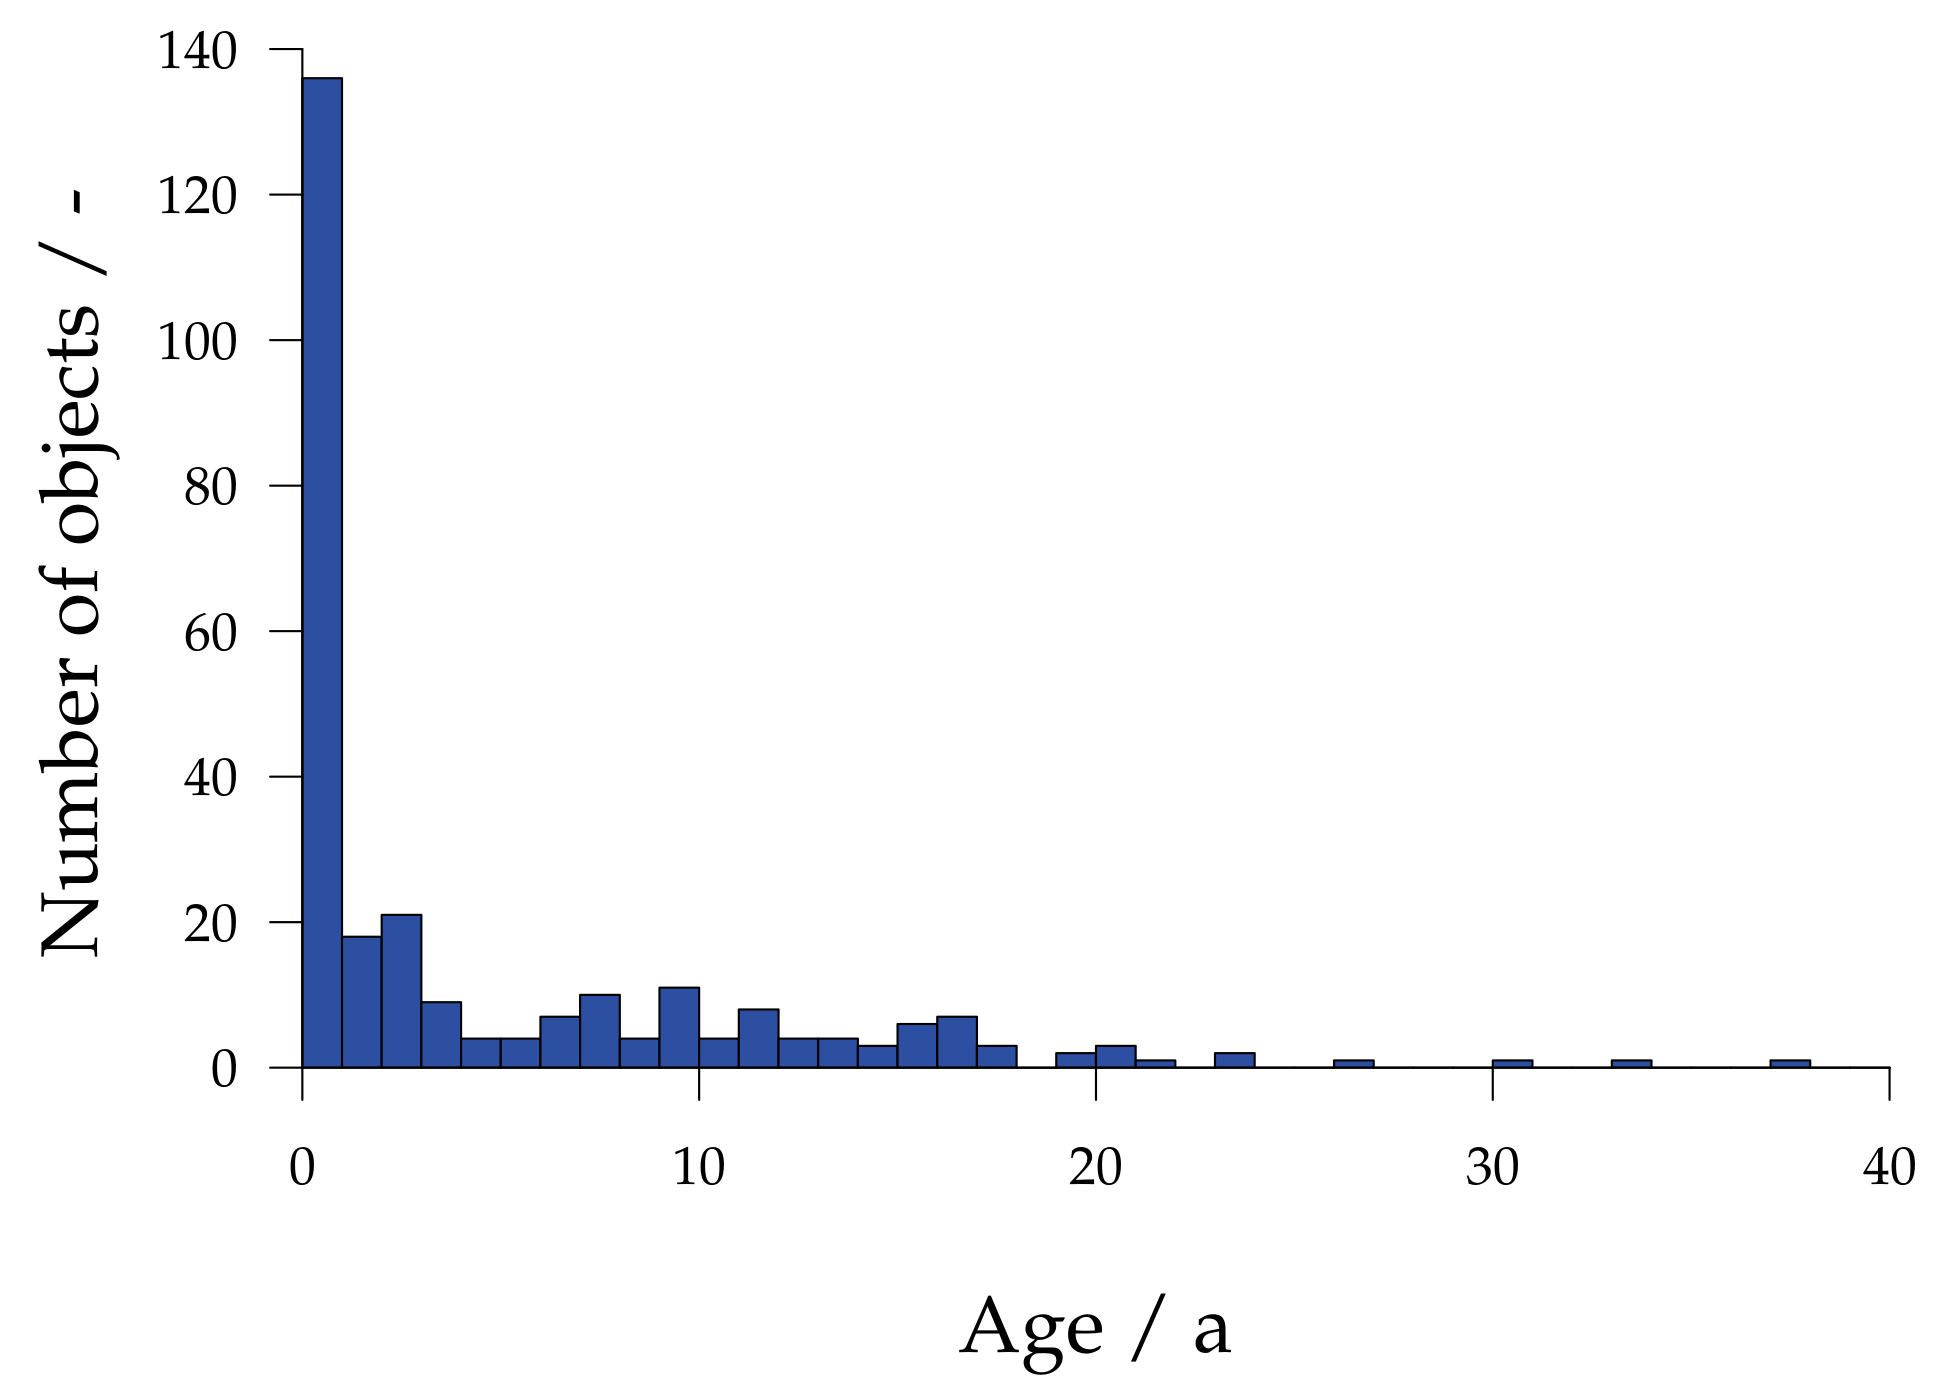
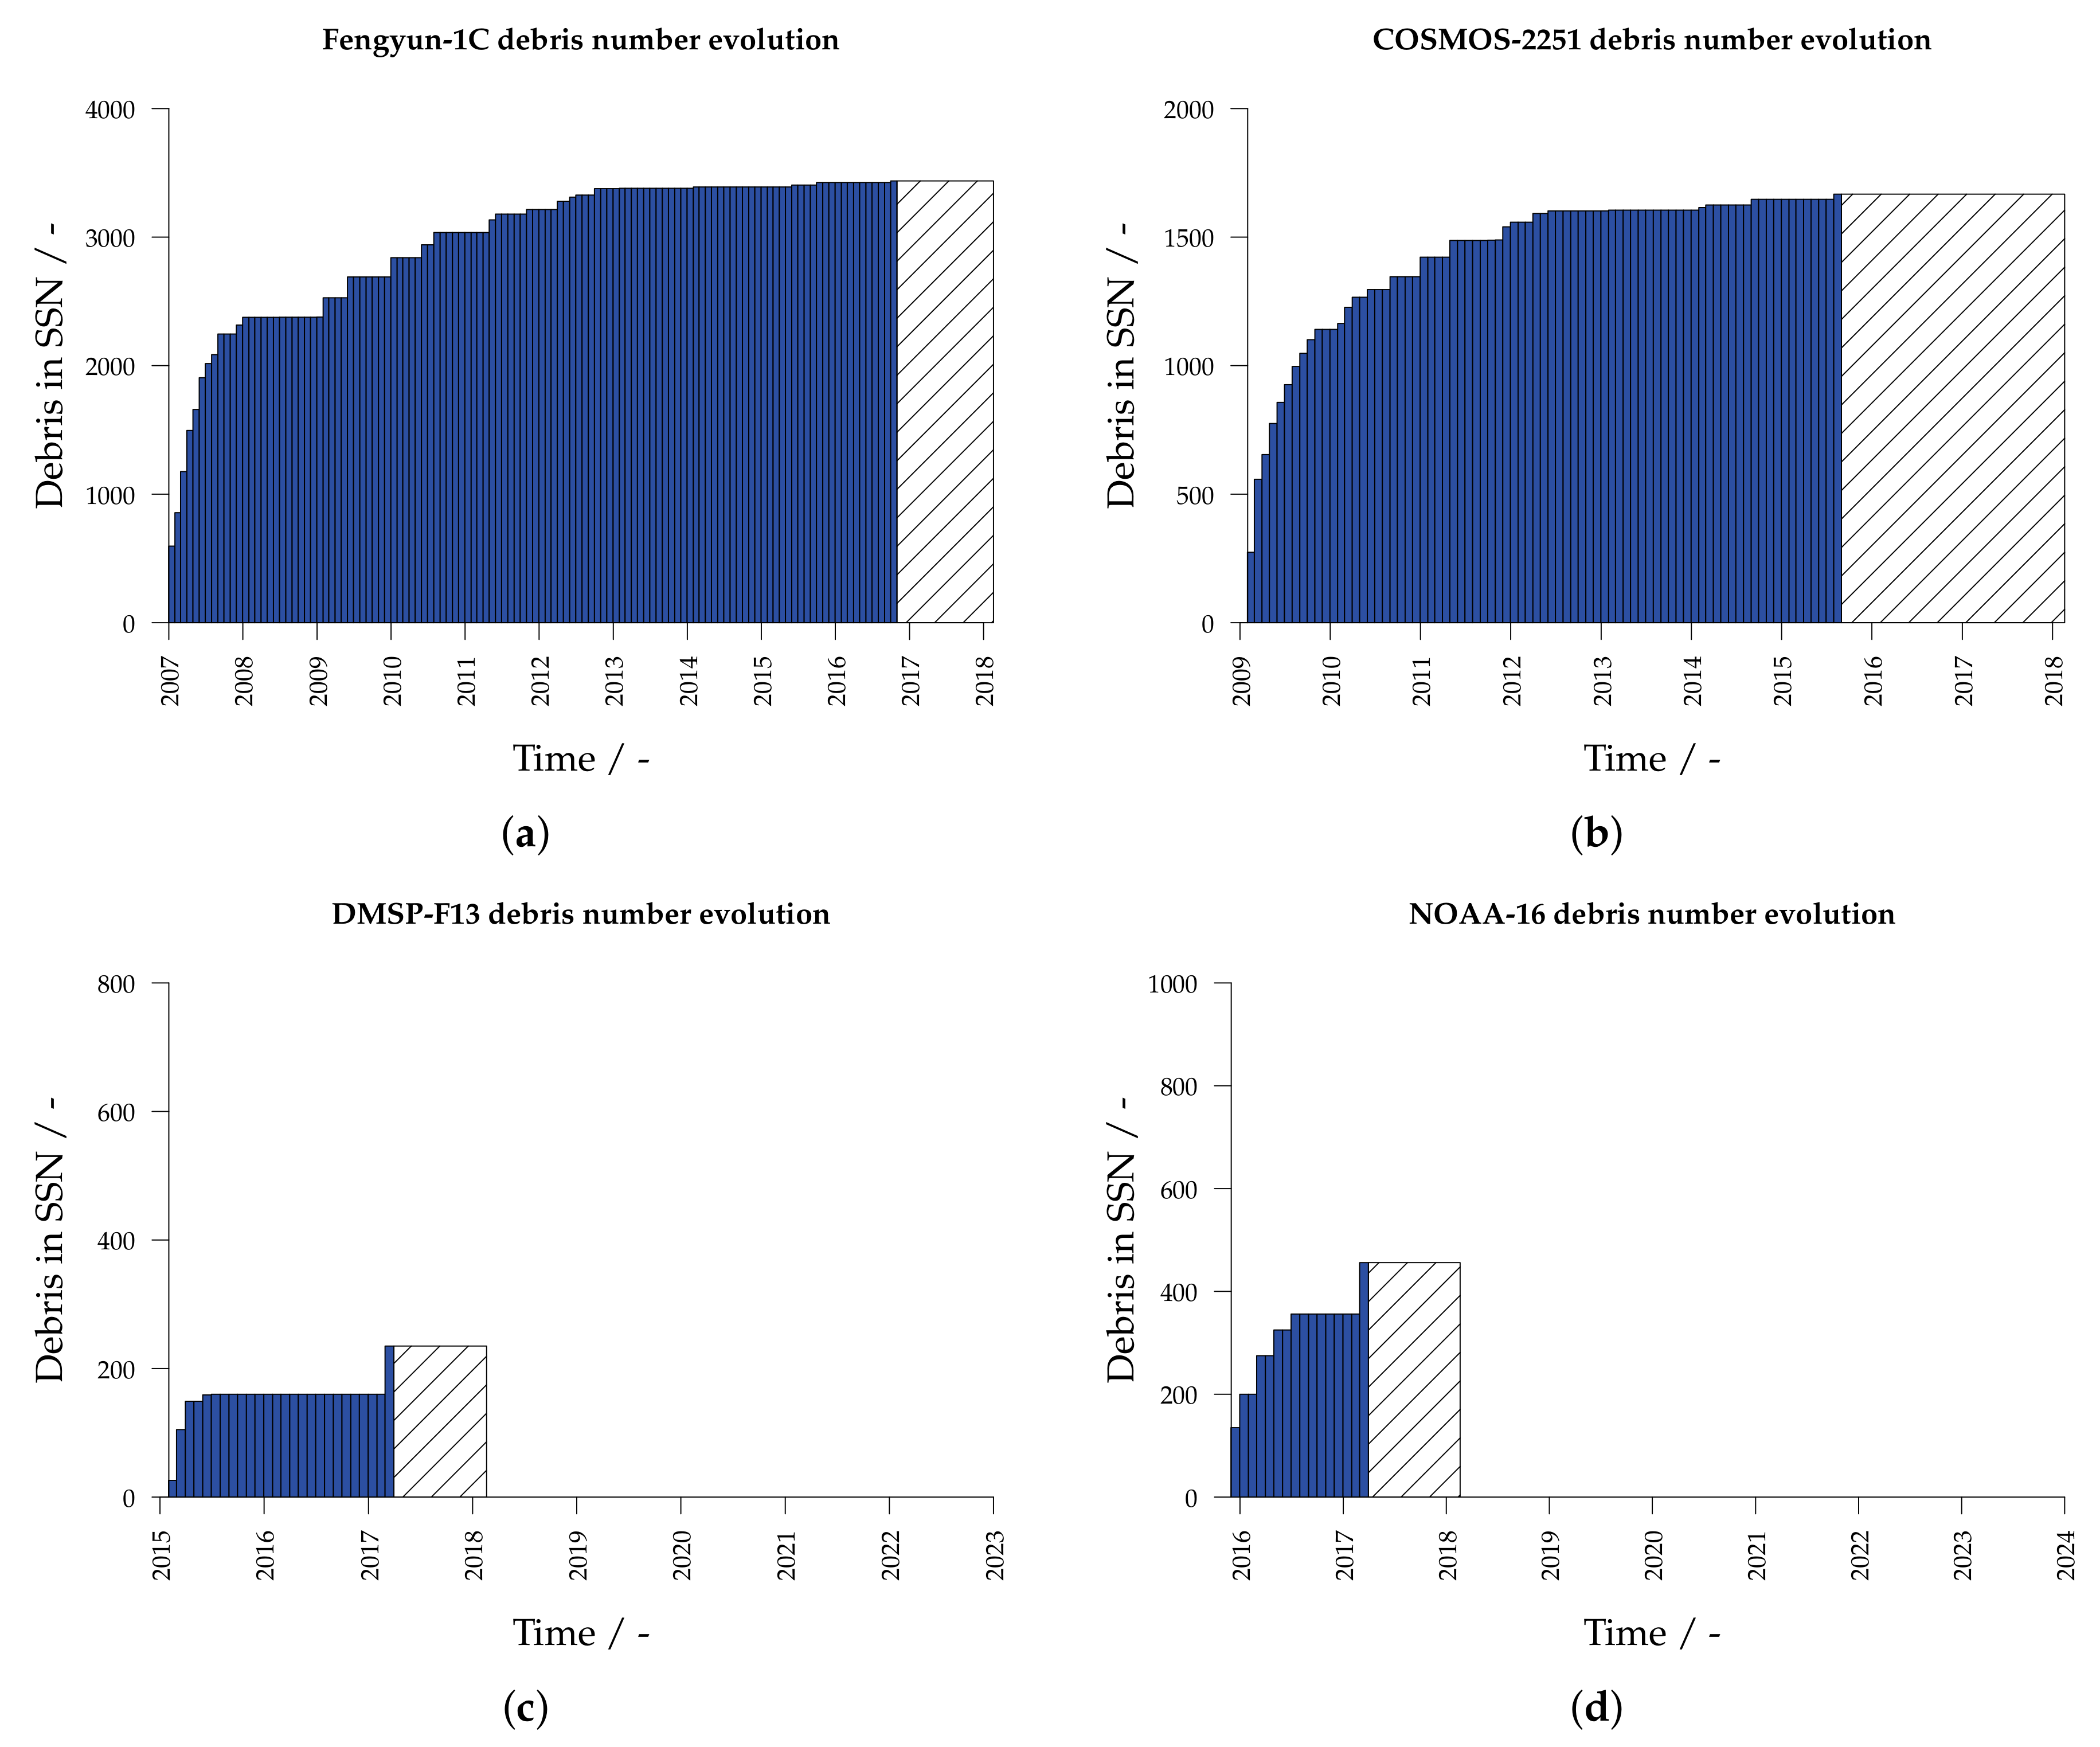
2.1. Event History
2.2. Fragmentation Characteristics of Individual Events
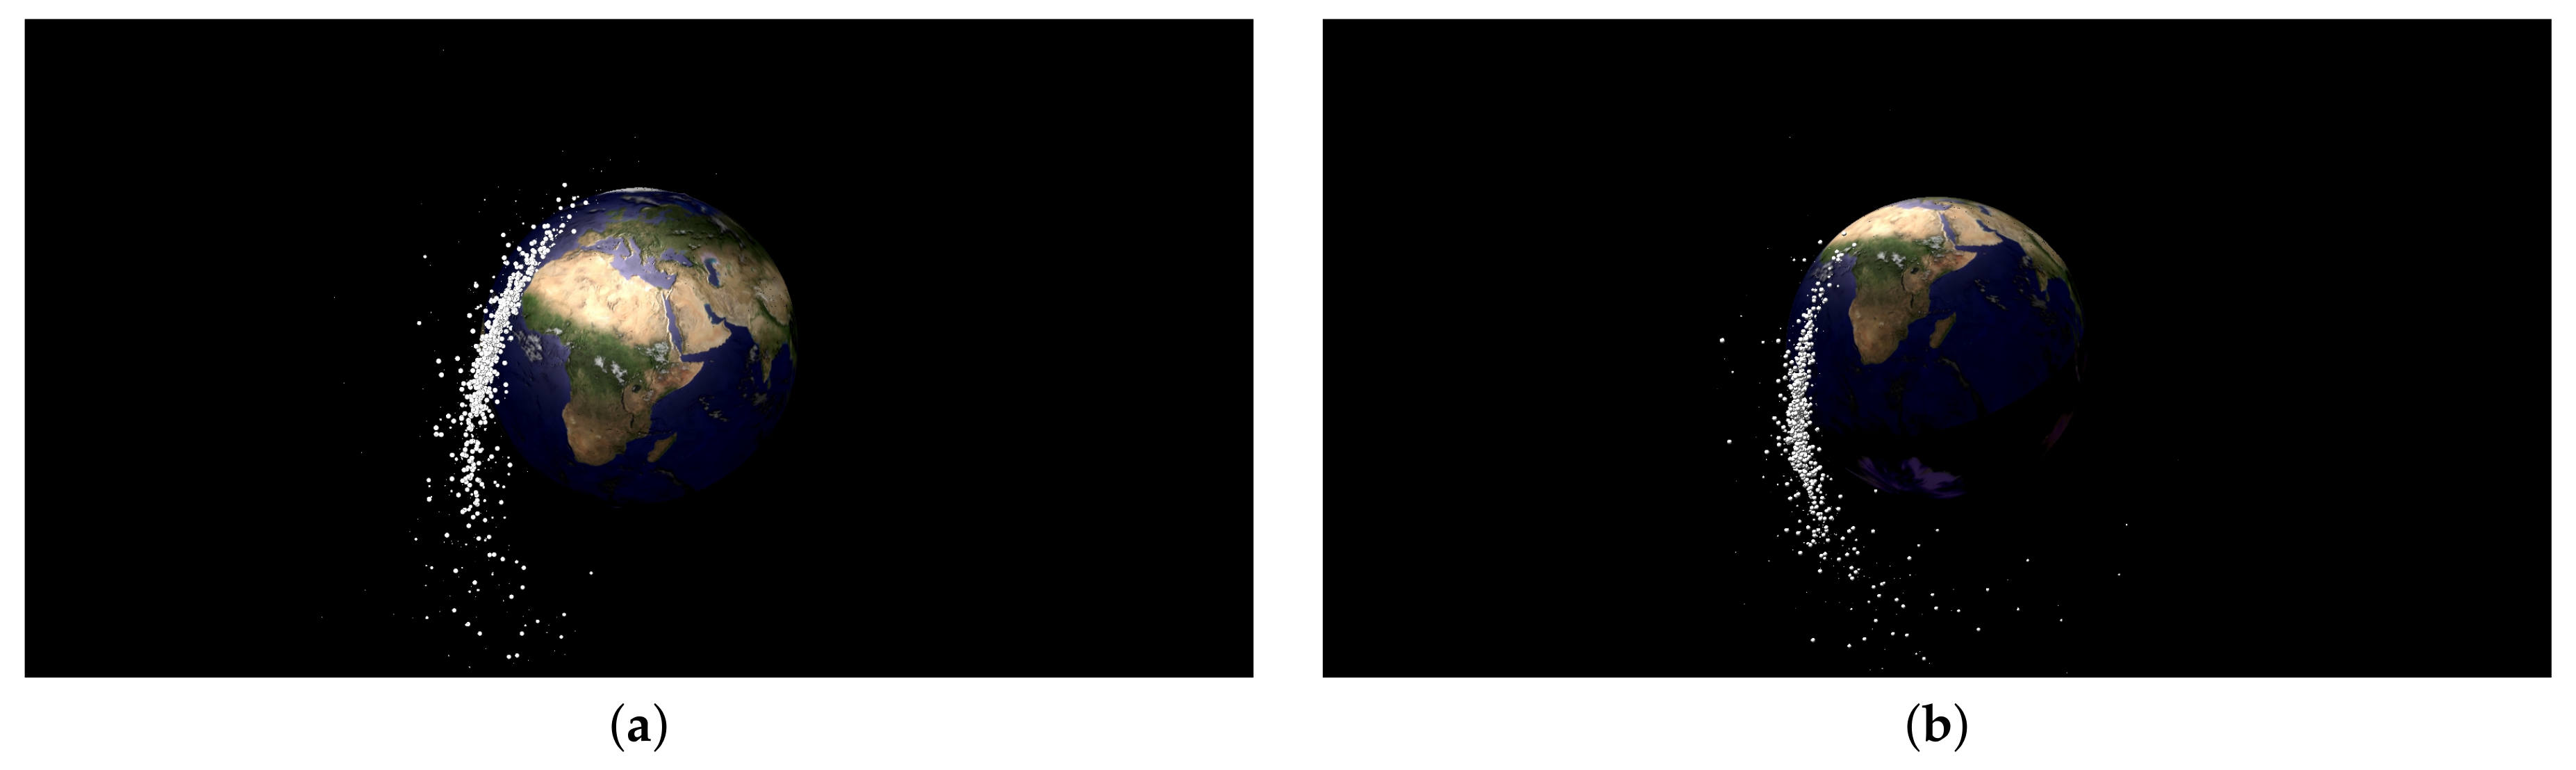
3. Sodium Potassium Droplets
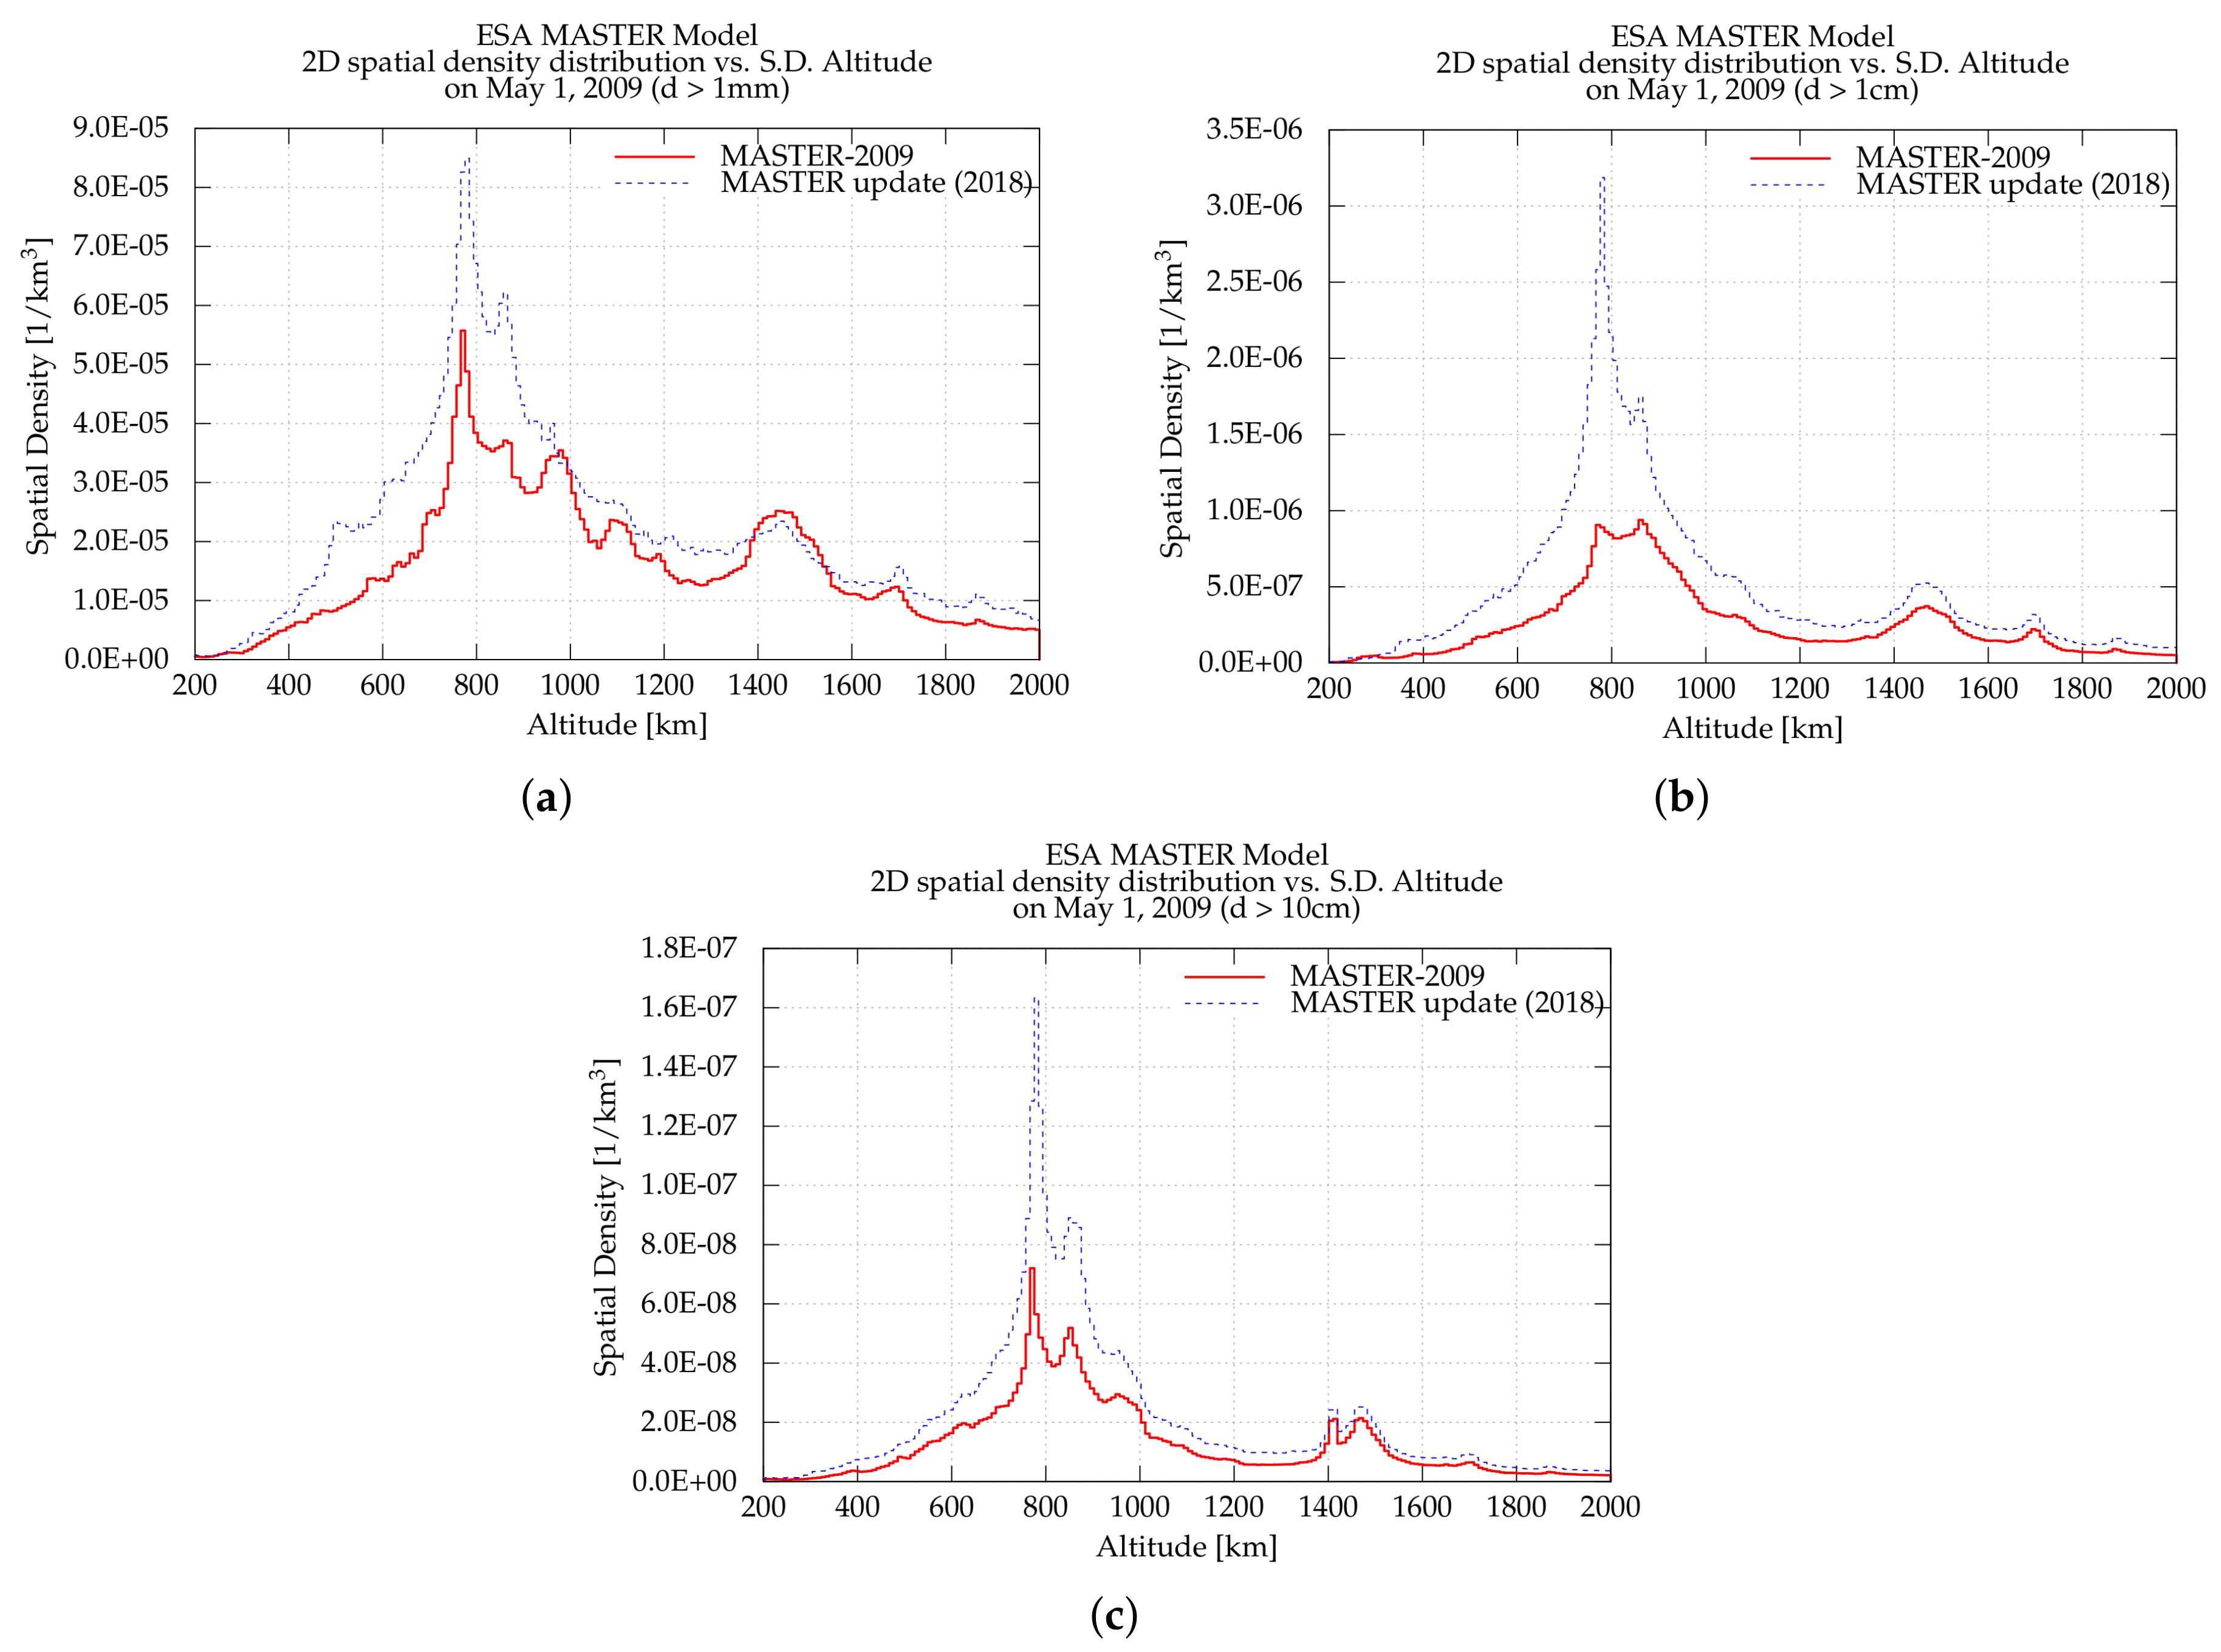
4. Spatial Density
5. Long-Term Evolution
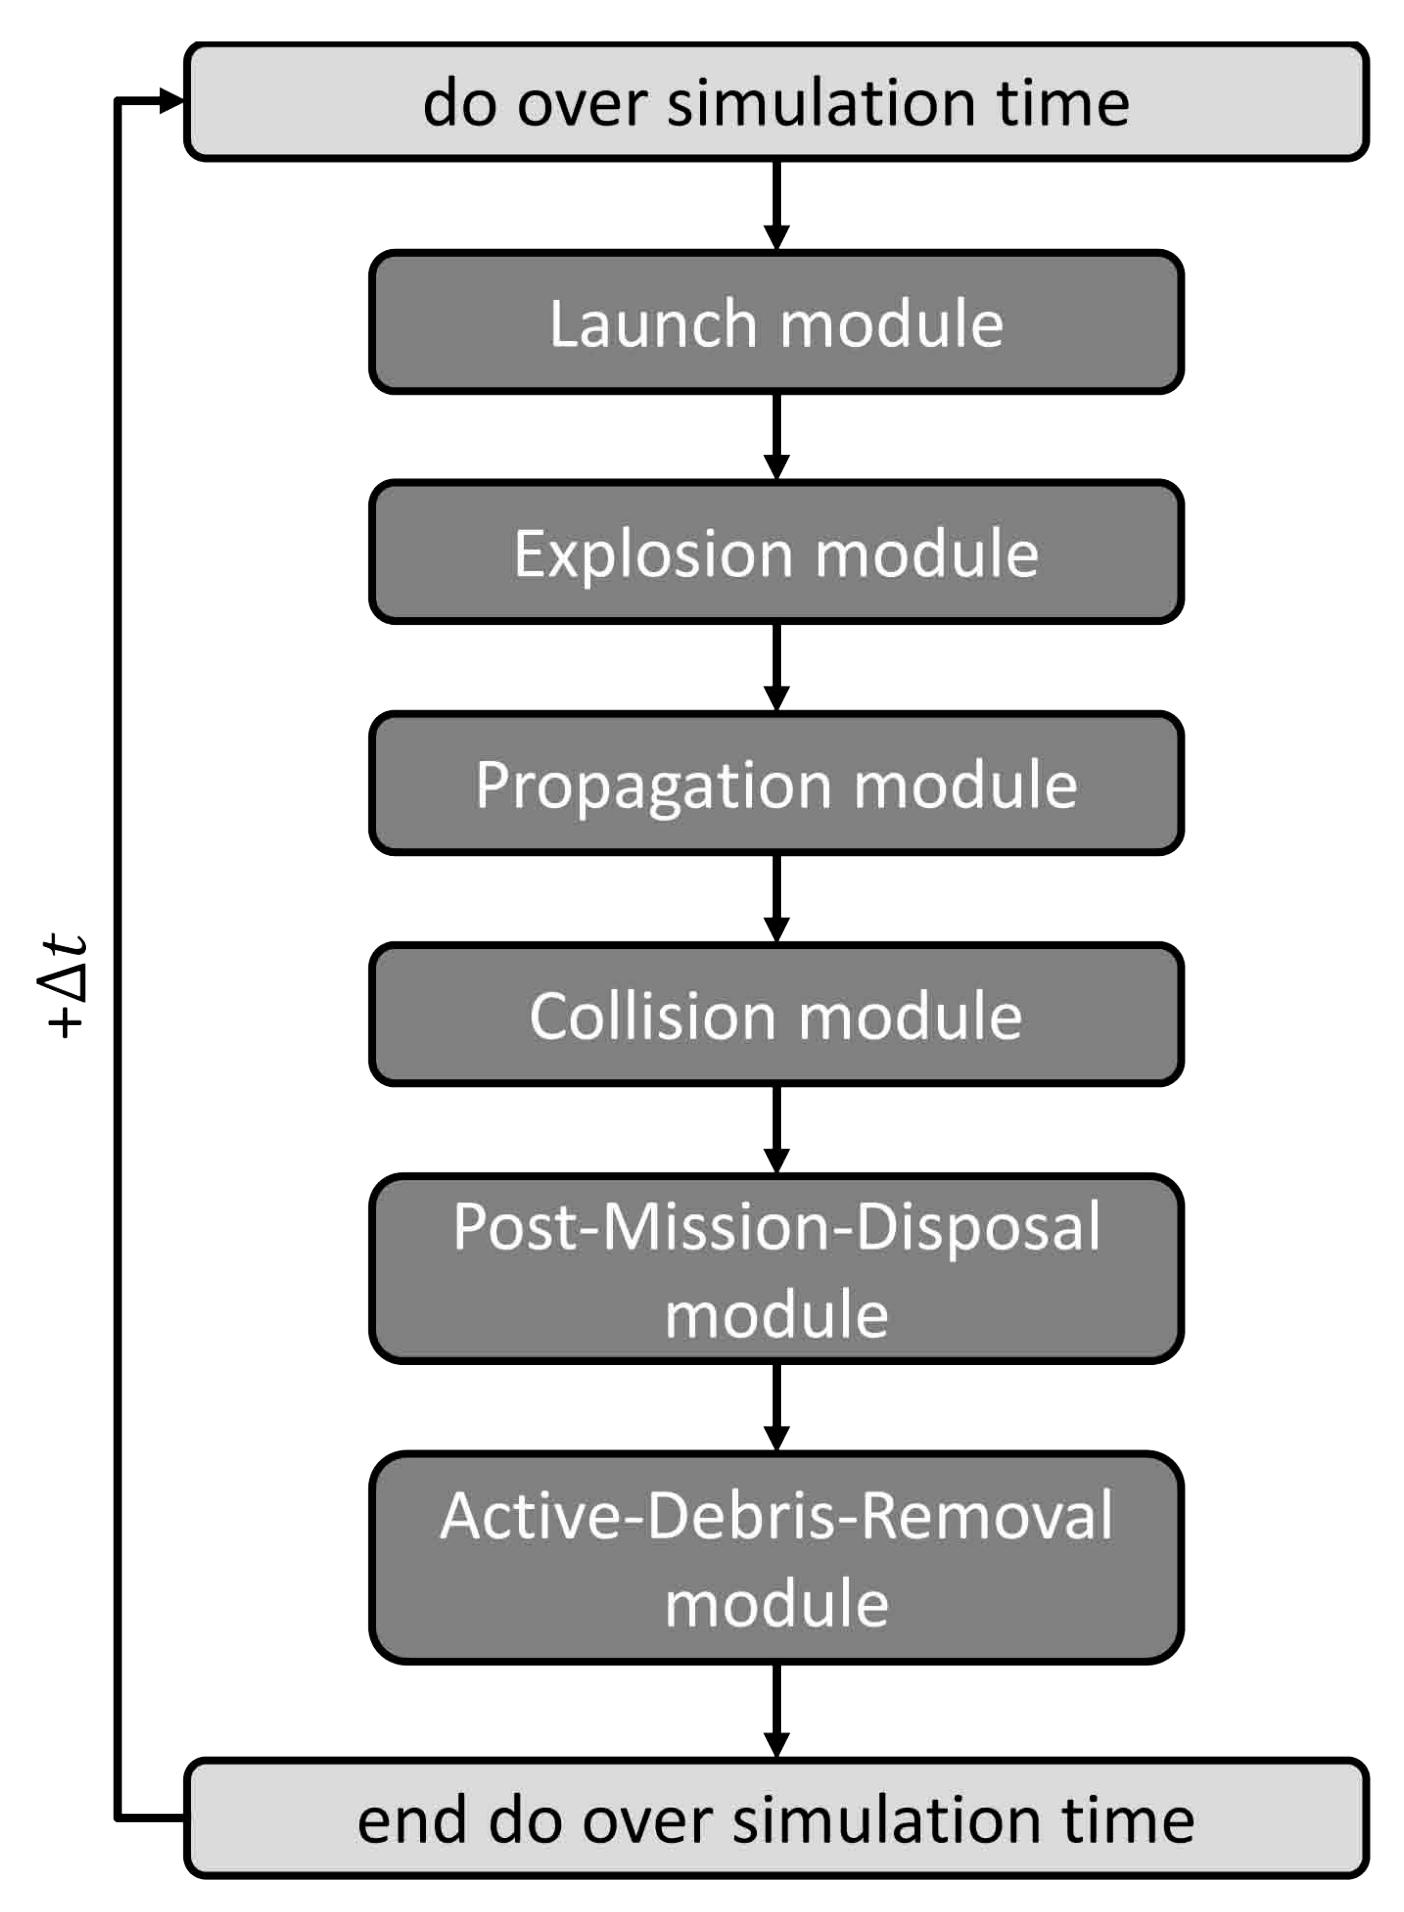
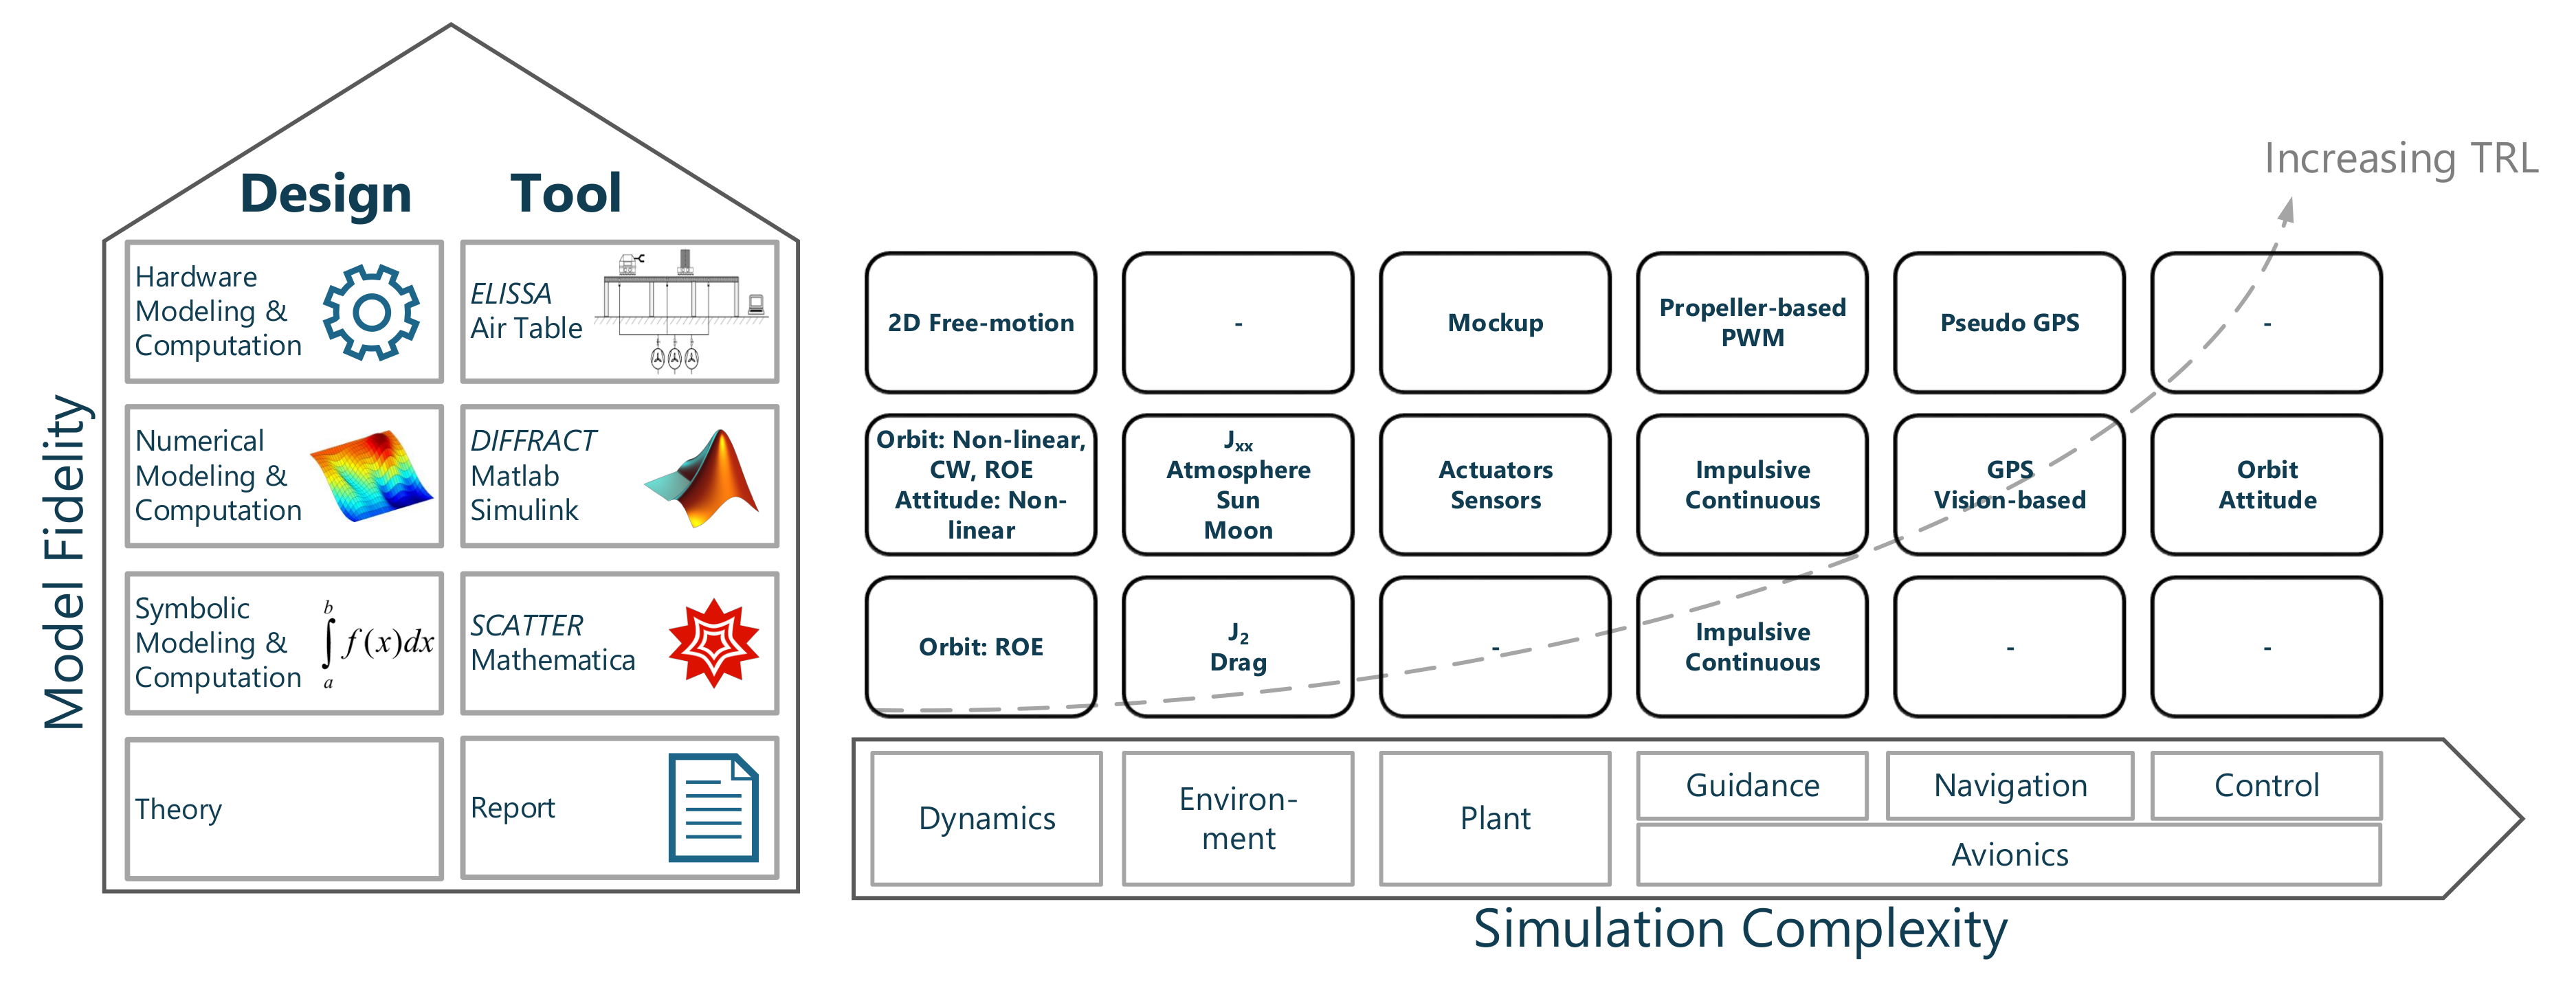
5.1. Simulation Tools
5.2. Kessler Syndrome and Mega-Constellations
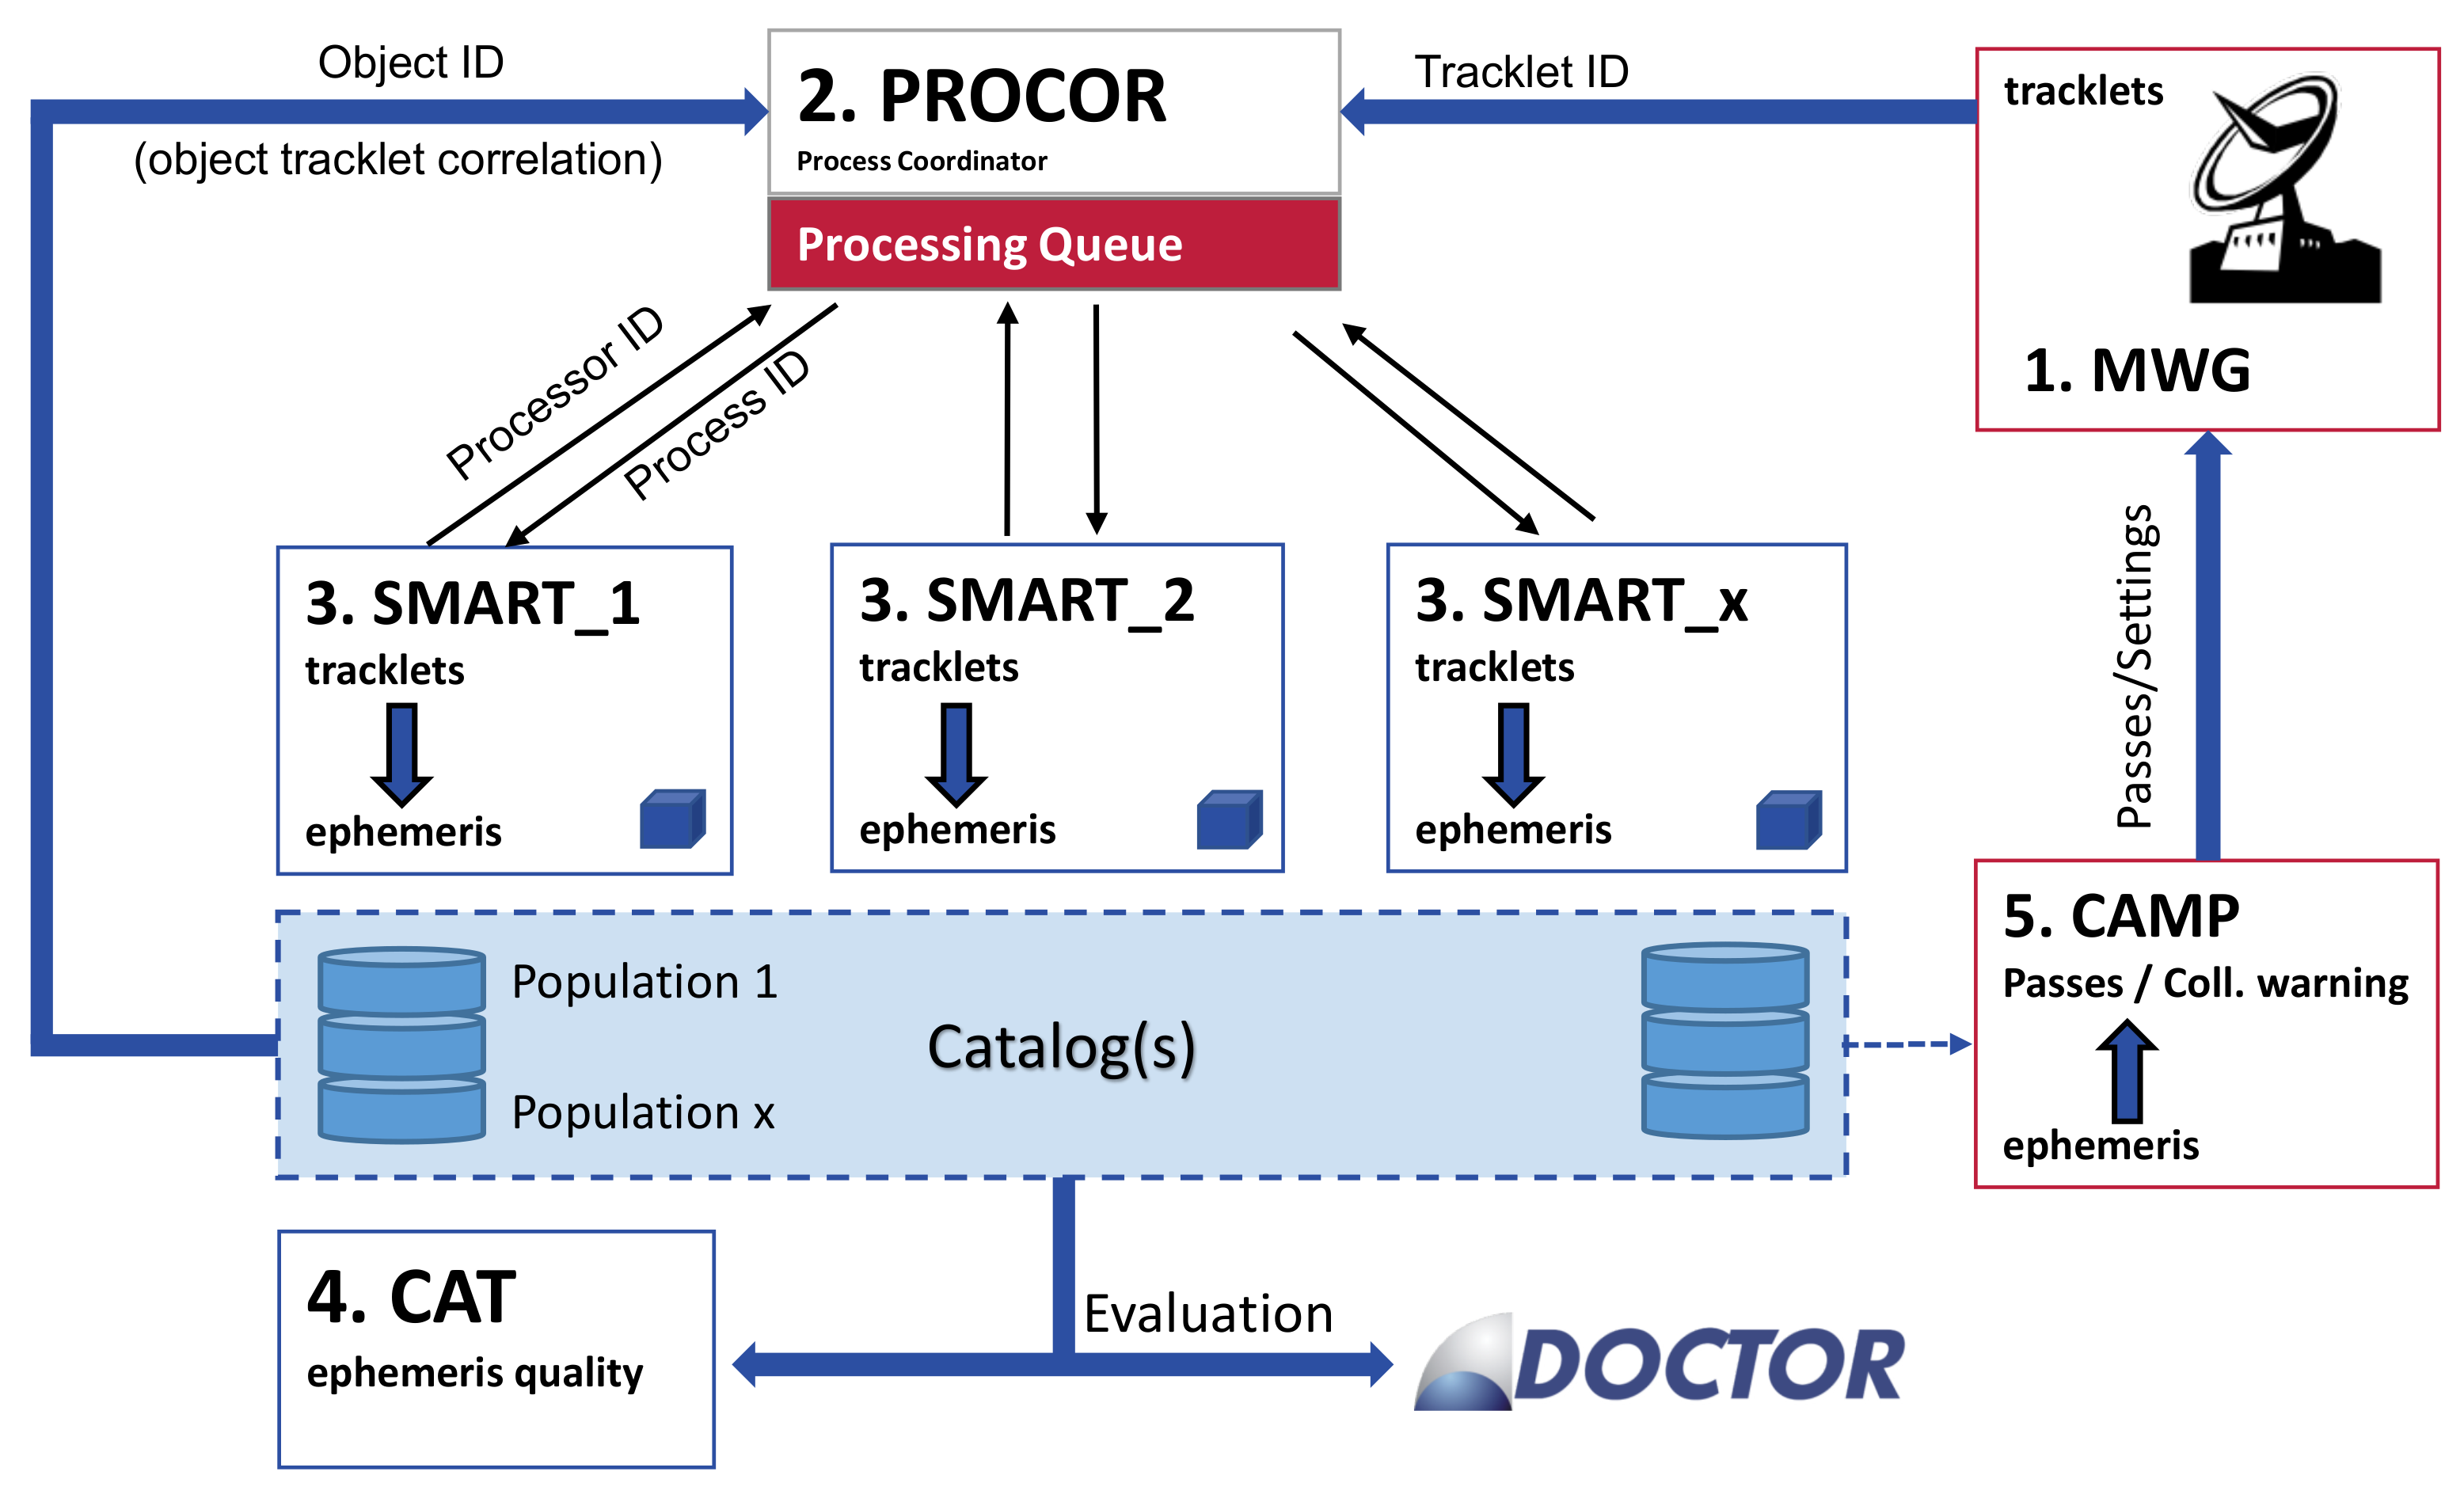
6. Space Situational Awareness
7. Orbit Determination
8. Active Debris Removal
- Proximity operations: development and verification of guidance, navigation and control concepts to rendezvous with a non-cooperative target.
- Docking and capture technologies: development and verification of suitable mechanisms to dock or capture with a non-cooperative target.
8.1. Proximity Operations
8.2. ADR Mechanisms
9. Conclusions
Acknowledgments
Author Contributions
Conflicts of Interest
Abbreviations
| AIUB | Astronomical Institute of the University of Bern |
| ADR | Active Debris Removal |
| BAU | Business-As-Usual |
| COSPAR | Committee on Space Research |
| CW | Clohessy-Wiltshire |
| DELTA | Debris Environment Long-term Analysis |
| DIFFRACT | De-Orbit, Formation Flight and Re-Entry Analytical Toolbox |
| DOCTOR | Display of Objects Circulating in Terrestrial Orbits |
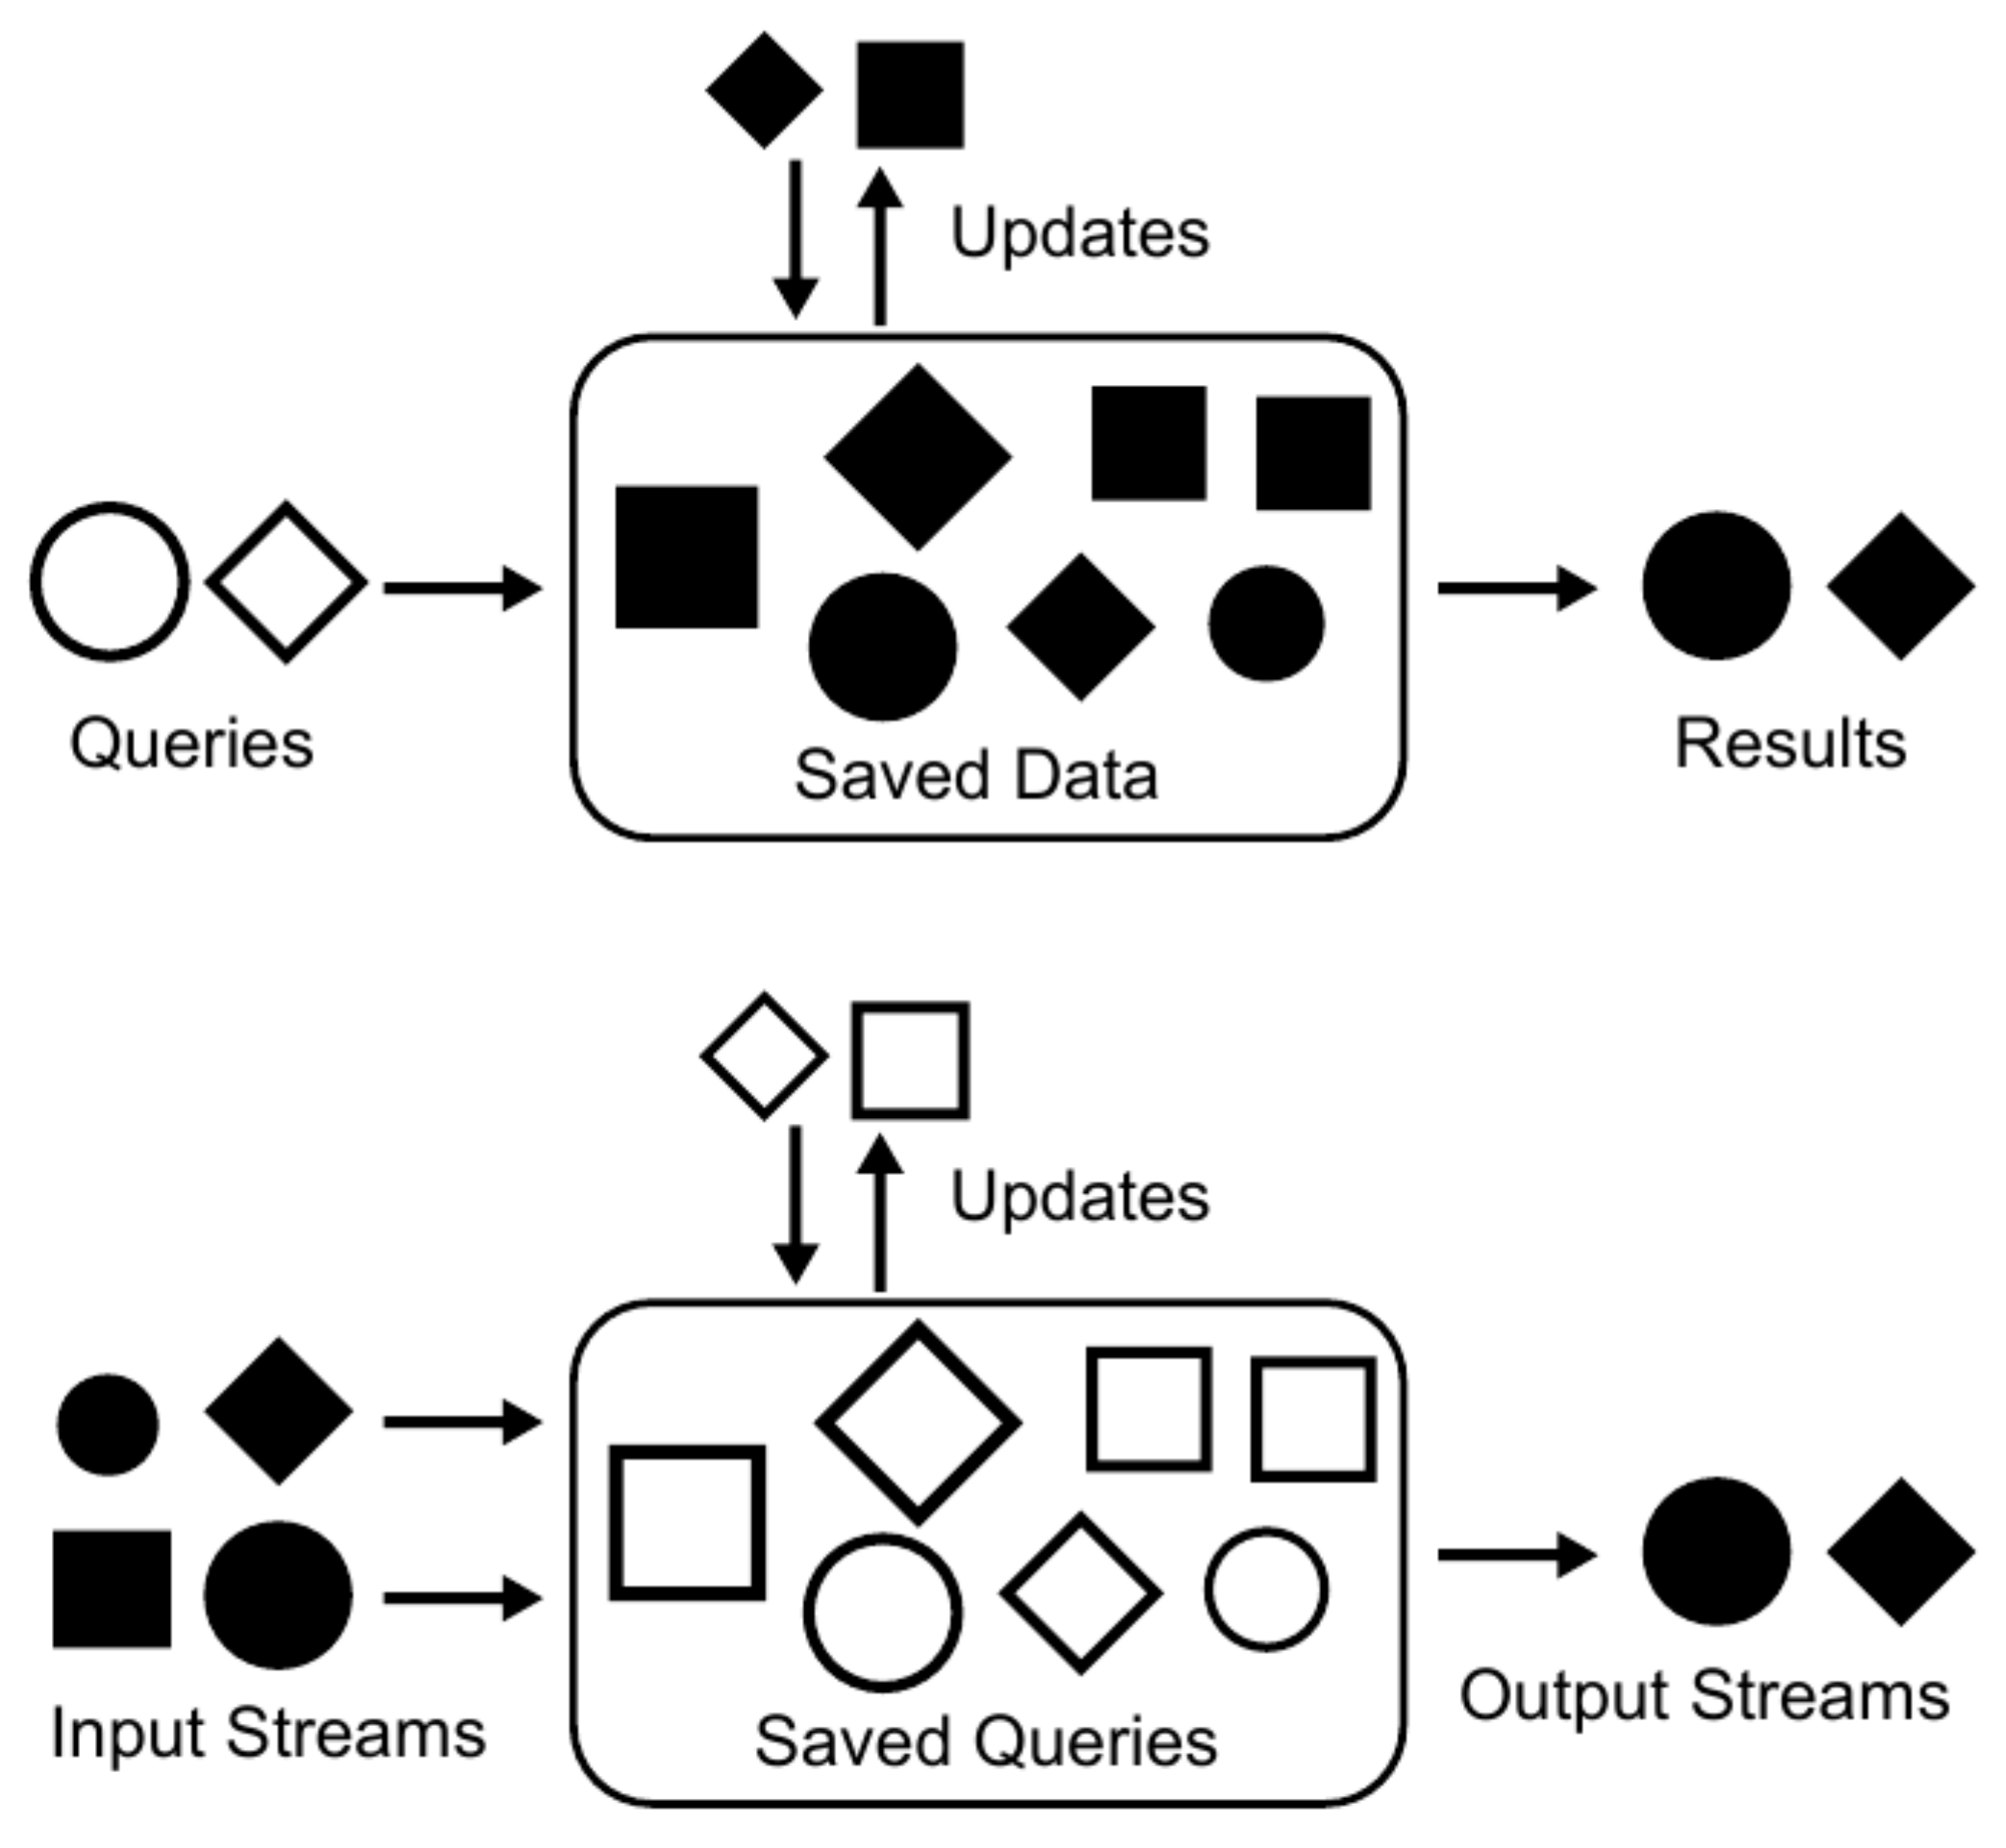
| DSMS | Data Stream Management Systems |
| EKF | Extended Kalman Filter |
| ELISSA | Experimental Lab for proxImity operations and Space Situational Awareness |
| EnKF | Ensemble Kalman Filter |
| EOL | End-Of-Life |
| ESA | European Space Agency |
| ESOC | European Space Operations Centre |
| ESTEC | European Space Research and Technology Centre |
| FHR | Fraunhofer Institute for High Frequency Physics and Radar Techniques |
| GEO | Geostationary Earth Orbit |
| GNSS | Global Navigation Satellite System |
| HIL | Hardware-In-the-Loop |
| IADC | Inter-Agency Space Debris Coordination Committee |
| IFD | In Flight Demonstration |
| JSpOC | Joint Space Operations Center |
| KF | Kalman filter |
| LEO | Low Earth Orbit |
| LQR | Linear Quadratic Regulation |
| LUCA | Long-term Utility for Collision Analysis |
| MASTER | Meteoroid And Space debris Terrestrial Environment Reference |
| NEPTUNE | Networking/partnering initiative Ephemeris Propagation Tool with Uncertainty Extrapolation |
| NCS | Net Capture System |
| PMD | Post Mission Disposal |
| POD | precise orbit determination |
| PROOF | Program for Radar and Optical Observation Forecasting |
| PWM | Pulse Width Modulation |
| RSO | Resident Space Object |
| SCATTER | SpaceCraft ATTitude and Orbit numERical simulator |
| SPHERES | Synchronized Position Hold, Engage, Reorient, Experimental Satellites |
| SSA | Space Situational Awareness |
| SST | Space Surveillance and Tracking |
| TDT | Tether Dynamics Toolbox |
| TLE | Two-Line Elements |
| TRL | Technology Readiness Levels |
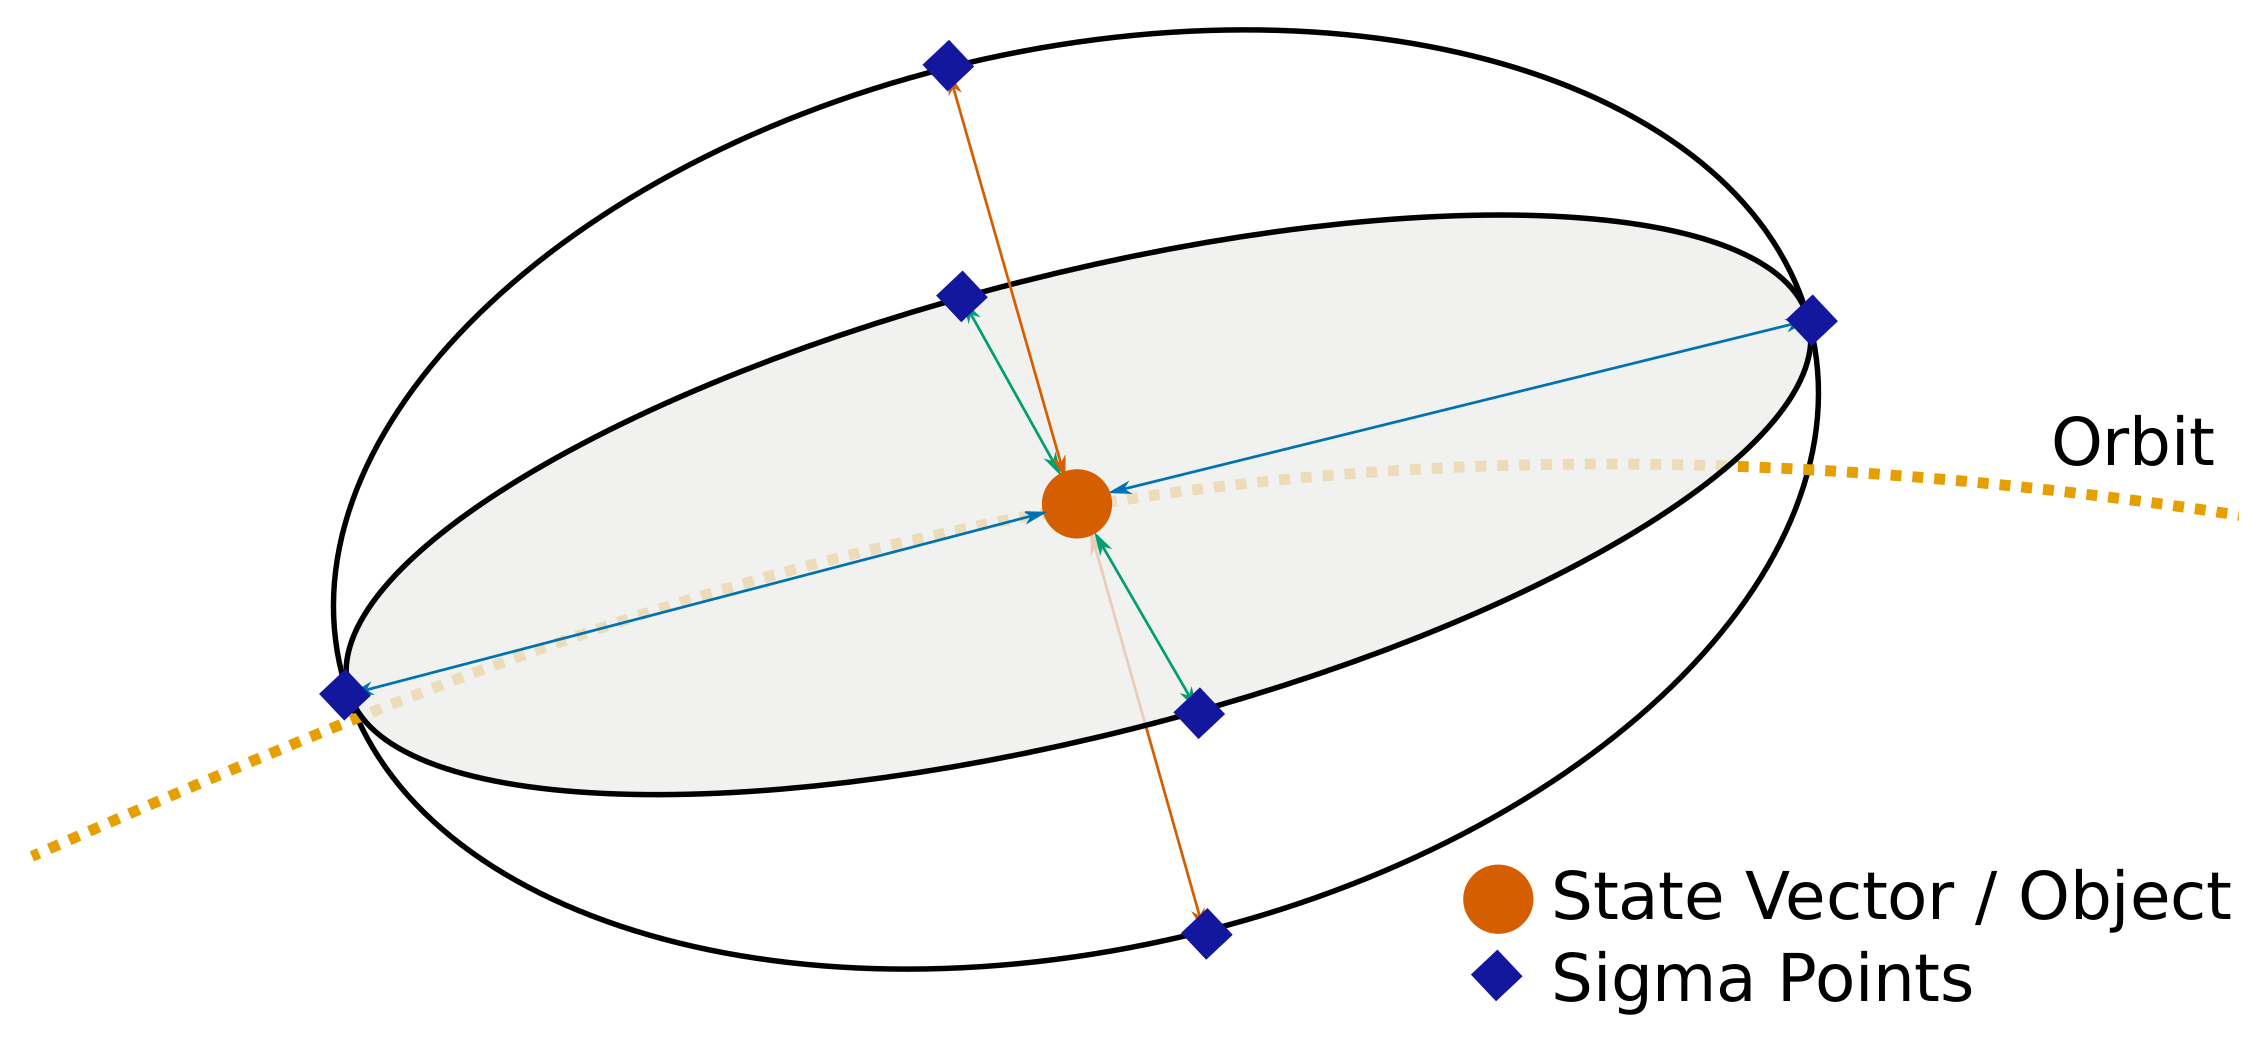
| UKF | Unscented Kalman Filter |
| UT | Unscented Transformation |
References
- Krag, H. A Method for the Validation of Space Debris Models and for the Analysis and Planning of Radar and Optical Surceys. Ph.D. Thesis, Technische Universität Braunschweig, Braunschweig, Germany, 2003. [Google Scholar]
- Flegel, S.; Gelhaus, J.; Möckel, M.; Wiedemann, C.; Kempf, D.; Krag, H.; Klinkrad, H. Maintenance of the ESA MASTER Model; Final Report; ESOC Contract No. 21705/08/D/HK; Institut für Luft- und Raumfahrtsysteme: Braunschweig, Germany, 2011. [Google Scholar]
- Wiedemann, C.; Flegel, S.; Kebschull, C. Additional orbital fragmentation events. In Proceedings of the 65th International Astronautical Congress (IAC 2014), Toronto, ON, Canada, 29 September–3 October 2014. IAC-14.A6.P.57. [Google Scholar]
- Space-Track. Available online: http://www.space-track.com (accessed on 2 February 2018).
- Wiedemann, C.; Lorenz, J.; Radtke, J.; Kebschull, C.; Horstmann, A.; Stoll, E. Space debris—Modeling and detectability. In Proceedings of the SPIE 10254, XXI International Symposium on High Power Laser Systems and Applications, Gmunden, Austria, 5–9 September 2016. [Google Scholar]
- ESA. Database and Information System Characterising Objects in Space. Available online: https://discosweb.esoc.esa.int (accessed on 17 November 2016).
- Liou, J.C. Chinese Anti-satellite Test Creates Most Severe Orbital Debris Cloud in History. Orbital Debris Q. News 2007, 11, 2–3. [Google Scholar]
- Wiedemann, C.; Horstmann, A.; Kebschull, C.; Flegel, S.; Stoll, E. Die Auswirkung vorsätzlich herbeigeführter Fragmentationsereignisse auf die Weltraummüllumgebung. In Proceedings of the Deutscher Luft- und Raumfahrtkongress, Rostock, Germany, 22–24 September 2015. Paper No.: 2015-370033 (In German). [Google Scholar]
- Liou, J.C. Upper Stage Explosion Places LEO Satellites at Risk. Orbital Debris Q. News 2017, 17, 1–8. [Google Scholar]
- Johnson, N.L.; Krisko, P.; Liou, J.C.; Anz-Meador, P. NASAs new breakup model of EVOLVE 4.0. Adv. Space Res. 2001, 28, 1377–1384. [Google Scholar] [CrossRef]
- Krisko, P. Proper implementation of the 1998 NASA breakup model. Orbital Debris Q. News 2011, 15, 1–10. [Google Scholar]
- Johnson, N.L.; Stansbery, E.; Liou, J.C.; Horstman, M.; Stokely, C.; Whitlockd, D. The characteristics and consequences of the break-up of the Fengyun-1C spacecraft. Acta Astronaut. 2008, 63, 128–135. [Google Scholar] [CrossRef]
- Pardini, C.; Anselmo, L. Physical properties and long-term evolution of the debris clouds produced by two catastrophic collisions in Earth orbit. Adv. Space Res. 2011, 48, 557–569. [Google Scholar] [CrossRef]
- Letizia, F.; Colombo, C.; Lewis, H. Analytical Model for the Propagation of Small-Debris-Object Clouds After Fragmentations. J. Guid. Control Dyn. 2015, 38, 1478–1491. [Google Scholar] [CrossRef]
- Shoots, D. Recent NOAA-16 Satellite Breakup. Orbital Debris Q. News 2016, 20, 1–2. [Google Scholar]
- Horstmann, A.; Stoll, E.; Krag, H. A Validation Method of ESA’s MASTER 1 cm Population in Low Earth Orbit. In Proceedings of the 18th Advanced Maui Optical and Space Surveillance Technologies Conference (AMOS), Maui, HI, USA, 19–22 September 2017. [Google Scholar]
- Krag, H.; Beltrami-Karlezi, P.; Bendisch, J.; Klinkrad, H.; Rex, D.; Rosebrock, J.; Schildknecht, T. PROOF—The extension of ESA’s MASTER Model to predict debris detections. Acta Astronaut. 2000, 47, 687–697. [Google Scholar] [CrossRef]
- Krag, H.; Bendisch, J.; Klinkrad, H.; Rex, D.; Rieger, T.; Rosebrock, J.; Schildknecht, T. Debris model validation and interpretation of debris measurements using ESA’s PROOF tool. Acta Astronaut. 2001, 48, 243–965. [Google Scholar] [CrossRef]
- Möckel, M.; Wiedemann, C.; Flegel, S.; Gelhaus, J.; Vörsmann, P.; Klinkrad, H.; Krag, H. Using parallel computing for the display and simulation of the space debris environment. Adv. Space Res. 2011, 48, 173–183. [Google Scholar] [CrossRef]
- Möckel, M. High Performance Propagation of Large Object Populations in Earth Orbits. Ph.D. Thesis, Technische Universität Braunschweig, Braunschweig, Germany, 2015. [Google Scholar] [CrossRef]
- Moeckel, M.; Wiedemann, C.; Flegel, S.; Gelhaus, J.; Braun, V.; Klinkrad, H.; Krag, H.; Vörsmann, P. Visualizing the Space Debris Environment. In Proceedings of the 62th International Astronautical Congress 2011 (IAC 2011), Cape Town, South Africa, 3–7 October 2011. Paper No.: IAC-11.A6.2.14. [Google Scholar]
- Wiedemann, C.; Flegel, S.; Gelhaus, J.; Krag, H.; Klinkrad, H.; Vörsmann, P. NaK release model for MASTER-2009. Acta Astronaut. 2011, 68, 1325–1333. [Google Scholar] [CrossRef]
- Wiedemann, C.; Gamper, E.; Horstmann, A.; Braun, V.; Stoll, E. The contribution of NaK droplets to the space debris environment. In Proceedings of the 7th European Conference on Space Debris, Darmstadt, Germany, 18–21 April 2017; Flohrer, T., Schmitz, F., Eds.; ESA Space Debris Office: Darmstadt, Germany, 2017. [Google Scholar]
- Wiedemann, C.; Gamper, E.; Horstmann, A.; Braun, V.; Stoll, E. Release of liquid metal droplets from Cosmos 1818 and 1867. In Proceedings of the 67th International Astronautical Congress 2016 (IAC 2016), Guadalajara, Mexico, 26–30 September 2016. Paper No.: IAC-16.A6.2.9. [Google Scholar]
- Krisko, P.; Vavrin, A.; Anz-Meador, P. NASA orbital debris large-object baseline populations in ORDEM 3.0. In Proceedings of the 64th International Astronautical Congress 2013 (IAC 2013), Bejing, China, 23–27 September 2013. Paper No.: IAC-13-A6.P9. [Google Scholar]
- Wiedemann, C.; Gamper, E.; Horstmann, A.; Braun, V.; Stoll, E. Der aktuelle Beitrag der NaK Tropfen zum Weltraummüll. In Proceedings of the Deutscher Luft- und Raumfahrtkongress, TU München, München, Germany, 5–7 September 2017. Paper No.: 2017-450048 (In German). [Google Scholar]
- Eichler, P.; Rex, D. Chain reaction of debris generation by collisions in space—A final threat to spaceflight? Acta Astronaut. 1990, 22, 381–387. [Google Scholar] [CrossRef]
- Eichler, P. Analysis of the necessity and the effectiveness of countermeasures to prevent a chain reaction of collisions. Acta Astronaut. 1992, 26, 487–493. [Google Scholar] [CrossRef]
- Martin, C.; Walker, R.; Klinkrad, H. The sensitivity of the ESA DELTA model. Adv. Space Res. 2004, 34, 969–974. [Google Scholar] [CrossRef]
- Radtke, J.; Mueller, S.; Schaus, V.; Stoll, E. LUCA2—An Enhanced Long-Term Utility for Collision Analysis. In Proceedings of the 7th European Conference on Space Debris, Darmstadt, Germany, 18–21 April 2017; Flohrer, T., Schmitz, F., Eds.; ESA Space Debris Office: Darmstadt, Germany, 2017. [Google Scholar]
- Braun, V. Providing Orbit Information with Predetermined Bounded Accuracy. Ph.D. Thesis, Technische Universität Braunschweig, Braunschweig, Germany, 2016. [Google Scholar] [CrossRef]
- Kessler, D.J.; Cour-Palais, B.G. Collision frequency of artificial satellites—The creation of a debris belt. J. Geophys. Res. 1978, 83, 2637–2646. [Google Scholar] [CrossRef]
- Dolado-Perez, J.; Revelin, B.; di Costanzo, R. Sensitivity Analysis of the Long term Evolution of the Space Debris Population in LEO. In Proceedings of the 65th International Astronautical Congress, Toronto, ON, Canada, 29 September–3 October 2014. Paper No.: IAC-14-A6.2.3. [Google Scholar]
- Liou, J.C.; Johnson, N.L. Instability of the present LEO satellite populations. Adv. Space Res. 2008, 41, 1046–1053. [Google Scholar] [CrossRef]
- Bastida Virgili, B.; Dolado, J.; Lewis, H.; Radtke, J.; Krag, H.; Revelin, B.; Cazaux, C.; Colombo, C.; Crowther, R.; Metz, M. Risk to space sustainability from large constellations of satellites. Acta Astronaut. 2016, 126, 154–162. [Google Scholar] [CrossRef]
- Peterson, G.E.; Jenkin, A.B.; Sorge, M.E.; McVey, J.P. Implications of proposed small satellite constellations on space traffic management and long-term debris growth in near-earth environment. In Proceedings of the 67th International Astronautical Congress (IAC 2016), Guadalajara, Mexico, 26–30 September 2016. Paper No.: IAC-16.A6.7.8. [Google Scholar]
- Radtke, J.; Kebschull, C.; Stoll, E. Interactions of the space debris environment with mega constellations—Using the example of the OneWeb constellation. Acta Astronaut. 2017, 131, 55–68. [Google Scholar] [CrossRef]
- Kebschull, C.; Reichstein, L.; Stoll, E. A Simulation Environment to Determine the Performance of SSA Systems. In Proceedings of the 18th Advanced Maui Optical and Space Surveillance Technologies Conference (AMOS), Maui, HI, USA, 19–22 September 2017. [Google Scholar]
- Müller, S.; Stoll, E. Data Stream-Centric SST System Architecture Enhancement. In Proceedings of the 1st IAA Conference on Space Situational Awareness (ICSSA), Orlando, FL, USA, 13–15 November 2017. [Google Scholar]
- Müller, S.; Kebschull, C.; Stoll, E. Evaluation of Data Stream Management Systems in the Context of Space Surveillance and Tracking. In Proceedings of the 7th European Conference on Space Debris, Darmstadt, Germany, 18–21 April 2017; Flohrer, T., Schmitz, F., Eds.; ESA Space Debris Office: Darmstadt, Germany, 2017. [Google Scholar]
- Kebschull, C.; Flegel, S.; Braun, V.; Gelhaus, J.; Möckel, M.; Wiedemann, C.; Vörsmann, P. Reducing variability in short term orbital lifetime prediction. Adv. Space Res. 2013, 51, 1110–1115. [Google Scholar] [CrossRef]
- Klinkrad, H. Space Debris—Models and Risk Analysis; Springer: Berlin/Heidelberg, Germany, 2006. [Google Scholar]
- Vallado, D.A.; McClain, W.D. Fundamentals of Astrodynamics and Applications; Microcosm Press: Portland, OR, USA, 2013. [Google Scholar]
- Hesselbach, S. Analysis and Implementation of Different Methods for Orbit Determination; R 1520 S; Student Research Project, Institute of Space Systeme—Technische Universität Braunschweig: Braunschweig, Germany, 2015. [Google Scholar]
- Gamper, E. Analysis and Implementation of an Unscented Kalman Filter for Orbit Determination; R 1516 S; Student Research Project, Institute of Space Systeme—Technische Universität Braunschweig: Braunschweig, Germany, 2015. [Google Scholar]
- Kalman, R.E. A New Approach to Linear Filtering and Prediction Problems. J. Basic Eng. 1960, 82, 35–45. [Google Scholar] [CrossRef]
- Tapley, B.D.; Schutz, B.E.; Born, G.H. Statistical Orbit Determination; Elsevier Academic Press: Cambridge, MA, USA, 2004. [Google Scholar]
- Julier, S.J.; Uhlmann, J.K. New extension of the Kalman filter to nonlinear systems. Proc. SPIE 1997, 3068, 12. [Google Scholar] [CrossRef]
- Haykin, S.S. Kalman Filtering and Neural Networks; John Wiley & Sons, Inc.: Hoboken, NJ, USA, 2001. [Google Scholar]
- Stauch, J.; Jah, M. Unscented Schmidt–Kalman Filter Algorithm. J. Guid. Control Dyn. 2015, 38, 117–123. [Google Scholar] [CrossRef]
- Evensen, G. The Ensemble Kalman Filter: Theoretical formulation and practical implementation. Ocean Dyn. 2003, 53, 343–367. [Google Scholar] [CrossRef]
- Reichle, R.H.; Walker, J.P.; Koster, R.D.; Houser, P.R. Extended versus Ensemble Kalman Filtering for Land Data Assimilation. J. Hydrometeorol. 2002, 3, 728–740. [Google Scholar] [CrossRef]
- Thorey, J.; Mallet, V.; Chaussin, C.; Descamps, L.; Blanc, P. Ensemble forecast of solar radiation using TIGGE weather forecasts and HelioClim database. Sol. Energy 2015, 120, 232–243. [Google Scholar] [CrossRef] [Green Version]
- Tang, Y.; Ambandan, J.; Chen, D. Nonlinear measurement function in the ensemble Kalman filter. Adv. Atmos. Sci. 2014, 31, 551–558. [Google Scholar] [CrossRef]
- Ben Larbi, M.K.; Stoll, E. Spacecraft formation control using analytical finite-duration approaches. CEAS Space J. 2018, 109, 63–77. [Google Scholar] [CrossRef]
- Trentlage, T.; Mindermann, P.; Ben Larbi, M.; Stoll, E. Development and Test of an Adaptable Docking Mechanism Based on Mushroom-Shaped Adhesive Microstructures. In Proceedings of the AIAA Space and Astronautics Forum and Exposition, AIAA SPACE, Long Beach, CA, USA, 13–16 September 2016. Paper No.: 2016-5486. [Google Scholar]
- De Alba-Padilla, C.; Trentlage, C.; Stoll, E. Vision based Robot Control for Grasping Space Applications Using Gecko Material. In Proceedings of the Symposium on Advanced Space Technologies in Robotics and Automation, Long Beach, CA, USA, 13–16 September 2016. [Google Scholar]
- Zachrau, H.J.; Becker, M.; Stoll, E.; Retat, I.; Roascio, D.; Sternberg, D. ISS spheres tether dynamics experiments evaluation of tethered active debris removal issues. In Proceedings of the ISS R&D Conference, Washington, DC, USA, 17–20 July 2017. [Google Scholar]
- Becker, M.; Retat, I.; Stoll, E. Tether Dynamics Toolbox—Simulation of Tethered Space System and Active Debris Removal Missions. In Proceedings of the AIAA/AAS Astrodynamics Specialist Conference, Long Beach, CA, USA, 13–16 September 2016. [Google Scholar]
- Axthelm, R.; Klotz, B.; Retat, I.; Schlossstein, U.; Tritsch, W.; Vahsen, S. Net Capture Mechanism for Debris Removal Demonstration Mission. In Proceedings of the 7th European Conference on Space Debris, Darmstadt, Germany, 18–21 April 2017; Flohrer, T., Schmitz, F., Eds.; ESA Space Debris Office: Darmstadt, Germany, 2017. [Google Scholar]
- Becker, M.; Stoll, E.; Retat, I. Approaches and models for flexible tether connections in active debris removal missions. In Proceedings of the 7th European Conference on Space Debris, Darmstadt, Germany, 18–21 April 2017; Flohrer, T., Schmitz, F., Eds.; ESA Space Debris Office: Darmstadt, Germany, 2017. [Google Scholar]


| COSPAR ID | NORAD ID | SAT NAME | EVENT EPOCH | DEBRIS (2018) |
|---|---|---|---|---|
| 1999-025A | 25730 | Fengyun-1C | 11 January 2007 | 3438 |
| 2006-057A | 29651 | USA-193 | 21 February 2008 | 2191 * |
| 1993-036A | 22675 | Cosmos-2251 | 10 February 2009 | 1667 |
| 2006-006B | 28944 | Breeze-M R/B | 19 February 2007 | 1460 |
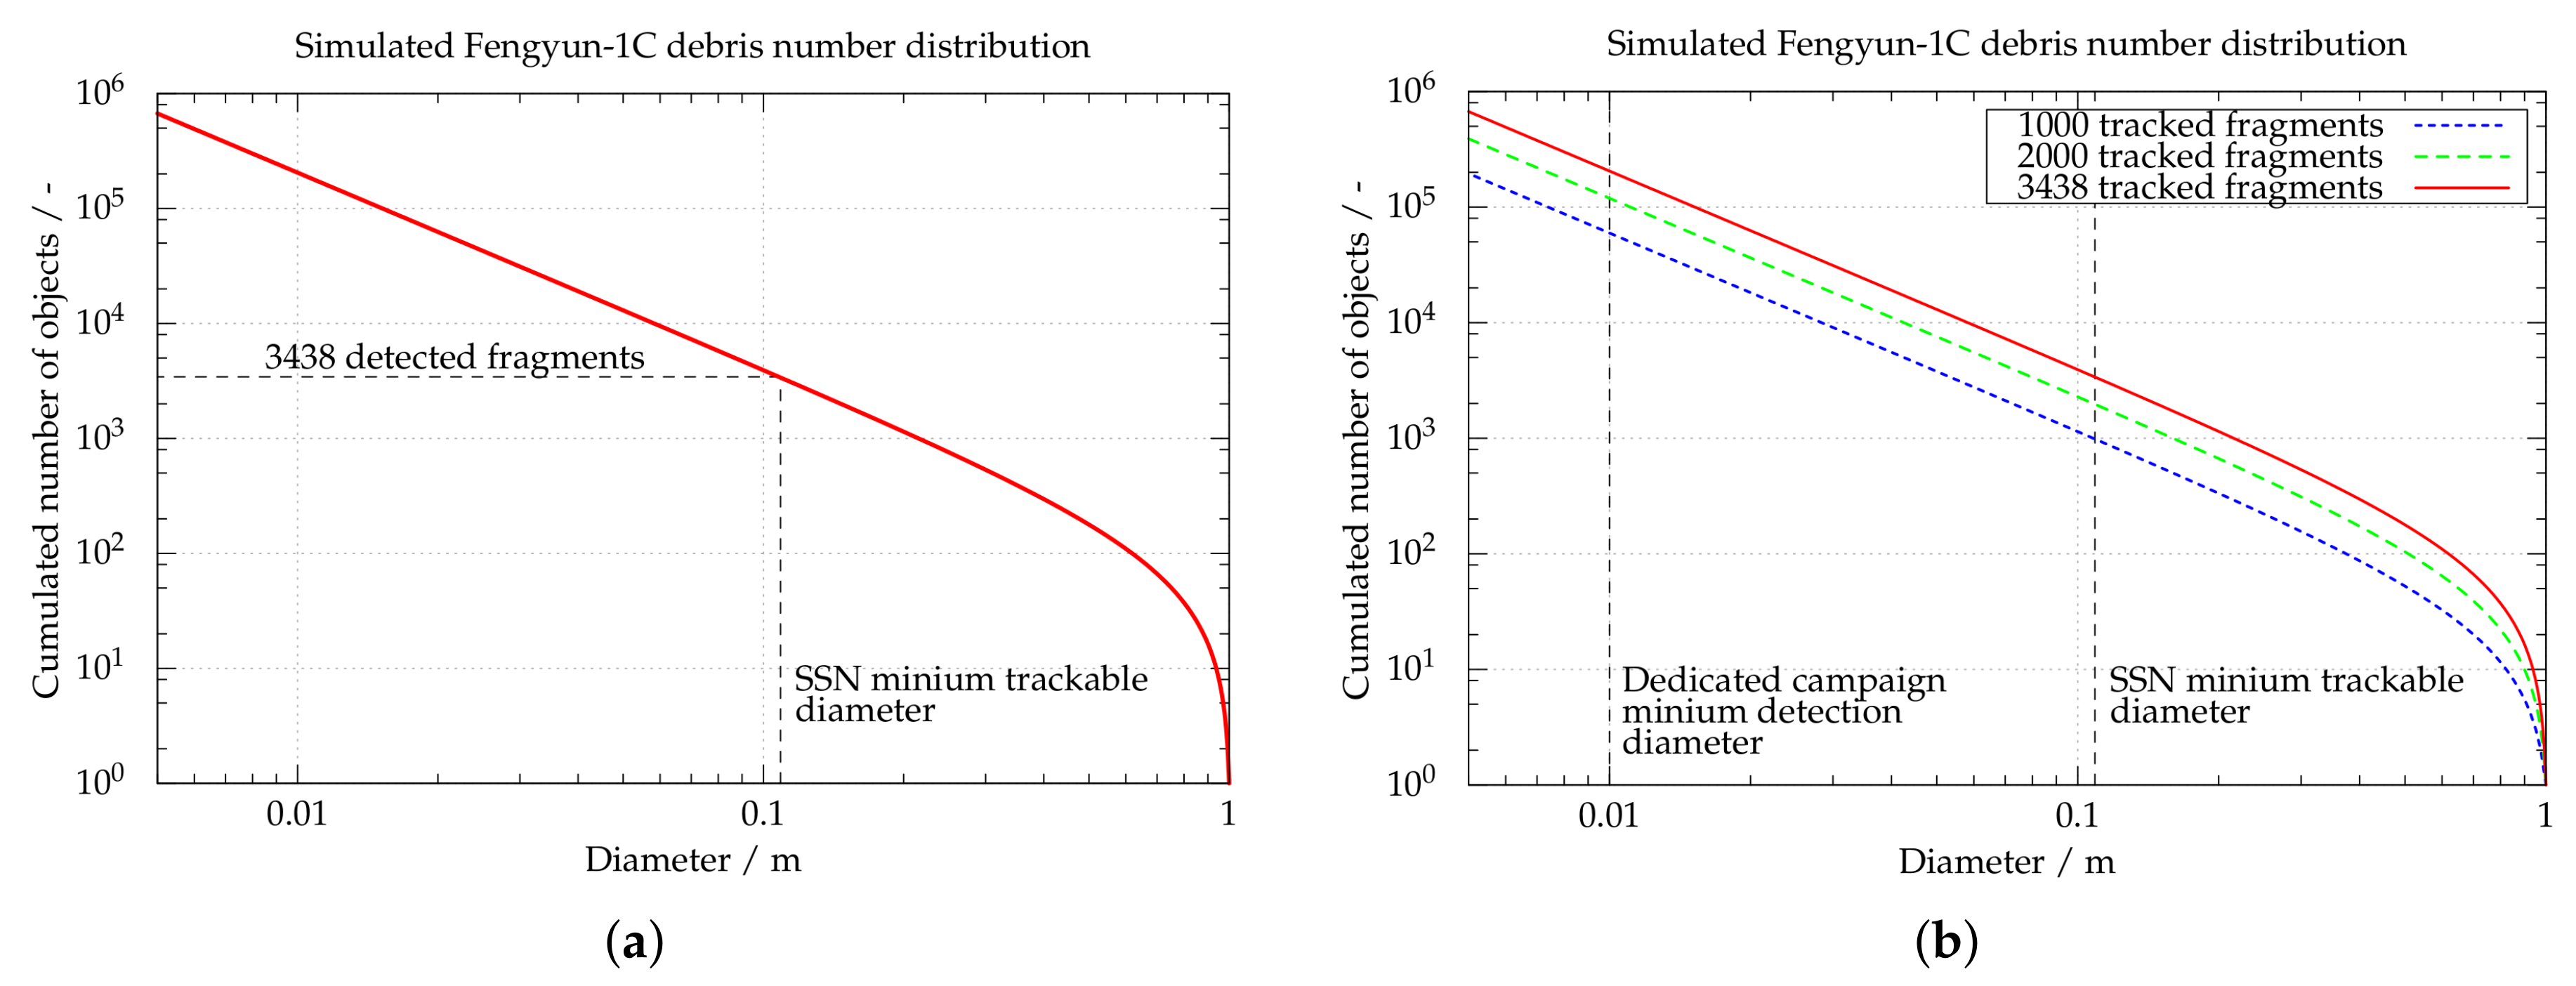
| Epoch | Total Simulated Number of Objects | |
|---|---|---|
| d > 1 cm | d > 10 cm | |
| 2007 | 60,000 | 1000 |
| 2009 | 120,000 | 2000 |
| 2018 | 204,000 | 3438 |
© 2018 by the authors. Licensee MDPI, Basel, Switzerland. This article is an open access article distributed under the terms and conditions of the Creative Commons Attribution (CC BY) license (http://creativecommons.org/licenses/by/4.0/).
Share and Cite
Horstmann, A.; Kebschull, C.; Müller, S.; Gamper, E.; Hesselbach, S.; Soggeberg, K.; Ben Larbi, M.K.; Becker, M.; Lorenz, J.; Wiedemann, C.; et al. Survey of the Current Activities in the Field of Modeling the Space Debris Environment at TU Braunschweig. Aerospace 2018, 5, 37. https://doi.org/10.3390/aerospace5020037
Horstmann A, Kebschull C, Müller S, Gamper E, Hesselbach S, Soggeberg K, Ben Larbi MK, Becker M, Lorenz J, Wiedemann C, et al. Survey of the Current Activities in the Field of Modeling the Space Debris Environment at TU Braunschweig. Aerospace. 2018; 5(2):37. https://doi.org/10.3390/aerospace5020037
Chicago/Turabian StyleHorstmann, André, Christopher Kebschull, Sven Müller, Eduard Gamper, Sebastian Hesselbach, Kerstin Soggeberg, Mohamed Khalil Ben Larbi, Marcel Becker, Jürgen Lorenz, Carsten Wiedemann, and et al. 2018. "Survey of the Current Activities in the Field of Modeling the Space Debris Environment at TU Braunschweig" Aerospace 5, no. 2: 37. https://doi.org/10.3390/aerospace5020037