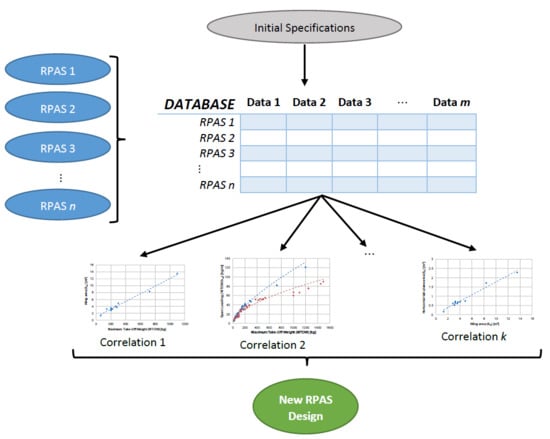
The results and conclusions obtained upon completing the database and categorizing the information can be divided in two parts: in the first one, regarding the study of design tendencies, the process that has been followed has been to classify the information according to various relevant aspects of design that were exposed in the end of the previous section, and then checking which categorizations are more extended in the state-of-the-art of RPAS. This information can serve as basis for the conceptual design phase of a project, in which several configurations and options are being considered as potential designs, as having some design guidelines can assist in this process. In the second part, for the category of H-tail RPAS, in which the sample of aircraft can guarantee a high level of fidelity, a conceptual design approach of rapid sizing has been proposed.
3.1. General Design Tendencies
Attending to the categories which have been used to organize the information present in the database, the RPAS have been sorted attending to these criteria.
Table 1 illustrates the number of aircraft in each category when organized by aerodynamic configuration and MTOW range.
The first conclusion that can be obtained from this information is the identification of those categories for which the development of a design method based on statistical correlations can be feasible. The categories of conventional tail, T-tail, V-tail, H-tail, and tailless are the ones for which more information is available, which in turn signifies that a larger sample for the statistical study is available. Therefore, these groups will be considered in the second section of the discussion for the analysis of possible rapid-sizing methods. Another significant conclusion that can be deduced from these numbers is that these are the most commonly used aerodynamic configurations for RPAS design, whereas the rest of configurations considered serve more particular purposes and have not yet been expanded upon as much in this field. Regarding the MTOW, it is also noteworthy that most of the models included in the database could be classified as lightweight and middleweight RPAS. This is coherent in the sense that most of the missions conducted by these aircraft can be carried out with light payloads, and a result, the overall weight of the aircraft is relatively low. Additionally, many RPAS projects tend to exploit the characteristic of having a remote pilot and carrying no passengers, and a result the equipment related to cabin conditioning and evacuation systems, amongst others, can be neglected, resulting in aircraft with lower weight than that which would be feasible with humans on board. The further study of this category of RPAS could prove valuable, since it has been noted that studies conducted in the US show that the sector of RPAS below 25 kg of MTOW is very dynamic and their growth is expected to accelerate over the next few years [
7]. In fact, it has been noted that many of the small RPAS designs correspond to the first projects of small and medium enterprises which are starting their development in the civilian RPAS market [
25].
Attending to the cross-examination of the information regarding the MTOW range and aerodynamic configuration provided by the table, it is possible to extract several conclusions on the design tendencies of RPAS. As can be seen, the configurations of conventional tail and T-tail are employed in a notable number of lightweight RPAS, but in turn, they are less frequently used for heavier aircraft. The extended use of the T-tail is of special interest, since it tends to be used in aircraft with twin engines attached to the rear fuselage. This situation, however, is not applicable in most RPAS, since the vast majority of these aircraft have only a single engine. Even so, this tail configuration is relatively common in lightweight RPAS. This may be due to the recovery of most of these aircraft consisting in a belly landing or deep stall maneuver, which are feasible in this kind of RPAS.
In the case of higher-weight aircraft, these configurations are not employed as often compared to the V-tail and H-tail configurations. In the case of the T-tail configuration, the belly landing is no longer feasible due to the high weight of the aircraft, nor is the aforementioned engine integration possible, as these RPAS still carry in most cases only one engine. The main advantages it presents cannot be taken advantage of, and so other tail configurations are selected above this one. Engine integration could be one of the main reasons for this choice, since, having a single engine, the frontal tractor position could potentially interfere with the payload, whereas its integration in the tail cone could prove difficult due to the presence of the tail structure. In the case of the H-tail configuration, this problem is solved through the use of tail booms, which allow the positioning of the tail surfaces after the end of the fuselage. Also, in certain scenarios of V-tail RPAS, the space between both tail surfaces allows for a relatively direct integration of a turbo engine. It should also be taken into account that the preference for other tail layouts could be due to the fact that they have already been employed in similar RPAS and are preferred by the manufacturers due to the experience they have already gained working with these configurations in previous projects.
Following on the discussion developed in the previous paragraph, the V-tail and H-tail also show a significant use in RPAS. It is noteworthy to check that the V-tail configuration is commonly employed in all MTOW range categories. However, H-tails tend to be used in the higher MTOW ranges. As stated in the work of previous authors [
12], the objective of the V-tail is to reduce the wetted area, and with this, the aerodynamic drag. This tail encompasses the missions of both traditional HTP and VTP surfaces simultaneously, which also implies that the complexity of control is increased. This is the reason for the problem of adverse coupling between yaw and roll due to the deflection of the tail control surfaces that occurs in this configuration [
12].
The higher level of aerodynamic and structural complexity that this configuration involves may explain why it is not used as often in lightweight RPAS compared to conventional and T-tail configurations, even though it still represents a significant category within the study population. In the case of aircraft that land with a belly landing maneuver, this configuration proves advantageous, as in the case of the T-tail, since the dihedral angle would prevent a collision of the aerodynamic surfaces with the ground in the case that a roll perturbation occurs. It is feasible to deduce that this may be the reason for the notable use of this configuration in small RPAS, even though the conventional and T-tail layouts are preferred. It is also significant to note that many V-tail configurations also employ tail booms in which the rear aerodynamic surfaces are located, instead of being joined directly to the fuselage. The reasons behind this preference are discussed in the following paragraphs along with the H-tail.
The frequent use of the H-tail, which in most cases also involves tail booms, in these aircraft is also remarkable. The use of various vertical tail surfaces is common in those cases in which the dimensions of a single vertical tail-plane could be considered excessive, especially in terms of the aircraft fitting in certain spaces such as hangars. This motivation is meaningful in the field of RPAS, as many of them are usually transported in vehicles that also serve the purpose of Ground Control Systems (GCS). This means that the capacity to fit the aircraft into a movable container is vital in order to deploy the RPA where the mission will take place, hence the importance of reducing the dimensions of the aircraft. On the other hand, the H-tail usually is heavier than the equivalent single VTP tail. This may explain why, contrary to the V-tail case, this configuration is reserved for heavier aircraft, as in smaller RPAS, the weight addition and more complex design of this tail compared to a simpler conventional tail cannot justify its selection. Opposite to this scenario, in heavier aircraft, the weight difference is not significant, and the dimensions can start restricting the transportation, therefore opting for the H-tail.
Regarding the use of tail booms, several RPAS designs employ them in order to connect the tail surfaces with the rest of the aircraft rather than joining them directly to the fuselage. The reason for their relatively frequent use in RPAS could be due to the characteristics of the payloads employed for the variety of missions that these aircraft develop. It can be assumed that most times, the payload along with the fuel can fit in a relatively modest fuselage. However, the tail surfaces still need to be located at a certain distance of the center of gravity in order to provide the necessary aerodynamic moment for the stabilization and control of the aircraft. Instead of extending the fuselage, which is not usually needed since the equipment and fuel fits in a shorter cabin, and as it would add both additional weight and wet surface, the latter of which results in increased drag, tail booms are fitted in the wing or the fuselage, which extend further from the end of the fuselage in order to position the tail surfaces. Additionally, if the presence of a camera or other payload in the front fuselage is being considered in the design, which is also common in RPAS, as there is usually a need of a camera in order to monitor the aircraft operation, the propeller preferably installed in the rear of the aircraft. This provides a good fit for the mentioned configuration, as the propeller can energize the aerodynamic flow, producing an increase in the dynamic pressure on the tail-planes and allowing to obtain higher aerodynamic forces with the same surface than a tail that does not benefit from this effect [
26]. Furthermore, recalling the engine integration discussion, the use of tail booms allows for more volume of the rear fuselage to be available for housing the engine and propeller than a conventional union of the tail surfaces to the fuselage. Another effect that the propeller has in this position is the reduction of base drag caused by the fuselage end.
The relatively frequent use of the tailless configuration in RPAS should also be expanded upon. However, this categorization is not quite as homogeneous as the others, as there are different design approaches that have been included in this category, from all-wing configurations without a defined fuselage to hybrid flying wings, including intermediate blended-wing-body models. Most of the drawbacks that this configuration present in manned passenger aircraft, such as those relative to evacuation, high angle of attack of the aircraft, and pressurization, are irrelevant in a remotely piloted aircraft that does not carry humans on board [
27]. The capacity to avoid these negative aspects, along with the advantages of this layout, such as lower wet surface that in turn results in drag reduction, can explain the frequent use of this configuration in RPAS, which can be observed is more extended in the case of low weight aircraft.
Other aerodynamic configurations have also been tested in RPAS. However, as can be seen in the table, they have not yet benefited from frequent use and are mostly related to experimental projects and particular cases.
Table 2 presents the number of aircraft sorted both by MTOW and engine type.
Table 2, along with
Table 1, could allow us to, in the case the value of MTOW is known, select the most common engine type and aerodynamic configuration for the early design phases of the RPAS. In the case of the engine type, electric motors dominate the category of low weight aircraft. This is due to the ease of acquisition of small brushless motors, which are in most cases the type of power plant employed to drive the propellers of small RPAS, since the level of thrust required by these aircraft is appreciatively lower than that of heavier aircraft. This can be deduced from the horizontal equilibrium equation in cruise flight, which relates the thrust provided by the engines with the drag of the aircraft, being the values of both forces comparable. The latter is expected to be lower in lighter RPAS due to them presenting a reduced airframe, and therefore the power output provided by electric motors is enough to justify their selection. Even though these could also be equipped on large aircraft, the power demand would be higher due to the increased drag, and therefore, the batteries would need to have very high specific capacity in order to provide the necessary power output while not penalizing the weight of the aircraft. This is the reason for electric motors not being commonly used in larger aircraft. This relation amongst MTOW, thrust and drag will be further expanded on in the proposed rapid-sizing method. In contrast with the former arguments, the endurance that can be achieved with these power plants is in most cases much less than that which could be obtained with piston engines, these being more complex and costly than electric motors. Therefore, these small and light aircraft usually develop low endurance missions, and the capacity to change batteries, which are easily carried and swapped for others, allows the mission time to be extended. However, for heavier aircraft, they are impractical, since the weight and number of batteries needed to provide the necessary thrust becomes such that the designers opt for other alternatives. The few electric motors that can be observed in heavier aircraft actually correspond to solar powered RPAS. The investigation on long-endurance aircraft powered with solar energy is still ongoing, and they still constitute a minority amongst the other types.
Moving on to higher weight RPAS, it can be observed that the electric motors are replaced with piston engines. These are generally piston engines, with a variable number of cylinders, that move a propeller. However, rotary engines are also equipped in many RPAS, mainly those of higher weight. Piston engines usually allow for higher endurance missions and constitute the engine category most frequently used in RPAS, since the specific fuel consumption is usually lower than the discharge rate of Lithium-Polymer batteries often used in conjunction with electric motors, allowing for more operation time. Most of the missions that these aircraft carry out, such as surveillance or monitoring, do not require a cruise speed such that transonic effects appear at the tip of the propeller blades. Therefore, the combination of a piston engine and a propeller constitutes the most common selection, being coherent with the moderate endurance and cruise speed mission requisites.
Regarding the category of highest MTOW, both turbo engines and piston engines have been employed as propulsion systems. The use of turbo engines such as turbojets and turbofans in RPAS is reserved for the larger and heavier aircraft, usually military models which can fly at high speeds, even reaching values of Mach number (M) of M = 0.8, as these engines have a much more efficient performance at these flight speeds than propulsion systems based on propellers, save for turboprops, which have also been equipped on RPAS flying at speeds around M = 0.6. These were also included in the turbo engine category in
Table 2. In the case of these military RPAS, cruise speed is most often crucial in the missions they carry out, and as such, a different alternative to the piston engine driving a propeller is required.
Therefore, it can be concluded that the value of MTOW can provide an early approximation to the type of engine which could be equipped on the aircraft, considering the mission speed to be expected depending on the mission in order to check the viability of the selected power plant.
3.2. Rapid-Design Method Based on Correlations for H-Tail RPAS
Having analyzed the characteristics of the resulting database, such as the number of aircraft in each category and the most relevant configurations in RPAS, the next step consists in the development of a rapid design method based in statistical correlations. Upon organizing the database and analyzing the results when establishing general correlations, it has been noted that the aerodynamic configuration is the characteristic that affects the most the results of the parameter dependency analysis. Therefore, the approach that has been considered in this study has been to segment the statistical population into different groups according to the aerodynamic configuration and to study the correlations separately for each of them.
Amongst the considered categories, the most relevant ones in the database, as noted formerly, are the following: conventional tail, T-tail, V-tail, H-tail, and tailless. The last of them, which encompasses all RPAS without a distinguishable tail, is not as homogeneous as the other categories, presenting a diversity of fuselage-wing unions and very different wing planforms. Therefore, significant correlations between the parameters considered have not been obtained so far. The case of the V-tail configuration is similar, as even though it includes a greater number of aircraft, the considerable presence of this configuration in all ranges of MTOW, and the different forms in which to incorporate the V-tail consequently scatter these sub-categories in the dependency analysis. Different ways in which the V-tail can be observed include upward or downward V-tail joined to the fuselage, upward or downward V-tail with a tail boom, or a downward V-tail with twin booms. Regarding the conventional and T-tail configurations, the database would have to be expanded upon in order to facilitate obtaining accurate correlations, since for these categories, not many three-view drawings have been found, and as such, there is little information regarding the tail surfaces in the database so far, since the parameters relative to these surfaces are not usually found in the open literature, making it necessary to measure them in an adequate image.
This leaves the H-tail layout, which in turn presents a favorable set of characteristics regarding the study of a design method. The aircraft included in this category are more homogeneous than those of the other, consisting in a fuselage and twin booms to which the tail surfaces are attached. These consist of an HTP joined to both booms and twin vertical tail-planes usually found at the end of the horizontal tail-plane. The configuration is mostly used for higher MTOW aircraft, which are also more uniform than lightweight ones, and the type of engine equipped is predominantly the piston engine. Furthermore, many aircraft in the database are included in this category, so the sample of study is also sufficiently large.
Attending to these criteria, the H-tail configuration has been selected in order to develop a rapid design method for the first phases of the RPAS project. The objective is to design the main aerodynamic surfaces (wing, HTP, and VTP) employing statistical correlations obtained from the database. In most correlations, not as many points as aircraft contained in the group will be observed, since, as mentioned beforehand, specific parameters relative to the tail surfaces could not be obtained except through measurement in three-view drawings. Also, in the case where the measurement criteria employed by the source could not be checked, the data have been omitted, so as to reduce the scatter in the correlations. For instance, this occurs in the measuring of the wing surface (Sw), since depending on the source, the portion that is located inside the fuselage can be computed by different means. This decision has also lead to the presence of less aircraft in the correlations. However, it can be assumed that, by reassuring that the same criteria of measurement is used in all aircraft, the results can be more accurate. As will be seen in the correlations, most of the aircraft that have been analyzed are comprised in the range of 100 kg and 300 kg of MTOW, whereas two of the RPAS are located at higher MTOW values.
To start the design process, it is necessary to define which parameters can be considered design specifications. That is, this information constitutes the basis of the design and can be considered as an input in the process. These specifications will be MTOW, endurance, and the expected cruise speed (Vc), which will depend on the type of mission. The value of MTOW can be a significant design parameter due to the differences between the regulations applied to these aircraft depending on this characteristic, and it is also coherent with the categorization developed in the database analysis. The endurance and cruise speed are related to the mission that the aircraft has to accomplish, so it is also reasonable to set both as design parameters in order to guarantee that the RPAS can develop the mission for which it was designed.
From this point on, the different correlations which constitute the design process will be proposed and developed upon.
3.2.1. Wing Design
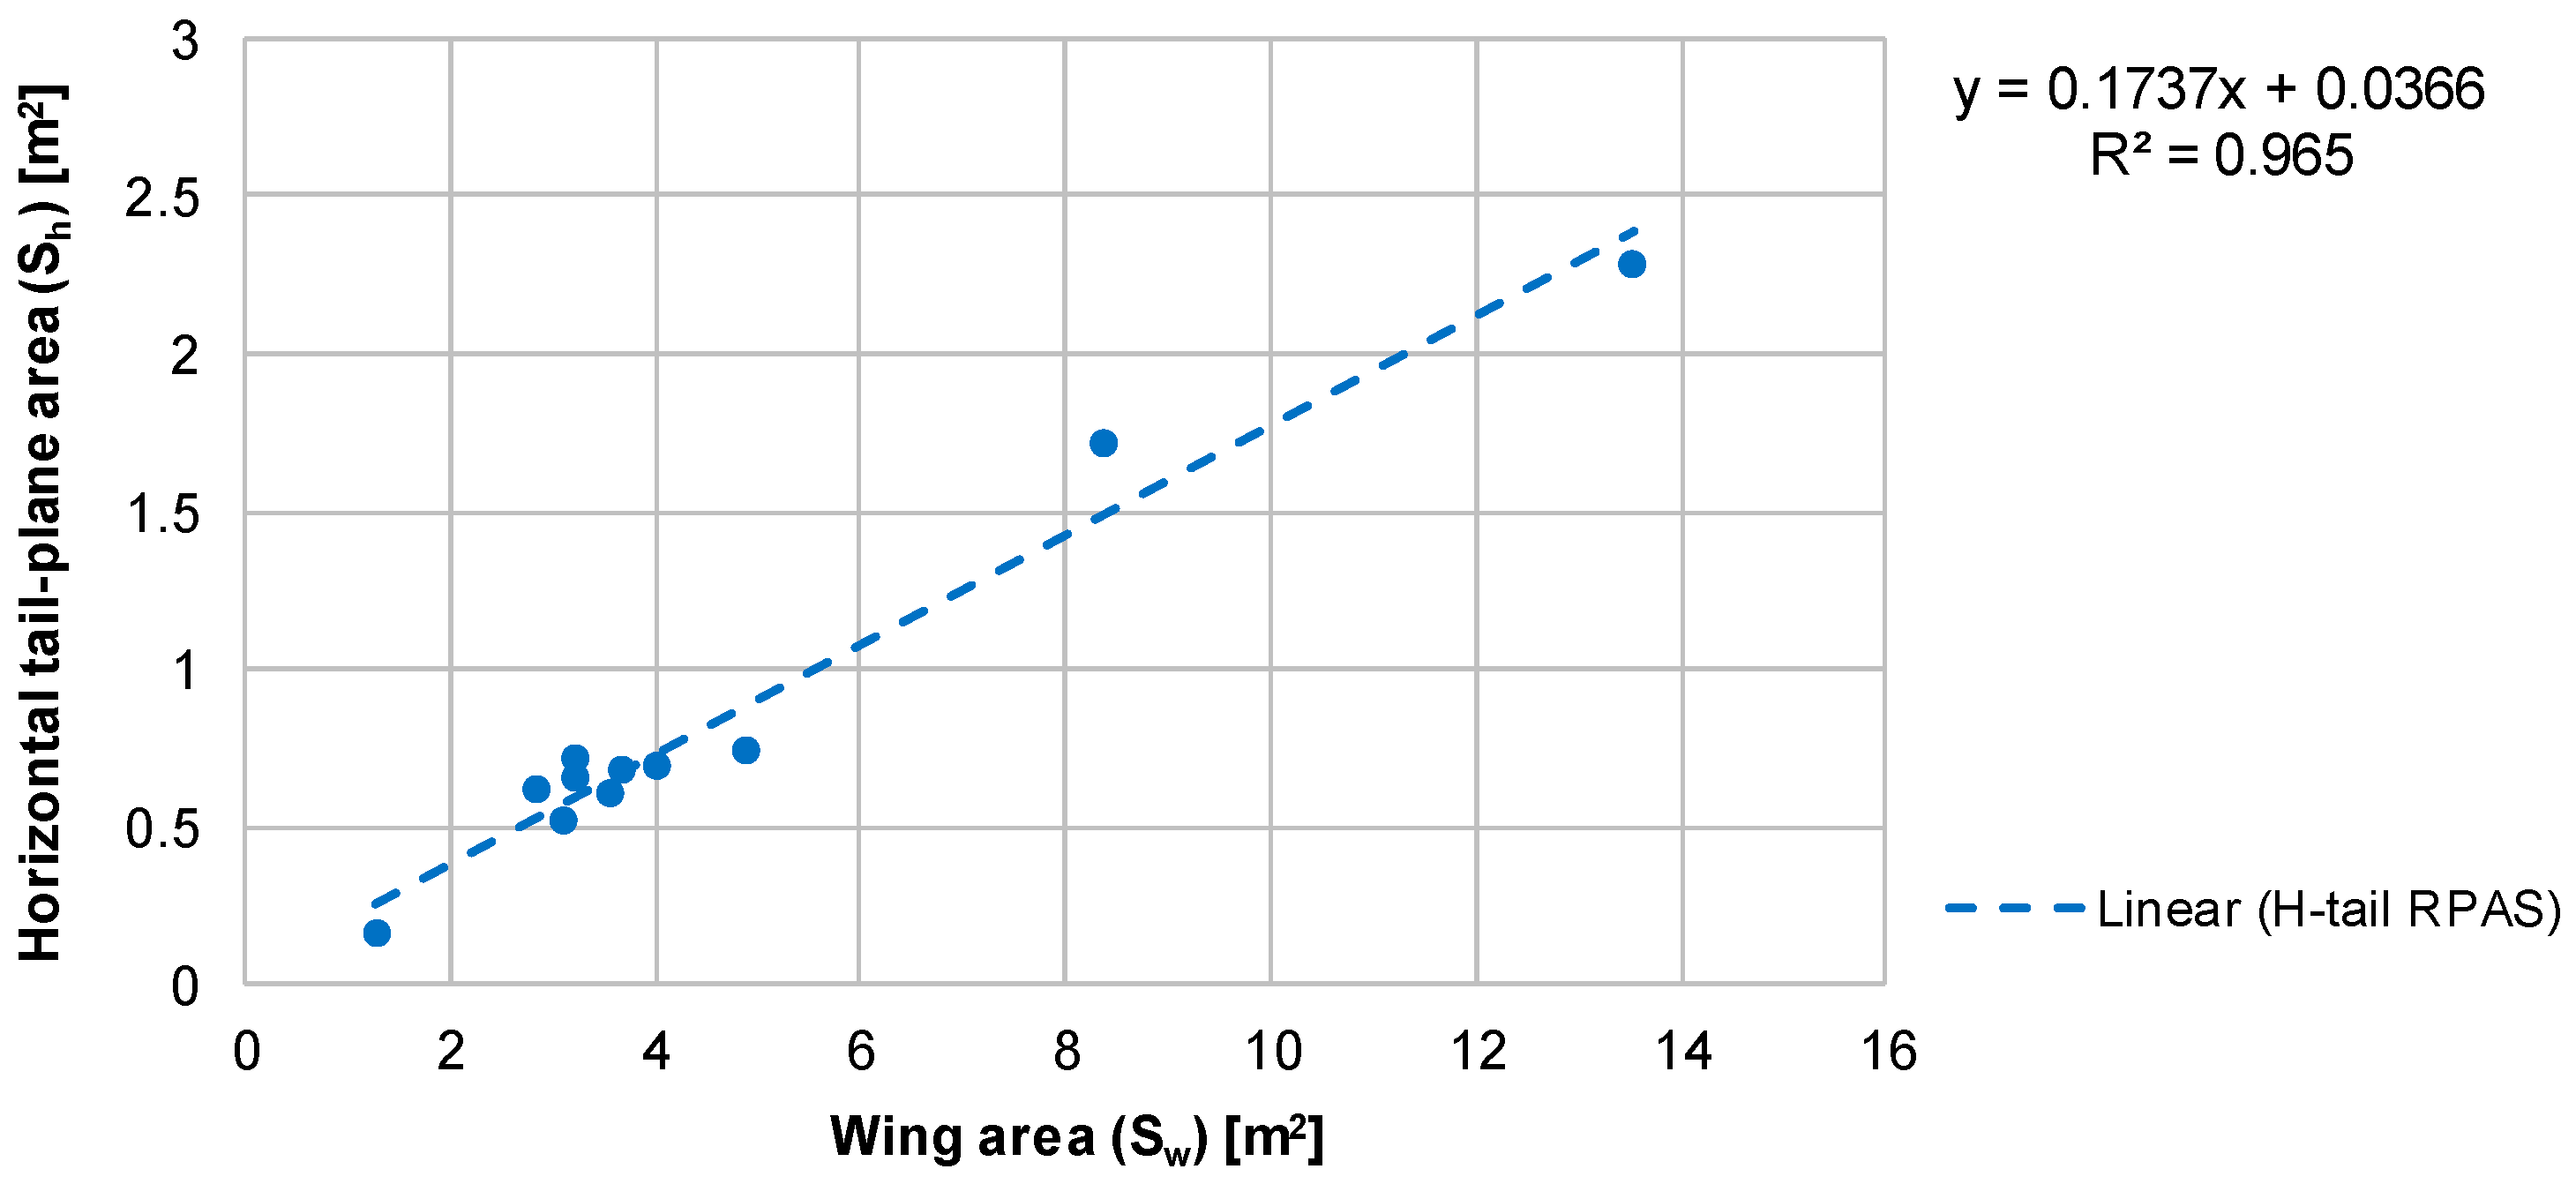
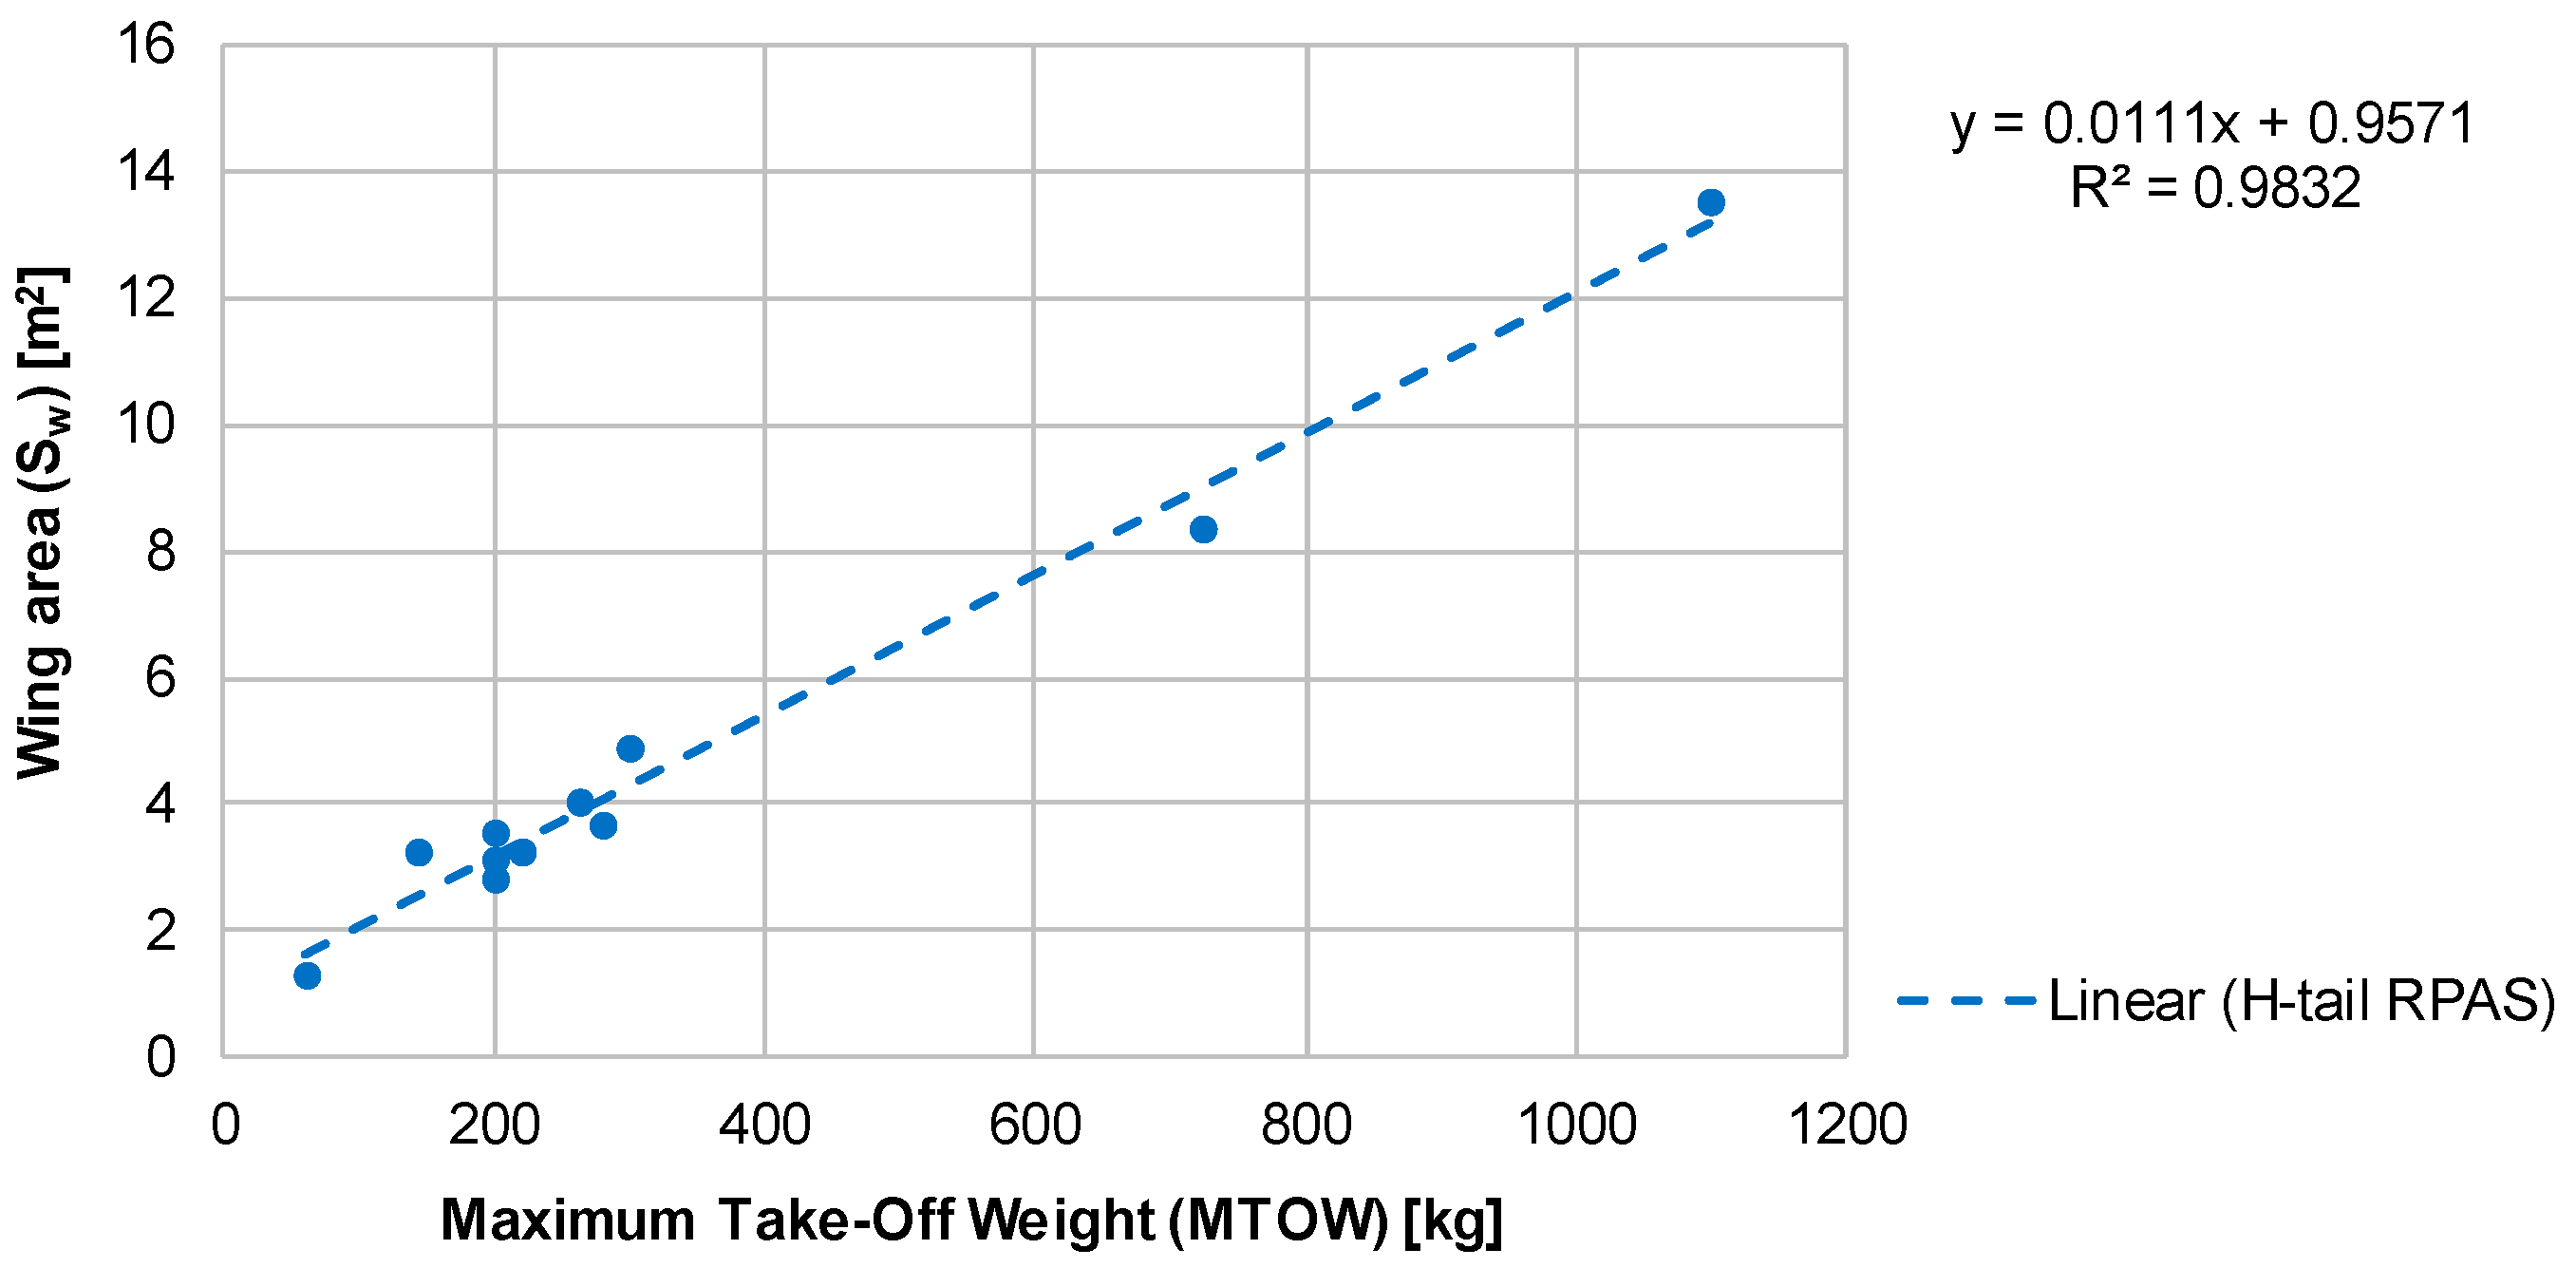
The first step of the design process consists in obtaining the value of the wing area, S
w. The correlation presented in
Figure 2 establishes a relationship between the value of MTOW and S
w, which has been represented as a linear equation, such as those presented by other authors [
13,
16]. This correlation is based on the wing loading parameter, defined as the ratio between the value of MTOW and the wing surface, which affects many design characteristics of the aircraft, such as the design point when compared to the thrust-weight ratio and the response to vertical gusts.
In order to obtain the wingspan (b
w), the wing induced drag parameter, expressed previously in Equation (2), will be employed. In the aforementioned equation, it can be seen that the induced drag is in relation to the Aspect Ratio (AR
w) of the wing, and thus it is connected to the value of the wingspan (b
w). Wings with larger values of AR
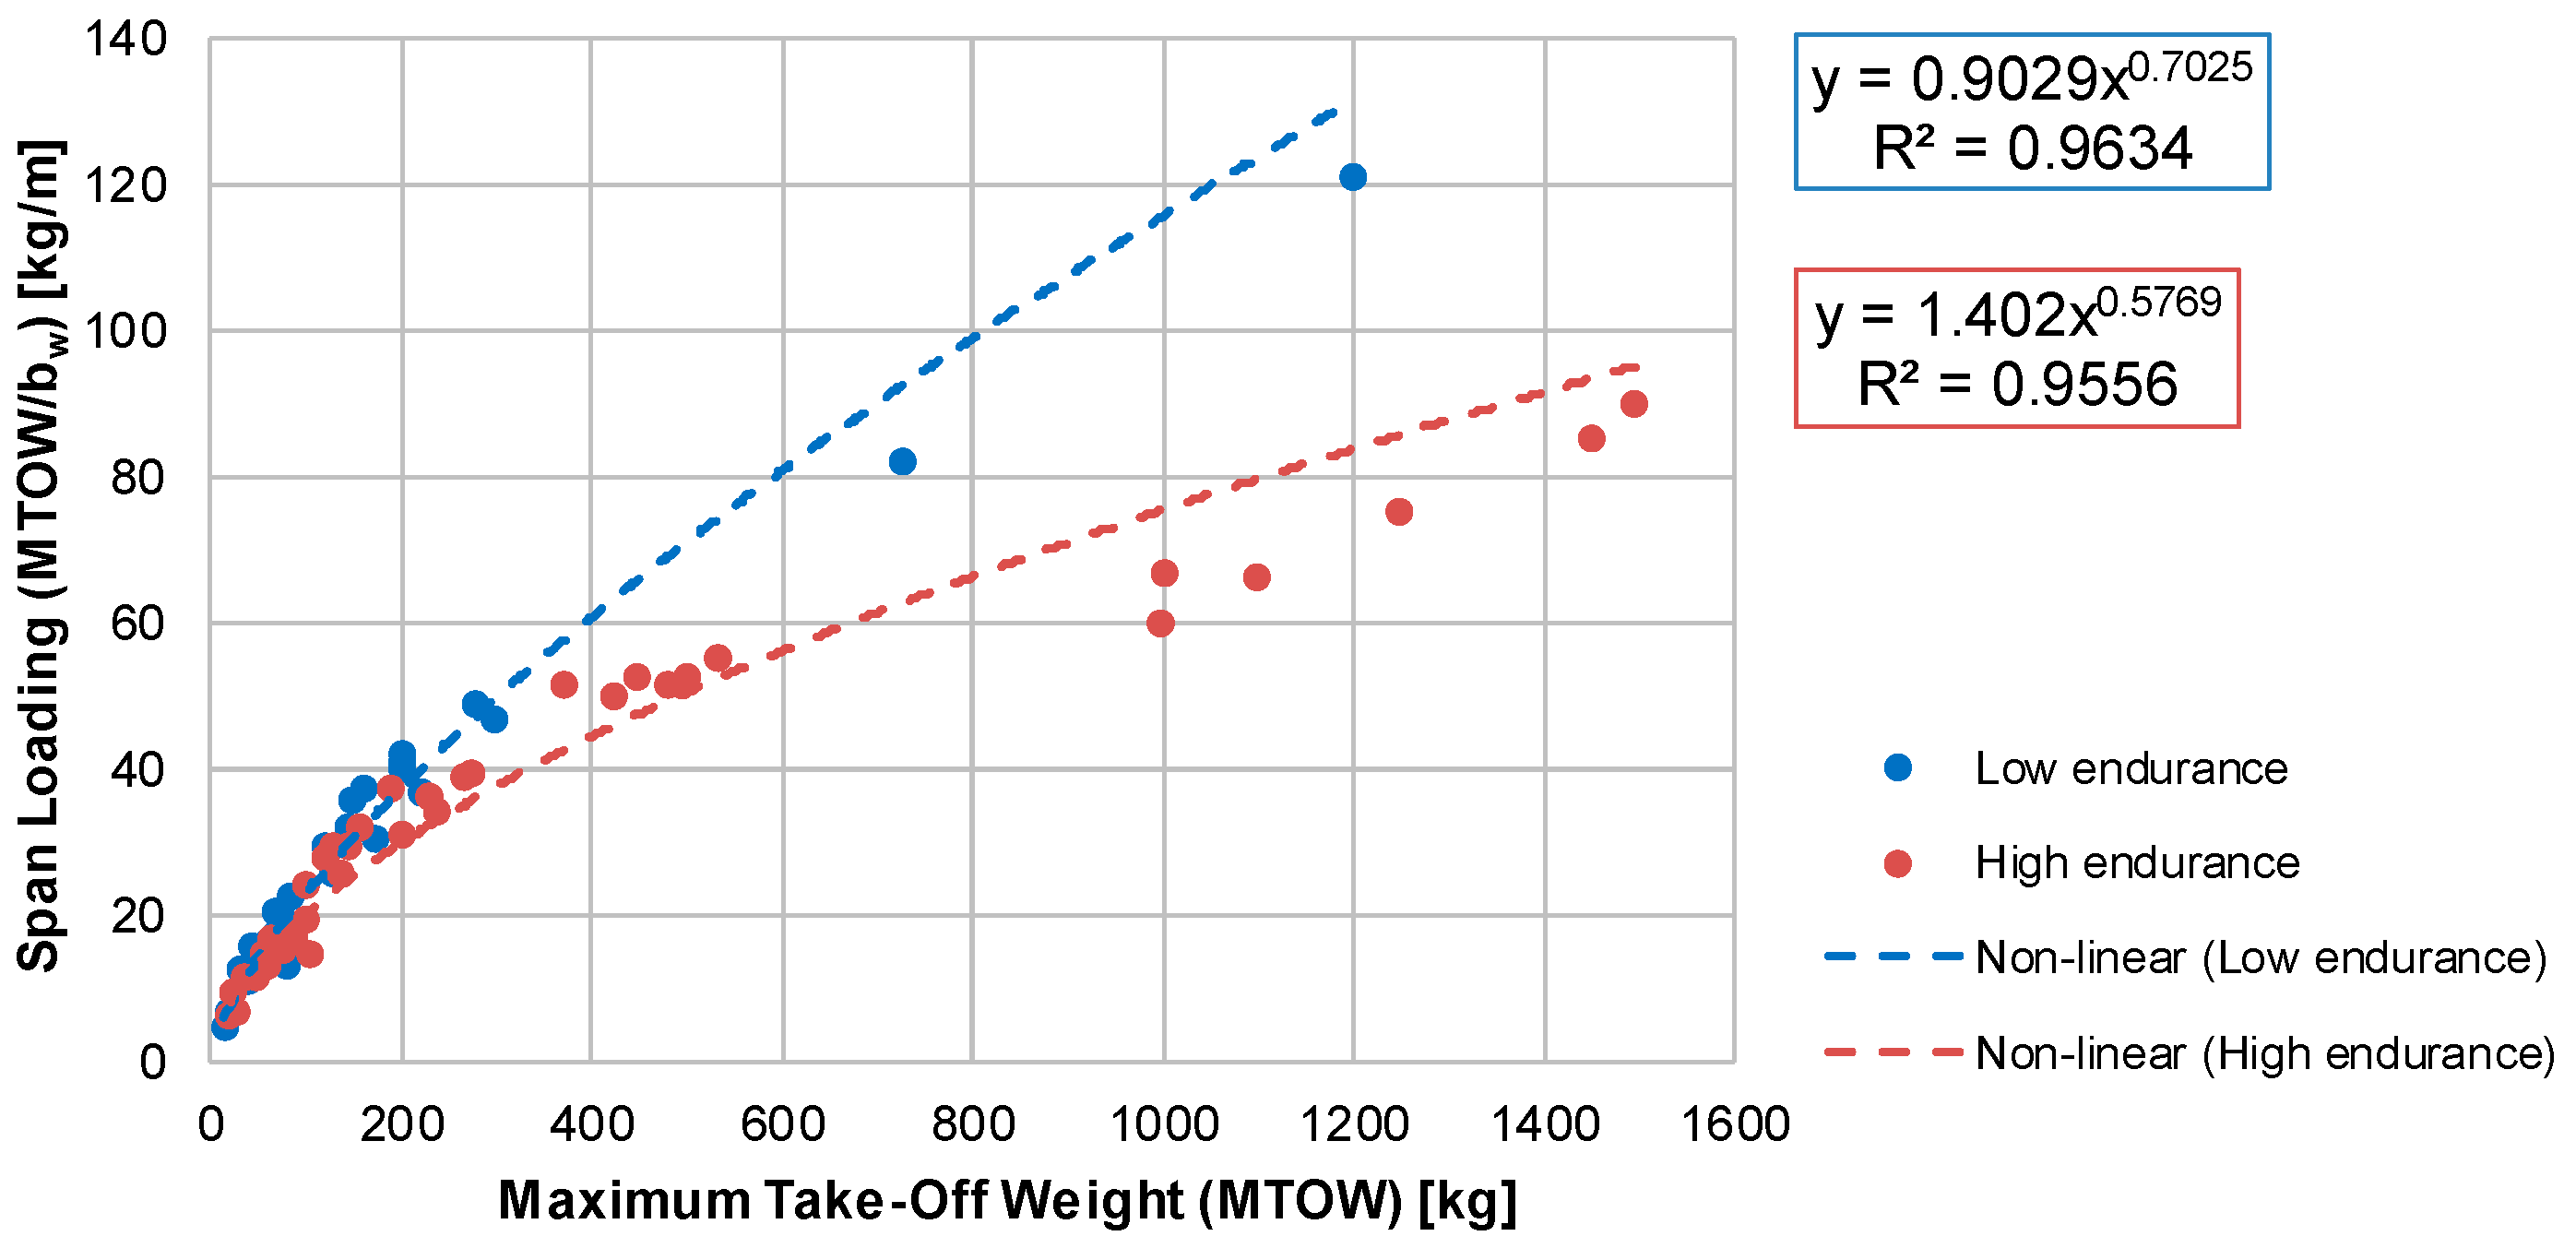
w will have lower induced drag, which consequently benefits the flight endurance of the aircraft, as it will be reflected in the following regression. In order to connect this expression with the parameters that are known at this step of the design process, the value of the induced drag can be related to the weight of the aircraft, as reasonably, heavier RPAS are expected to present an increased drag resulting from a larger airframe. Therefore, this parameter links the value of MTOW to the wingspan, and so the correlation presented in
Figure 3 has been built comparing the value of MTOW to the ratio between this weight and b
w. This correlation is similar to those employed in previous works to size the wingspan [
21].
It can be seen that the aircraft follow two different tendencies, according to the endurance selected in the design specifications. Generally, aircraft with higher endurance present a lower induced drag ratio, since their wingspan is larger than those that have less endurance. This is coherent with the fact that wings with larger Aspect Ratios have reduced values of the induced drag, as seen in Equation (2). In order to determine the group that the design aircraft belongs to, the reference presented in
Table 3 can be consulted. This classification establishes an endurance threshold which, depending on the value of MTOW, determines whether an aircraft is to be included in the high endurance correlation or the low endurance one. This endurance threshold varies depending on the value of MTOW since larger aircraft have more fuel capacity, and therefore it is more feasible to obtain high values of endurance, even with larger values of induced drag due to low values of AR
w.
Having obtained both Sw and bw, in order to define the chord distribution of the wing, the value of the taper ratio (λw) must be estimated. It has been observed that the taper ratio of the RPAS object of this study present significant scatter, ranging from constant chord wings to highly tapered ones. However, when classifying the aircraft in four groups regarding different design and performance parameters that are related to the taper ratio, it can be observed that each of them contains RPAS with similar tapered wings.
The parameters that have been used to classify the aircraft in these groups are related to the characteristics influenced by the taper ratio. One of the main reasons for the addition of taper to wings is to avoid high bending root moments [
10]. As was seen in the S
w–MTOW correlation, the value of MTOW can provide a general idea on the size of the wing, and therefore, the aerodynamic forces that will appear. This can explain why for high MTOW aircraft, wings tend to show significant taper. The Aspect Ratio and Span Loading parameters are both also related to this characteristic, since they also provide an idea on the dimensions of the wing, and more specifically, its span compared to the surface and the MTOW, respectively. Regarding the performance parameters, their selection was made as means of measuring the difference in induced drag that a tapered wing presents compared to an untapered one [
12]. Therefore, it can be expected that tapered wings will have more endurance and higher cruise speeds precisely due to the drag reduction, since the lift distribution becomes more similar to an elliptical distribution, which is the lift distribution that provides a lower value of induced drag.
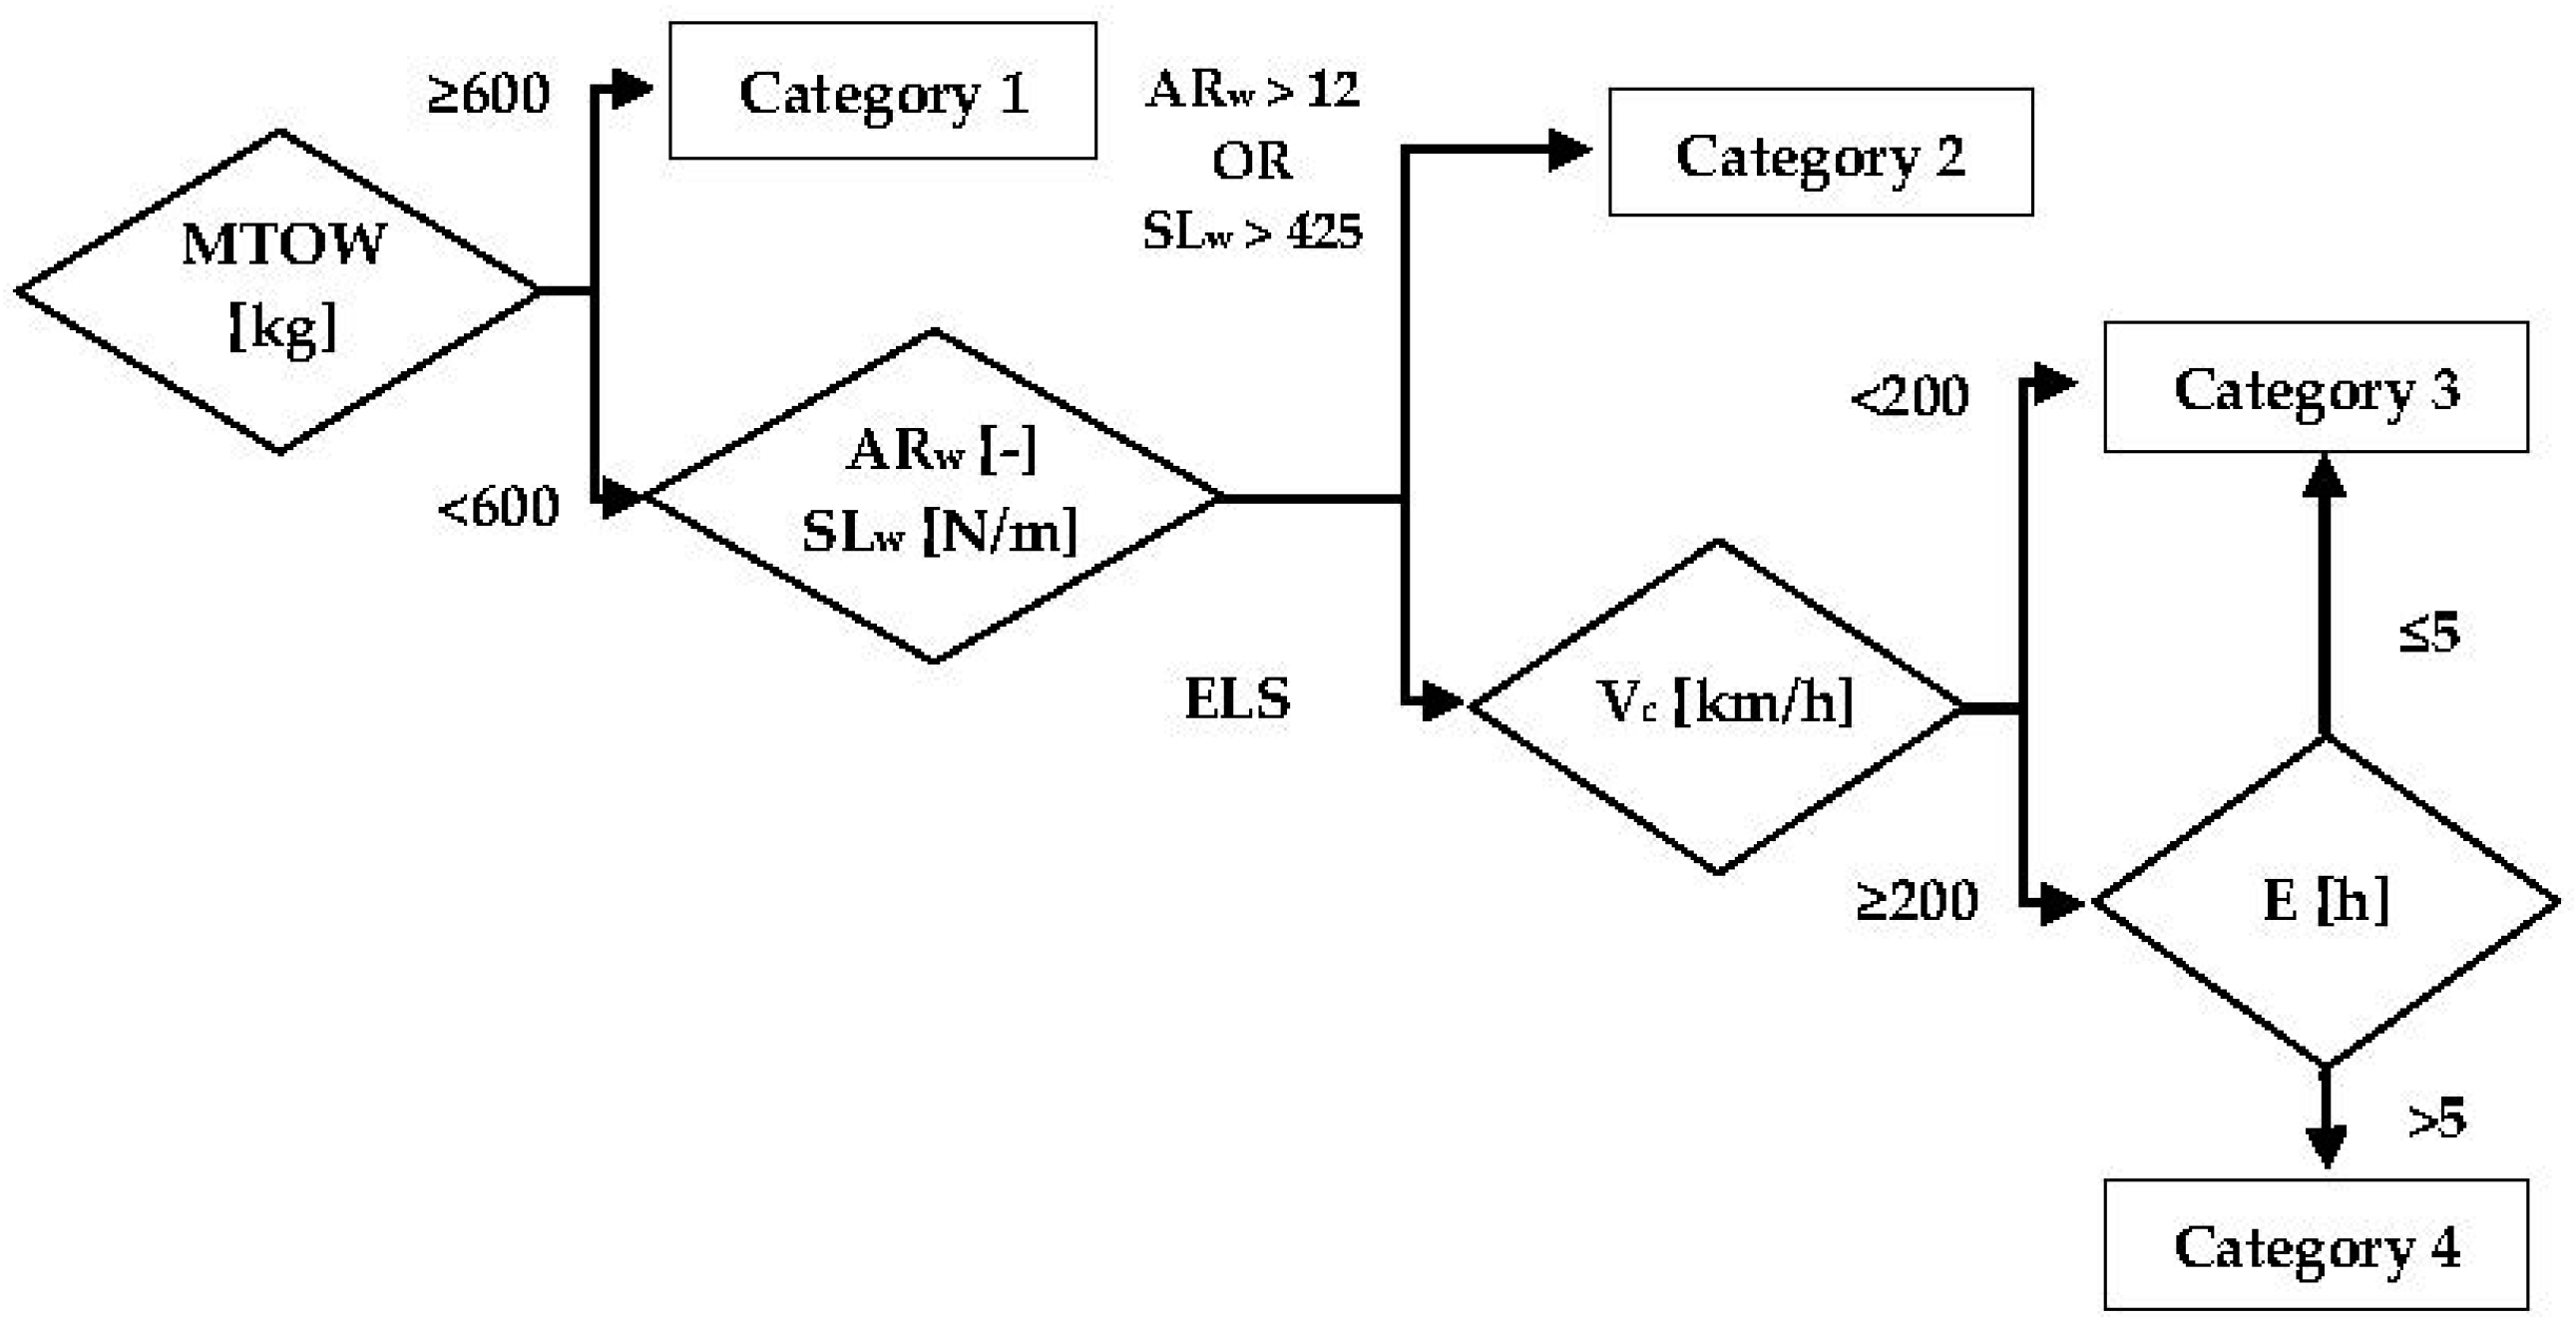
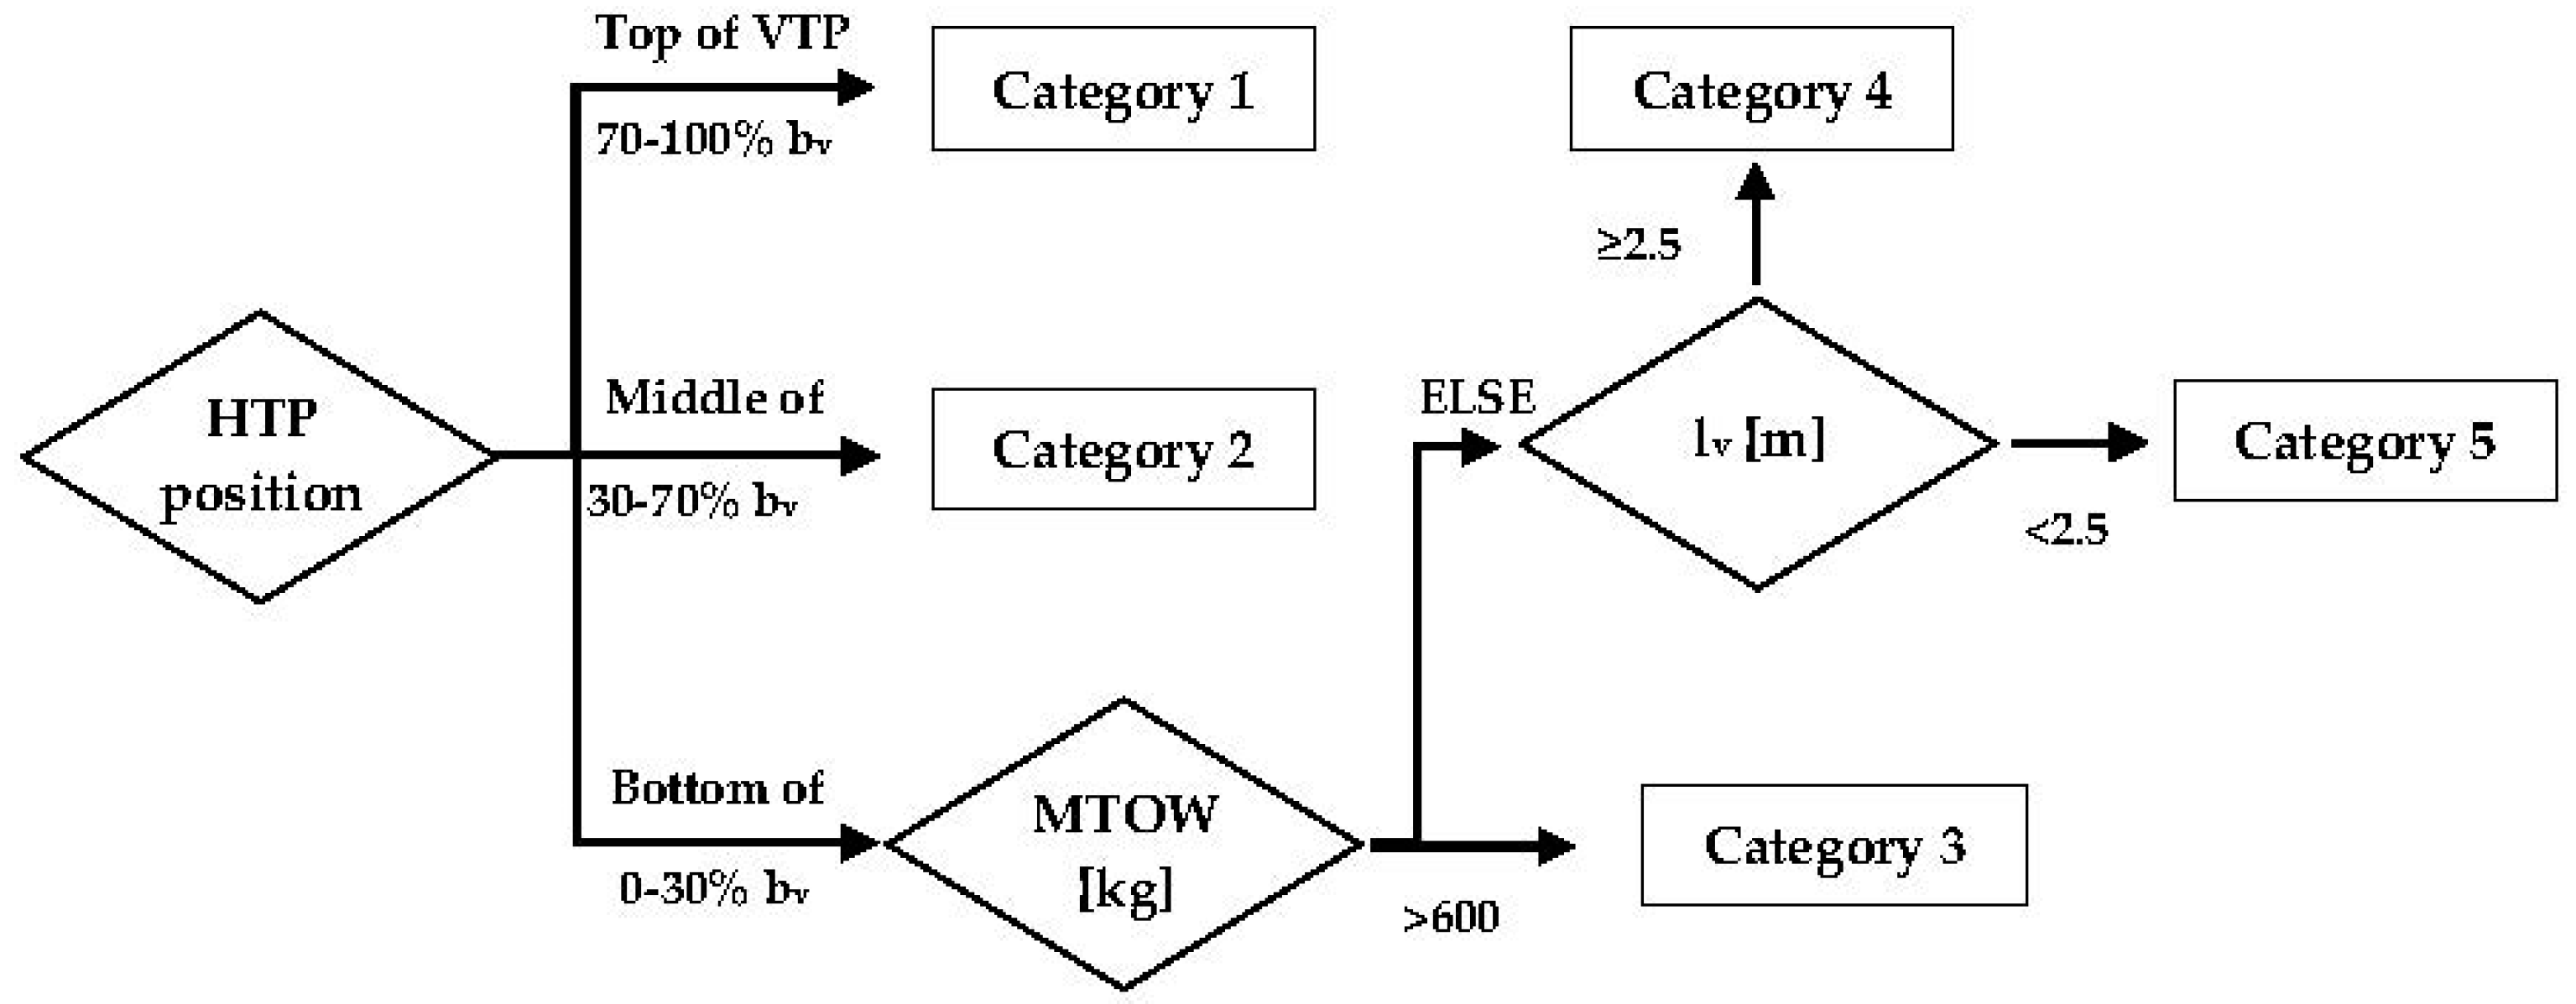
Therefore, the proposed method to estimate the wing taper ratio (λ
w) consists in taking into account the input value of the design process MTOW and considering the wing Aspect Ratio (AR
w) and the Span Loading parameter (SL
w), which was defined in the second section of this paper as the ratio between the value of MTOW and the wingspan (b
w). Furthermore, two performance parameters will also be taken into account: the cruise speed (V
c) and the endurance (E). The values of these parameters will determine in which category the design aircraft is included, following the flowchart present in
Figure 4.
Having selected in which group to include the design aircraft,
Table 4 presents the designation of the different groups along with the estimated range of expected taper ratio and the mean values of this parameter within each category for the aircraft which have been studied. This would allow the designer to select a suitable value for this parameter so as to continue the design process.
Having obtained the values of S
w, b
w, and λ
w, the values of the root chord, the tip chord, and the mean aerodynamic chord can be estimated through the following equations, which constitute the definitions for S
w, λ
w, and MAC
w, respectively:
Solving the equation system (5–7) for crw, ctw, and MACw, the chord distribution for a simple tapered wing has been defined. Should the designer prefer a wing divided in different sections, each of them having a different taper ratio, the equivalent wing definition proposed in the second section of this work can be used, in order to maintain a similar performance to the wing obtained throughout this process.
In particular, the value of MACw constitutes a crucial parameter in the definition of other parameters relative to the tail surfaces, such as the volume coefficients (Vh, Vv). In order to finalize the wing design, a value of wing sweep should be selected. Generally, RPAS travel at relatively low speeds, and the wing sweep is usually employed in order to increase the critical Mach (Mc) value for aircraft travelling at close to transonic speeds, so as to delay the appearance of transonic effects and shockwaves in the wing. This is not the common case for RPAS, so the values of wing sweep are usually low. In the aircraft object of this study, the value of quarter-chord sweep (Λw1/4) usually ranges from 0° to 5°.
3.2.2. HTP Design
In order to undertake the design of the horizontal tail, the first parameter which will be estimated, as in the case of the wing, is the surface (S
h). A correlation that compares the value of S
w with S
h is proposed, as the ratio between these two surfaces has been used in previous works as a mean of estimating a value for S
h [
10]. As can be seen in
Figure 5, the resulting correlation is linear and yields a relatively accurate result.
Once the surface of the HTP has been estimated, the next step consists in locating the position of the horizontal tail-plane relative to the wing. This distance is measured through the moment arm parameter (l
h). In order to obtain this value, the correlation represented in
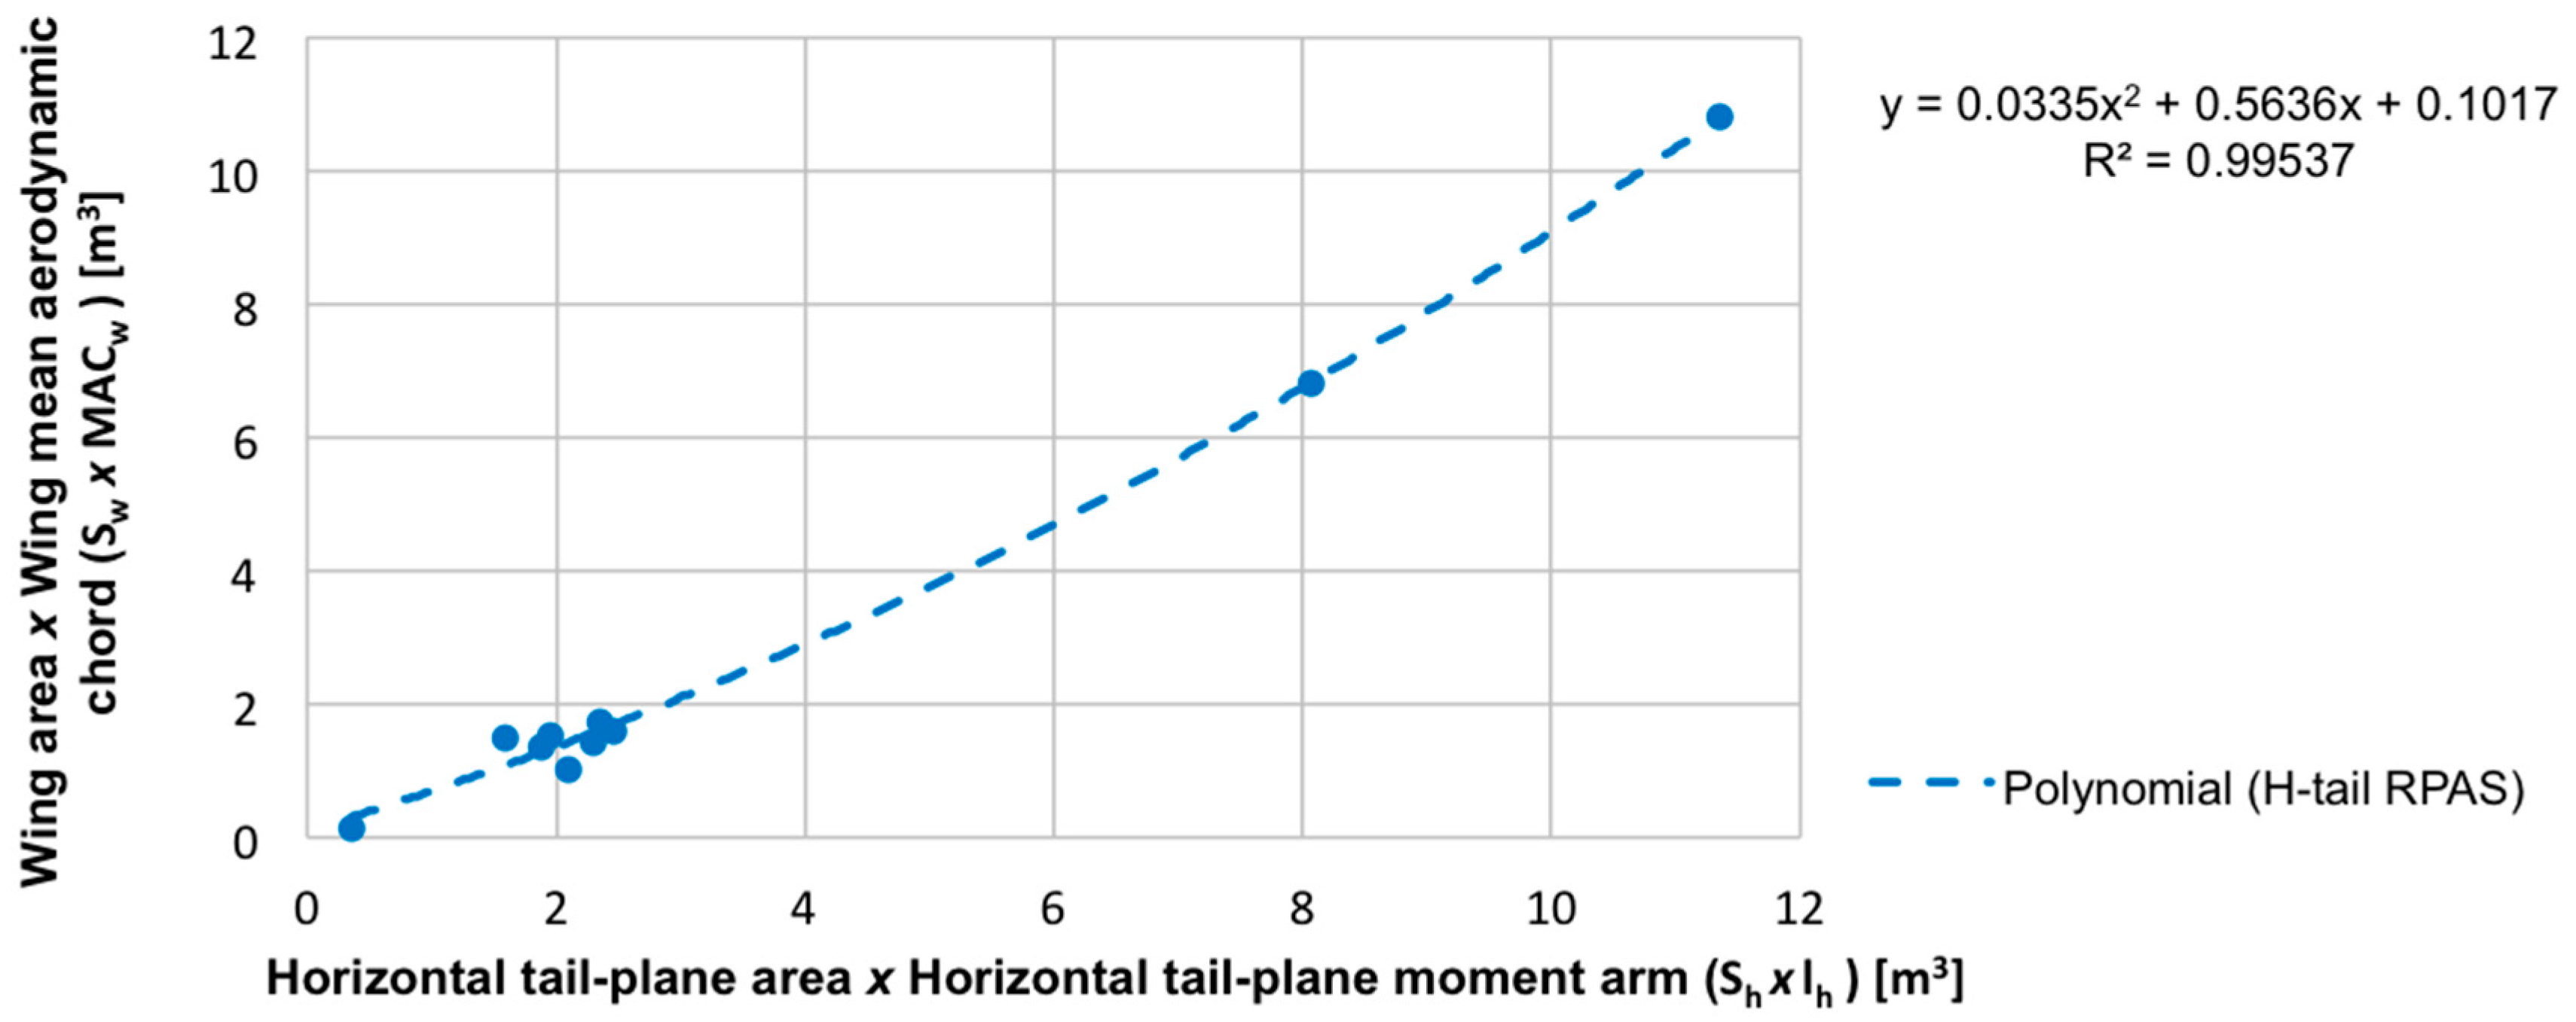
Figure 6 resorts to the definition of the dimensionless HTP volume coefficient (V
h), which was previously expressed in Equation (3). The numerator of the volume coefficient ratio is compared to the denominator, thus entering the correlation with the values of S
w, MAC
w, and S
h, the moment arm (l
h) and the volume coefficient (V
h) can be obtained.
Regarding the planform of the HTP, it is noteworthy that all of the aircraft included in this category in the database present a rectangular planform for the horizontal tail-plane. Therefore, the HTP chord is constant and the sweep angle is zero. These guidelines are also taken into account in the design process. Therefore, once the wingspan of the HTP is defined, the chord can be estimated through the ratio between Sh and bh, and thus the value of the chord is obtained, and as it is constant, it coincides with the values of MGCh and MACh.
A proposed method for obtaining the HTP span is the following: since in the case of this aerodynamic surface the structural criteria are predominant relative to the aerodynamic criteria, the Aspect Ratio of the HTP can be estimated in half of that of the wing [
10]. The reason for this is that in this case, it is not as convenient to design it with a considerable value or AR in order to reduce induced drag, as the lift that this surface provides is appreciatively lower than that of the wing, and as such, the inducted drag is also significantly lower. Therefore, as the AR penalizes the structural behavior of the aerodynamic surface due to augmenting the bending moment, the proposed relation between AR
w and AR
h can be set. Having fixed the AR
h value, the span of the HTP can be obtained, and considering that the design of this aerodynamic surface for this particular RPAS category is rectangular, the chord of the HTP can be estimated through the ratio of S
h and b
h, and thus the sizing of the HTP is completed.
3.2.3. VTP Design
In the H-tail category of RPAS the position and design of the HTP and the VTP are geometrically related, since both are located at the end of the tail booms that usually extend from the wing, a geometric approach will be followed in some of the design phases of this aerodynamic surface, as the sizing of the HTP will have already determined some of the characteristics of the VTP. As noted in the second section of this paper, it should also be taken into account that the planforms of the vertical tail-planes of the aircraft in the database included in the H-tail category present a significant diversity of planforms, consisting in different trapezial sections of varying taper ratio and sweep angles. For this reason, the equivalent VTP was defined in the aforementioned section, thus pretending to reduce the scatter of the correlations which will be estimated.
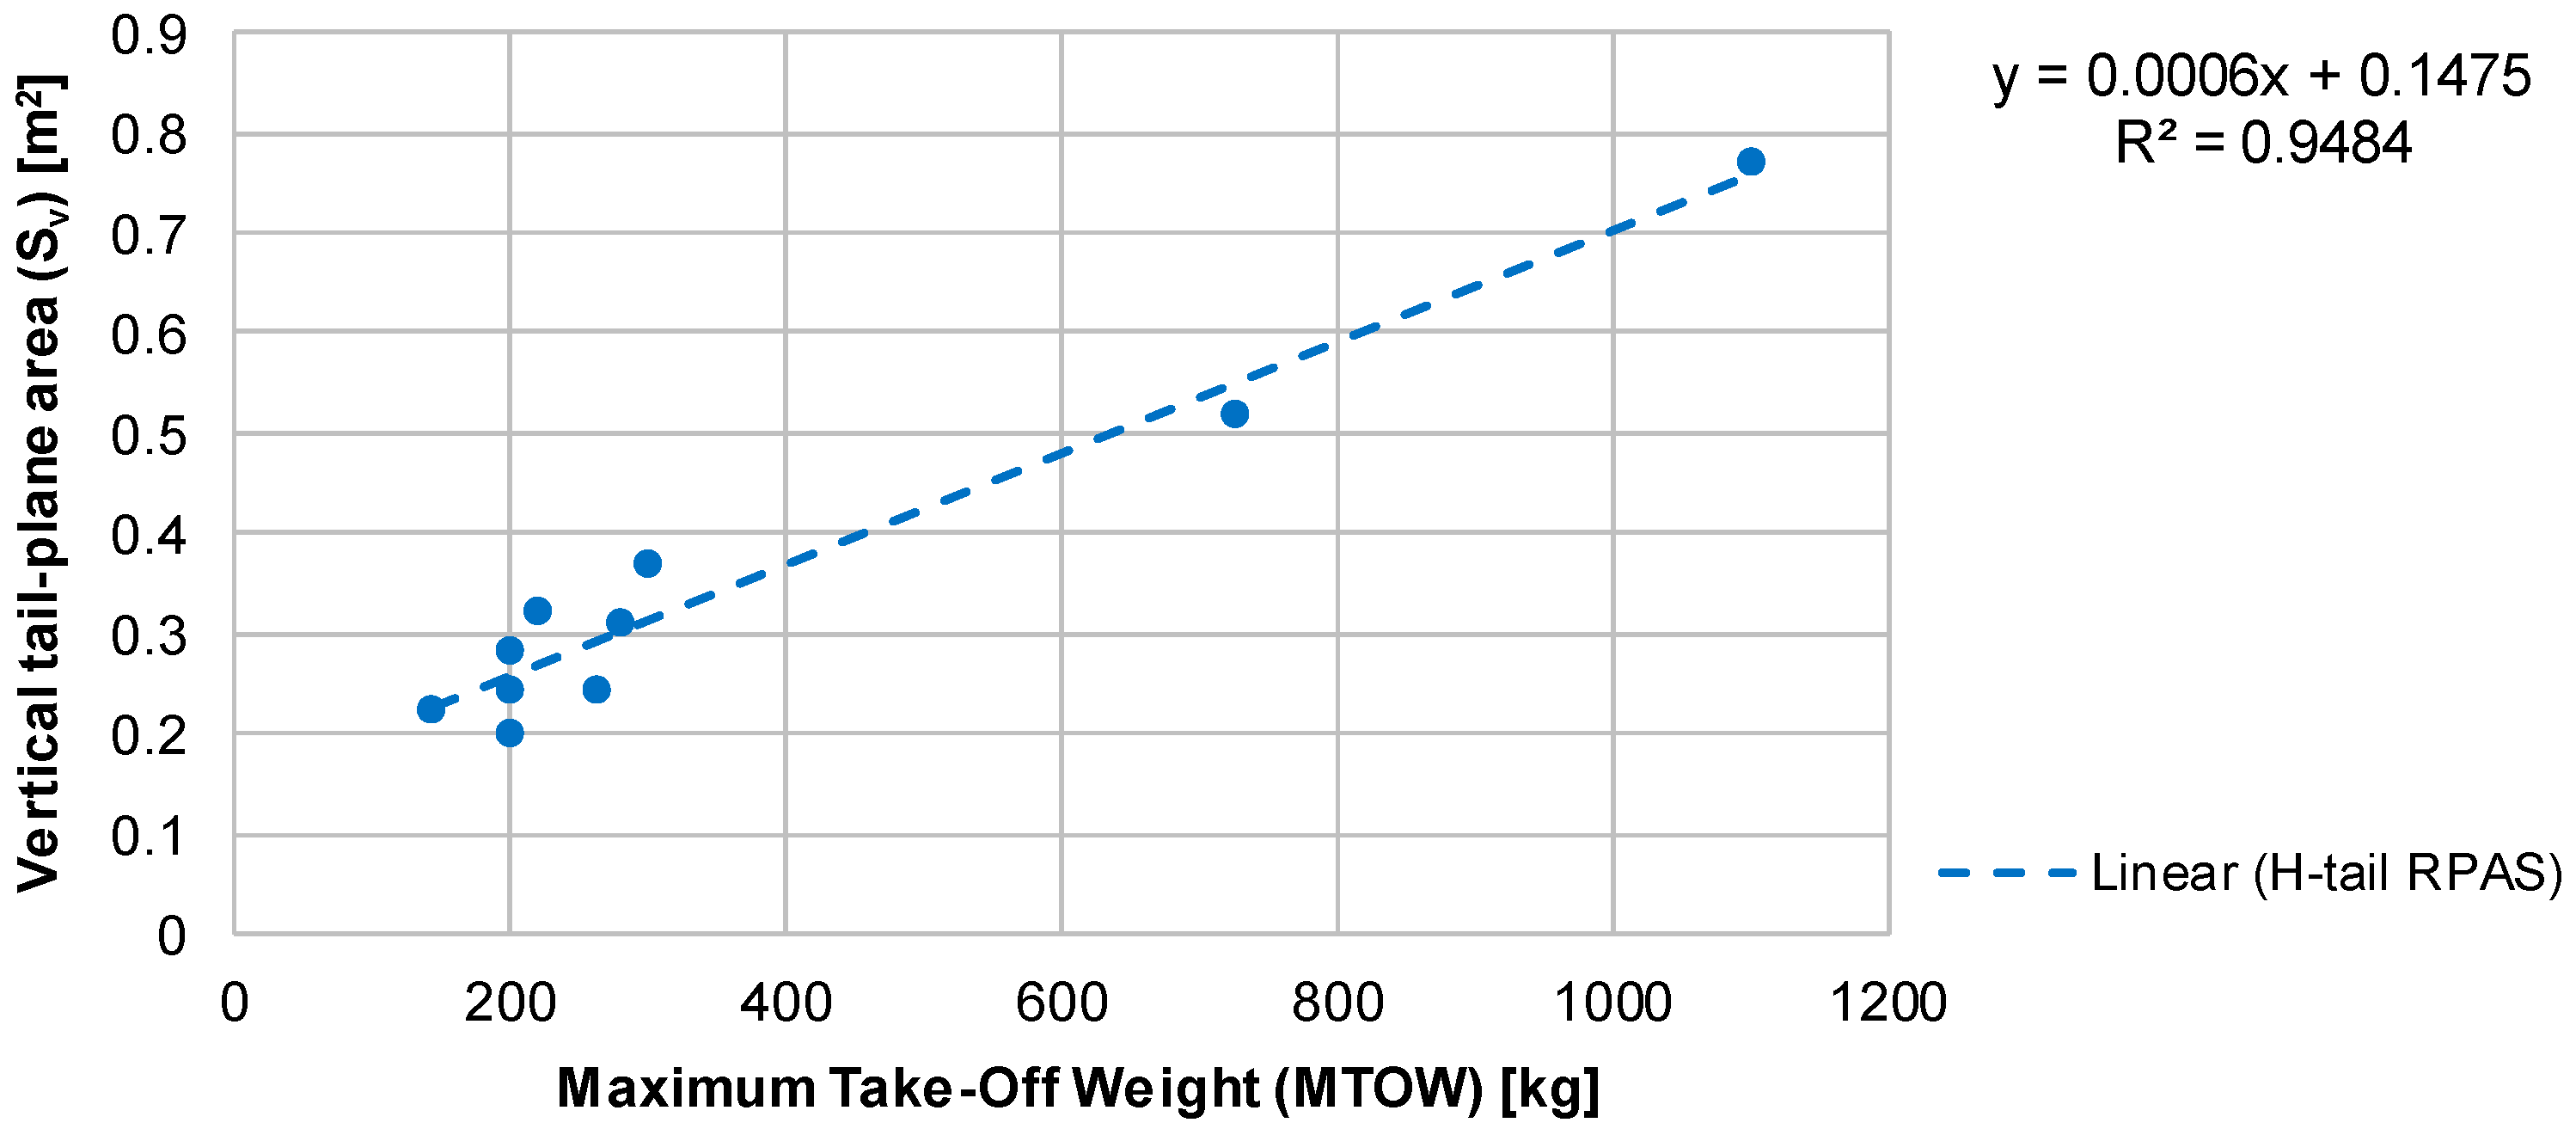
A usual method for sizing S
v for twin-engine aircraft is to consider the engine failure scenario, in which the vertical tail-plane and rudder need to compensate for the moment created by the remaining engines. However, this is not the case in most RPAS, which have only a single engine. Therefore, another approach is considered, which consists in estimating a correlation between MTOW and S
v, which is represented in
Figure 7.
Having estimated the value of Sv, the next proposed step in the design process would be to decide the relative vertical position between the HTP and the VTP. Among the aircraft included in the H-tail group, a significant variety is observed in the vertical position of the HTP along the twin-vertical tail-planes span. In most cases, the HTP is located at the bottom of the VTP span, or at approximately 15% of the span of the vertical tail-plane. However, in other RPAS, it is positioned at 50% of bv, and the final tendency which has been observed is to locate it at the top of the VTP, as in the case of a T-tail with twin VTPs. As it will be seen in the following design steps, the relative position of both surfaces serves as a criterion to classify the aircraft in different groups, each of which will have typical values of ARv and λv.
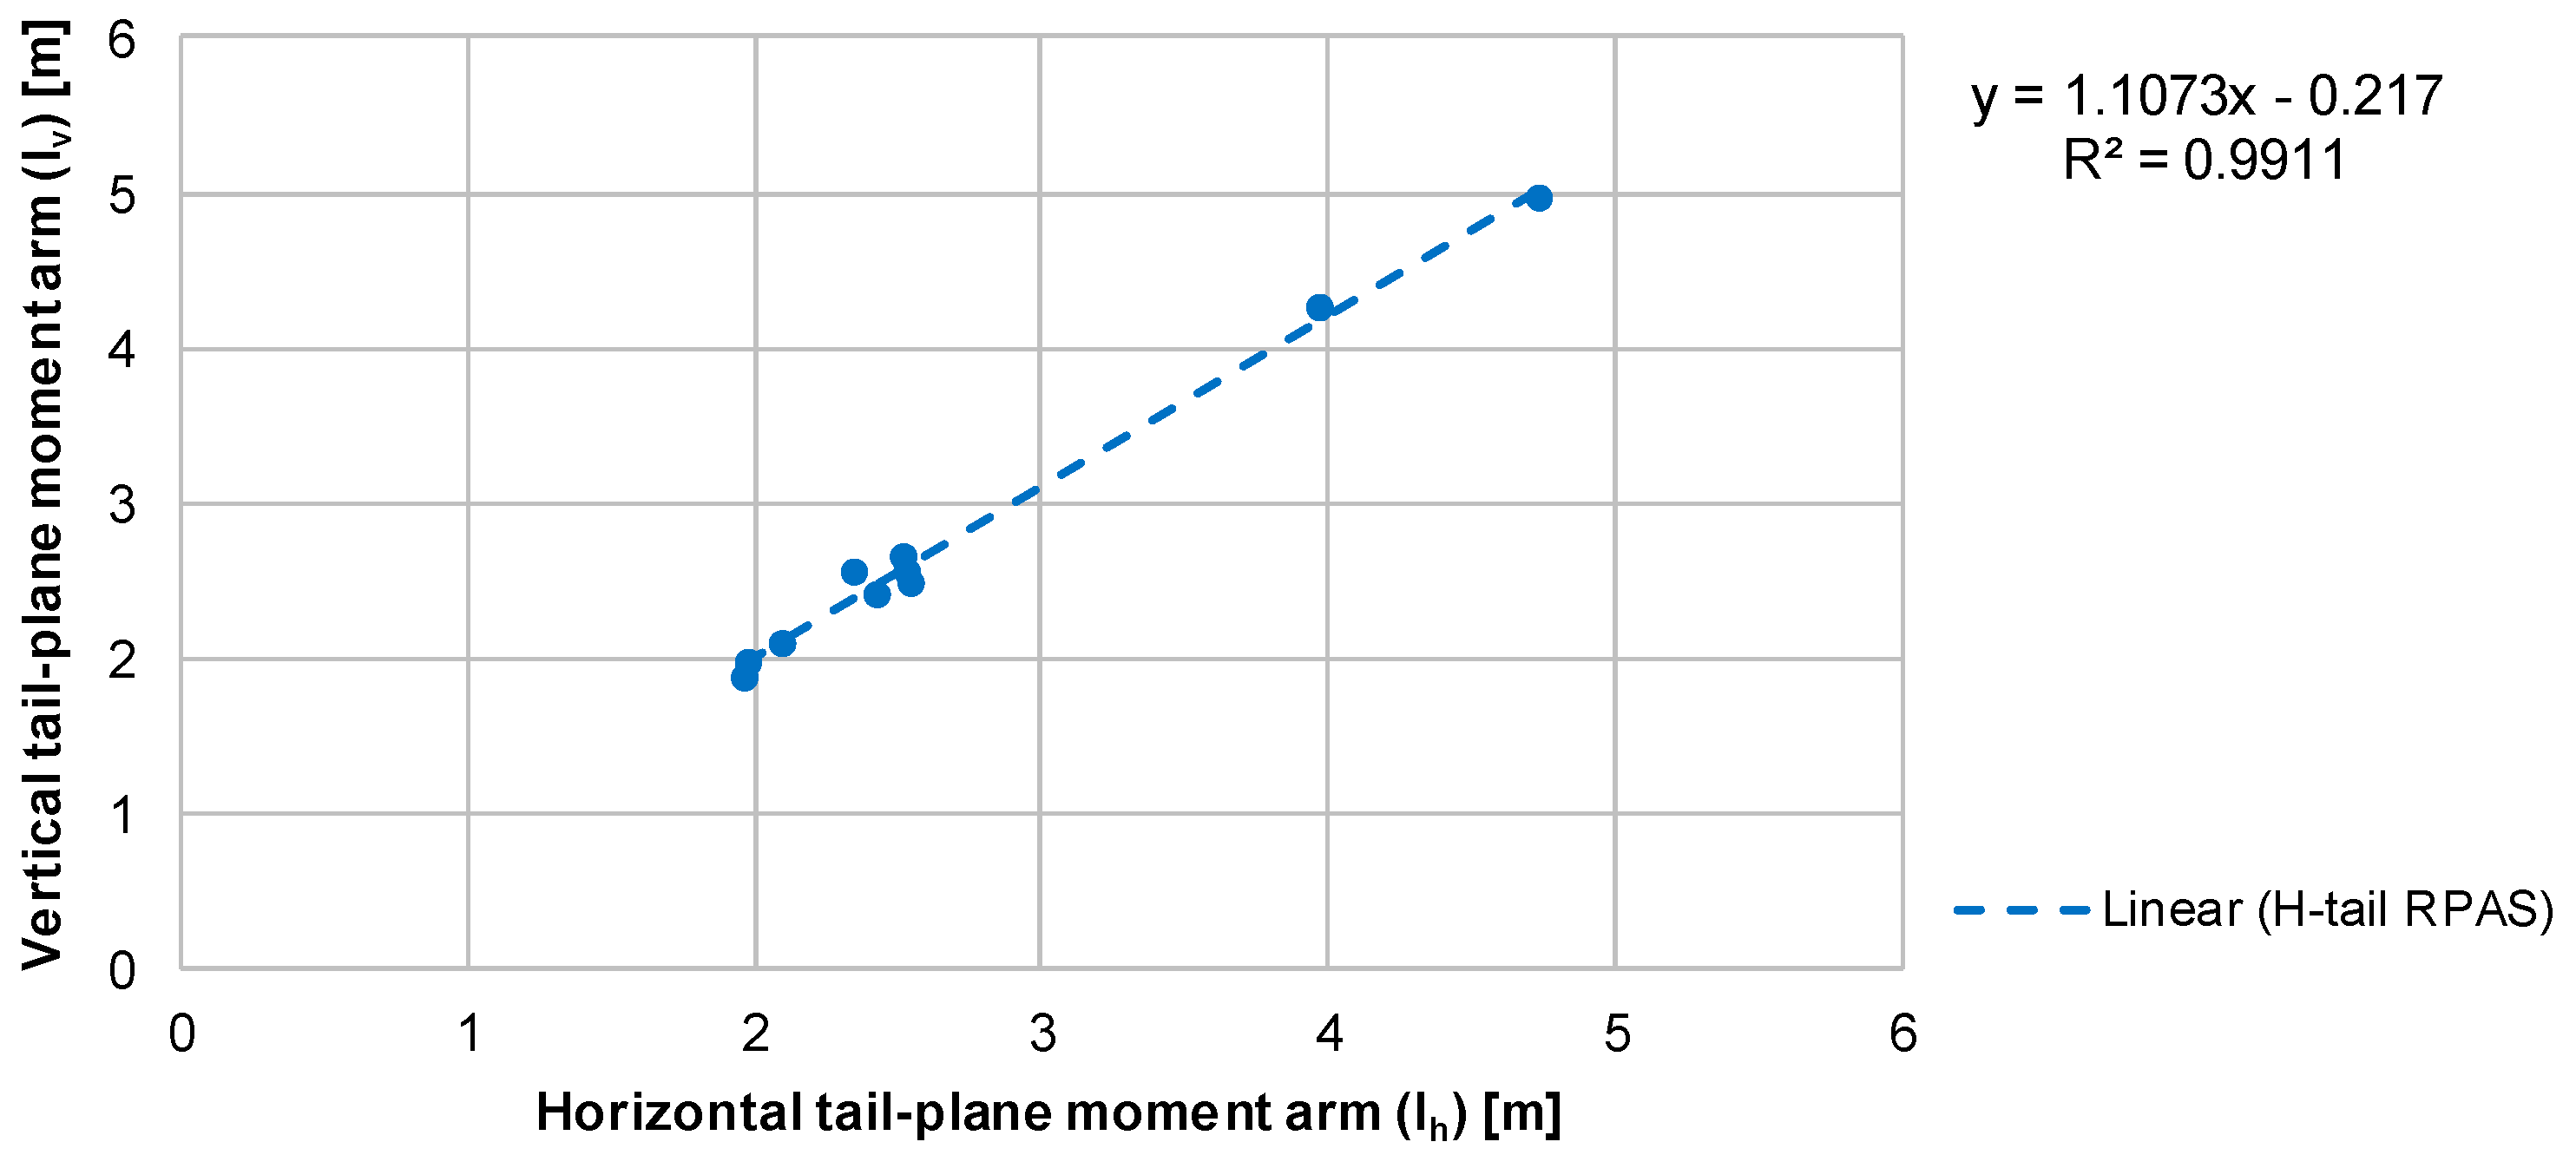
Since the only design parameter of the VTP known is the surface, a further step is taken that will also contribute in deciding the relative vertical position between both surfaces, and that is estimating the moment arm (l
v). In the case of the VTP, as the moment arm of the HTP has already been defined and both surfaces are located at the end of the tail booms, it would be sensible to assume that a geometric relation can be set between them. Therefore, the correlation represented in
Figure 8 is estimated, which compares both moment arms, l
h and l
v. Entering the correlation with the value of l
h, the VTP moment arm can be obtained. With this value, the volume coefficient of the vertical tail (V
v) can also be estimated, since the required data which define this dimensionless parameter have already been obtained: S
v, S
w, and b
w.
Having obtained the value of l
v, the next step would be to determine the relative vertical position of the VTP and HTP. This decision will consequently lead to a categorization of the aircraft into diverse groups, similar to that which was proposed in the case of the wing, and which will aid in determining the value of the Aspect Ratio and taper ratio of the VTP. It can be observed that most of the aircraft opt for an HTP position at the bottom of the VTP or at approximately 15% of its span. This is probably due to the benefits of having the horizontal tail-plane in the slipstream of the propeller, as was also commented in
Section 3.1 when addressing the different design tendencies of RPAS, since the dynamic pressure is higher and thus larger aerodynamic forces can be obtained with the same HTP surface. However, as noted in previous studies [
26], this increase in dynamic pressure drops rapidly as the horizontal tail-plane is moved upward along the vertical tail, exiting the region where the highest increase in dynamic pressure occurs. Therefore, it is expected that, while the previously commented positions of the HTP allows for the designer to benefit from this phenomenon, upon moving the HTP upward along b
v, this effect can no longer be achieved. The reasons why an upper position for the HTP are selected can be diverse, and are most probably dependent on the configuration of the fuselage, the propeller slipstream or specific criteria related to the mission. The disposition of locating the HTP at the top of the vertical tail-planes is similar to that of T-tail airplanes, and thus it can be assumed that the aerodynamic, structural, and aeroelastic disadvantages that were previously commented upon in
Section 3.1 when describing the T-tail configuration are also present in this case. This may explain why, save for particular cases in which other factors make this configuration preferable, it is less often used than the aforementioned one. The last scenario consists in locating the HTP approximately at 50% of the vertical tail span, which constitutes a middle ground between the other cases.
When the vertical position of the HTP is selected, another parameter of the VTP can be fixed, and that would be the chord at the union with the HTP, which will be set to the equal to the chord of the HTP. This consideration, which is also geometric, is consistent with the observed design of H-tail RPAS. In the case that the HTP is to be located at the bottom of the VTP, the root chord of the VTP (crv) would be set to be the same as the chord of the horizontal tail-plane which was estimated in earlier steps of the design process. Should the HTP be at the top of the VTP, then it would be the tip chord (ctv) the parameter that would be fixed.
In order to establish an organized criterion for this step in the design process, the flowchart represented in
Figure 9 allows us to categorize the design aircraft in a similar way to the process that was followed in the wing design. This will allow us to define typical values of AR
v and λ
v which will allow for obtaining more precise results in the design of the VTP. The criteria which will be used in this classification will consider the following aspects: relative position of the HTP and VTP according to the criteria exposed earlier in this section, expressed as the percentage of b
v at which the HTP is located, moment arm of the VTP (l
v), and MTOW.
The first classification criteria (location of HTP) will also determine the chord of the VTP at the designated position. Further criteria allows to group aircraft with similar VTP planforms so as to select a value of λ
v amongst a category of aircraft with less scatter than the global sample.
Table 5 provides an insight on various design parameters related to the tail which allows the designer to visualize the characteristics of the tail design close to its finalization.
The parameters that are shown in
Table 5 can also aid in explaining the reason for the typical values of taper that can be observed in each group. As in the wing design section, the taper ratio alleviates the structural loads experienced by the aerodynamic surface, since it reduces the bending moment that in this case is transferred by the tail booms to the strengthened structure. The parameter AR
v has been selected for this comparison since it provides an idea of the span of the VTP compared to its surface, which can directly relate to the aforementioned structural criteria, since a large Aspect Ratio provides worse structural behavior precisely due to the larger bending moments. The parameter l
v was also chosen because the structural loads suffered in the tail must be transferred to the wing. Therefore, large values of l
v will also penalize the structural behavior. Finally, the value of the leading-edge sweep angle (Λ
vle) was also selected because it also augments the bending moment suffered, in this case, in the tail booms, and therefore lower values of λ
v should be selected in order to improve the structural behavior [
10].
For the first category, in which the HTP is located at the top of the vertical tail-planes, lower values of ARv compared to the other categories can be observed. This is precisely due to the comparatively worse structural behavior of a T-tail configuration, which is similar to the selected tail disposition in this category. Since the loads of the horizontal plane are transferred to the vertical tail-planes instead of being directly transferred to the tail booms, lower values of Aspect Ratio are selected in order to alleviate the stresses in the VTPs. Similarly, this can explain the values of the taper ratio, since a lower taper ratio, which results in a larger difference between ctv and crv, contributes to the structural behavior of the aerodynamic surface. The reason for not selecting even lower taper ratios could be due to the HTP being located precisely at the top of the vertical tail-planes. Thus, if lower values would be selected, and as the tip chord of the VTP is fixed at the same value as the chord of the HTP, the root chord of the VTP could be larger than desired. In the case of the second category, which corresponds to a middle position of the HTP along bv, the values of the different design parameters also fall in a middle ground amongst the ones that correspond to the other groups.
The last three categories correspond to a low position of the HTP. Category 3 groups the aircraft with larger values of MTOW, and thus also larger moment arms (lv). It can be checked that lower values of λv are selected, which is probably motivated by the higher aerodynamic loads to be expected in these aircraft, the high values of lv and possibly moderate values of Λvle, all of which contribute to augmenting the bending moments transferred to the wing structure. In the case of category 4, the lower values of taper ratio can be observed, even though the HTP is located in a low position. This is probably due to the large values of lv and Λvle when compared to other aircraft in their MTOW range, which is much lower than those included in category 3. Therefore, the taper ratio of the VTP has to be lowered so as to not penalize excessively the structural behavior. Finally, category 5 corresponds to the particular case of rectangular VTPs, which are not structurally as advantageous as tapered VTPs but may be selected due to not presenting sweep angle and in the case that the aerodynamic loads in the tail are not expected to be significant enough to modify the value of these parameters.
Having fixed the value of the VTP chord at the station of the HTP and the taper ratio (λ
v) according to the categorization proposed beforehand, and having obtained the value of S
v earlier in the design process, the values of b
v, cr
v, or ct
v depending on the case, and finally MAC
v can be obtained by solving the equation system (5–7) that was defined in the wing design section, albeit entering the equations with the parameters of the VTP. As the values of S
v, l
v are known, employing the wing surface (S
w) and wingspan (b
w) parameters, the value of the volume coefficient (V
v) can also be obtained through Equation (4). Finally, a value of the sweep angle can be selected observing the information in
Table 5 in order to finalize the design of the VTP.
3.3. Design Example Case
In order to test the accuracy of the proposed design method for the category of H-tail RPAS, a design case is proposed. An aircraft that has not been included in the database will be examined and designed starting from the design specifications that were at the first step of the design process. Since in the correlations, as has been noted beforehand, many of the studied aircraft are included in the range of MTOW between 100 kg and 300 kg, whereas two other aircraft have significantly larger values of MTOW, it has been decided to select as the sample aircraft one that is in the most representative range so as to assure the veracity of the results.
The aircraft chosen to develop the design case is the RQ-2 Pioneer, an aircraft developed jointly by AAI Corporation (Hunt Valley, MD, US) and IAI (Lod, Israel), with an H-tail configuration and equipped with a piston engine and a two-blade pusher propeller designed for surveillance missions. The design specifications of this aircraft, which serve as the input for the design procedure, are the following: the MTOW (205 kg), the value of endurance provided by the manufacturer (5 h), and the typical cruise speed (200 km/h). These input data are presented schematically in
Table 6.
For every step of the design process, the value obtained following the design procedure and the relative error percentages, shown between parentheses, according to the actual values are expressed.
Table 7,
Table 8 and
Table 9 summarize the results of the design process, providing the comparison between the real values and the ones obtained following the proposed rapid-sizing method. It has been checked that the predicted point falls within the margin provided by the typical error of each correlation.
Observing the proposed design process steps and the error committed compared to the geometric data of the aircraft provided by the manufacturer and the typical error of these correlations, it can be concluded that the method could be considered an acceptable approach in providing a rapid-sizing of the RPAS adequate to the first steps in the design process. In this conceptual design phase, the focus is set on obtaining a first approach to the geometry and characteristics of the aircraft, employing rapid methods so as to define the layout of the RPAS and take the fundamental design decisions. In further steps of the design process, it would be expected that employing more complex and detailed methods, the error is reduced, and the design becomes more refined.


