1. Introduction
With the rapid economic growth around the world, the demand and competiveness for oil resources are becoming fierce. Applications and sectors covered include the aviation industry, marine oil and gas production and is on the increase in the electricity industry. This stems from its flexibility to run on both gaseous and liquid fuel, generating continuous-flow engines that develop steady aerodynamics and flame kinetics during stationary operation [
1,
2,
3].
Moreover, it has been proved that growing industrialization is damaging the climate due to the possible extinction of resources and the pollution caused by their use. This has renewed the call for research into suitable alternative fuels with the aim of lowered emissions. This could potentially help within the gas turbine engine technologies.
Jet A-1 is the conventional fuel used in the aviation industry. It is a kerosene type fuel having a carbon number distribution between about 8 and 16, and contains a mixture of thousands of hydrocarbons [
4]. Some of these hydrocarbons include aromatics (about 20%),
n-paraffins and isoparaffins (60%), and cycloparaffins (naphthenes, 20%) [
4,
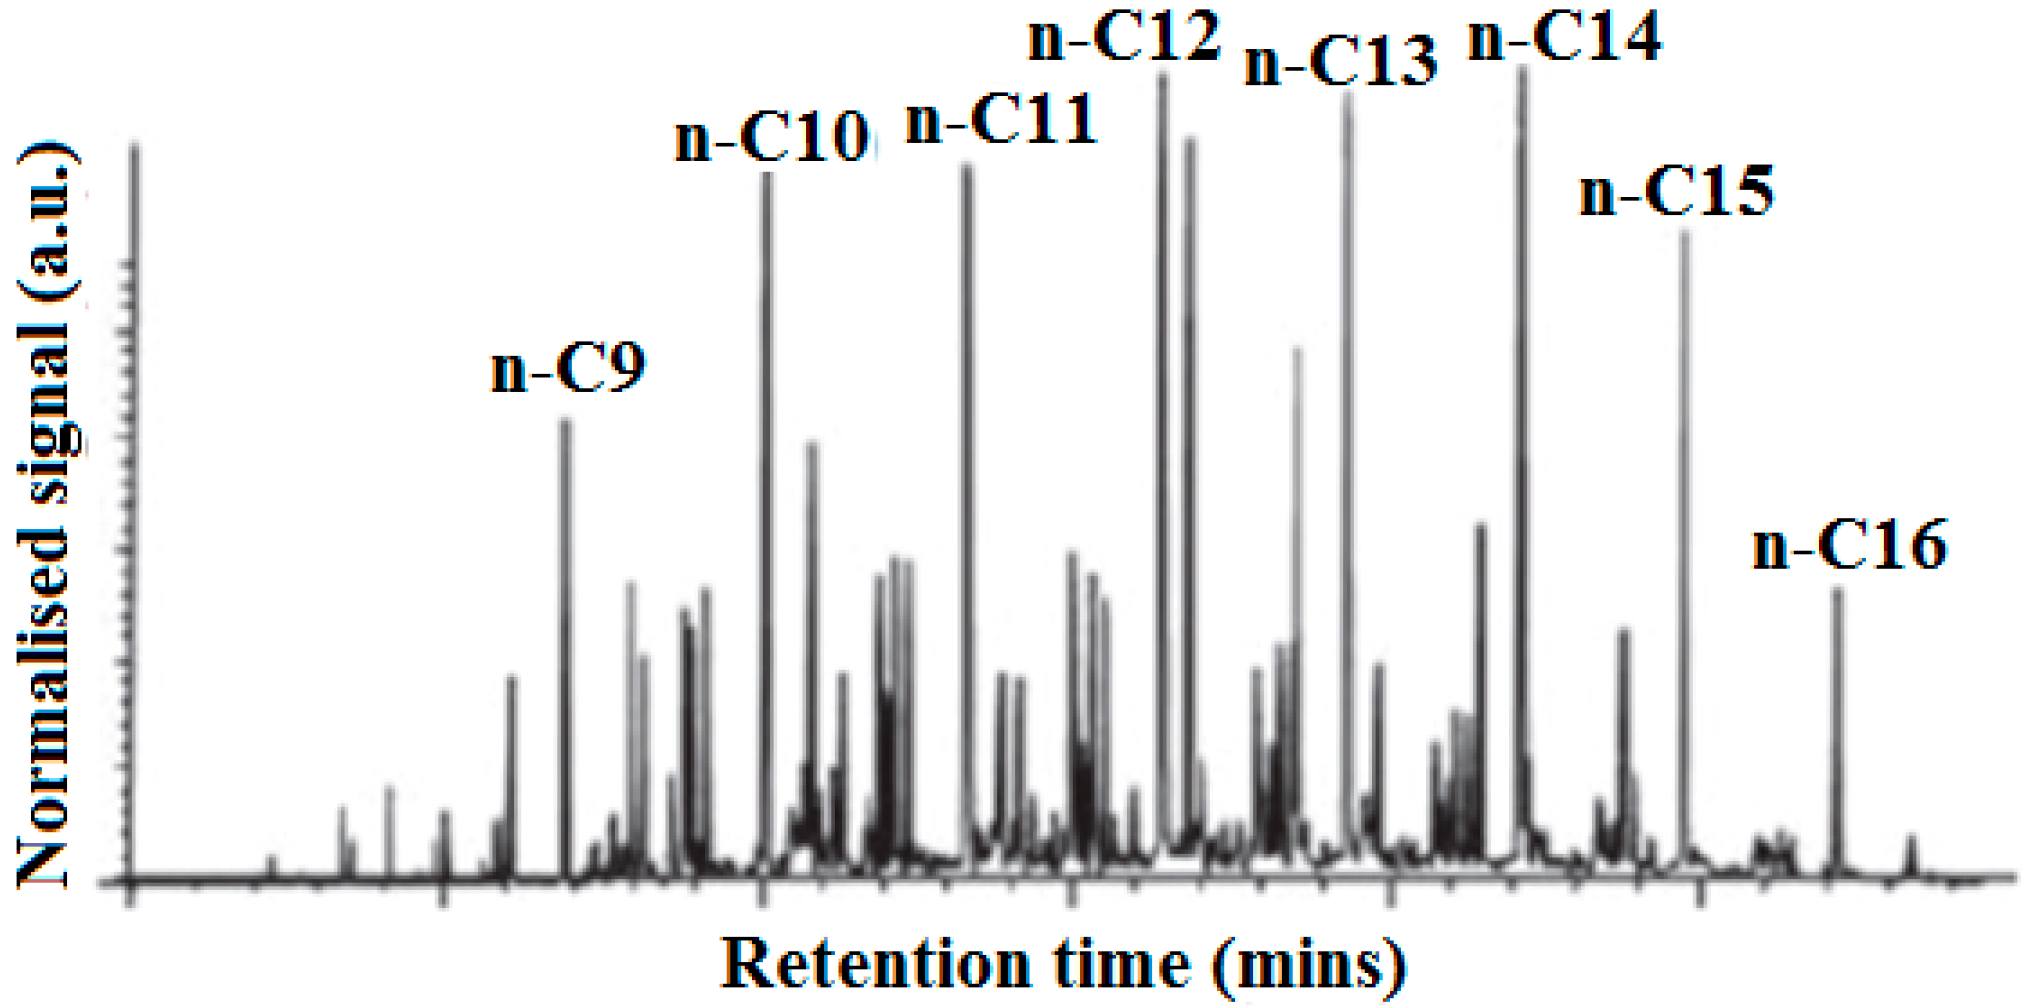
5]. Typically, normal paraffins have the highest concentration among the hydrocarbons and cycloparaffins and aromatics consist mostly of methyl-substituted single-ring molecules. The concentration of various components can vary significantly from one batch to another, depending on the crude oil used and the process history of the fuels. A typical gas chromatography of composition of Jet A-1 is shown in
Figure 1.
Figure 1.
Gas chromatography of typical composition of Jet A-14.
Figure 1.
Gas chromatography of typical composition of Jet A-14.
Synthetically produced jet fuels, along with the hydro-processed bio-derived oils, have surfaced as feasible substitutes as they showcase properties similar to conventional jet fuels. Synthetic jet fuels are derived from biomass, coal, or natural gas by the Fischer Tropsch (FT) process [
6,
7,
8]. Fully synthetic jet fuel consists of 50% synthetic paraffinic kerosene, derived from the FT process and 50% severely hydrogenated coal tar kerosene [
9]. After years of extensive research, alternatives to Jet A-1 fuels can now be blended for commercial flights [
10]. The positive attributes of these fuels include: cleaner burning fuels with no sulfur and higher thermal stability resulting in less fuel system deposits, which is of importance to high performance military aircraft engines.
In comparison, the emissions from 100% SPK to conventional jet fuels, Timko
et al. [
11] and Corporan
et al. [
12], observed lower and insignificant gaseous emissions from pure GTL fuels and their blends with conventional jet fuel, than simply conventional jet fuels [
11,
12,
13]. Likewise, negligible particulate emissions were recorded in the separate experiment with the Pratt and Whitney PW308 engine operating under constant thrust and combustion conditions. It was demonstrated that using the 100% SPK product reduced SO
2, gaseous hydrocarbon, and NO
x emissions by 90%, 40%, and 6%–11%, respectively, compared to using conventional jet fuel.
Studying the emissions of Fully Formulated Synthetic Jet Fuel, Moses
et al. [
14] performed extensive tests on chemical and physical properties, as well as engine and combustor performance, of four different blends of Sasol’s Fully Formulated Synthetic Jet Fuel. The exhaust emission tests showed that Fully Formulated Synthetic Jet Fuel produces less CO, NO
x, and smoke, mainly as a result of the smaller aromatic and larger hydrogen content [
15].
Blakey
et al. [
5] discussed that using the 100% SPK and Fully Formulated Synthetic Jet Fuel does not reduce gas emissions as a result of carbon to hydrogen ratios and high CO
2 emissions over the entire life cycle. However, the reduced particulate matter emission is significant with respect to the air quality.
2. Thermal Stressing of Aviation Fuel
The need for efficient cooling has become a priority with increased flight speeds and demand for greater engine performance. In addition, aircraft operates most economically at high altitude where ambient temperature may be as low as 193 K, which can cause freezing of the fuel [
4]. The complexity of jet fuel hydrocarbon mixture makes it freeze at different temperature unlike water. Hydrocarbons with highest freeze point solidify first, forming wax crystals; later, lower freeze point components solidify. The freezing point of the jet fuel is defined as the temperature at which the last wax crystals melt when warming the solidified fuel. One of the primary engineering requirements of jet fuels is its ability to be pumped with ease, which becomes a challenge when the fuel is allowed to freeze.
Jet fuels play two important roles in advanced aircraft, propellant and coolant [
9,
10,
11,
12,
13,
14,
15,
16]. En route to the combustion chamber, the fuel exchanges heat with various subsystems of the aircraft. It is used to remove heat from the engine oil, hydraulic fluid, and air-conditioning equipment in aircraft engine design. Therefore, aviation fuel is subject to thermal stress in the flow path between the aircraft fuel tanks and the combustion chamber. High thermal loads can lead to temperatures as high as 500 °C on metallic surfaces in the fuel delivery system of advanced aircraft [
17,
18]. This heat leads to the formation of insoluble deposits which can plug the narrow passageways found in fuel systems and in extreme cases, lead to component failure.
The thermal stability of a fuel is the ability of a fuel to act as a heat sink without the creation of insoluble deposits. For example, the thermal stability limit of JP-8 fuel was established at a bulk temperature of 163 °C and a wetted wall temperature of 204 °C [
19]. Increasing the fuel beyond its thermal stability temperature causes reactions in the fuel that lead to gum and carbon deposit accumulation [
19,
20] in fuel filters, fuel injector nozzles, the main engine control and the heat exchangers. In the fuel filters, it increases the pressure drop across the filter reducing fuel flow while in the fuel injector nozzles, alters the spray pattern which can lead to hot spots in the combustion chamber. Likewise in the heat exchangers, it reduces heat transfer efficiency and fuel flow. These deposits are a concern to the safety, in addition to increased cost of maintenance.
To study the thermal stability of jet fuels, the principle method is to measure the buildup of carbon on pipework and fuel wetted surfaces. The Aviation Fuel Thermal Stability test Unit (AFTSU) was developed by Daggett
et al. [
21] following criticisms of the Jet Fuel Thermal Oxidation Tester (JFTOT) which is, the standard test method used to estimate the thermal oxidation stability of aviation turbine fuels [
22,
23]. The JFTOT was criticized for the following [
21,
22,
23,
24]; its design is for laminar flow and not the turbulent flow regime in aircraft propulsion systems, it is a non-quantitative approach to grade the fuels and the magnesium impurities present in Aluminum-6061 used for the heater can prevent thermal deposition.
The AFTSU rig provides information for engine manufacturers on the performance of new fuel system assemblies, the performance of alternative fuels and fuel blends or additive packages, all without the cost and risk of a full engine test bed run. This is done in regimes presenting accurately the thermal loading of fuel on its pathway from the fuel tank to the combustion chamber. These regimes are considered important in achieving concentrations of deposit precursors formed in service upstream of the heated section [
21]. The fuel used is conditioned while the test specimens closely reflect the dynamic, thermal and material properties of actual aircraft fuel components. The AFTSTU test consumes between 600 and 3500 L of fuel depending on the length of test and thermal loading of the test section enabling lab testing of the fuel for emission on an APU. The 100% SPK, Fully Formulated Synthetic Jet Fuel and Jet A-1 fuels used in this experiment have been processed through the unit.
Table 1.
Fuel names and basic specifications used in this study.
Table 1.
Fuel names and basic specifications used in this study.
| Fuel | Representation Name | Density (g/L) | Fuel Aromatic Content (% Vol) | Calorific Value (MJ/kg) | Viscosity/cSto @40 °C |
|---|
| Jet A-1 from source 1 | Fuel 1 | 801.9 | 18.5 | 43.2 | 0.8–0.88 (20 °C) |
| Jet A-1 from source 2 | Fuel 2 | ≈801.9 | ≈18.5 | 43.2 | 0.8–0.88 (20 °C) |
| Stressed Fully Formulated Synthetic Jet Fuel (CTL) | Fuel 3 | 816 | 10.9 | 43.7 | 1.421 |
| Stressed 100% SPK (GTL) | Fuel 4 | 738 | 0 | 43.8 | 0.83 |
Table 1 shows the properties of the fuels tested in this study. For ease of representation Jet A-1 fuels from two different sources, thermally stressed Fully Formulated Synthetic Jet Fuel and thermally stressed 100% SPK will be referred as Fuel 1, Fuel 2, Fuel 3 and Fuel 4 respectively.
3. Experimental Set-Up
The Honeywell APU engine and the emissions measurement rig at the University of Sheffield are designed to deliver or at par with the SAE ARP1256c testing standards. The APU control panel provided different conditions for engine operation including full RPM and with bleed. The control panel proved advantageous as it provided direct reading of the operating speed (RPM) and EGT (exhaust gas temperature), hence allowing the operator to monitor the engine conditions directly bypassing the software interface (LabVIEW). The operation panel also provided control of the starter motor, ignition and fuel system. The engine was spooled up on a starter motor prior to the ignition and also fitted with an isolation button to disengage the igniters and shutoff the fuel supply. The logging system recorded the engine pressure and temperature distribution at selected core sample points (in the air streams) and within the fuel and oil systems. Boolean data were logged from the APU, which detailed the status of the ignition, fuel and oil systems, largely for the operator feedback emergency shutdown.
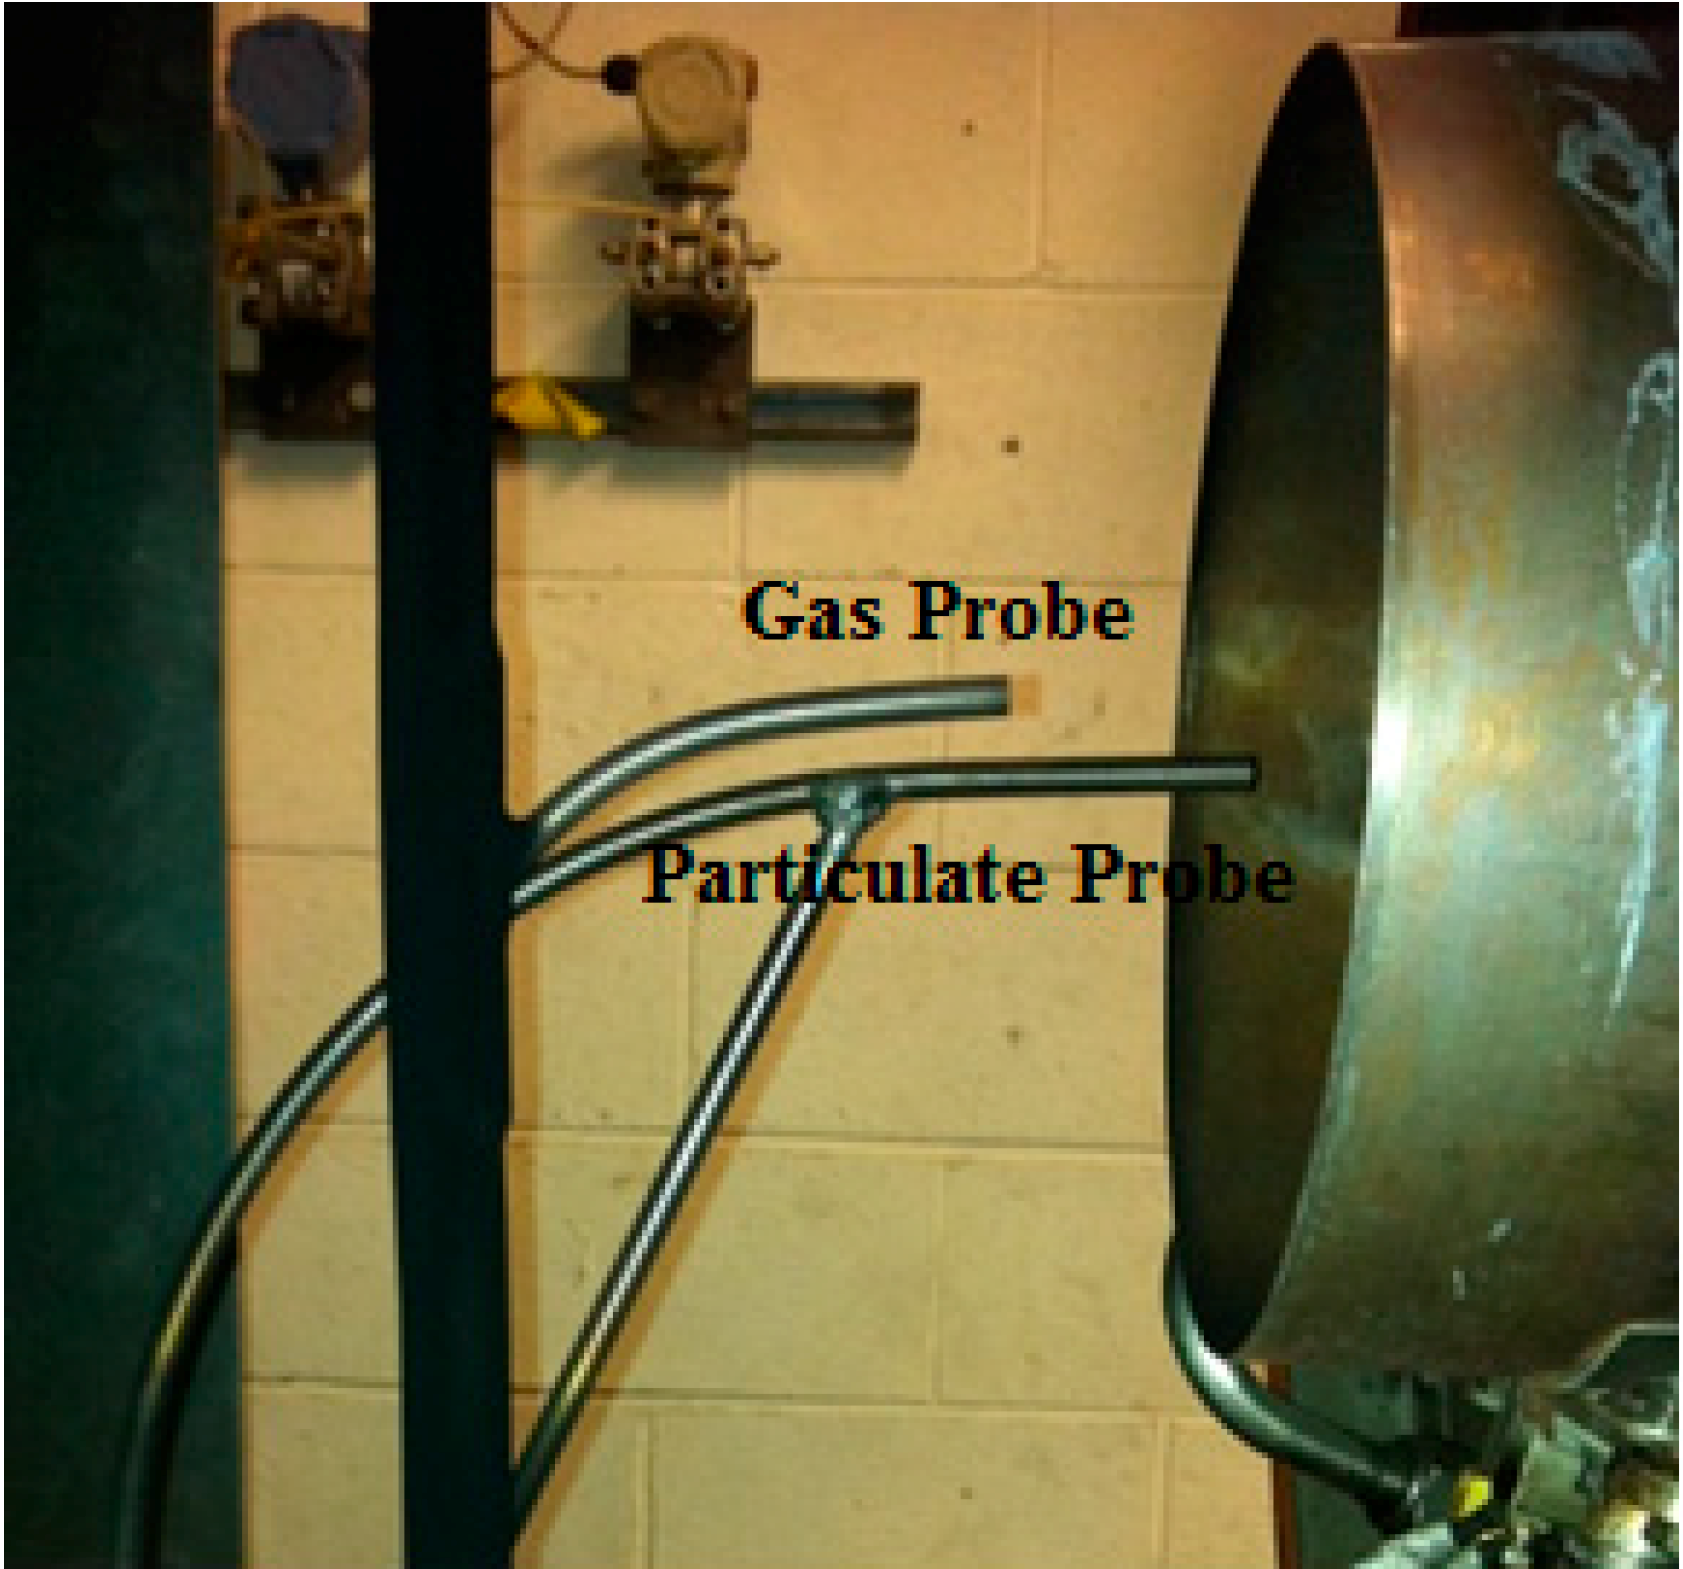
A stainless steel plate was fixed behind the APU exhaust to place the sampling probes no further than half an exhaust diameter behind the engine exhaust plane as per the requirement of the Aerospace Recommended Practice (ARP1256) [
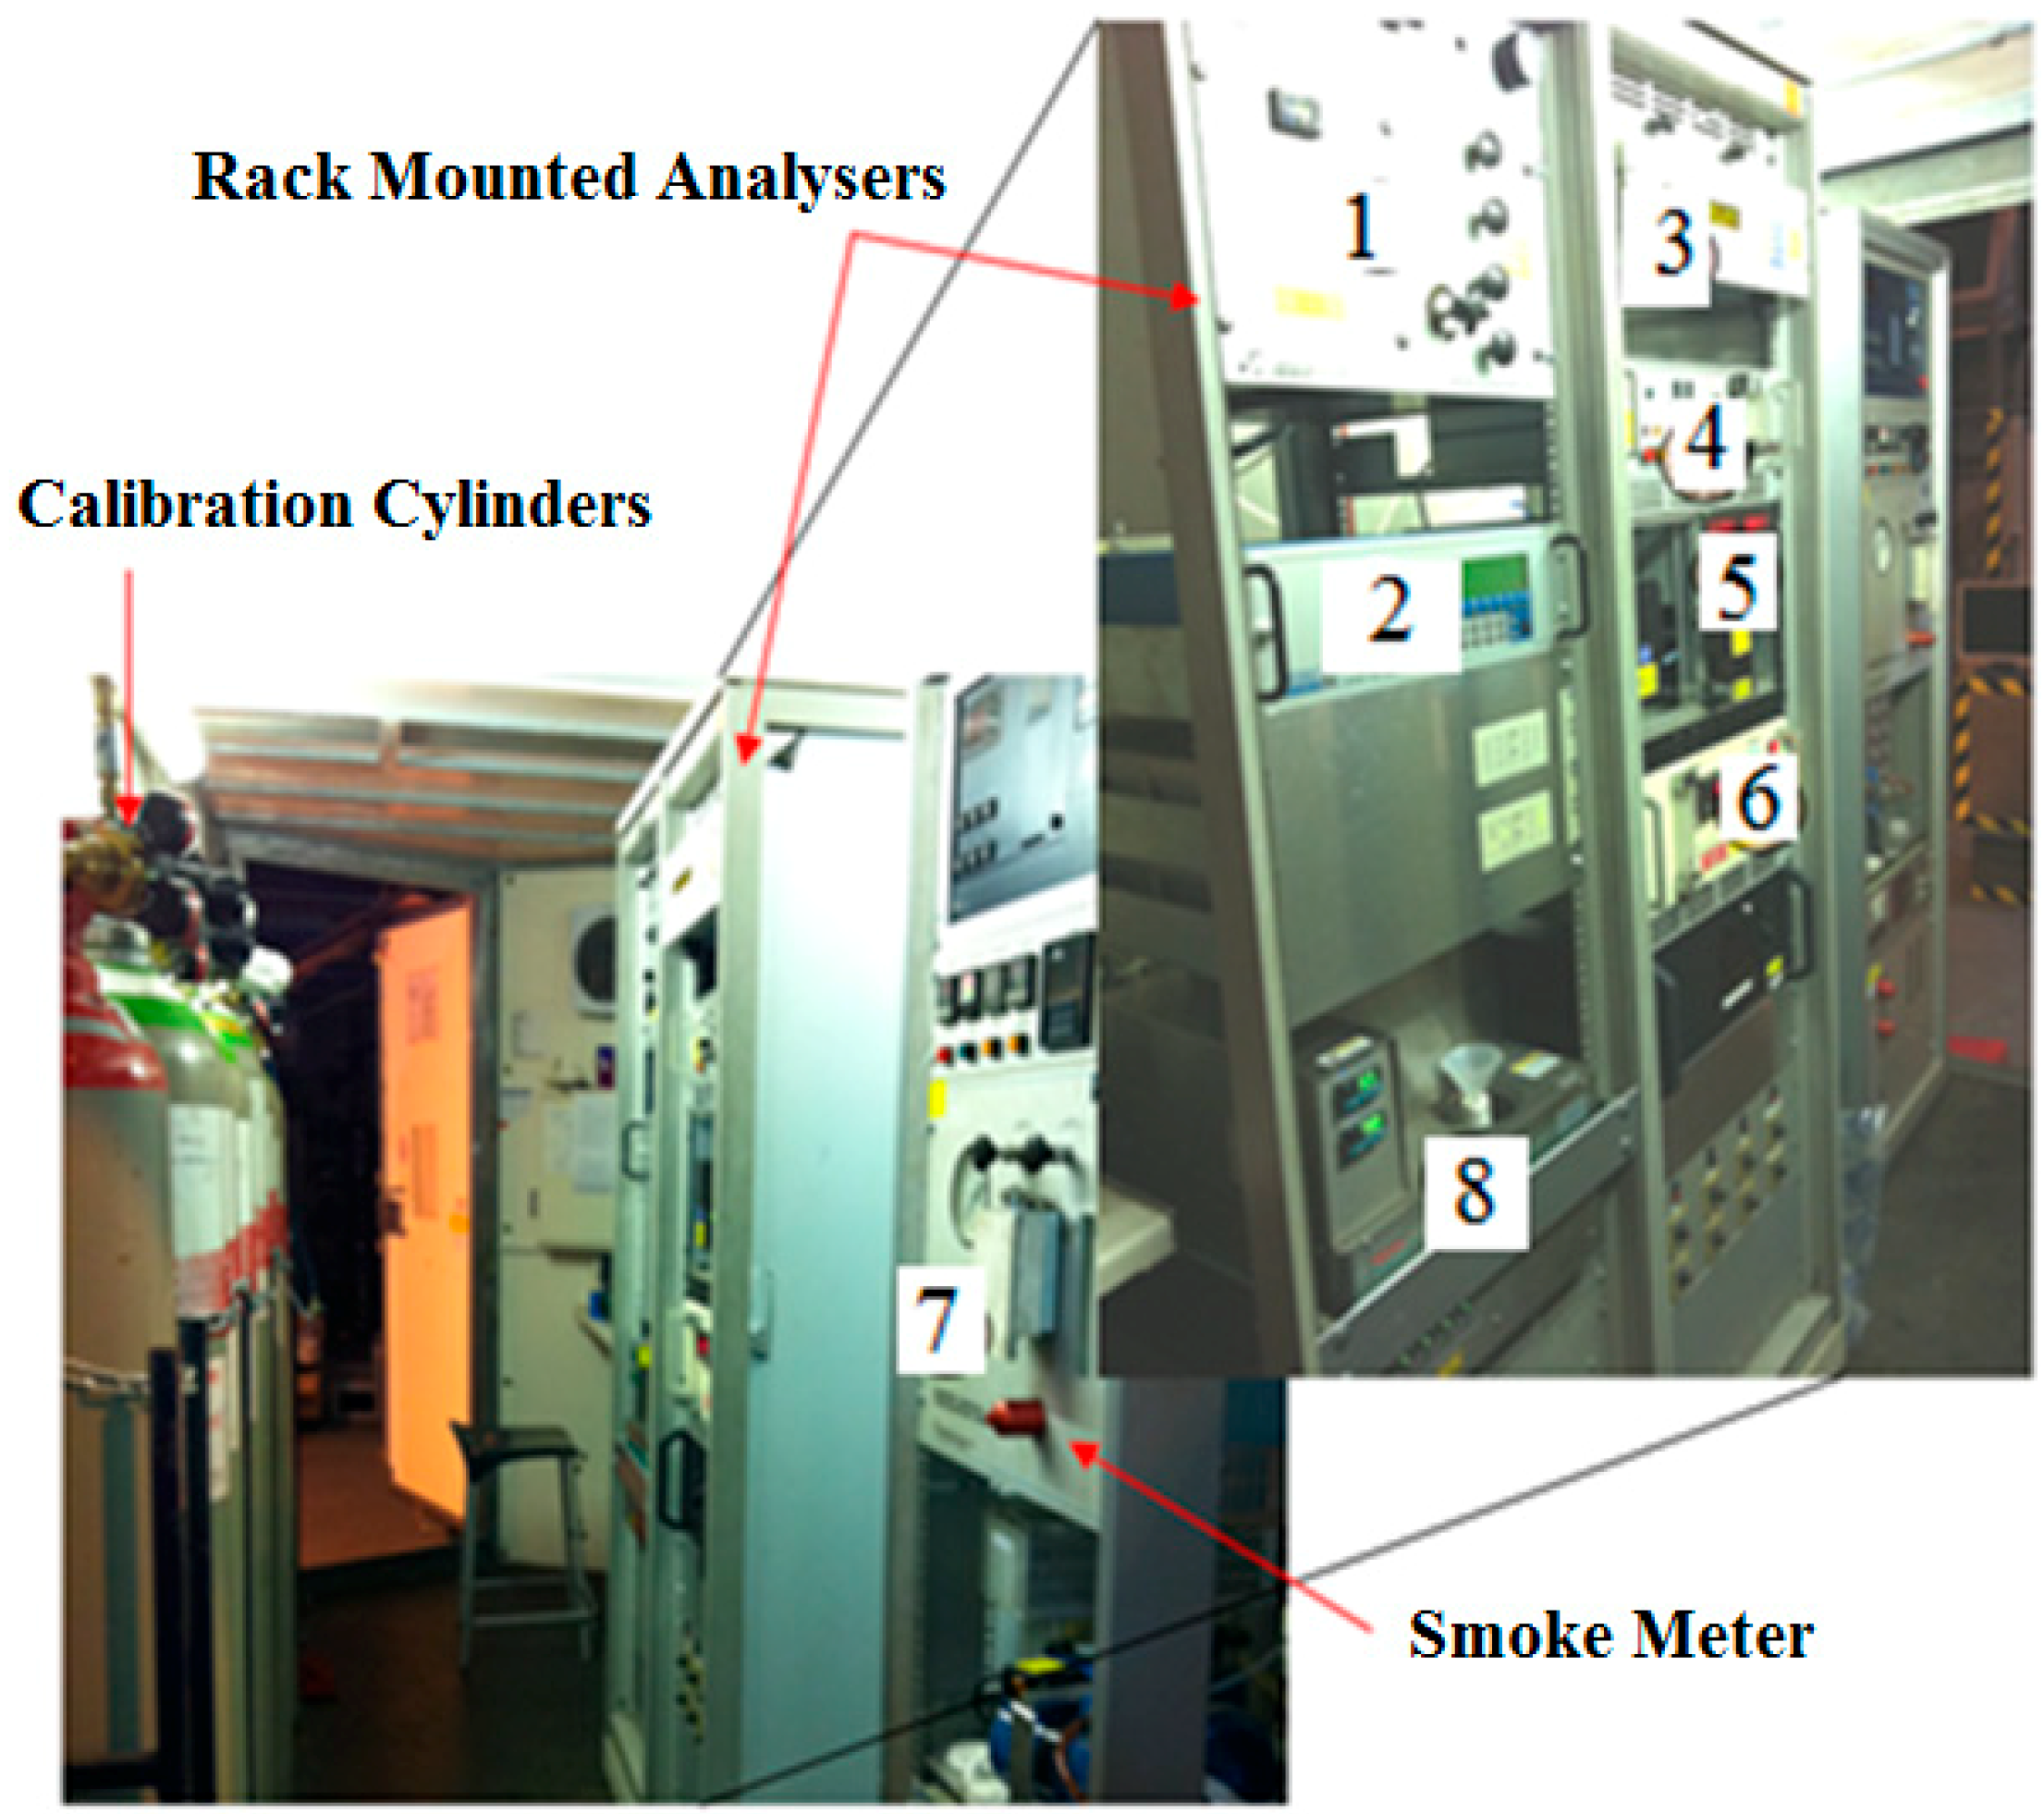
25]. Exhaust blockage was no more than 5% of the exhaust exit plane. A water cooled gaseous emissions probe mounted on the steel plate was used to supply the sample to Sheffield University’s Mobile Emissions Laboratory shown in
Figure 2. These probes were used in the previous campaigns to extract PM and gas samples from the gas turbine engine. A conditioned exhaust sample was inducted into the Mobile Emissions Laboratory through a 1/4 inch heated line before being split between the gaseous analysis suite and the smoke meter using a y-connector. The sample lines were maintained at 150 ± 5 °C as per ARP1256c [
25], with a minimum bend radius of 10× the line diameter. The length of the sample line used was 20 m. A constant sampling flow rate (and system pressure) was maintained for the gaseous analysis equipment by using a metal bellows pump, with excess samples being exhausted through a back pressure regulator. Gaseous emissions (UHC, CO and NO
x) were measured as per ARP1256c [
25]. A Flame Ionization Detector (FID), namely a Signal 3000 HM hydrocarbon analyzer, was used to measure the unburned hydrocarbon in the exhaust stream. In this type of instrument an ion current is produced by burning the sample gas in a hydrogen flame. This current is measured using a detector, and then amplified to provide a total hydrocarbon measurement. In this work, propane was selected as the calibration gas, and therefore the analyzer quantified the UHC emissions in parts per million (ppm) propane equivalents. The concentration of CO and CO
2 emissions in the exhaust stream were characterized using a Rosemount Binos 1000 analyzer. This is a dual channel Non-Dispersive Infrared Analyzer (NDIR) unit which measures the absorption of infrared radiation in the CO and CO
2 frequency band. In order to reduce the interference effect of water in the exhaust sample, a chiller was installed upstream of the NDIR analyzer to dry the sample.
Figure 3 shows the location of sampling probes with reference to the exhaust of the engine.
Figure 2.
Mobile Emissions Laboratory.
Figure 2.
Mobile Emissions Laboratory.
| No. | Analyzer | Gas |
|---|
| 1 | Routing Unit | – |
| 2 | FID | UHC |
| 3 | CLD | NO, NO2, NOx |
| 4 | NOx GEN | – |
| 5 | NDIR, CHILLER | CO, CO2 |
| 6 | MAG | O2 |
| 7 | SMOKE METER | SMOKE |
| 8 | FTIR | UHC |
| 9 | DMS 500 | PM Emissions |
Figure 3.
Sampling probes.
Figure 3.
Sampling probes.
An Eco Physics CLAELht (chemiluminescence) analyzer was used to record NOx in this experiment. The chemiluminescence reaction, namely the light emitted from the transition of electrically excited NO2 (excited by the reaction NO + O3 → NO2), back to its ground state, is the principle employed to measure NO. The NOx concentration is established by first passing the exhaust gas through a catalyzed thermal reaction (2NO2 → 2NO + O2). Oxygen levels in the exhaust sample were also monitored, as a redundant measurement to assess data quality.
The analyzers were zeroed, and then spanned using appropriate gas concentrations just prior to the beginning of each experiment, with the zero and span drift established at engine shutdown. Instrument linearity and interference effects were assessed and corrected for as per the Aerospace Recommended Practices (ARP1256) [
25]. The experimental error associated with the measurement of emissions is estimated to be approximately ±2%. PM size distribution were tested with a Cambustion DMS 500 M271. A separate sampling line heated at 150 ± 5 °C has been used to supply exhaust gases to the DMS 500 with a dilution ratio of 1:10. It has been made sure that there is no shape turn (with a minimum bend radius of 10x the line diameter) in the sampling line for both DMS 500 and Mobile Emissions Laboratory, to avoid error in the readings measured.
SAE smoke number was established using a Richard Oliver smoke meter, Whatman no. 4 filter paper and a Reflectometer (EEL43M Smokestain Reflectometer, Diffusion Systems Ltd., London, UK) as per ARP1179c [
25]. The technique involves passing a set volume of sample through the conditioned filter paper, and measuring the change in the absolute reflectance of the filter paper due to the PM collected. This was performed for all the fuels and three different loads as shown in
Figure 4.
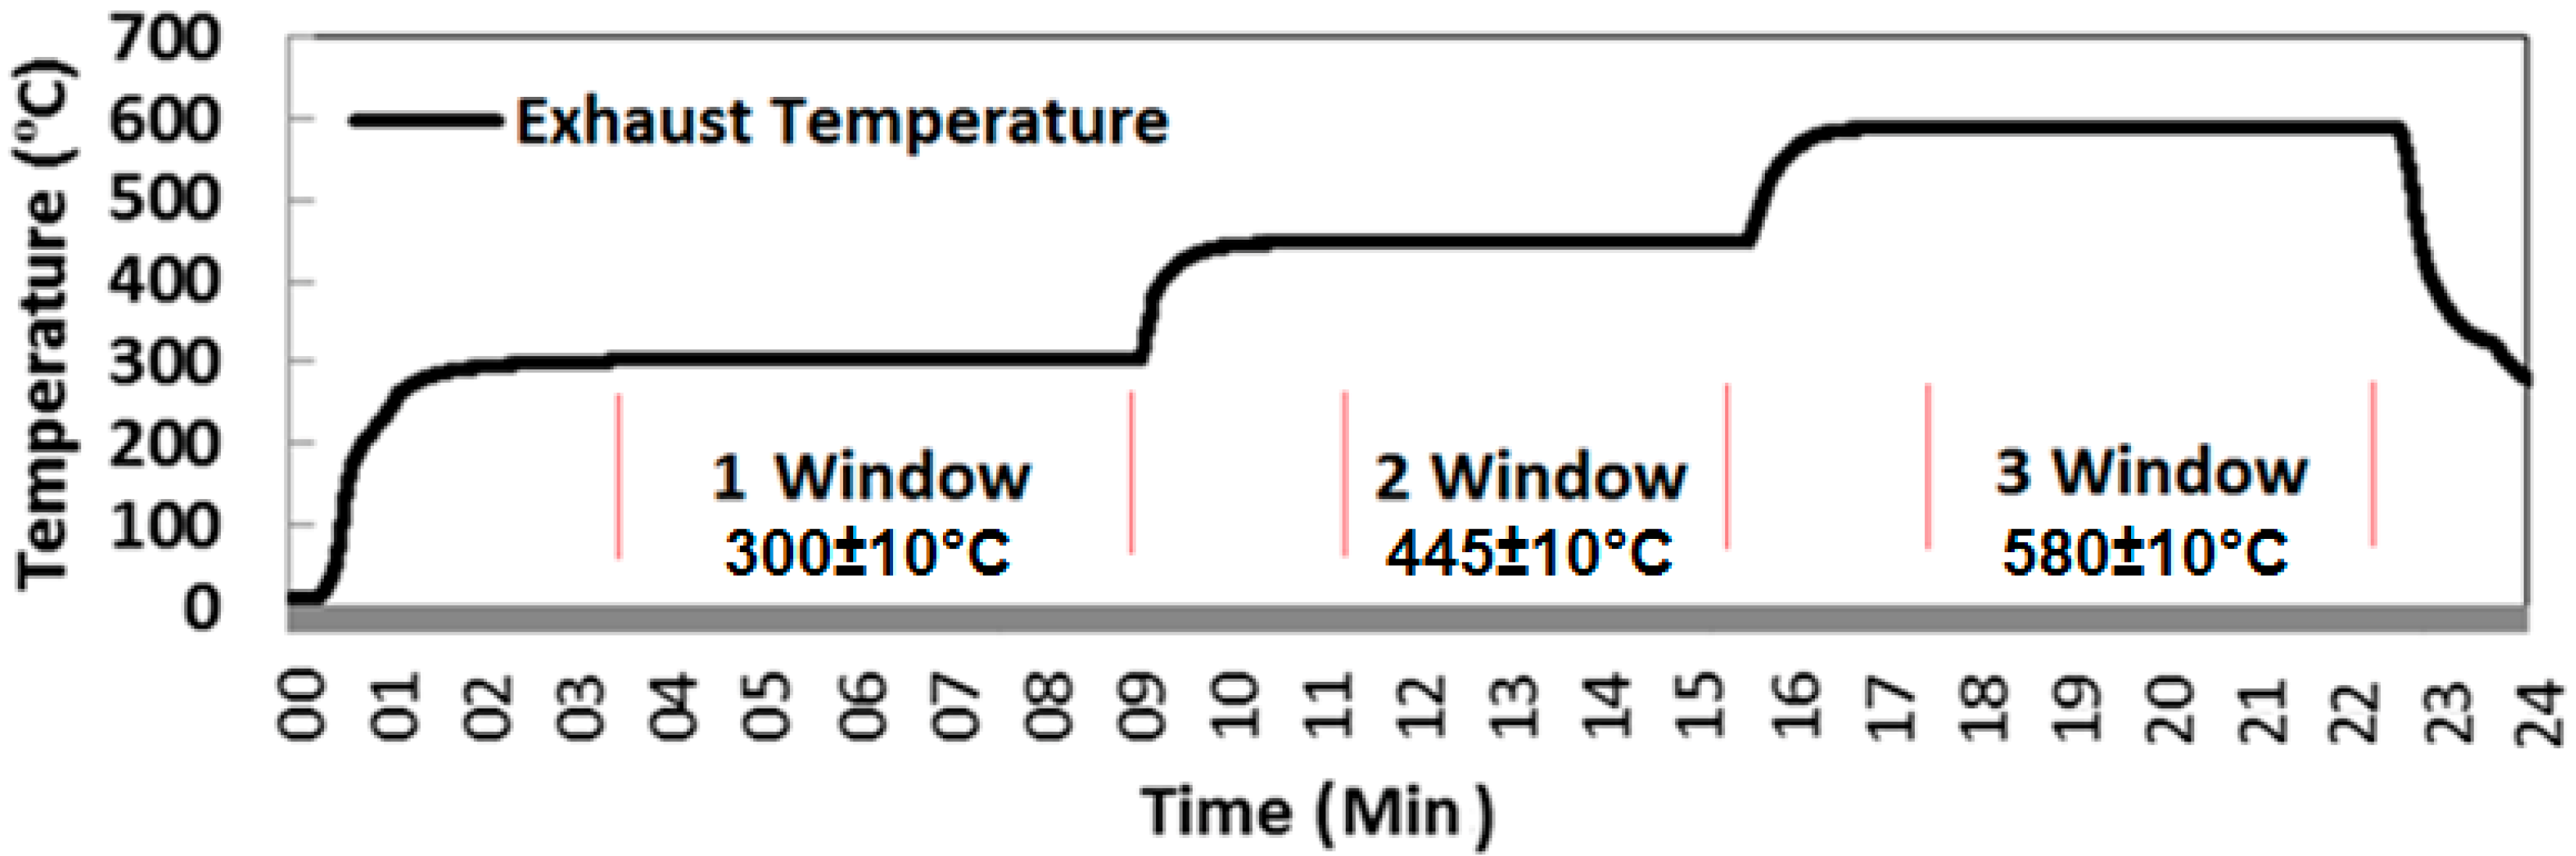
Sampling at the selected test condition was conducted over a 6-minute experimental window once the APU had appeared to be stabilized. The test program involved three different test windows as shown in
Figure 4. One test window (Load 1) is at full RPM when the engine is without any load at an EGT of 300 ± 10 °C and AFR of 130 ± 2, the second test window (Load 2) is with the bleed on at EGT of 445 ± 10 °C and AFR of 75 ± 2 and the third test window (Load 3) with the bleed on at EGT of 580 ± 10 °C and AFR of 50 ± 2, before returning the engine to a full power condition prior to shut down. The full RPM window is considered to be stable when EGT remains constant at 300 ± 5 °C for 3 min. The second and third windows are considered to be stable when EGT remains constant at 445 ± 10 °C and 580 ± 10 °C respectively in addition to the bleed mass flow for 3 min. No dilution was used in measuring the gaseous emissions, but a dilution factor of 10 was used while measuring particulates by DMS500.
Table 2 below shows the engine RPM observed at different conditions with different fuels.
Figure 4.
Exhaust Temperature profile for illustration of engine test windows.
Figure 4.
Exhaust Temperature profile for illustration of engine test windows.
Table 2.
Engine RPM for different fuels at different conditions.
Table 2.
Engine RPM for different fuels at different conditions.
| Conditions | Fuel 1 | Fuel 2 | Fuel 3 | Fuel 4 |
|---|
| Condition 1 | 41,450 | 41,460 | 41,640 | 41,120 |
| Condition 2 | 41,100 | 41,100 | 41,230 | 40,760 |
| Condition 3 | 40,850 | 40,870 | 41,000 | 40,470 |
When turbine jet engines are in use, they create several harmonics over a broadband spectrum creating random vibrations. These vibrations are difficult to characterize over a large band width since they generally have a large number of harmonics with high kurtosis values. Kurtosis is the statistical parameter measurement from a random signal that defines the height-to-width of a resonance peak. Mathematically this is usually defined as:
where,
N is the number of samples. Signals that have higher kurtosis values have higher amplitude peaks but over a shorter bandwidth. This is particularly important with the fatigue and damage potential from the vibrations. In this paper, an approach has been used that determines the average power throughout the entire bandwidth. This is accomplished by a low pass filtering of the time signal using a sixth order Butterworth filter and taking the fast Fourier transform (FFT), of the filtered signal, to find the power spectra. The power spectra are suitable for transients and stationary physical processes to describe the portion of the power from the signal that is at each frequency. However, to understand the overall power of the signal, the power spectra are reduced to an envelope using third order skeleton curves. The area of the skeleton curves is then used to represent amplitude that can be compared to other random vibrations for the same bandwidth.
Figure 5 shows the process of obtaining the signal which was processed by the method described above.
Figure 5.
Flowchart showing the process of obtaining the signal.
Figure 5.
Flowchart showing the process of obtaining the signal.
4. Results and Discussion
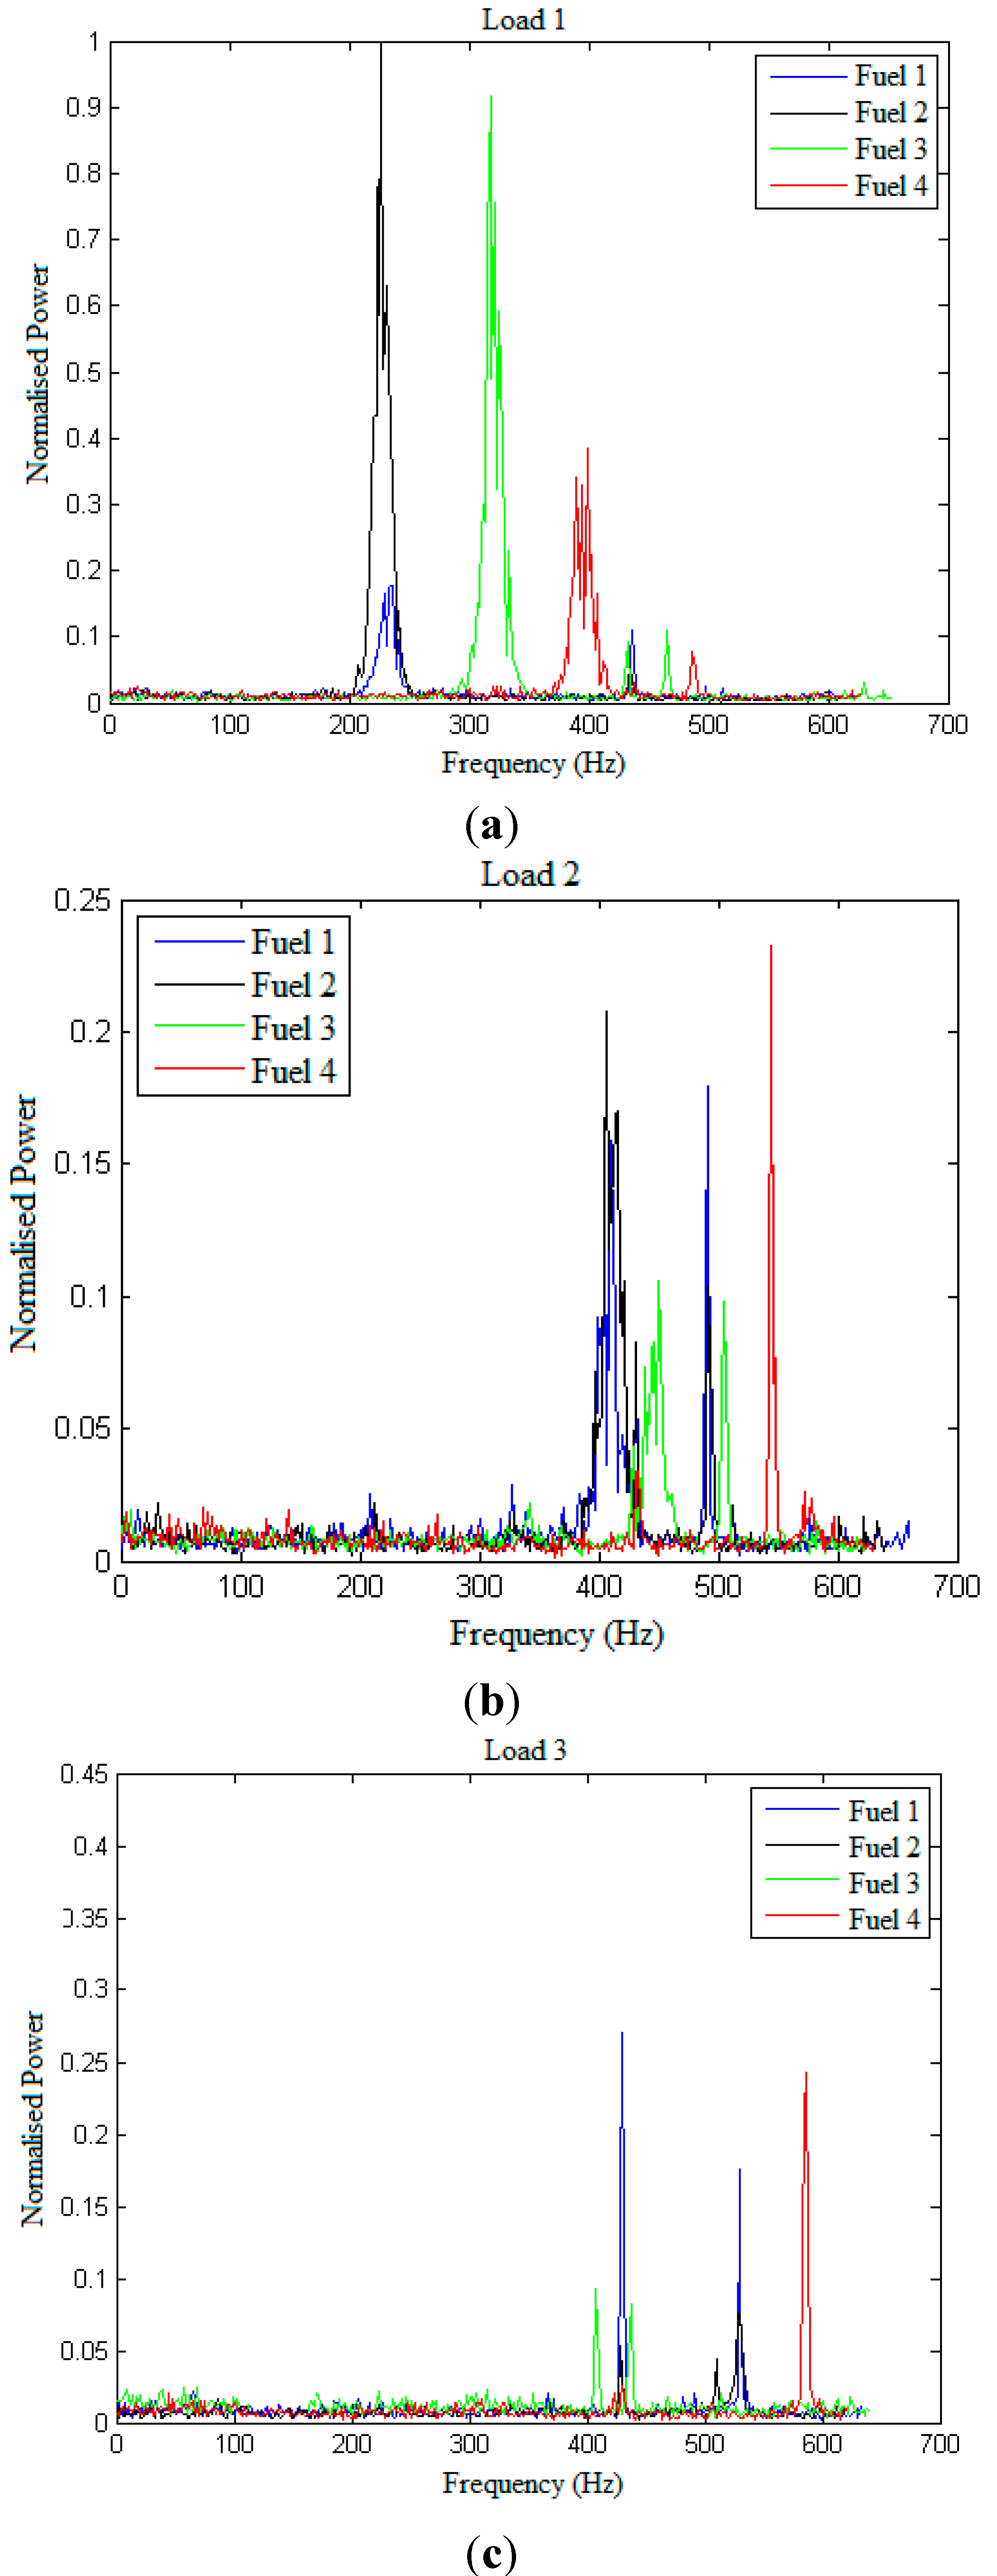
Figure 6a–c shows the normalized power of the fuels at three different loads. The power spectrum for each fuel is normalized to the power spectrum of the Fuel 2, Load 1 since this fuel and load has the highest peak power. From
Figure 6a it can be observed that at Load 1, Fuel 1 and Fuel 2 have the first peak at the same frequency range (between 200–300 Hz). Fuel 3 and Fuel 4 show lower but multiple spikes in the frequency range of 300–500 Hz and 350–500 Hz respectively. This shows the effect of full rpm on the fuel performance. The difference in magnitude of the instabilities in the fuels could be the effect of the varied fuel components. Fuel 4 containing zero aromatic content, gives the least normalized power. From
Figure 6b, Load 2 is seen to give the minimum power among the three loads of the order of 10
−5. It is again observed that Fuel 1 and Fuel 2 peak at near the same frequency of about 400 Hz.
Figure 6c, shows the previous trend of peaks of Fuel 1 and Fuel 2 at same frequency range. However, Fuel 1 is seen to give negligible instability.
Fuel 1 and fuel 2 being the same fuel (Jet A-1), have peaks at the same frequency but different amplitudes of power. It is possible that different chemical components or percentage composition of the same fuel respond with varied vibrational amplitude. In addition, the amplitude of both fuels inverse from load 1 to load 3. At Load 1 Fuel 2 has a larger amplitude than Fuel 1. However, at Load 3, this seems to have inversed and Fuel 1 has a greater amplitude than Fuel 2.
It is seen that at Load 1 (full rpm), the power is at it the lower frequencies when compared to the other loads. However, as the load varies from Load 1 to Load 3, the power shifts to higher frequencies with exception for Fuel 3.
The normalized power for Fuel 4 (with zero aromatics) varies little for the all three loads unlike the other fuels.
Figure 7 shows the comparison of normalized broadband amplitude from the power spectra for the different fuels at various loads. These are normalized to Load 1, Fuel 2 to represent unity within the figure. It is observed that Fuel 1 has little change in its amplitude. Fuel 2 and Fuel 4 decrease in amplitude from Loads 1 to 3. Fuel 3 is greatly influenced with the change in load compared to other the fuels. Fuel 4, shows to have a lower vibrational change over a range of loads compared to the other synthetic substitute (Fuel 3).
Figure 6.
Comparison of normalized power spectra for different fuels for (a) Load 1, (b) Load 2, and (c) Load 3.
Figure 6.
Comparison of normalized power spectra for different fuels for (a) Load 1, (b) Load 2, and (c) Load 3.
Figure 7.
Comparison of normalized amplitude over entire bandwidth for Fuels 1–4 at Loads 1–3.
Figure 7.
Comparison of normalized amplitude over entire bandwidth for Fuels 1–4 at Loads 1–3.
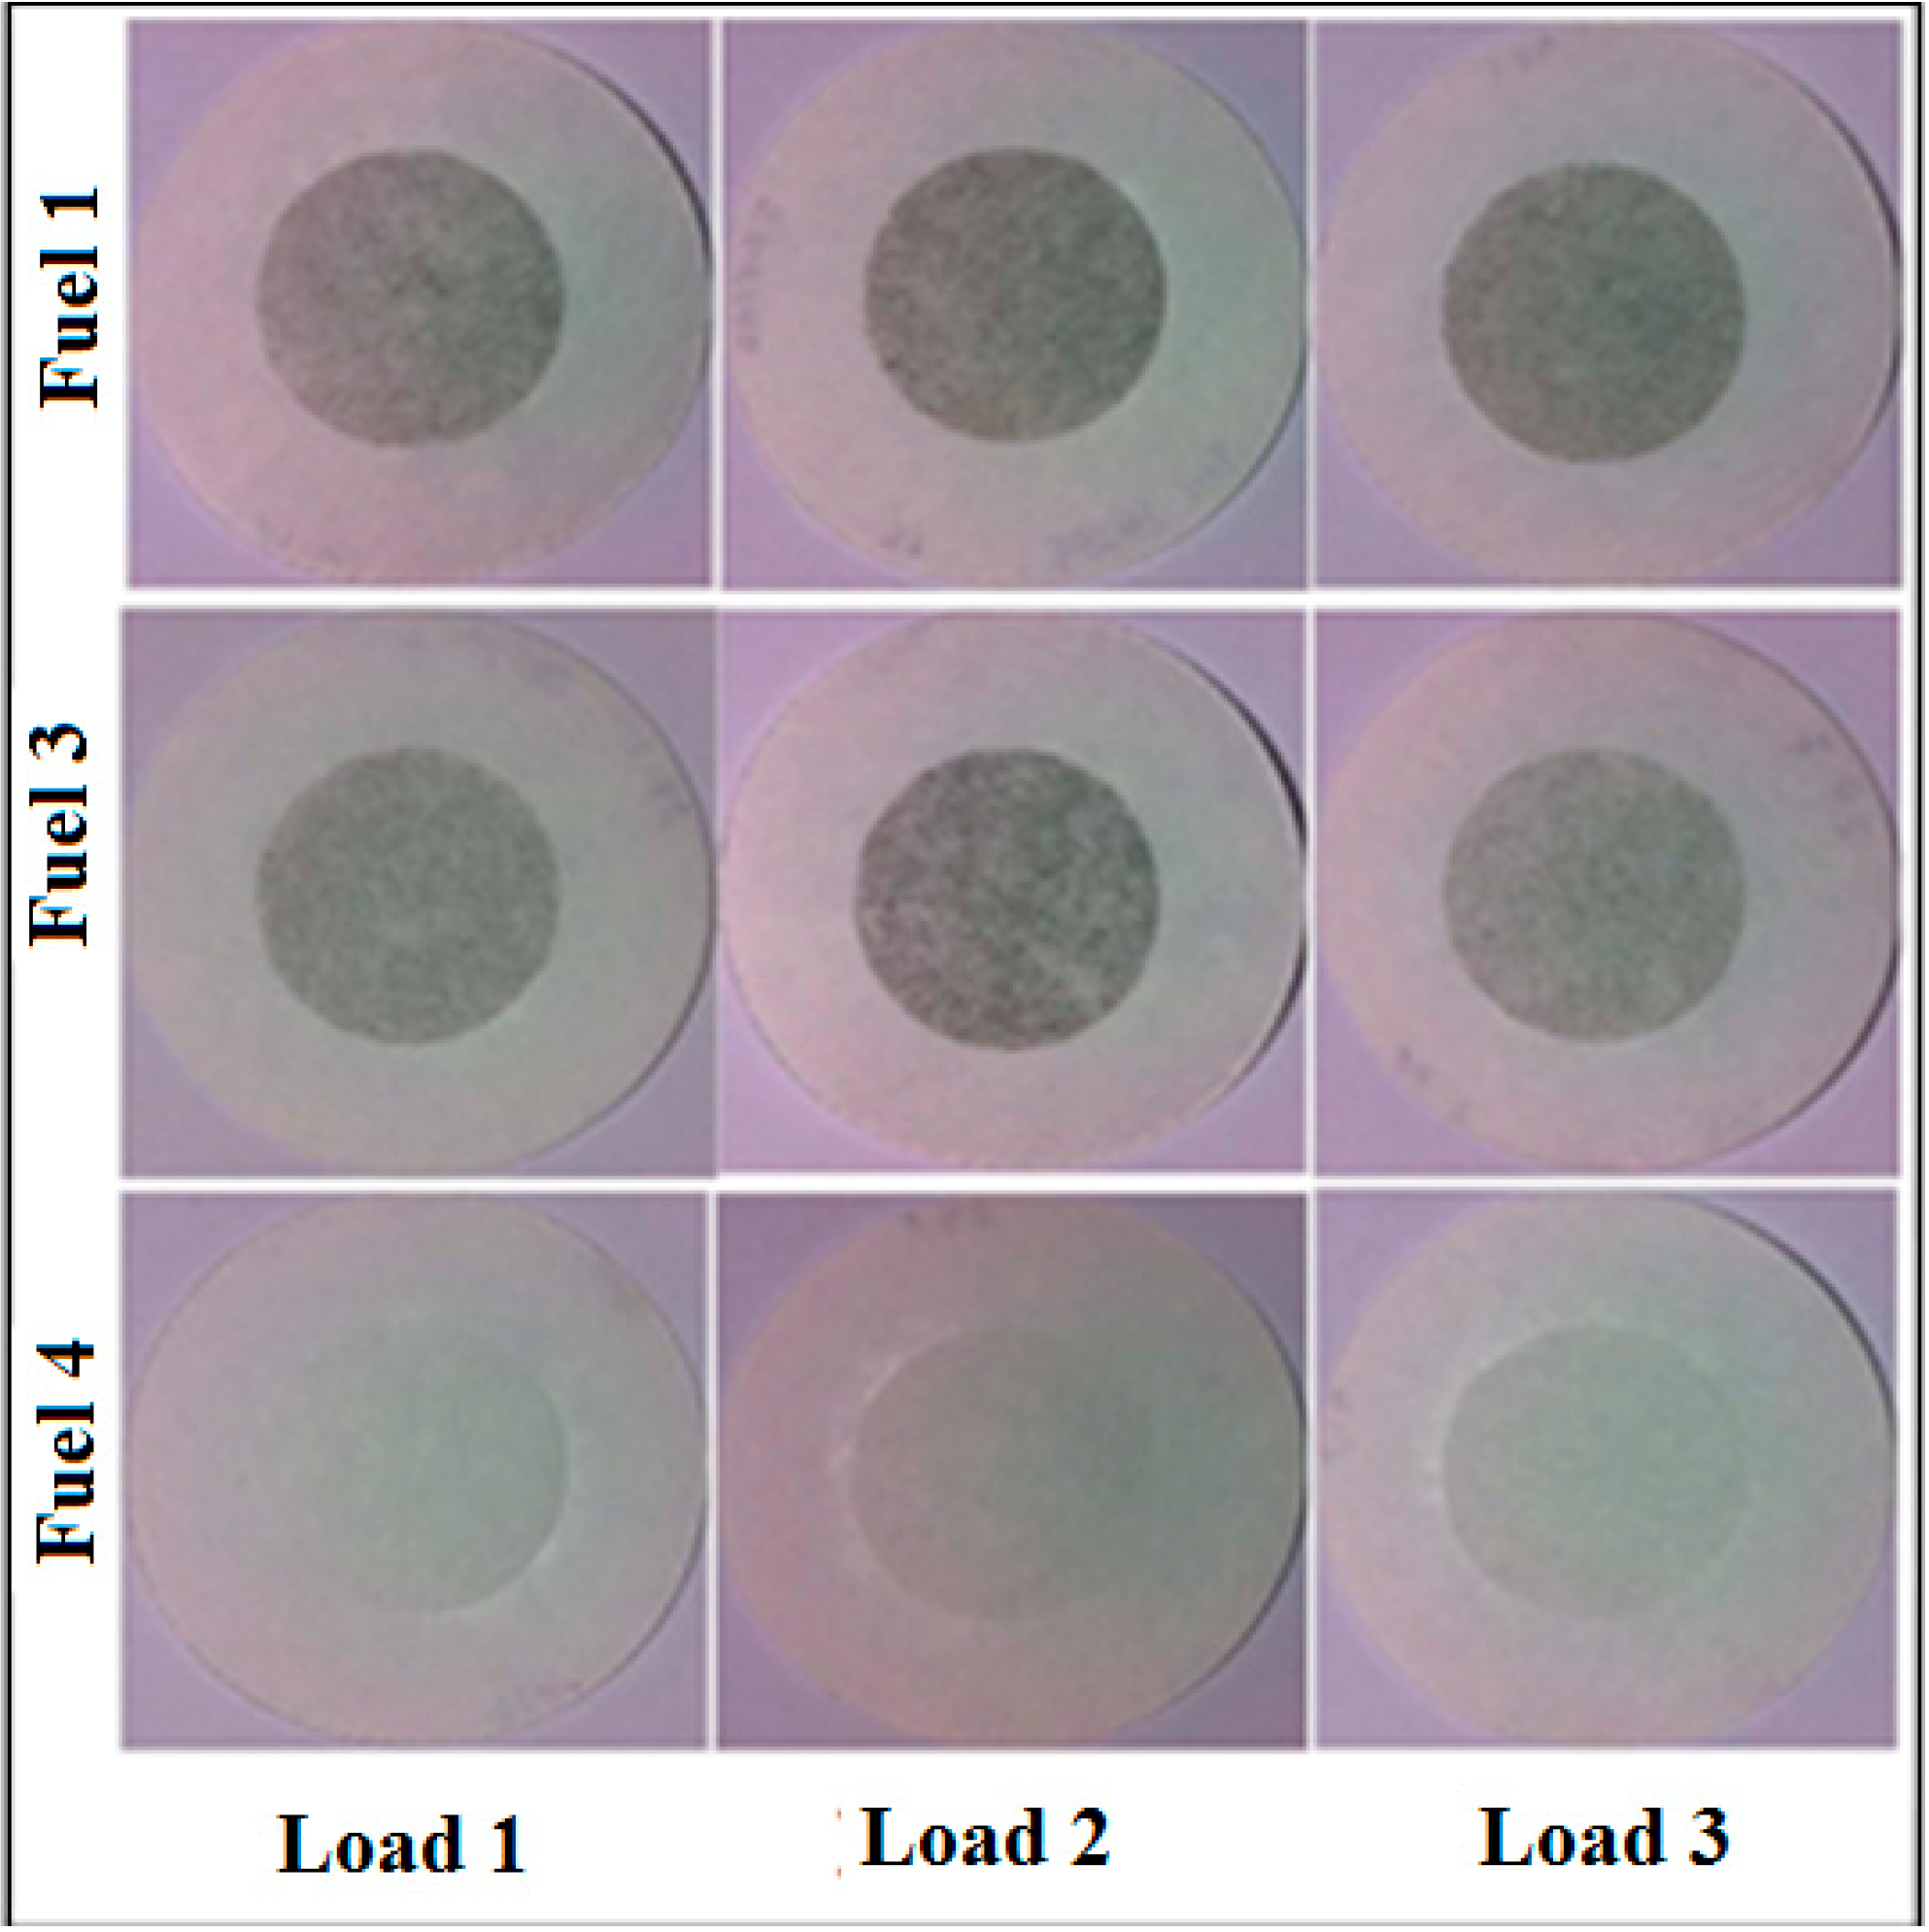
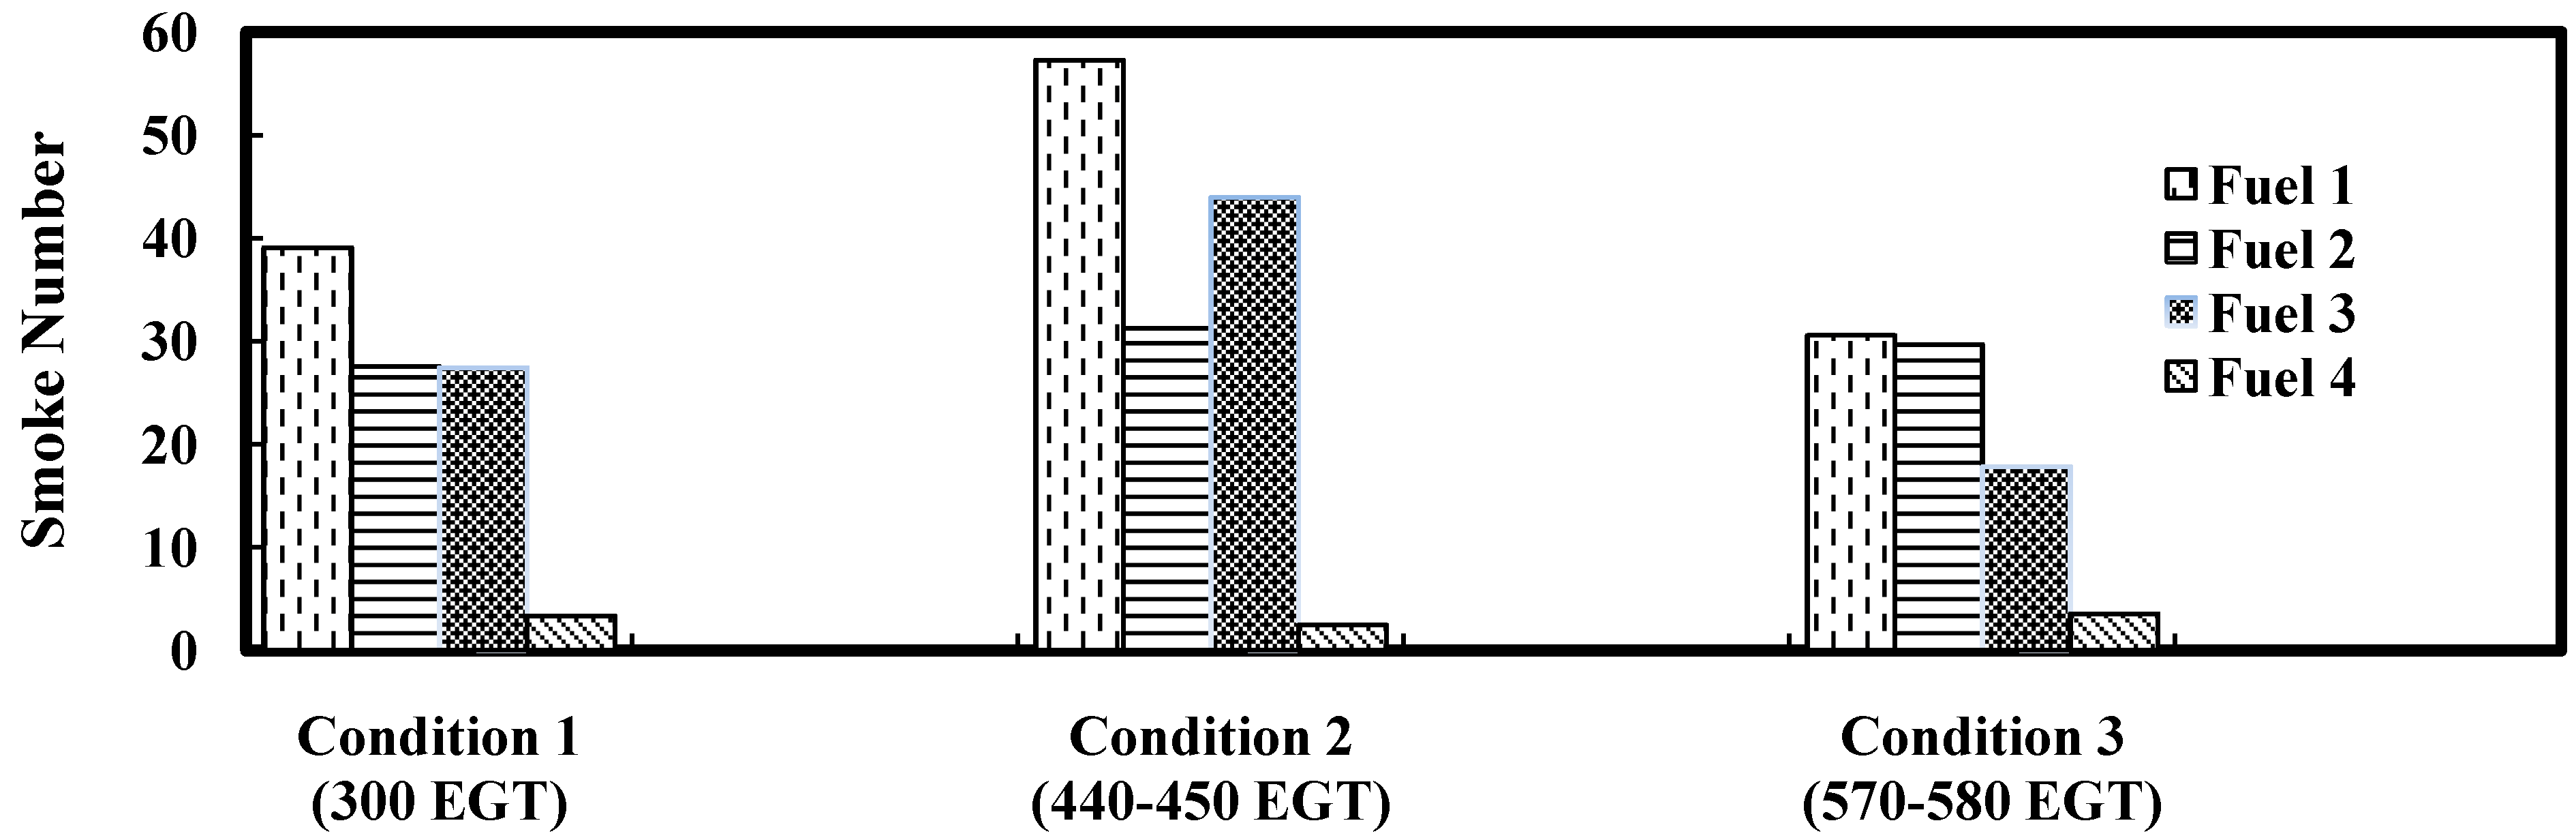
Figure 8 shows actual pictures of Whatman No 4 filter papers for smoke Fuel 1, Fuel 2 and Fuel 3 at three loads. SAE smoke numbers for all the fuels tested in this study are presented in
Figure 9. The accepted accuracy of the method is ±3 smoke numbers. It is observed that Fuel 4 produces substantially lower smoke as compared to other fuels tested in this study. It may be because Fuel 4 has no aromatic content which leads to substantial reduction in smoke emissions. Smoke emissions produced by Fuels 2 and 3 are comparatively similar at full RPM (load 1) as compared to smoke produced by Fuel 1. It was observed that Fuel 1 produced the maximum smoke at all operating conditions. Change of load had little effect on Fuel 2 as far as smoke production is concerned. Though the total aromatic content may be similar in both Fuel 1 and Fuel 2, but the composition and type of aromatics may be different (being from different sources) and that may cause varying smoke emissions.
Figure 8.
Actual Pictures of Whatman No 4 filter paper for smoke.
Figure 8.
Actual Pictures of Whatman No 4 filter paper for smoke.
Figure 9.
Smoke Number for different fuels at various loads.
Figure 9.
Smoke Number for different fuels at various loads.
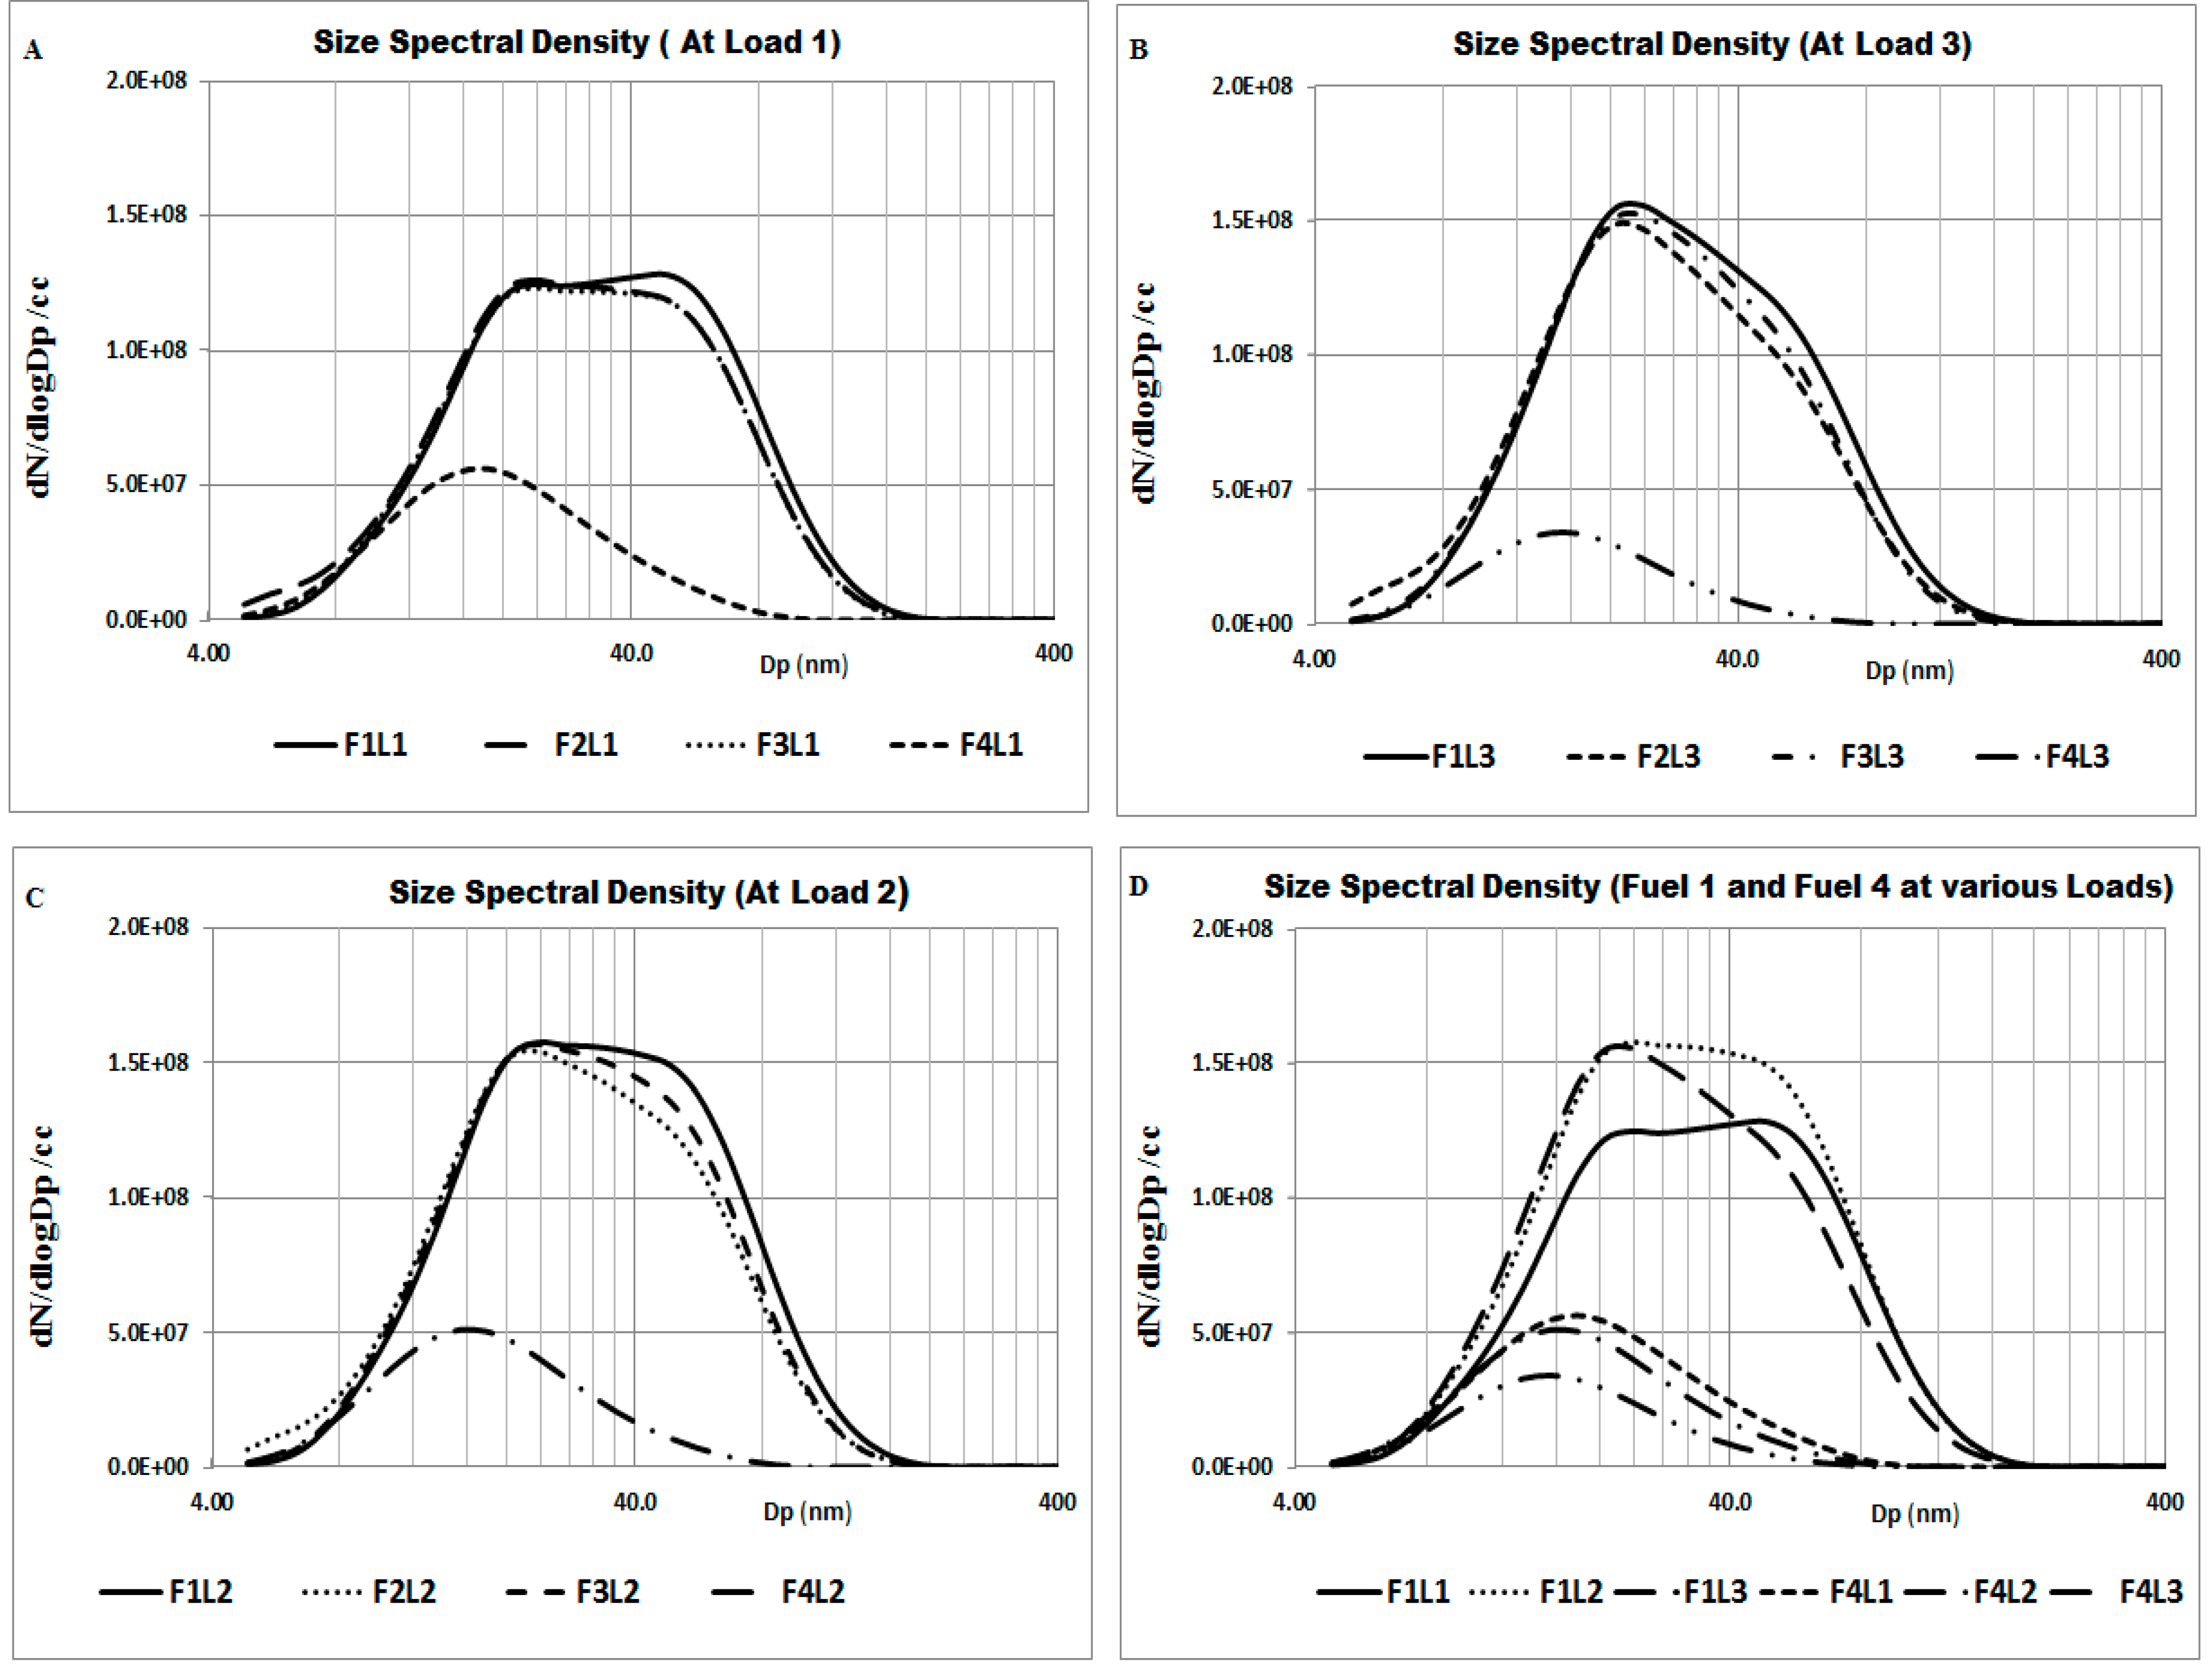
“F” and “L” in the
Figure 10 stand for fuel and load respectively. It is observed from
Figure 10 that particulate emissions show different trends for various fuels at varied loads. It is observed from
Figure 10A–C that Load 1 gives lower particulate emissions for all fuels compared to other loads. In addition, there is a significant difference in particulate emissions between Fuels 1, 2, 3 and Fuel 4 at all loads. This shows Fuel 4 to be a better fuel in terms of emissions produced at all operating conditions. Similar trends were also observed by Corporan
et al. [
12].
Figure 10.
Comparison of particulate emissions at different loads.
Figure 10.
Comparison of particulate emissions at different loads.
Figure 10D shows the comparison of Fuel 1 and Fuel 4 at different loads. It is observed that with the change of load from Load 1 to Load 3, the particulate emissions of Fuel 4 decreases, whereas, for Fuel 1 the emissions increase. Fuel 2 and Fuel 3 also show trends like that of Fuel 1. Hence, Fuel 4 having no aromatic content, it is observed that particulate emissions are substantially lower than fuels which contain higher aromatic content.
Table 3 shows the gaseous emissions analysis done in the mobile emission laboratory for Loads 1–3. It is observed that most of the gases measured, for all the fuels tested, are nearly the same. The gases which are measured are carbon dioxide (CO
2), carbon monoxide (CO), nitrogen oxide (NO
x), nitrogen di-oxide (NO
2), nitrogen mono-oxide (NO), unburned hydrocarbon (THC) and oxygen (O
2). Uncertainty of the readings has been mentioned in the
Table 3. Lower readings of CO were measured for Fuel 4 at all the three loads. It is observed that at Load 2, the unburned hydrocarbon increases substantially and at Load 3 there are no unburned hydrocarbon. Fuel 4 shows a lower amount of CO and NO
x as compared to Fuel 1 and 3. Overall in the gaseous emissions analysis it is observed that Fuel 4 shows marginally better performance as compared to the other fuels studied in this work.
Table 3.
Gaseous emissions analysis at all three loads.
Table 3.
Gaseous emissions analysis at all three loads.
| Emissions | Uncertainty | Load 1 | Load 2 | Load 3 |
|---|
| Fuel 1 | Fuel 2 | Fuel 3 | Fuel 4 | Fuel 1 | Fuel 2 | Fuel 3 | Fuel 4 | Fuel 1 | Fuel 2 | Fuel 3 | Fuel 4 |
|---|
| CO2 (EI) | ±10 | 3175 | 3173 | 3185 | 3201 | 3170 | 3169 | 3162 | 3172 | 3171 | 3169 | 3169 | 3173 |
| CO (EI) | ±2 | 33.8 | 34 | 35.4 | 30.2 | 22.8 | 23.8 | 24.3 | 21.4 | 14.1 | 14.1 | 14.4 | 12.7 |
| NOx (ppm) | ±0.1 | 19 | 19.1 | 19.3 | 18.3 | 32.3 | 32.3 | 31.7 | 31.6 | 48.1 | 48.3 | 47 | 46.3 |
| NO (ppm) | ±0.1 | 11.9 | 12.1 | 10.5 | 11.1 | 15.9 | 15.9 | 14.6 | 14.5 | 14 | 14 | 13.5 | 13.3 |
| NO2 (ppm) | ±0.1 | 8 | 7 | 8.5 | 7.3 | 16.5 | 16.5 | 17 | 16.6 | 34 | 34.3 | 33.4 | 33.1 |
| THC (ppmC) | ±1 | 76.1 | 69.7 | 6 | 3 | 3 | 0 | 55 | 25 | 0 | 0 | 0 | 0 |
| Oxygen (%) | ±0.2 | 18.4 | 18.4 | 18.4 | 18.5 | 16.7 | 16.7 | 16.7 | 16.9 | 15.2 | 15.2 | 15 | 15.2 |
5. Conclusions
Detailed analysis for the vibrations and emissions for Jet A-1 sourced from two different suppliers, thermally stressed 100% SPK and Fully Formulated Synthetic Jet Fuel has been presented and compared in this work. From the vibration analysis, it is observed that the different fuels produce varied power spectra from various loading. These spectra can be assigned a broadband amplitude that could be used for a design criterion. Fuel 4 showed better operational stability over a range of engine loads when compared to the others. This attributed to the fact that Fuel 4 can be a viable alternate fuel with higher mechanical suitability and with lower environmental emissions. Fuel 1 and Fuel 2, being from different sources, showed peak amplitudes at the same frequency range but with different amplitudes.
It is observed that particulates of higher size are almost negligible and particulates of lower size are substantially lower, in case of synthetic fuels, than Jet A-1. It is also observed that aromatic content could play a vital role in emissions of particulates. The range of alternative fuels available for the use in present range of aircrafts is significantly restricted due to requirement of drop-in fuels. Present results show that there is a good potential for 100% SPK fuels without aromatics to be used in aviation. Fuel with no aromatic content poses several other problems related to lubricity and seal swells which are engineering challenges which needs further development. In addition, with the inception of new alternative fuels, further investigations are required to understand the effects of fuel components on vibration and eventually the whole engine.

