Communicating Climate Mitigation and Adaptation Efforts in American Cities


1
Department of Political Science, Trinity College Dublin, Dublin D2, Ireland
2
Department of Politics, University of Exeter and the Exeter Q-Step Centre, Exeter EX4 4RJ, UK
3
Department of Political Science, Tulane University, New Orleans, LA 70118, USA
*
Author to whom correspondence should be addressed.
†
These authors contributed equally to this work.
‡
Current address: University of Exeter, Clayden Building, Exeter EX4 4PE, UK.
Climate 2019, 7(3), 45; https://doi.org/10.3390/cli7030045
Submission received: 25 February 2019
/
Revised: 13 March 2019
/
Accepted: 16 March 2019
/
Published: 24 March 2019
(This article belongs to the Special Issue Climate Change Resilience and Urban Sustainability)
Abstract
:City governments have a large role to play in climate change mitigation and adaptation policies, given that urban locales are responsible for disproportionately high levels of greenhouse gas (GHG) emissions and are on the “front lines” of observed and anticipated climate change impacts. This study examines how US mayors prioritize climate policies within the context of the city agenda. Employing a computer-assisted content analysis of over 2886 mayoral press releases related to climate change from 82 major American cities for the period 2010–2016, we describe and explain the extent to which city governments discuss mitigation and adaptation policies in official communications. Specifically, we rely on a semi-supervised topic model to measure key climate policy themes in city press releases and examine their correlates using a multilevel statistical model. Our results suggest that while mitigation policies tend to dominate the city agenda on climate policy, discussion of adaptation efforts has risen dramatically in the past few years. Further, our statistical analysis indicates that partisanship influences city discussion on a range of climate policy areas—including emissions, land use policy, and climate resiliency—while projected vulnerability to climatic risks only influences discussion of climate resiliency and adaptation efforts.
1. Introduction
Recent reports highlight the challenges of limiting global warming to 1.5 C above pre-industrial levels and underscore the need for aggressive policy action across multiple levels of government [1]. Cities across the globe are on the front line in the fight for climate action, both in terms of their potential to mitigate the release of greenhouse gases (GHGs) and their need to adapt to negative climatic impacts. Urban areas are major sources of greenhouse gas emissions—a 2016 report from the International Energy Agency found that urban areas accounted for over 70% of total carbon emissions and these emissions are projected to increase over time [2]. As such, major cities across the globe have a considerable opportunity to address GHG emissions in a meaningful way. Urban areas are also highly vulnerable to climatic impacts, as many major cities are located in low-lying coastal areas [3]. Indeed, these cities’ climate vulnerability is realized both through direct effects (e.g., sea level rise) and as primary sites of climate multiplier effects (e.g., urban heat island effect) [4], which may require that cities engage in action. Given the strategic importance of cities as actors on climate issues and the immediacy of current climate policy challenges, it is essential to understand the extent to which cities are prioritizing climate change in an environment characterized by diverse local policy concerns.
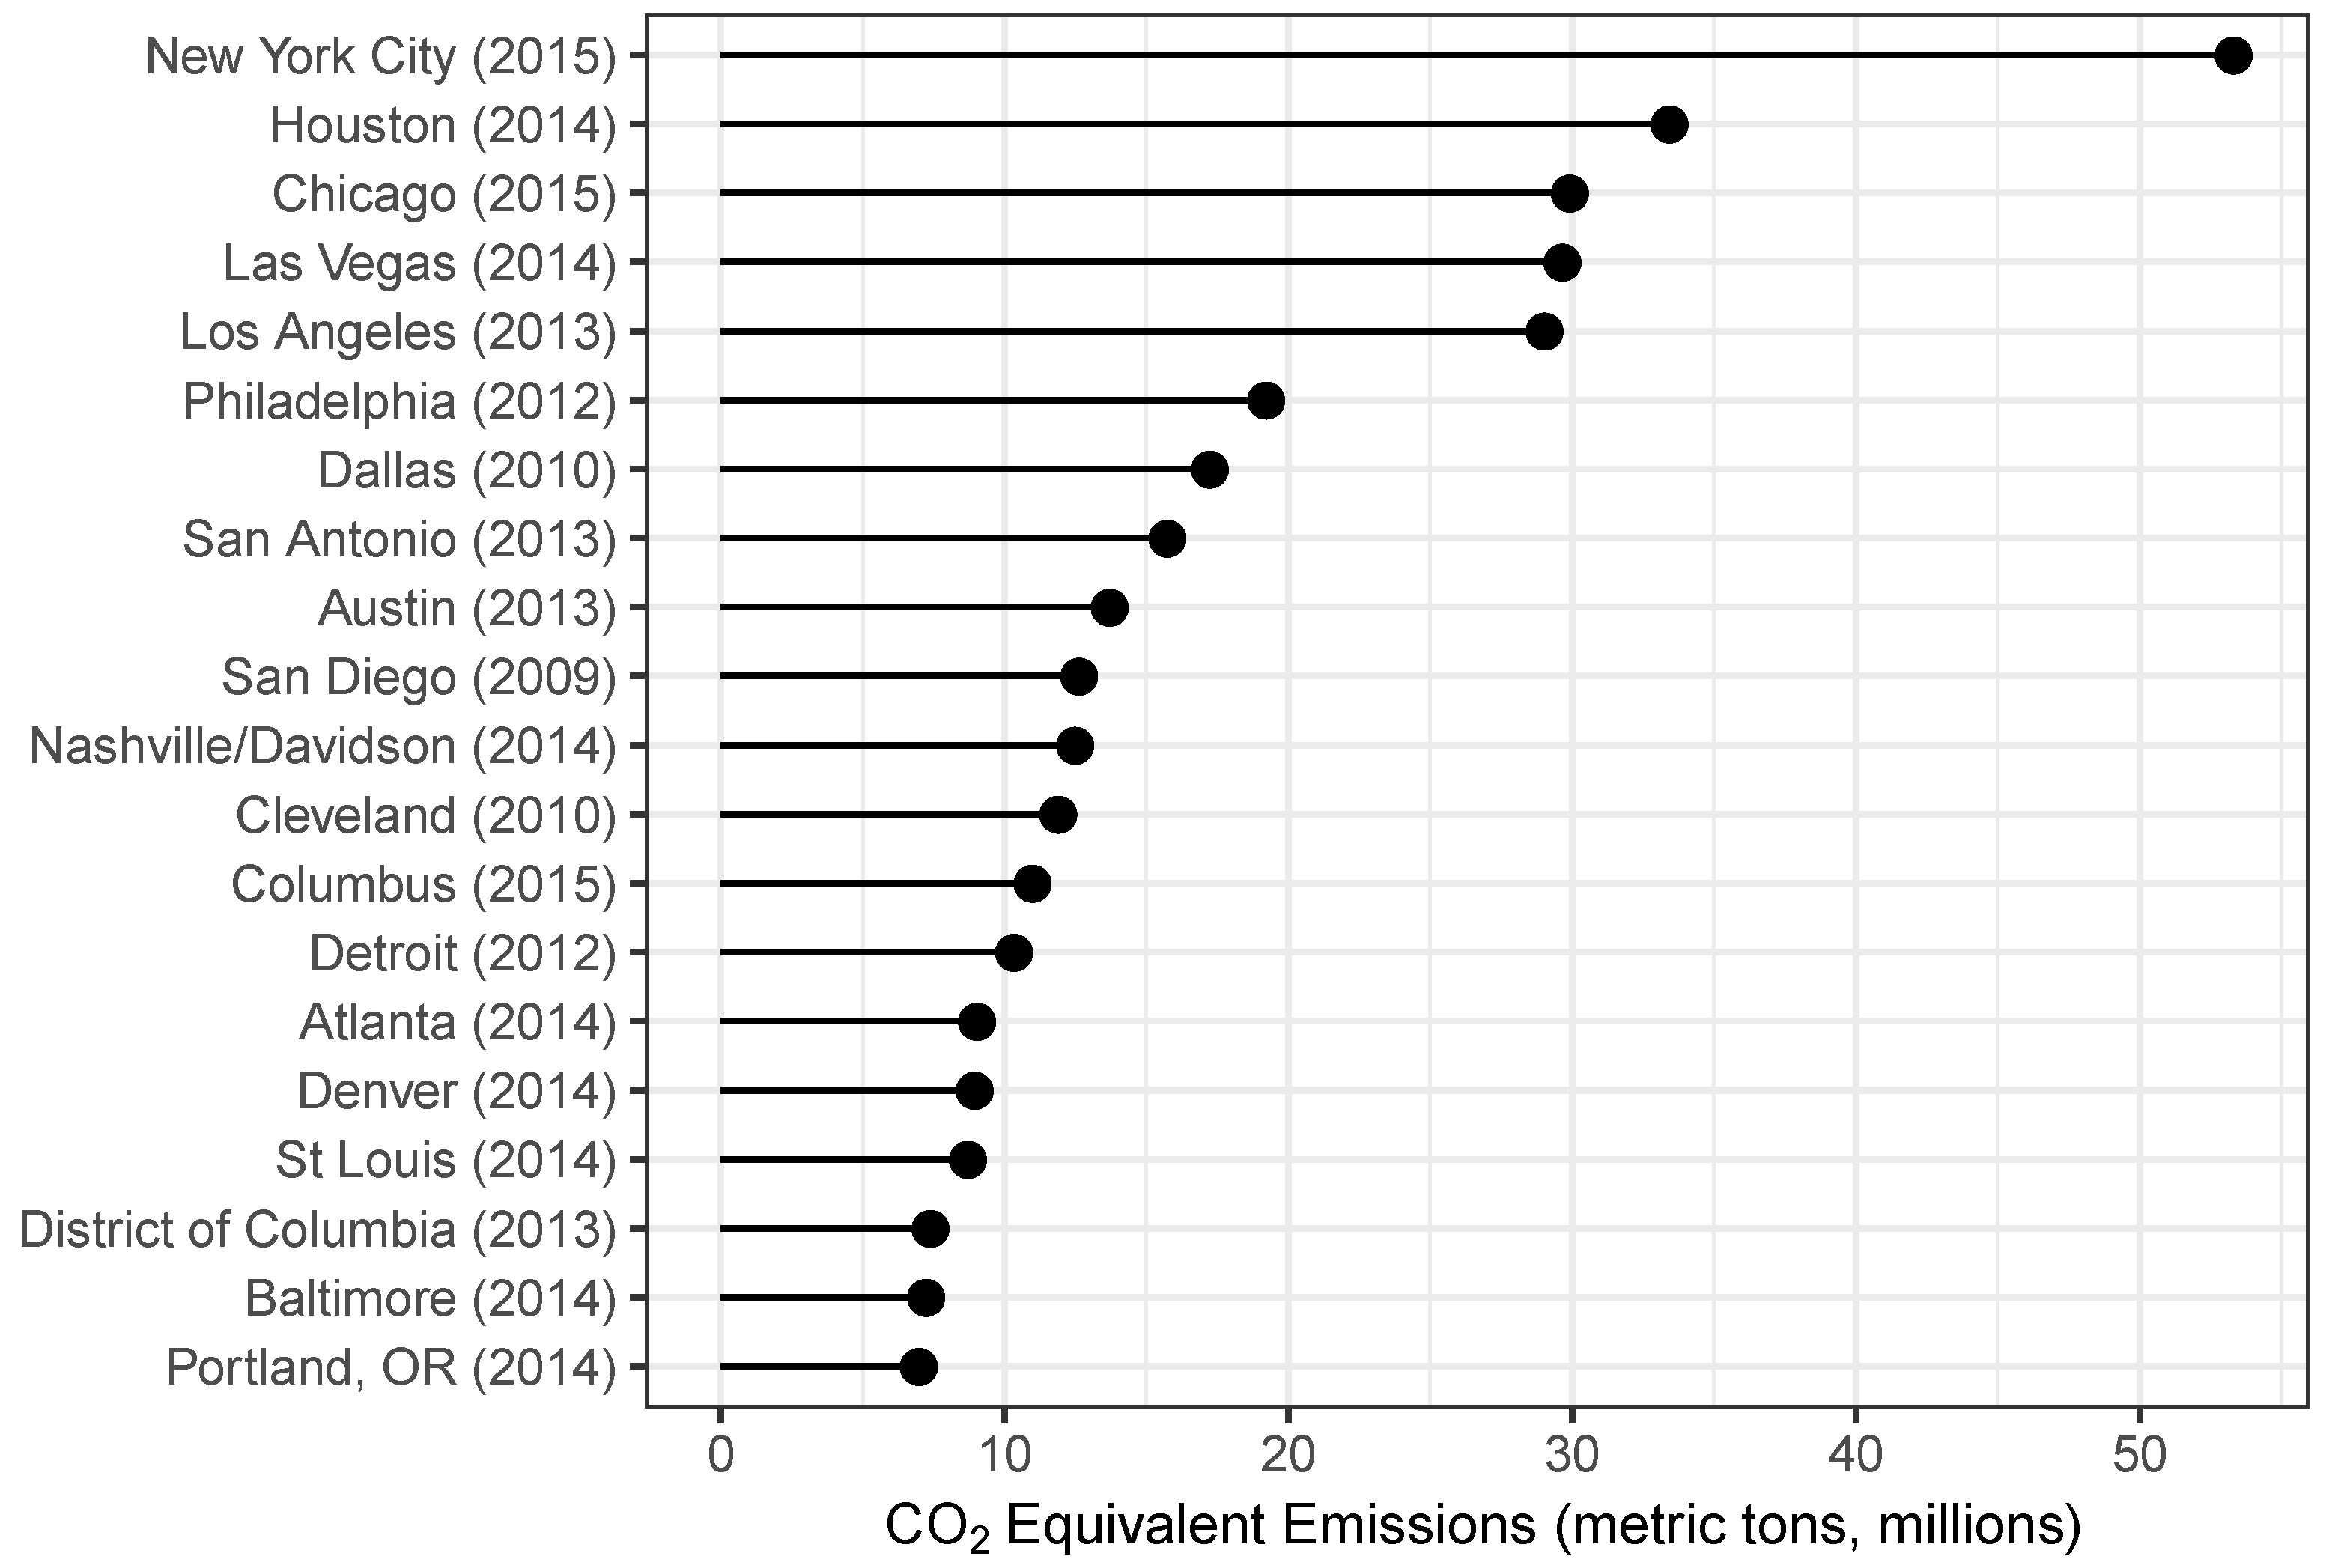
American cities have a particularly important role to play in combating climate change. First, American cities are significant emitters of GHGs. As demonstrated in Figure 1, the top 20 American cities in terms of GHG emissions have a population of 30 million and produced roughly 348 million metric tons of CO and other GHGs in a single year. To put this statistic in perspective, the 2014 emissions of France amounted to around 440 million metric tons of GHGs for a population of roughly 66 million [5]. Second, most large cities are located in places that are vulnerable to climate change impacts, including on coasts (e.g., New York, San Francisco, and Seattle), in low-lying areas already facing problems from sea level rise (e.g., New Orleans, Miami, and Houston), and in environments where weather volatility could dramatically curtail quality of life (e.g., Phoenix, Chicago, and Minneapolis) [6]. Moreover, the population of these cities represent a sizable proportion of the U.S. population and urbanization is projected to increase over time [7]. Thus, increasing population, rising emissions, and climate vulnerability make global warming a salient issue for urban America. Lastly, the U.S. federal government’s lack of action on climate change [8,9,10,11] has provided a vacuum and policy opportunity for sub-national governments (including state and local governments) to play an important role in climate mitigation and adaptation [12,13]. States and cities are often left with large amounts of discretion to address this policy challenge as they see fit [14].
Local governments in the United States have a wide range of policies available to address the challenges posed by climate change [16,17]. On the mitigation side, cities engage in policies to reduce GHG emissions. Increasing energy efficiency and energy sourcing of government-owned infrastructure clearly falls within the purview of local government. Municipal offices and facilities can be retrofitted with better insulation, LED lighting, and automatic lighting controls [18]. Cities can also incentivize or even mandate the introduction of cleaner technologies and processes for use in privately-owned buildings (e.g., home and business energy standards). Local governments reduce emissions from transportation by investing in low-carbon infrastructure such as mass transit (e.g., light rail or electric buses), cycle lanes, and electric vehicle charging stations [19]. Turning next to adaptation policies, cities, experiencing the impacts of climate change, already engage in a variety of adaptive policies [20,21], including the construction of sea walls and new storm water drainage systems [22], increasing tree cover to address increased heat, and building storm, hurricane, or forest-fire resistant infrastructure [23]. City planning efforts can protect water resources and help counter the emergence of the urban heat island effect by incentivizing building retrofitting and greenscape planning. Public cooling centers can be constructed to protect vulnerable members of the community from heat waves [24].
Despite the opportunity for city-level climate action, and an established literature on the types of policies particular cities are implementing, much less is known about how cities communicate about these policies. An array of issues compete for local policy attention, with economic growth a primary concern of most cities [25], and little is known about the extent to which particular climate policies rank on the agenda. Political science research demonstrates that leaders use public communication to credit claim and establish themselves as policy entrepreneurs [26]. Consistent with past scholarship [26,27,28,29], we argue that press releases from mayors’ offices represent a key mechanism for agenda setting and credit claiming. Agenda setting includes the actions of raising policies as worthy of local attention, political action, and resources [30]. Political actors, particularly in local office, are strategic about their choices in agenda setting, but do so in the context of what the pressing issues are in their city [31]. Political leaders engage in work to claim credit for specific actions in order to cultivate support from constituents [32].
In this paper, we examine which cities are prioritizing what types of climate change action. After measuring the urban climate policy agenda landscape—based on a computer-assisted content analysis of city government press releases—we (1) describe the extent to which climate policies appear in the official communication of 82 major American cities and (2) examine the influence of key climatic, political, economic and demographic covariates on the likelihood of discussing four key policy areas (emissions, energy, land use, and climate resiliency). Our research moves beyond previous scholarship [29] by employing a computational model suitable for measuring specific policy areas related to climate adaptation and mitigation, and testing expectations regarding the extent to which mayors will prioritize these policy areas. We anticipate that mayors will use press releases to credit claim and set the agenda on climate policy in a strategic manner that reflects three components:
- The degree to which specific climate policies are under the purview of urban governance. We anticipate that cities will discuss “traditional” policies such as land use more frequently than more novel policy areas such as climate resiliency.
- The interest of mayors to claim credit for “incubated” policy innovation (rather than reacting to problems presented) [33] means that mayors may be more likely to talk about climate mitigation than adaptation.
- The political and environmental profile of each specific city will shape climate discussions. Specifically, we anticipate that:
- (a)
- Given the high level of political polarization around the term “emissions” in the United States [34], we expect that mayors in more liberal areas will issue more emissions-related press releases, while climate risk will be less influential.
- (b)
- At the same time, however, cities that face clear risks from climate may be forced to discuss adaptation and prioritize climate resiliency. Thus, we expect that highly vulnerable cities will engage in more agenda setting on resilience, as compared to less vulnerable cities.
In what follows, we examine these expectations by relying on computational methods to analyze a large corpus of U.S. city government press releases. In doing so, we detail how we identify press releases specifically relating to adaptation and mitigation, the types of policies discussed in these documents, and how we connect each city to climate vulnerability and the partisanship of the mayor and population.
2. Data and Methods
2.1. Press Release Corpus
We utilize the corpus of city press releases introduced in Boussalis et al. [29]. These data include all press releases for the 50 largest American cities, while also including the releases of a matched set—based on population and share of white residents—of 32 “control” cities chosen to ensure sufficient variation in climate change vulnerability. These 82 cities represent a significant proportion of the overall US city greenhouse gas footprint, contributing roughly 17% of city-level emissions [35]. Overall, the corpus includes over 76,000 unique releases during the period from 2010 to 2016.
The vast majority of city press releases, however, do not related to climate change and thus a necessary first step is to identify relevant articles. (p. 177, [29]) introduce an approach that combines an efficient sampling procedure for identifying press releases that could be related to the issue of climate change with a supervised learning approach to classify the releases that are highly likely to be about the issue of climate. We replicated this procedure, training a slightly optimized version of the linear support vector machine (SVM) reported in Boussalis et al. [29] (see https://github.com/traviscoan/city_climate_resiliency for replication code and data). Our model’s out-of-sample prediction was accurate, with an F1 score of 0.81 (precision = 0.85 and recall = 0.78) based on 10-fold cross-validation. In the end, this procedure resulted in 2886 articles related to the issue to climate change—though, these articles need not mention climate change or global warming explicitly.
2.2. A Semi-Supervised Approach to Extracting Mitigation and Adaptation Discussion
With the sample of climate-related press releases in hand, the next challenge is to assess the extent to which a given release discusses adaptation and/or mitigation efforts. Manual content analysis in this instance carries significant costs in terms of time and resources, as the sample of climate-related press releases remains large. We thus turn to computer-assisted methods, relying on the semi-supervised topic model developed in Jagarlamudi et al. [36] and implemented by Singh [37] (see Appendix A for a more formal description of the model). Building on the well-known unsupervised latent Dirichlet allocation model (LDA) originally proposed in Blei et al. [38], the “seeded” LDA (or SeededLDA) offers a generative, statistical model for extracting the key topics or themes running through a large corpus of data [36]. In contrast to the unsupervised LDA, however, the SeededLDA allows researchers to seed topics with words known—with varying levels of certainty—to represent a salient underlying theme. In this sense, the first step when employing a SeededLDA is similar to a common lexicon-based approach: Manually deriving lists of keywords that represent key concepts. Yet, unlike lexicon-based methods, the SeededLDA also employs a statistical model to learn additional keywords associated with a topic or theme. That is, with only a small amount of supervision, researchers are able to “guide” the model to find themes that are particularly relevant to the research question of interest.
We employ the SeededLDA to isolate discussion of adaptation and mitigation in our corpus of press releases. After consulting publications which specifically address urban adaptation and mitigation efforts (e.g., Reckien et al. [17,18]), we focus on eight topics which are central to city climate action: (1) Climate resiliency, (2) emissions, (3) transportation, (4) renewable energy, (5) energy efficiency, (6) waste management, (7) water, and (8) land use (see Appendix B Table A1 for a full list of seed words used for each topic). It is important to note, however, that this is not an exhaustive list of all adaptation and mitigation strategies available to cities, but rather major categories emphasized in the literature on urban climate policy.
Estimating the SeededLDA
Estimation proceeds in the following three steps. First, prior to estimation, we carry out a set of standard preprocessing procedures—i.e., removing stopwords (i.e., words such as “the” which appear frequently, but add little in terms of overall meaning), punctuation, and converting all words to lowercase. We also extracted key bigram phrases (e.g., “climate change”) using the method described in Mikolov et al. [39]. Second, it is necessary to select the overall topic number prior to estimation. In addition to our eight “seeded” topics, we estimate an additional 11 “unseeded” topics for a total of 19 topics. While the number of seeded topics is fixed a priori, we follow the literature on topic selection for the LDA to decide the number of unseeded topics, using the semantic coherence and exclusivity of topics as a guide to the overall number of topics [40]. Lastly, we estimate the model using a modified version of the “collapsed” Gibbs sampler described in Griffiths and Steyvers [41], running the algorithm for 500 iterations (see https://github.com/traviscoan/city_climate_resiliency for replication code and data). Mixture models such as the LDA are known to produce multimodal likelihood surfaces and thus we examined the stability of our estimates using different random starting values, varying the initial seed words, and adjusting the number of unseeded topics in the model. The results provided below are stable to alternative assumptions.
Table 1 reports the estimates from the SeededLDA. The table provides the descriptive topic labels and the top 10 most probable keywords under each topic. As shown in Table 1, the estimates offer semantically coherent topics on a range of city-level climate actions, from discussion of climate change resiliency to discourse on greenhouse gas emissions reductions and energy efficiency. The unseeded topics are also relatively coherent and offer insight into issue linkages within the city policy context. That is, these results suggest that climate-related discussion tends to co-occur with mentions of new jobs and technological development (Topic 3), affordable housing (Topic 6), and has implications for city-level planning and development (Topic 9). We should note that some of these topics are not of equal importance. That is, a subset of the unseeded topics represent the so-called “junk topics” (e.g., Topics 1, 2, and 10) that are a common feature in unsupervised topic models [42].
2.3. Correlates of Climate Communication in Cities
Having estimated a number of theoretically important climate policy themes, we seek to explain observed variation of city-level communication. We focus on four key dependent variables in the analysis below: The presence or absence of discussion devoted to climate resiliency, emissions, energy (combining both Renewable energy and Energy efficiency), and land use in each monthly observation of a given city. As described in Section 1, our primary focus is to estimate the influence of climate risk and partisanship—i.e., mayoral party affiliation and liberalness of voters—on the climate policy discussion of city governments. We measure city climate risk using the ND-GAIN Urban Adaptation Assessment indicator of overall climate risk [43]. This measure accounts for risks associated with heat, cold, flooding, drought, and sea level rise. Consistent with scholarship from political science [44], we proxy voter partisanship with the the county-level vote share in presidential elections. More specifically, we follow Boussalis et al. [29] and rely on the proportion of votes for President Barack Obama in the 2008 Presidential election as a measure of the Democratic leaning in a city. Lastly, we use data from Boussalis et al. [29] to measure the party identification of mayors.
In addition to these main explanatory variables, we control for a set of covariates used in past scholarship. Table 2 lists the covariates, including source information and key descriptive statistics (for a more in-depth discussion of these covariates, see Boussalis et al. [29]). As demonstrated in Table 2, these factors cover a range of climatic (city climate risk [43] and temperature anomalies [45]), demographic (population), and economic (median income and unemployment) measures included in past scholarship. Note that the number of observations used in the statistical analysis is constrained by the number of months for which a given city issues a press release about any issue (including climate change). Thus, our press release dataset is structurally imbalanced.
2.3.1. Statistical Model
The press release data are inherently multi-level—i.e., observations are nested within cities and cross-classified with months—and thus the dependence among observations must be accounted for during estimation. As such, we examine the likelihood of discussing each of our main policy areas (emissions, resiliency, energy, and land use) as a function of key covariates (see Table 2) by estimating a set of Bayesian multi-level logistic regression models. We start with the standard logistic regression setup, using a Bernoulli likelihood and inverse logit link function:
where is a matrix of data level predictors, is a vector of regression coefficients, indexes the city associated with observation i, indexes the time period, represents a random intercept for cities, and represents random intercept for the time period. The random effects for each time period are defined as follows:
where represents the population intercept for the time period effects and is the standard deviation for the time effects. Next, the random intercepts for the cities is defined as follows:
where U is a matrix of city-level predictors and is a vector of regression coefficients.
Lastly, we need to specify priors for all coefficients and dispersion parameters. After standardizing all non-binary covariates, we follow recent work on prior selection in multi-level models (see Gelman et al. [48]) and employ regularizing priors. We use N (0, 1) priors for regression coefficients and intercepts and (0, 2.5) priors for all dispersion parameters. Note that the reported results are stable to alternative assumptions regarding prior specification. All of our models are estimated via MCMC using the No-U-Turn Sampler (NUTS) implemented in Stan using brms [49] (see https://github.com/traviscoan/city_climate_resiliency for replication code and data).
3. Results
3.1. How Are Cities Discussing Adaptation and Mitigation Efforts?
As shown in Table 1, the SeededLDA model identifies eight important mitigation and adaptation themes that run through the corpus of city climate-related press releases: Resiliency, renewable energy, energy efficiency, emissions, transportation, land use, water, and waste management. While the analysis thus far has provided us with a general understanding of these themes, we next ask how the cities in our sample discuss these topics. By providing a qualitative summary of each identified theme, we are able to not only uncover nuanced discourses, but also examine the validity of the topic model results [50].
3.1.1. Climate Change Resiliency and Adaptation
Within the theme of climate change resiliency and adaptation, press releases typically center on adaptation plans for natural hazards that are associated with climate change impacts, such as extreme weather and sea-level rise. For example, former San Francisco mayor Ed Lee issued a May 2016 press release announcing an $8 million investment in seawall fortifications along the city’s waterfront. Similarly, in “OneNYC: Mayor de Blasio Announces Progress on New Coastal Resiliency Efforts in Most Vulnerable Communities” the office of New York mayor discusses a $100 million initiative to raise shorelines throughout the city to protect communities from recurring hurricanes and sea level rise. Cities also discuss climate change impacts directly in their communications. For example, in a press release from Kansas City on a “Pledge to Create More Resilient Cities,” the mayor discusses how “an unprecedented increase in heat waves, droughts, floods, severe storms, and wildfires have devastated communities nationwide over the past two years.” Another press release discusses a climate change summit “on the two-year anniversary of Hurricane Sandy.” A large portion of press releases discussing extreme weather events do so within the context of federal action, including the Clean Power Plan and COP21 in Paris.
The results of the analysis also show how non-governmental actors can have an impact on how cities set the agenda on climate change. Specifically, a large number of press releases related to climate change adaptation discuss various facets of the 100 Resilient Cities Network. This initiative, which is funded by the Rockefeller Foundation, provides direct support for the establishment of a Chief Resilience Officer (CRO) as well as access to a network of other Resilient cities, NGOs and private sector actors in order to help develop and implement comprehensive resilience plans. Mayors are keen to discuss their successful incorporation into the 100 Resilient Cities program and take the opportunity to mention the goal of introducing policies that can help local communities withstand the myriad of threats that climate change and other stressors, both natural and anthropogenic, pose on cities. For instance, in announcing the hiring of their CRO, Chicago mayor Rahm Emanuel mentioned that the position will “help build upon existing efforts within the City to fortify our communities against environmental threats and other challenges.”
3.1.2. Emissions and Transportation
Reducing emissions and promoting clean transportation also figure prominently in city discussion. Local governments focus on specific policy outcomes such as purchasing “Fleets of Pure battery vehicles” (Los Angeles), an “Electric vehicle fleet” (Atlanta), promoting an “AtlWheels Festival” (Boston), or the installation of electric car chargers (Baltimore). A press release from Boston reports on a new “Partnership on Next Generation Hybrid Cars” noting that “this new technology will dramatically cut tailpipe emissions locally.” Mayors also discuss plans to lower emissions by mandating the use of cleaner technologies. For example, a June 2015 press release by Mayor Marty Walsh of Boston discusses the signing of an ordinance which, among other things, requires the retrofitting of older government-owned or leased vehicles with emissions-reduction technologies. Further, mayors use their communications to express agreement with and commitment to federal environmental regulations aimed at mitigating climate change. The mayors of Houston and Los Angeles, for example, issued a joint statement in support of the Clean Power Plan in August 2015. Indeed, mayors have used their press offices to urge action on the part of the national government, as was the case of Mayor Harris of Honolulu in October 2003, who joined 154 other US mayors in calling on the federal government to take action to reduce emissions. Moreover, mayors have discussed their involvement with climate change mitigation policy at the international level as was the case with Los Angeles mayor Eric Garcetti’s September 2015 meeting with Chinese officials and former Portland mayor Hales’ visit to the Vatican in July 2015 to discuss climate change solutions. Further, mayors have issued press releases that highlight independent city-level carbon emissions reduction goals, such as Pittsburgh mayor Luke Ravenstahl’s six year pledge in February 2007 to reduce CO pollution by 7% below 1990 levels.
3.1.3. Renewables and Energy Efficiency
Within the theme of energy, press releases discuss both renewable energy solutions and increasing energy efficiency. Releases such as Boston’s “Winners of the 5th Annual Mayor’s Green Awards”, Pittsburgh’s Mayor announcing a Pennsylvania company winning the EPA green power leadership award, and Washington, D.C.’s “Mayor Bowser Highlights Commitment to Renewable Energy, Public Health and Green Jobs” are all indicative of energy-related discussions. The Washington, D.C. press release, for example, discussed a “groundbreaking wind power purchase agreement” and a quote from Mayor Bowser that “The District of Columbia will continue to lead the nation in the fight against climate change.” Mayors also use their communications to frame climate action in terms of strategic and economic benefits, while also placing pressure on federal government officials to act. For instance, in his August 2006 release “Cities Innovate While Washington Fails to Act”, the mayor of Madison framed the city’s introduction of clean energy solutions as a policy that can “help end our nation’s oil addiction and create good jobs.”
3.1.4. Waste and Water Management
City governments also communicate efforts to transform waste and water management practices in order to assist in climate mitigation and adaptation efforts. The mayor of Pittsburgh, for instance, issued a March 2010 press release that describes a number of policies aimed at adjusting procurement practices that will prioritize products that, “contain the maximum level of post-consumer recycled content” and are “both durable and reusable.” Other examples of announcements of recycling and reuse programs and outreach campaigns include: “Mayor Menino Announces Launch of Residential Compost Pilot” (Boston), “Mayor Daley Kicks-Off Neighborhood Drive And Announces Pilot Recycling Partnership With Computers For Schools” (Chicago), “Mayor Announces Automated Curbside Pickup of Green Waste” (Honolulu), and “Cans for Cash recycling challenge needs your help” (Lexington). Innovative waste management processes are also announced, such as plans in San Diego to implement new waste compaction methods that would increase landfill efficiency by 45 percent. Further, a number of press releases discuss the highly-sought Leadership in Energy and Environmental Design (LEED) certification of government-owned and operated buildings in the context of waste reduction and water conservation.
Issues surrounding water management are also present in the corpus of city press releases. Water conservation and increased efficiency of usage is a common theme within this topic. For instance, a May 2012 press release by the city of Arlington reminds citizens of an ordinance prohibiting landscape watering during the daytime and also announces an exchange program for high-efficiency showerheads. Mayors also do not shy from linking water shortages to climate change impacts. As an example, in November 2015 the mayor of Los Angeles congratulated the community for fruitful water conservation efforts and mentioned how, "regardless of how much rain El Niño brings, due to our warming climate we will still be lacking snowpack, we will still be in a drought, and we will still need to conserve our most precious resource". Likewise, the city of Phoenix informed citizens of its plans to establish the Colorado River Resiliency Fund in October 2014 which aims to protect future water supplies from climate impacts.
3.1.5. Land Use
Given that land use is one of the central areas of policymaking that city governments control, the large number of press releases discuss various themes related to land use in the context of the environment are unsurprising. For example, many of the press releases in our corpus announce afforestation efforts: “Mayor Announces 100,000 Trees Will be Planted in City by 2020” (Boston), “City to Plant 3800 Trees in Neighborhoods Across Chicago in 2013” (Chicago), and “City to Plant 100 Trees for ‘Community Carbon Bank”’ (Greensboro). Further, cities embark on outreach efforts to incentive the creation of gardens and “green roofs.” For example, in a February 2017 press release the mayor of Milwaukee announced the expansion of the urban canopy with greenscaping efforts throughout the city. In “Pittsburgh named finalist for national sustainability award” the press release discusses various greening initiatives including the redevelopment of brownfields. Lastly, we also find mentions of albedo-increasing building modifications, such as the promotion of light colored roofing in Louisville in April 2016.
3.2. To What Extent Are Cities Discussing Climate Adaptation and Mitigation Efforts?
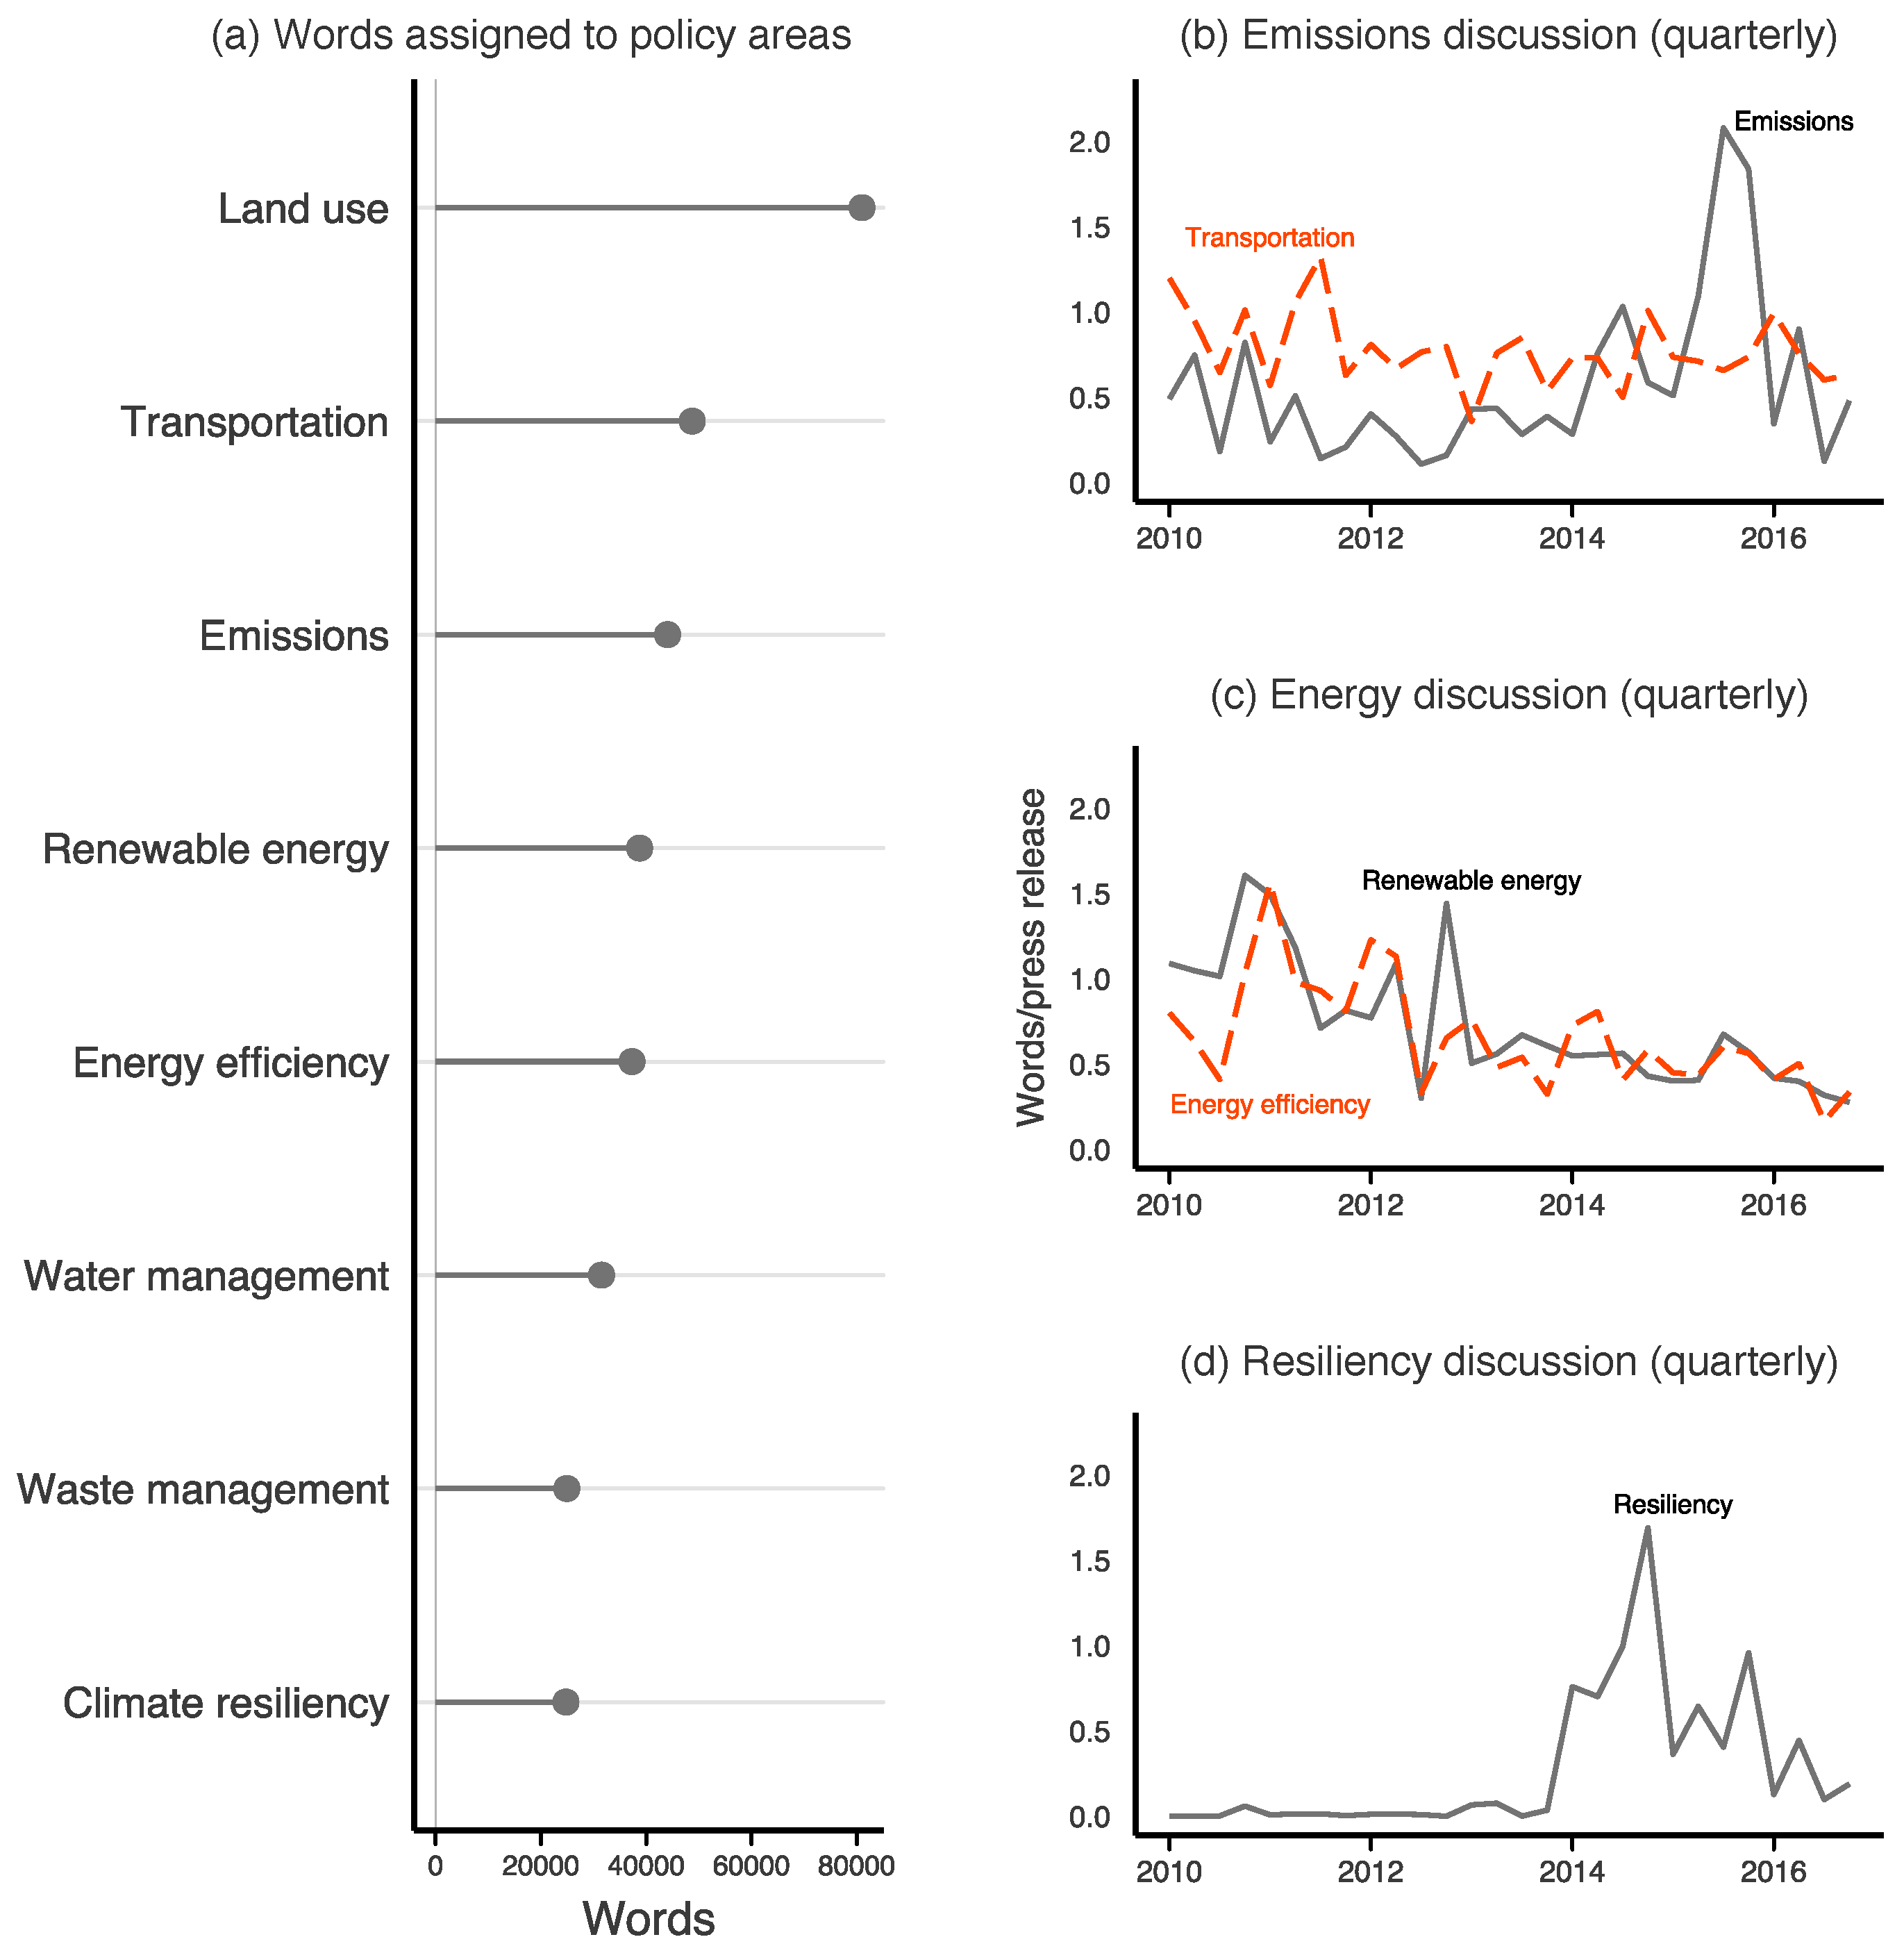
While the previous section describes how cities discuss urban climate action, we now turn to an empirical examination of what kinds of actions cities are prioritizing in official communication. Figure 2 displays the extent to which major U.S. cities are discussing each of the eight key topic areas described in Section 1, as well as the dynamics of salient themes over the sample period. First, considering Figure 2a, land use ranks the highest amongst the identified policy themes in terms of number of words assigned to the topic by the model. This finding is perhaps not surprising, given that city governments have a great deal of authority in increasing urban density through zoning and planning and developing green spaces within their jurisdictions. However, mitigating the harmful impacts of transportation and reducing GHG emissions is not far behind in terms of salience. The combined discussion of these two themes are the most common climate actions. Similarly, the combined discussion of energy-related policies—both renewable energy and efficiency—represents a significant proportion of the conversation. Lastly, the salience of predominant adaptation related discussions (e.g., water management and climate resiliency) are the least common of the policy themes.
Reviewing the temporal dynamics of the identified themes reveals how salience of mitigation and adaptation discussions have evolved over the 2010–2016 period. Figure 2b illustrates the quarterly number of words assigned to the Emissions and Transportation topics per press release. As discussed above, emissions-related conversations are relatively frequent when compared to the other policy themes; however, Figure 2b demonstrates that the salience of emissions spikes during the late 2015 period (compared to transportation-related discussion which is relatively constant throughout the period). This surge in emphasis on emissions reduction coincides with the Paris COP21 meeting in December 2015. A review of the press releases with a large share of words assigned to the emissions topic during this period shows that mayors were directly engaged with the international climate negotiations, for example: “Mayor Bowser Applauds Historic Paris Agreement on Climate Change” (Washington, DC), “Mayor and Local Leaders Issue Statement on Adoption of Historic Paris Climate Agreement” (Seattle), and “Mayor Kasim Reed Participates in COP 21 Panel in Paris” (Atlanta). This finding implies that mayors are keen to respond to international efforts on climate change mitigation and that a city’s climate agenda might not only be sensitive to local or even national events.
Turning next to Figure 2c, we can see how energy-related discussions in the press release corpus have been decreasing steadily over time. Also, it is important to note how the discussion of energy efficiency is highly correlated with that of renewable energy over time, suggesting that prioritization of these two aspects of city policy tend to co-occur temporally. This correlation likely reflects the manner in which city governments tend to communicate sustainable energy more generally—that is, both in terms of its production via renewable energy and also its consumption through enhanced efficiency (e.g., building retrofitting). Lastly, Figure 2d displays the salience of Climate resiliency over the sample period. Whereas the overall word frequency of this theme ranks the lowest in aggregate terms (see Figure 2a), resiliency-related discussions have increased dramatically in recent years. Further, a closer look at the press releases during this time period suggests that cities were both responding to a surge in extreme weather events—particularly, hurricanes impacting the East Coast of the U.S.—and drawing attention to the 100 Resilient Cities Network.
3.2.1. Comparing Discussion of Mitigation and Adaptation
Our next step is to compare discussion of climate resiliency and mitigation-related efforts. Do cities that prioritize mitigation also prioritize adaptation? This comparison poses a significant challenge given that some themes identified by the topic model contain a mixture of both mitigation and adaptation policy discussion, albeit at varying levels. For instance, press releases with a large number of words associated with Land use focus on mitigation efforts such as implementing “green roofs” to increase energy efficiency, while other releases mention adaptation policies such as the development of “green infrastructure” aimed to deal with increased stormwater. Given these difficulties, we focus our comparison on the extent to which cities discuss Emissions and Climate resiliency—two topics that are unambiguous thematic proxies for mitigation and adaptation respectively. A scatterplot of the standardized number of words assigned to these two themes for the 82 cities in our sample is presented in Figure 3. More specifically, since the word assignment distributions for both themes exhibited heavy tails, the word totals for each theme were transformed using before being standardized as a z-score. The size of each city’s marker corresponds to its climate risk score as measured in ND-GAIN [43], while cities with a Republican mayor in our sample period are in red and those with a Democratic mayor are in blue.
Figure 3 provides a number of insights. First, overall, there is a strong and positive correlation between Emissions and Climate resiliency discussions. There are, of course, some important exceptions to this general pattern. The top right quadrant includes cities which discuss both themes above average. It is clear that the overwhelming majority of these cities are led by Democratic mayors. However, the cities in this quadrant that do have Republican mayors also exhibit high levels of vulnerability to climate change impacts—for instance Miami and Virginia Beach are particularly vulnerable to sea level rise. This gives us a tentative indication that mayoral engagement with mitigation and adaptation issues may be less sensitive to partisan effects when faced with clear and present climate-related threats. A cluster of cities can be found at the bottom portion of the plot, suggesting that there are still a significant number of city governments not engaging in resiliency or emissions discussions in their official press releases. Specifically, 27 cities have not discussed either theme, while a group of other cities have engaged with emissions-related matters but have not discussed resiliency. It is worth noting that although Republican-led cities are the clear minority of the sample, a large share of these cities are located on the lower part of the plot. Appendix D in the appendix provides the mayoral political affiliation for the cities in our sample.
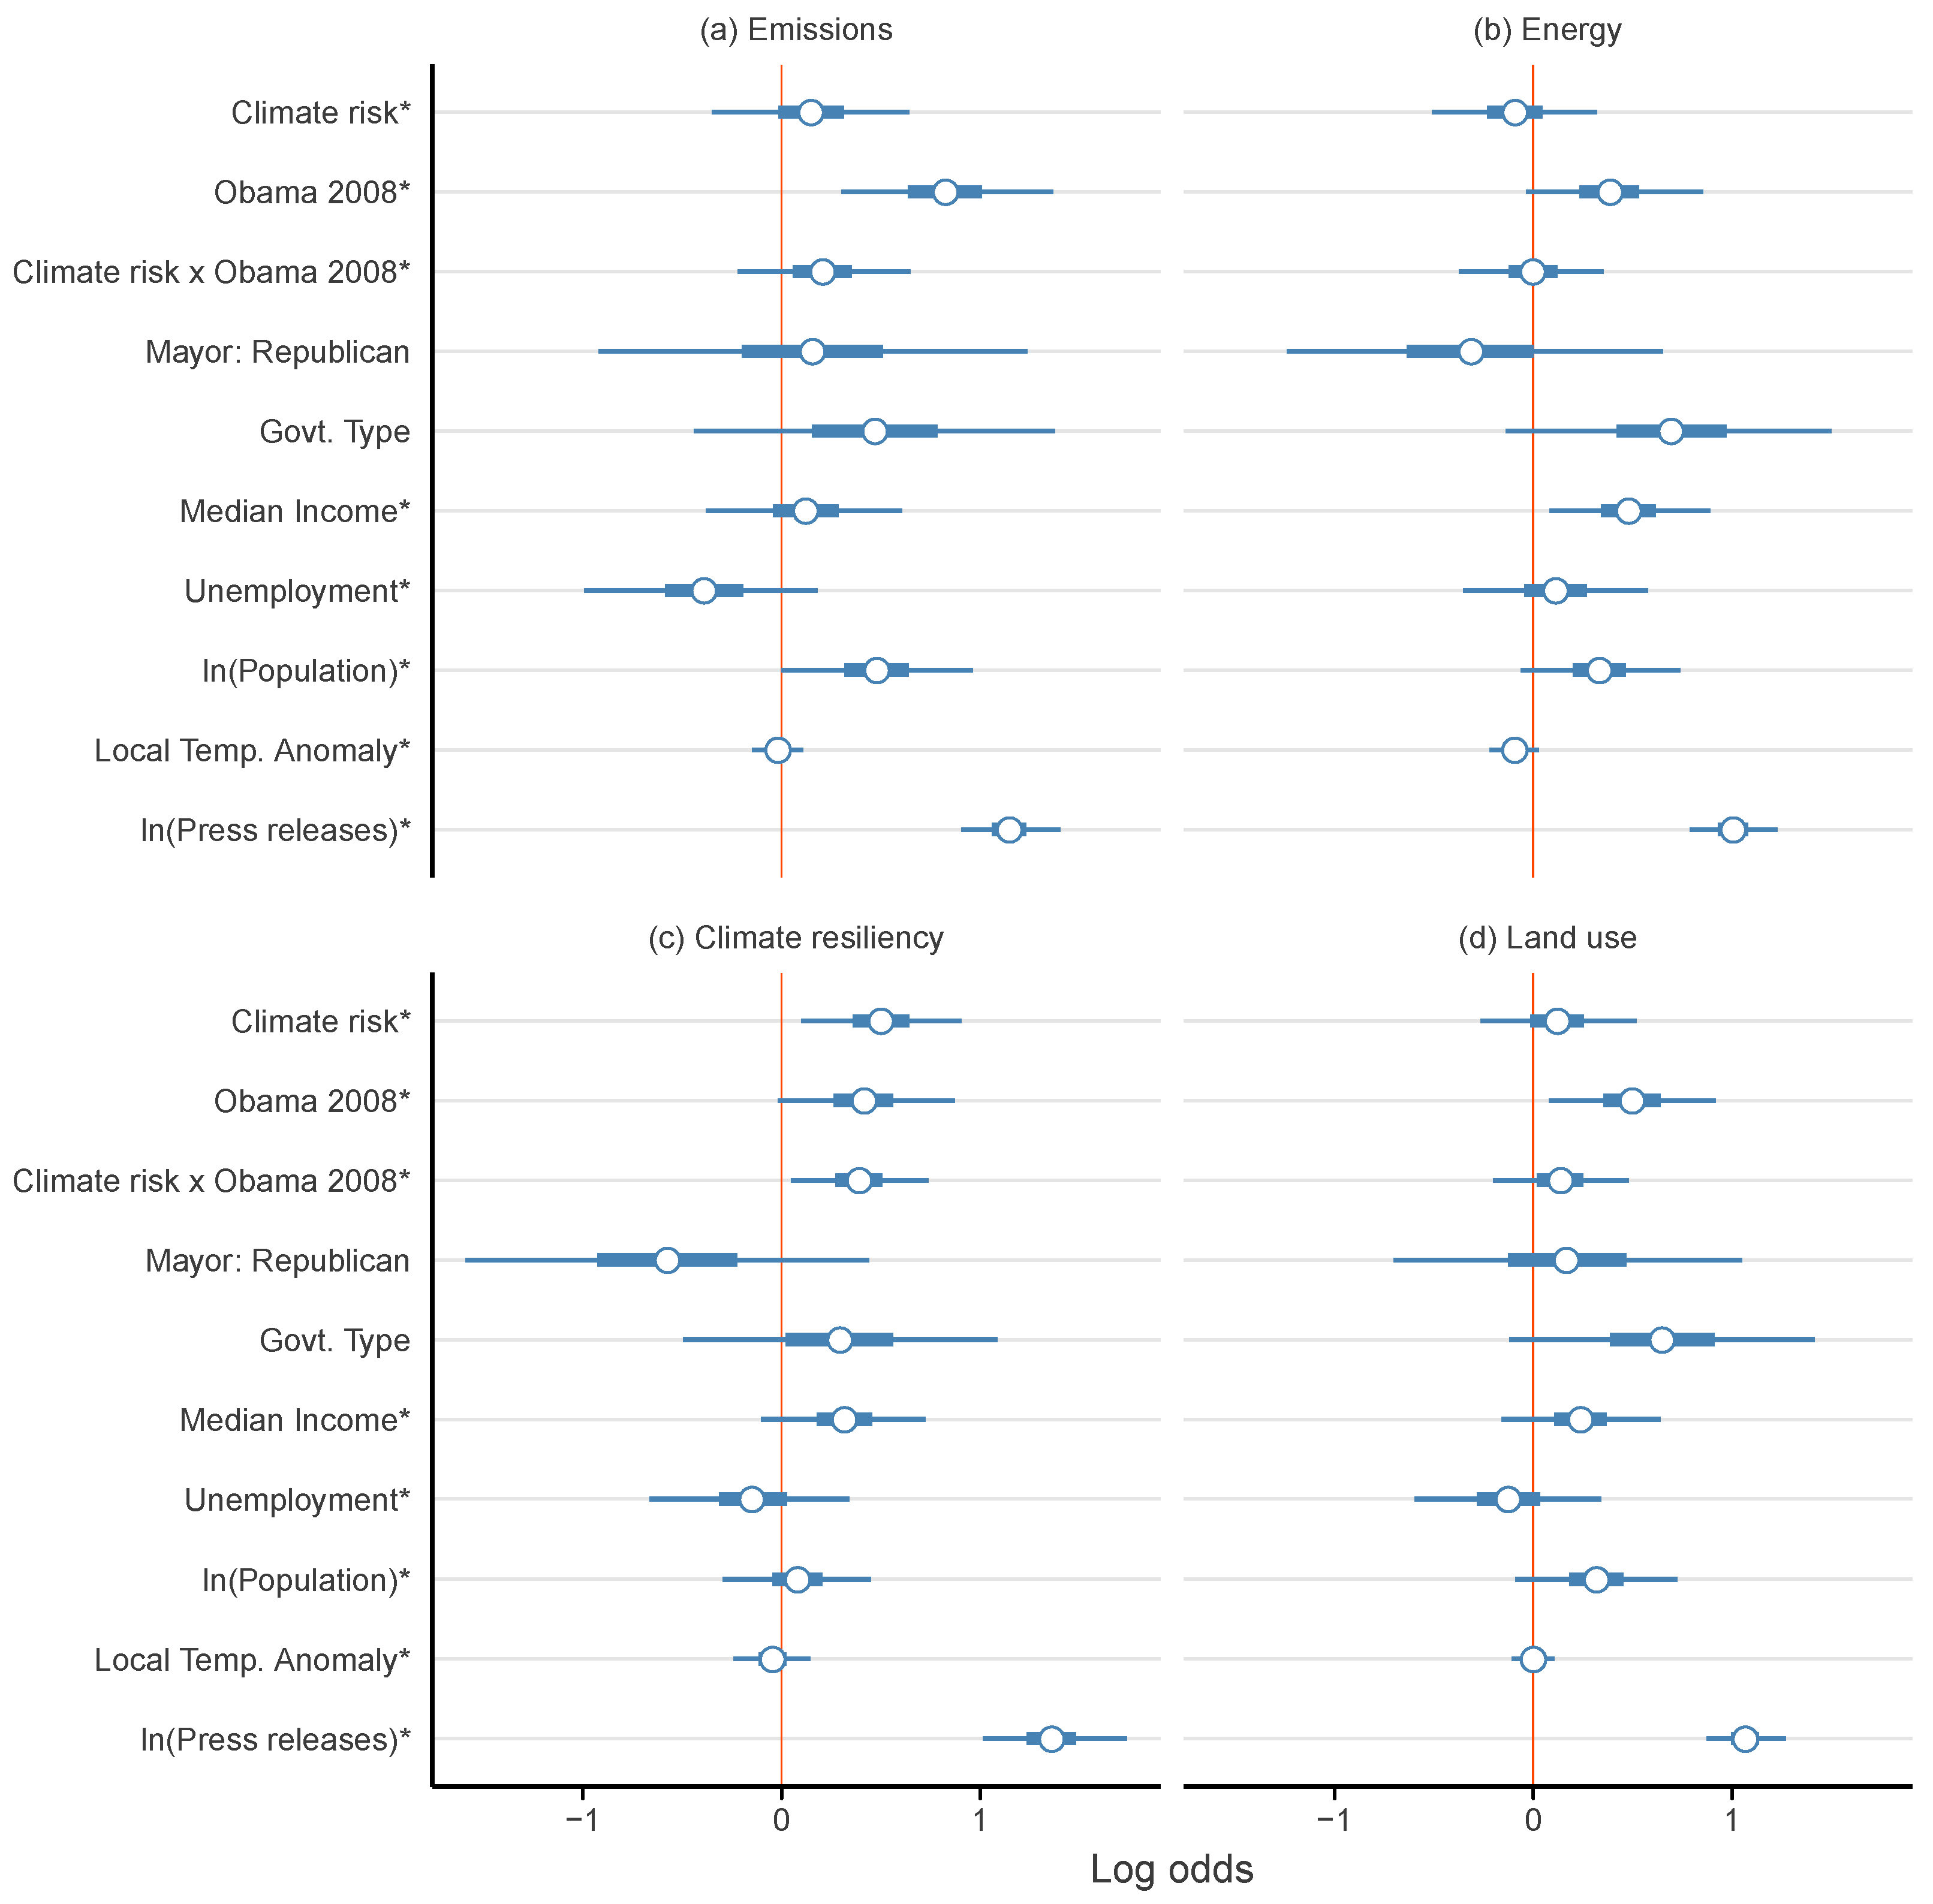
3.2.2. Statistical Results
Figure 4 present estimates of the models discussed in Section 2.3.1 (see Appendix C for full results). Specifically, the plots display logistic regression coefficients (log odds) for each key covariate of interest. Turning first to Figure 4a, we find that discussion of emissions is largely driven by the partisanship of the city, where more democratic cities (as measured by the share of the vote for Barack Obama in 2008) are more likely to discuss efforts to reduce climate emissions. Specifically, when climate risk is held constant at its mean, a one standard deviation increase in Obama 2008 leads to a increase in the probability of discussing emissions. Figure 4a also suggests that the effect of Climate risk and the interaction of Climate risk and Obama 2008 is in the expected positive direction; however, there is considerable uncertainty associated with both estimates. Lastly, the log of Population is also positively related to emissions discussion, with a one standard deviation increase in log Population leading to a increase in the predicted probability of discussing emissions.
Turning next to Climate resiliency, we find support for the influence of partisanship, climate risk, and their interaction. When Obama 2008 is held constant at its mean value, a one standard deviation increase in Climate risk leads to a increase in the probability of discussing resiliency in a given city-month. Similarly, when risk is held constant at its mean, a one standard deviation increase in Obama 2008 leads to a roughly increase in the probability of mentioning resiliency. The estimated effect of partisanship, however, is considerably larger when Climate risk is one standard deviation above its mean (first difference in predicted probability = ). While these effects may appear small, the likelihood of mentioning resiliency in a given city-month is a rare event; a first difference of represents a roughly four-fold increase over the baseline (mean) predicted probability.
Figure 4b,d show the results for Energy and Land use. In general, we find a similar effect for liberalness of a city on climate-related discussion. A one standard deviation increase in Obama 2008 is associated with a and increase in the probability of a city discussing energy and land use issues, respectively, in a given month, while holding climate risk at its mean value.
4. Discussion
Local governments in the United States have an opportunity to engage in climate action, even as the federal government’s gridlock prevents national action. In this article, we evaluate the content of climate-related agenda setting in U.S. cities, with a focus on examining the extent to which cities discuss common topics that deal with climate change. As expected, we find that cities tend to discuss mitigation-based policies—particularly those associated with transportation, emissions, and energy—more frequently than adaptation-based policies. However, as demonstrated in Figure 2d, the dynamics of this relationship seem to be shifting, as we find an abrupt increase in the salience of adaptation-related discussion over the sample period.
We then examine the correlates of city-level prioritization of four key climate-related policy areas in official communications. By and large, our results suggest that the partisanship of voters increases a city’s likelihood of engaging with emissions, climate resiliency, energy, and land use. Across the board, more liberal cities have a higher tendency to discuss climate actions and in several instances the effects are sizable (e.g., emissions). This result is generally consistent with previous work which finds a positive relationship between liberalness and general discussion of climate change policy [29]. However, the current study extends previous work in the following ways:
- We demonstrate that partisanship effects hold across a range of climate policy domains. Partisanship is particularly important in explaining variation in discussion of very politically polarizing policy areas such as GHG emissions reduction, while less so in other areas.
- Our results clarify the relationship between climate risk and discussion of policies. Whereas Boussalis et al. [29] find a link between vulnerability and mentions of climate change in general, we demonstrate that this relationship is largely restricted to discussions about climate change resiliency rather than other areas such as emissions, energy and land use.
- Moreover, we find that this relationship between partisanship and city discussion of resiliency is conditioned on the level of projected climate risk: Liberal cities with higher than average projected climate risk are substantially more likely to discuss climate resiliency in a given month. These results also suggest that climate risk only has a direct, positive effect on the likelihood of city discussion of resiliency.
Our research approach provides one way of looking at how cities are engaged in climate change policymaking and agenda setting. Future research might examine the degree to which cities actually “walk the talk”—that is, do mayors who discuss climate change policies actually put mitigation or adaptation policies in place? This question is particularly important given the budgetary constraints that cities face and the low level of information that most citizens have about the functioning of their government [51,52]. In essence, citizens are rarely equipped to hold their governments accountable and cities rarely have the resources to engage in proactive policymaking. In these circumstances, future research might ask which cities actually follow through with their agenda setting on climate mitigation and adaptation.
Overall, our study demonstrates the extent to which cities are engaging in climate-related agenda setting, focusing on policies where mayors are able to claim credit and that are under the purview of local governments in the United States. Urban politics are not immune to the national trends of politicized climate discussions [53]. Our results suggest that voter partisanship has an across-the-board positive association with city government discussion on a wide range of climate policy areas, including themes dedicated to both adaptation and mitigation policies. Increased liberalness of a community leads to more communication of climate policy by local government, even while controlling for climate risk and other economic and demographic factors. While it is clear that the issue of climate change is hyper-politicized in national-level U.S. politics [10,54], partisan effects seem to exist at the local level as well. Although city governments are on the “front lines” of climate change impacts, our results show that the positive relationship between climate risk and the likelihood of adaptation communication is conditional on the liberalness of voters in a given locale. Thus, based on data over the 2010–2016 period, the overarching implication of our analysis is that climate risk alone is insufficient to drive the prioritization of climate policy—partisanship remains a significant factor in climate policy agenda setting at the local level.
Author Contributions
Conceptualization, C.B., T.G.C. and M.R.H.; Data curation, C.B., T.G.C. and M.R.H.; Formal analysis, C.B., T.G.C. and M.R.H.; Investigation, C.B., T.G.C. and M.R.H.; Methodology, C.B., T.G.C. and M.R.H.; Validation, C.B., T.G.C. and M.R.H.; Visualization, C.B., T.G.C. and M.R.H.; Writing—original draft, C.B., T.G.C. and M.R.H.
Funding
Travis G. Coan’s contribution was supported by an Economic and Social Research Council [ES/N012283/1] Methodological Innovation grant.
Conflicts of Interest
The authors declare no conflict of interest.
Appendix A. Details of the SeededLDA
The semi-supervised topic model developed in Jagarlamudi et al. [36] and implemented by Singh [37] builds directly on the unsupervised latent Dirichlet allocation model (LDA) originally proposed in Blei et al. [38]. The LDA—and by extension the SeededLDA—offers a generative, statistical model for extracting the key topics or themes running through a large corpus of data. As described in (p. 92, Boussalis and Coan [11]), the LDA assumes a simple hierarchical Bayesian model in which documents are generated by the following probabilistic process:
- Each of the k topics are drawn from a topic distribution by
- The term distribution for each topic is represented by
- For each i word in each d document, :
- Randomly sample a topic .
- Choose a word from .
With the generative model in hand, the next step is to find a suitable sampler to approximate the posterior. While a range of methods have been proposed in the literature, SeededLDA modifies the well-known “collapsed” Gibbs sampler introduced in Griffiths and Steyvers [41]:
where,
- : the latent topic assignment for word i in document d
- : word i in document d
- : all words other than
- : prior distribution over words
- : all latent assignments other than
- : prior distribution over documents
- : the total number of times word w has been assigned to topic k, but not including the current word under consideration.
- : the total number of times topic k is assigned in document d, but not including the current word under consideration.
The collapsed Gibbs sampler “integrates out” the main parameters of interest ( and ) and instead infers the latent indicator z. The SeededLDA modifies (A1) by simply placing a constraint—which may be hard or soft—that forces a particular word (e.g., the word “adaptation” to a particular topic (e.g., the 8th estimated topic) with a probability or what Singh [37] refers to as the “seed confidence”. In our models, we assume a hard constraint and thus set .
Appendix B. Full List of Seed Words

Table A1.
List of seeded keywords for each topic.
| Topic Label | Seed Words |
|---|---|
| Climate resiliency | resilience, urban_resilience, resilience_climate, resiliency, coastal_resiliency, |
| adaptation, climate_adaptation, flood_protection, flood_control, flood_protection, | |
| drought_response, drought_tolerant, green_roof, green_roofs | |
| Transportation | electric_vehicle, electric_vehicles, electric_car, electric_cars, electric_buses, |
| hybrid_buses, hybrid_vehicles, hybrid_vehicle, rail, rail_transit, | |
| light_rail, vehicle_emissions, gas_emissions, diesel_emissions, cycling, | |
| bicycling, bike, bikes, bike_share, bikeshare, | |
| bike_lanes, bike_walk, walking_bicycling, transportation, public_transportation | |
| Renewable energy | renewable_energy, clean_energy, solar_energy, alternative_energy, wind_energy, |
| wind_power, renewable, renewables, clean_renewable, renewable_sources, | |
| solar, solar_panels, solar_power, solar_installations, rooftop_solar, | |
| install_solar, installing_solar, solar_wind, wind_solar | |
| Energy efficiency | energy_efficiency, energy_efficient, reduce_energy, energy_conservation, reducing_energy, |
| conserve_energy, reduced_energy, saving_energy, conserving_energy, smart_grid, | |
| green_building, green_buildings, efficient_buildings, inefficient_heating, retrofit, | |
| retrofits, retrofitting, retrofitted, energy_retrofits, efficient_appliances, | |
| green_infrastructure, led_lighting, led_lights, led_light, led_bulbs | |
| Waste management | landfill, landfills, landfill_gas, waste_management, waste_reduction, |
| zero_waste, reduce_waste, reducing_waste, food_waste, green_waste, | |
| organic_waste, compost, composting, recycle, recycling, | |
| recycled, recycling_program, recyclable, recyclables, increase_recycling, | |
| plastic, plastic_bag, plastic_bags | |
| Water | water_conservation, conserve_water, conserving_water, water_use, water_usage, |
| water_consumption, water_supply, water_treatment, storm_water, stormwater, | |
| stormwater_management, manage_stormwater, green_stormwater, rainwater, | |
| recycled_water, save_water, stormwater_runoff, wastewater, wastewater_treatment, | |
| rainwater_harvesting, water_reclamation, rain_garden, rain_gardens | |
| Land use | greening, greening_projects, green_space, green_spaces, tree_canopy, |
| shade_trees, plant_trees, tree_planting, trees_planted, planting_trees, | |
| heat_island, community_garden, community_gardens, urban_gardening, urban_farming, | |
| urban_farm, urban_farms, urban_agriculture, sustainable_food, local_food, | |
| farmers_market, farmers_markets, farmer_market, local_farmers |
Appendix C. Full Statistical Results
These tables display the results of a set of Bayesian multi-level logistic regression models that estimate the effect of climate risk, political partisanship, and other covariates on the monthly sum of words dedicated to the following climate-related themes: Emissions, Energy (Energy efficiency & Renewable energy), Climate resiliency, and Land use. The posterior means, lower, and upper bounds of 50% and 95% credible intervals are reported. Standardized variables are denoted with an asterisk (*).
Table A2.
Emissions.
| Labels | Estimate | Lower 50 | Upper 50 | Lower 95 | Upper 95 |
|---|---|---|---|---|---|
| Intercept | −2.872 | −3.158 | −2.574 | −3.733 | −2.063 |
| Climate risk * | 0.148 | −0.014 | 0.313 | −0.351 | 0.642 |
| Obama 2008 * | 0.825 | 0.637 | 1.007 | 0.301 | 1.368 |
| Climate risk × Obama 2008 * | 0.207 | 0.059 | 0.352 | −0.222 | 0.648 |
| Mayor: Republican | 0.155 | −0.200 | 0.510 | −0.920 | 1.238 |
| Govt. Type | 0.469 | 0.154 | 0.785 | -0.439 | 1.377 |
| Median Income * | 0.121 | −0.043 | 0.287 | −0.379 | 0.607 |
| Unemployment * | −0.391 | −0.585 | −0.192 | −0.992 | 0.181 |
| ln(Population) * | 0.479 | 0.317 | 0.639 | 0.001 | 0.961 |
| Local Temp. Anomaly * | −0.018 | −0.062 | 0.025 | −0.147 | 0.109 |
| ln(Press releases) * | 1.146 | 1.060 | 1.231 | 0.904 | 1.402 |
Table A3.
Energy.
| Labels | Estimate | Lower 50 | Upper 50 | Lower 95 | Upper 95 |
|---|---|---|---|---|---|
| Intercept | −2.786 | −3.028 | −2.533 | −3.533 | −2.065 |
| Climate risk * | −0.092 | −0.231 | 0.047 | −0.510 | 0.319 |
| Obama 2008 * | 0.386 | 0.232 | 0.530 | −0.037 | 0.854 |
| Climate risk × Obama 2008 * | −0.003 | −0.123 | 0.122 | −0.374 | 0.352 |
| Mayor: Republican | −0.313 | −0.636 | 0.000 | −1.240 | 0.651 |
| Govt. Type | 0.692 | 0.420 | 0.972 | −0.137 | 1.499 |
| Median Income * | 0.480 | 0.341 | 0.617 | 0.082 | 0.890 |
| Unemployment * | 0.112 | −0.046 | 0.270 | −0.353 | 0.578 |
| ln(Population) * | 0.332 | 0.200 | 0.464 | −0.063 | 0.740 |
| Local Temp. Anomaly * | −0.094 | −0.135 | −0.052 | −0.219 | 0.027 |
| ln(Press releases) * | 1.005 | 0.929 | 1.081 | 0.787 | 1.229 |
Table A4.
Climate resiliency.
| Labels | Estimate | Lower 50 | Upper 50 | Lower 95 | Upper 95 |
|---|---|---|---|---|---|
| Intercept | −4.161 | −4.407 | −3.904 | −4.944 | −3.444 |
| Climate risk * | 0.500 | 0.359 | 0.641 | 0.100 | 0.905 |
| Obama 2008 * | 0.415 | 0.262 | 0.563 | −0.018 | 0.873 |
| Climate risk x Obama 2008 * | 0.391 | 0.270 | 0.508 | 0.047 | 0.740 |
| Mayor: Republican | −0.575 | −0.926 | −0.223 | −1.591 | 0.441 |
| Govt. Type | 0.294 | 0.022 | 0.560 | −0.493 | 1.087 |
| Median Income * | 0.316 | 0.178 | 0.455 | −0.101 | 0.726 |
| Unemployment * | −0.149 | −0.315 | 0.026 | −0.665 | 0.340 |
| ln(Population) * | 0.080 | −0.044 | 0.205 | −0.295 | 0.448 |
| Local Temp. Anomaly * | −0.046 | −0.113 | 0.024 | −0.241 | 0.146 |
| ln(Press releases) * | 1.359 | 1.233 | 1.481 | 1.013 | 1.739 |
Table A5.
Land use.
| Labels | Estimate | Lower 50 | Upper 50 | Lower 95 | Upper 95 |
|---|---|---|---|---|---|
| Intercept | −2.057 | −2.299 | −1.818 | −2.757 | −1.368 |
| Climate risk * | 0.121 | −0.014 | 0.253 | −0.264 | 0.518 |
| Obama 2008 * | 0.497 | 0.352 | 0.641 | 0.080 | 0.918 |
| Climate risk × Obama 2008 * | 0.137 | 0.020 | 0.250 | −0.202 | 0.480 |
| Mayor: Republican | 0.166 | −0.128 | 0.469 | −0.703 | 1.050 |
| Govt. Type | 0.647 | 0.386 | 0.911 | −0.121 | 1.414 |
| Median Income * | 0.238 | 0.106 | 0.370 | −0.158 | 0.641 |
| Unemployment * | −0.127 | −0.282 | 0.033 | −0.597 | 0.341 |
| ln(Population) * | 0.317 | 0.182 | 0.454 | −0.090 | 0.725 |
| Local Temp. Anomaly * | 0.000 | −0.038 | 0.037 | −0.108 | 0.107 |
| ln(Press releases) * | 1.066 | 0.997 | 1.134 | 0.873 | 1.269 |
Appendix D. City-Level Political Variables
Table A6.
This table displays mayoral political affiliation and the county-level vote share for Barack Obama in the 2008 US presidential election.
Table A6.
This table displays mayoral political affiliation and the county-level vote share for Barack Obama in the 2008 US presidential election.
| City | Mayoral Political | Obama 2008 |
|---|---|---|
| Affiliation | County Vote Share | |
| Albuquerque | Dem | 59.87428 |
| Anaheim | Rep | 47.15672 |
| Anchorage | Dem | 55 |
| Arlington | Rep | 43.77575 |
| Atlanta | Dem | 67.22124 |
| Aurora | Rep | 55.69 |
| Austin | Dem | 64.1431 |
| Baltimore | Dem | 56.22684 |
| Bellevue | Dem | 70.44357 |
| Boston | Dem | 77.49261 |
| Buffalo | Dem | 53.1801 |
| Chandler | Rep | 44.04097 |
| Charleston | Rep | 53.52972 |
| Charlotte | Dem | 61.99956 |
| Chicago | Dem | 76.0988 |
| Cincinnati | Dem | 52.1006 |
| Cleveland | Dem | 68.50075 |
| Colorado Springs | Rep | 28.86306 |
| Columbus | Dem | 58.99576 |
| Corpus Christi | Rep | 47.40098 |
| DC | Dem | 92.86323 |
| Dallas | Dem | 57.49293 |
| Denver | Dem | 75.30575 |
| Detroit | Dem | 74.17706 |
| Durham | Dem | 75.77658 |
| El Paso | Dem | 28.51637 |
| Fort Lauderdale | Dem | 67.18507 |
| Fort Worth | Rep | 43.77575 |
| Fresno | Rep | 49.23617 |
| Greensboro | Ind | 58.91477 |
| Henderson | Dem | 32.94983 |
| Honolulu | Dem | 69.8 |
| Houston | Dem | 50.50201 |
| Indianapolis | Rep | 63.84264 |
| Kansas City | Dem | 62.11355 |
| Las Vegas | Rep | 32.94983 |
| Lexington | Dem | 51.74049 |
| Lincoln | Dem | 51.5293 |
| Long Beach | Dem | 68.77505 |
| Los Angeles | Dem | 68.77505 |
| Louisville | Dem | 55.50475 |
| Madison | Dem | 72.95841 |
| Miami | Rep | 58.08415 |
| Milwaukee | Ind | 67.53441 |
| Minneapolis | Dem | 63.61659 |
| Miramar | Ind | 67.18507 |
| Naperville | Ind | 54.68229 |
| Nashville | Dem | 59.8885 |
| New Orleans | Dem | 79.32489 |
| New York | Dem | 85.7 |
| Newark | Dem | 75.53838 |
| Norfolk | Dem | 71.14592 |
| Oakland | Dem | 78.58155 |
| Oklahoma City | Rep | 41.59015 |
| Orlando | Dem | 58.99895 |
| Philadelphia | Dem | 83.06292 |
| Phoenix | Dem | 44.04097 |
| Pittsburgh | Dem | 57.1997 |
| Plano | Rep | 36.74483 |
| Portland, OR | Dem | 77.21143 |
| Providence | Dem | 66.85299 |
| Raleigh | Rep | 57.1133 |
| Riverside | Rep | 50.76531 |
| Sacramento | Dem | 58.43311 |
| San Antonio | Dem | 52.42997 |
| San Diego | Rep | 53.86855 |
| San Francisco | Dem | 84.35345 |
| San Jose | Dem | 69.60246 |
| Santa Ana | Dem | 47.15672 |
| Santa Clarita | Dem | 68.77505 |
| Savannah | Rep | 56.97231 |
| Seattle | Dem | 70.44357 |
| St Louis | Dem | 83.67237 |
| St Paul | Dem | 66.17217 |
| Stockton | Rep | 54.06414 |
| Syracuse | Dem | 58.54225 |
| Tampa | Dem | 53.1 |
| Toledo | Dem | 64.54888 |
| Tucson | Dem | 52.54557 |
| Tulsa | Rep | 37.77336 |
| Virginia Beach | Rep | 49.21687 |
| Wichita | Rep | 42.40284 |
References
- Masson-Delmotte, V.; Zhai, P.; Pörtner, H.; Roberts, D.; Skea, J.; Shukla, P.; Waterfield, T. Global Warming of 1.5 °C; An IPCC Special Report on the Impacts of Global Warming of 1.5 °C above Pre-Industrial Levels and Related Global Greenhouse Gas Emission Pathways, in the Context of Strengthening the Global Response to the Threat of Climate Change, Sustainable Development, And Efforts to Eradicate Poverty; IPCC: Geneva, Switzerland, 2018. [Google Scholar]
- Masanet, E.R.; Poponi, D.; Bryant, T.; Burnard, K.; Cazzola, P.; Dulac, J.; Pales, A.F.; Husar, J.; Janoska, P.; Munuera, L.; et al. Energy Technology Perspectives 2016-Towards Sustainable Urban Energy Systems; International Energy Agency: Paris, France, 2016. [Google Scholar]
- Hallegatte, S.; Green, C.; Nicholls, R.J.; Corfee-Morlot, J. Future flood losses in major coastal cities. Nat. Clim. Chang. 2013, 3, 802–806. [Google Scholar] [CrossRef]
- Bambrick, H.J.; Capon, A.G.; Barnett, G.B.; Beaty, R.M.; Burton, A.J. Climate change and health in the urban environment: Adaptation opportunities in Australian cities. Asia-Pac. J. Public Health 2011, 23, 67S–79S. [Google Scholar] [CrossRef]
- Olivier, J.G.; Schure, K.; Peters, J. Trends in Global CO2 and Total Greenhouse Gas Emissions; PBL Netherlands Environmental Assessment Agency: The Hague, The Netherlands, 2017; p. 5. [Google Scholar]
- McCarthy, M.P.; Best, M.J.; Betts, R.A. Climate change in cities due to global warming and urban effects. Geophys. Res. Lett. 2010, 37. [Google Scholar] [CrossRef]
- U.S. Census Bureau. Growth in Urban Population Outpaces Rest of Nation, Census Bureau Reports. 2014. Available online: https://www.census.gov/newsroom/releases/archives/2010_census/cb12-50.html (accessed on 21 March 2019).
- McCright, A.M.; Dunlap, R.E. Defeating Kyoto: The conservative movement’s impact on US climate change policy. Soc. Probl. 2003, 50, 348–373. [Google Scholar] [CrossRef]
- Shipan, C.R.; Lowry, W.R. Environmental policy and party divergence in Congress. Political Res. Q. 2001, 54, 245–263. [Google Scholar] [CrossRef]
- Dunlap, R.E.; McCright, A.M.; Yarosh, J.H. The political divide on climate change: Partisan polarization widens in the US. Environ. Sci. Policy Sustain. Dev. 2016, 58, 4–23. [Google Scholar] [CrossRef]
- Boussalis, C.; Coan, T.G. Text-mining the signals of climate change doubt. Glob. Environ. Chang. 2016, 36, 89–100. [Google Scholar] [CrossRef]
- Bromley-Trujillo, R.; Poe, J. The importance of salience: Public opinion and state policy action on climate change. J. Public Policy 2014, 1–25. [Google Scholar] [CrossRef]
- Bromley-Trujillo, R.; Butler, J.; Poe, J.; Davis, W. The spreading of innovation: State adoptions of energy and climate change policy. Rev. Policy Res. 2016, 33, 544–565. [Google Scholar] [CrossRef]
- Pickering, J.; McGee, J.S.; Stephens, T.; Karlsson-Vinkhuyzen, S.I. The impact of the US retreat from the Paris Agreement: Kyoto revisited? Clim. Policy 2018, 18, 818–827. [Google Scholar] [CrossRef]
- Nangini, C.; Peregon, A.; Ciais, P.; Weddige, U.; Vogel, F.; Wang, J.; Bréon, F.M.; Bachra, S.; Wang, Y.; Gurney, K.; et al. A global dataset of CO2 emissions and ancillary data related to emissions for 343 cities. Sci. Data 2019, 6, 180280. [Google Scholar] [CrossRef] [PubMed]
- Bulkeley, H. Cities and Climate Change; Routledge: London, UK, 2013. [Google Scholar]
- Reckien, D.; Flacke, J.; Dawson, R.J.; Heidrich, O.; Olazabal, M.; Foley, A.; Hamann, J.J.P.; Orru, H.; Salvia, M.; Hurtado, S.D.G.; et al. Climate change response in Europe: What’s the reality? Analysis of adaptation and mitigation plans from 200 urban areas in 11 countries. Clim. Chang. 2014, 122, 331–340. [Google Scholar] [CrossRef]
- ARUP. Climate Action in Megacities: C40 Cities Baseline and Opportunities; ARUP: Wachington, DC, USA, 2011. [Google Scholar]
- Mashayekh, Y.; Jaramillo, P.; Samaras, C.; Hendrickson, C.T.; Blackhurst, M.; MacLean, H.L.; Matthews, H.S. Potentials for sustainable transportation in cities to alleviate climate change impacts. Environ. Sci. Technol. 2012, 46, 2529–2537. [Google Scholar] [CrossRef]
- Gill, S.E.; Handley, J.F.; Ennos, A.R.; Pauleit, S. Adapting cities for climate change: The role of the green infrastructure. Built Environ. 2007, 33, 115–133. [Google Scholar] [CrossRef]
- Hunt, A.; Watkiss, P. Climate change impacts and adaptation in cities: A review of the literature. Clim. Chang. 2011, 104, 13–49. [Google Scholar] [CrossRef]
- Hanak, E.; Moreno, G. California coastal management with a changing climate. Clim. Chang. 2012, 111, 45–73. [Google Scholar] [CrossRef]
- Carter, J.G.; Cavan, G.; Connelly, A.; Guy, S.; Handley, J.; Kazmierczak, A. Climate change and the city: Building capacity for urban adaptation. Prog. Plan. 2015, 95, 1–66. [Google Scholar] [CrossRef]
- Infield, E.M.H.; Abunnasr, Y.; Ryan, R.L. Planning for Climate Change: A Reader in Green Infrastructure and Sustainable Design for Resilient Cities; Routledge: Abingdon, UK, 2018. [Google Scholar]
- Holman, M.R. Women in Politics in the American City; Temple University Press: Philadelphia, PA, USA, 2015. [Google Scholar]
- Grimmer, J. Representational Style in Congress: What Legislators Say and Why It Matters; Cambridge University Press: Cambridge, UK, 2013. [Google Scholar]
- Grimmer, J. A bayesian hierarchical topic model for political texts: Measuring expressed agendas in senate press releases. Political Anal. 2010, 18, 1–35. [Google Scholar] [CrossRef]
- Grimmer, J. Appropriators not position takers: The distorting effects of electoral incentives on congressional representation. Am. J. Political Sci. 2013, 57, 624–642. [Google Scholar] [CrossRef]
- Boussalis, C.; Coan, T.G.; Holman, M.R. Climate change communication from cities in the USA. Clim. Chang. 2018, 149, 173–187. [Google Scholar] [CrossRef]
- Holman, M.R. Gender, political rhetoric, and moral metaphors in state of the city addresses. Urban Aff. Rev. 2016, 52, 501–530. [Google Scholar] [CrossRef]
- Lambright, W.H.; Chjangnon, S.A.; Harvey, L.D. Urban reactions to the global warming issue: Agenda setting in Toronto and Chicago. Clim. Chang. 1996, 34, 463–478. [Google Scholar] [CrossRef]
- Grimmer, J.; Messing, S.; Westwood, S.J. How words and money cultivate a personal vote: The effect of legislator credit claiming on constituent credit allocation. Am. Political Sci. Rev. 2012, 106, 703–719. [Google Scholar] [CrossRef]
- Krause, R.M. Policy innovation, intergovernmental relations, and the adoption of climate protection initiatives by US cities. J. Urban Aff. 2011, 33, 45–60. [Google Scholar] [CrossRef]
- Fisher, D.R.; Waggle, J.; Leifeld, P. Where does political polarization come from? Locating polarization within the US climate change debate. Am. Behav. Sci. 2013, 57, 70–92. [Google Scholar] [CrossRef]
- Jones, C.; Kammen, D.M. Spatial distribution of US household carbon footprints reveals suburbanization undermines greenhouse gas benefits of urban population density. Environ. Sci. Technol. 2014, 48, 895–902. [Google Scholar] [CrossRef]
- Jagarlamudi, J.; Daumé, H., III; Udupa, R. Incorporating lexical priors into topic models. In Proceedings of the 13th Conference of the European Chapter of the Association for Computational Linguistics, Avignon, France, 23–27 April 2012; Association for Computational Linguistics: Stroudsburg, PA, USA, 2012; pp. 204–213. [Google Scholar]
- Singh, V. GuidedLDA: Guided Topic Modeling with Latent Dirichlet Allocation. 2017. Available online: https://github.com/vi3k6i5/GuidedLDA (accessed on 21 March 2019).
- Blei, D.M.; Ng, A.Y.; Jordan, M.I. Latent Dirichlet allocation. J. Mach. Learn. Res. 2003, 3, 993–1022. [Google Scholar]
- Mikolov, T.; Sutskever, I.; Chen, K.; Corrado, G.; Dean, J. Distributed representations of words and phrases and their compositionality. In Proceedings of the 26th International Conference on Neural Information Processing Systems, Lake Tahoe, NV, USA, 5–10 December 2013; Curran Associates Inc.: Red Hook, NY, USA, 2013; Volume 2, pp. 3111–3119. [Google Scholar]
- Roberts, M.E.; Stewart, B.M.; Tingley, D.; Lucas, C.; Leder-Luis, J.; Gadarian, S.K.; Albertson, B.; Rand, D.G. Structural topic models for open-ended survey responses. Am. J. Political Sci. 2014, 58, 1064–1082. [Google Scholar] [CrossRef]
- Griffiths, T.L.; Steyvers, M. Finding scientific topics. Proc. Natl. Acad. Sci. USA 2004, 101, 5228–5235. [Google Scholar] [CrossRef] [PubMed]
- AlSumait, L.; Barbará, D.; Gentle, J.; Domeniconi, C. Topic significance ranking of LDA generative models. In Proceedings of the Joint European Conference on Machine Learning and Knowledge Discovery in Databases, Bled, Slovenia, 6–10 September 2009; Springer: Berlin/Heidelberg, Germany, 2009; pp. 67–82. [Google Scholar]
- ND-GAIN. Urban Adaptation Assessment Technical Document. 2018. Available online: https://gain.nd.edu/assets/293226/uaa_technical_document.pdf (accessed on 15 February 2019).
- Coan, T.G.; Holman, M.R. Voting green. Soc. Sci. Q. 2008, 89, 1121–1135. [Google Scholar] [CrossRef]
- NOAA. Climate at a Glance. 2018. Available online: https://www.ncdc.noaa.gov/cag/ (accessed on 15 February 2019).
- MIT Election Data and Science Lab. County Presidential Election Returns 2000–2016. 2018. Available online: https://doi.org/10.7910/DVN/VOQCHQ (accessed on 15 February 2019).
- U.S. Census Bureau. 2010–2014 American Community Survey 5-year Estimates. 2014. Available online: https://www.census.gov/programs-surveys/acs/news/data-releases/2014.html (accessed on 15 February 2019).
- Gelman, A.; Jakulin, A.; Pittau, M.G.; Su, Y.S. A weakly informative default prior distribution for logistic and other regression models. Ann. Appl. Stat. 2008, 2, 1360–1383. [Google Scholar] [CrossRef]
- Bürkner, P.C. Brms: An R package for Bayesian multilevel models using Stan. J. Stat. Softw. 2017, 80, 1–28. [Google Scholar] [CrossRef]
- Grimmer, J.; Stewart, B.M. Text as data: The promise and pitfalls of automatic content analysis methods for political texts. Political Anal. 2013, 21, 267–297. [Google Scholar] [CrossRef]
- Crowder-Meyer, M.; Gadarian, S.K.; Trounstine, J. Voting can be hard, information helps. Urban Aff. Rev. 2017. [Google Scholar] [CrossRef]
- Benjamin, A. Coethnic endorsements, out-group candidate preferences, and perceptions in local elections. Urban Aff. Rev. 2017, 53, 631–657. [Google Scholar] [CrossRef]
- Stokes, L.C. Electoral backlash against climate policy: A natural experiment on retrospective voting and local resistance to public policy. Am. J. Political Sci. 2016, 60, 958–974. [Google Scholar] [CrossRef]
- Benegal, S.D.; Scruggs, L.A. Correcting misinformation about climate change: The impact of partisanship in an experimental setting. Clim. Chang. 2018, 148, 61–80. [Google Scholar] [CrossRef]
Figure 1.
Top 20 U.S. city emitters of carbon dioxide equivalent. This figure displays the carbon dioxide equivalent emissions (millions of metric tons) for the top 20 emitters amongst U.S. cities. Estimates are retrieved from Nangini et al. [15].
Figure 1.
Top 20 U.S. city emitters of carbon dioxide equivalent. This figure displays the carbon dioxide equivalent emissions (millions of metric tons) for the top 20 emitters amongst U.S. cities. Estimates are retrieved from Nangini et al. [15].

Figure 2.
Discussion of key policy areas. (a) Provides the total number of words assigned to each of the main “seeded” topics using the model described in Section 2.2. (b–d) Quarterly discussion of Emissions and Transportation, Energy efficiency and Renewable energy, and Climate resiliency, respectively. Word totals are normalized by the number of press releases in each quarter.

Figure 3.
Reducing GHG emissions versus promoting climate resiliency. The figure presents standardized (z-scores) word totals assigned to climate Emissions (x-axis) and Climate resiliency (y-axis). Prior to standardization, word totals were transformed using , given the presence of heavy-tailed word assignment distributions for both topics. Marker size indicates level of climate risk [43]. Republican mayors are in red, while Democratic mayors are in blue [29].

Figure 4.
Explaining variation of climate-related themes in city press releases. This plot illustrates the results of a set of Bayesian multi-level logistic regression models, which estimate the effect of climate risk, political partisanship, and other covariates on whether a city discusses the following climate-related themes in a given month: (a) Emissions, (b) Energy (Energy efficiency & Renewable energy), (c) Climate resiliency, and (d) Land use. Circles represent posterior means, thick whiskers represent 50% credible intervals, and thin whiskers represent 95% credible intervals. Standardized variables are denoted with an asterisk (*).

Table 1.
Topic labels and top 10 most probable keywords of each topic.
| Topic Label | Keywords |
|---|---|
| Climate resiliency | sandy resiliency build_back program resilient resilience homeowners |
| infrastructure communities construction | |
| Emissions | climate_change plan emissions change climate_action climate greenhouse_gas |
| sustainability goals summit | |
| Transportation | new transportation transit street project vehicles system use service station |
| Renewable energy | energy program solar menino energy_efficiency residents green power |
| renewable_energy new | |
| Energy efficiency | energy buildings energy_efficiency building sustainability energy_star program |
| challenge office_sustainability project | |
| Waste management | recycling green waste facility hannemann environmental hawaii businesses |
| project energy | |
| Water | water program residents home customers help use one heat low |
| Land use | community program local communities support residents green projects |
| sustainability neighborhood | |
| Topic 0 | new_yorkers de_blasio council_member nyc blasio administration communities |
| bill_de bill intro | |
| Topic 1 | one work re first people like get us time great make |
| Topic 2 | think going question know lot inaudible people get well obviously |
| Topic 3 | business new jobs companies economic_development technology |
| center businesses company world | |
| Topic 4 | people us think know change would time country state thank |
| Topic 5 | neighborhood_place information ave community _p services place louisville_metro |
| call call_485 | |
| Topic 6 | housing new development project building affordable_housing community |
| construction residents neighborhood | |
| Topic 7 | million budget year funding new state percent would billion program |
| Topic 8 | year community park youth center program downtown first neighborhood new |
| Topic 9 | department new public services council plan process work development planning |
| Topic 10 | new community work support need one make plan help future |
Table 2.
List of key covariates.
| Variable [Source] | Obs | Mean | Std. Dev | Min | Max |
|---|---|---|---|---|---|
| Climate risk [43] | 3027 | 0.43 | 0.92 | 0.20 | 0.80 |
| County Vote Share, Obama 2008 (%) [46] | 3168 | 62.06 | 12.24 | 28.52 | 92.86 |
| Mayor: Republican [29] | 3038 | 0.18 | 0.39 | 0.00 | 1.00 |
| Type of Government (Mayor-council) [29] | 3168 | 0.72 | 0.45 | 0.00 | 1.00 |
| County Median Household Income [47] | 3168 | 54.35 | 10.56 | 34.80 | 93.85 |
| County Unemployment (%) [47] | 3168 | 6.11 | 1.43 | 3.60 | 9.90 |
| County Total Population [47] | 3168 | 1.60 | 2.20 | 0.24 | 10.00 |
| Local Temp. Anomaly [45] | 3168 | 2.19 | 3.39 | −15.30 | 18.00 |
| City Press Releases | 3168 | 20.47 | 23.33 | 1.00 | 335.00 |
© 2019 by the authors. Licensee MDPI, Basel, Switzerland. This article is an open access article distributed under the terms and conditions of the Creative Commons Attribution (CC BY) license (http://creativecommons.org/licenses/by/4.0/).
Share and Cite
MDPI and ACS Style
Boussalis, C.; Coan, T.G.; Holman, M.R. Communicating Climate Mitigation and Adaptation Efforts in American Cities. Climate 2019, 7, 45. https://doi.org/10.3390/cli7030045
AMA Style
Boussalis C, Coan TG, Holman MR. Communicating Climate Mitigation and Adaptation Efforts in American Cities. Climate. 2019; 7(3):45. https://doi.org/10.3390/cli7030045
Chicago/Turabian StyleBoussalis, Constantine, Travis G. Coan, and Mirya R. Holman. 2019. "Communicating Climate Mitigation and Adaptation Efforts in American Cities" Climate 7, no. 3: 45. https://doi.org/10.3390/cli7030045
Note that from the first issue of 2016, this journal uses article numbers instead of page numbers. See further details here.