Perceived Self-Efficacy and Adaptation to Climate Change in Coastal Cambodia


Abstract
:1. Introduction
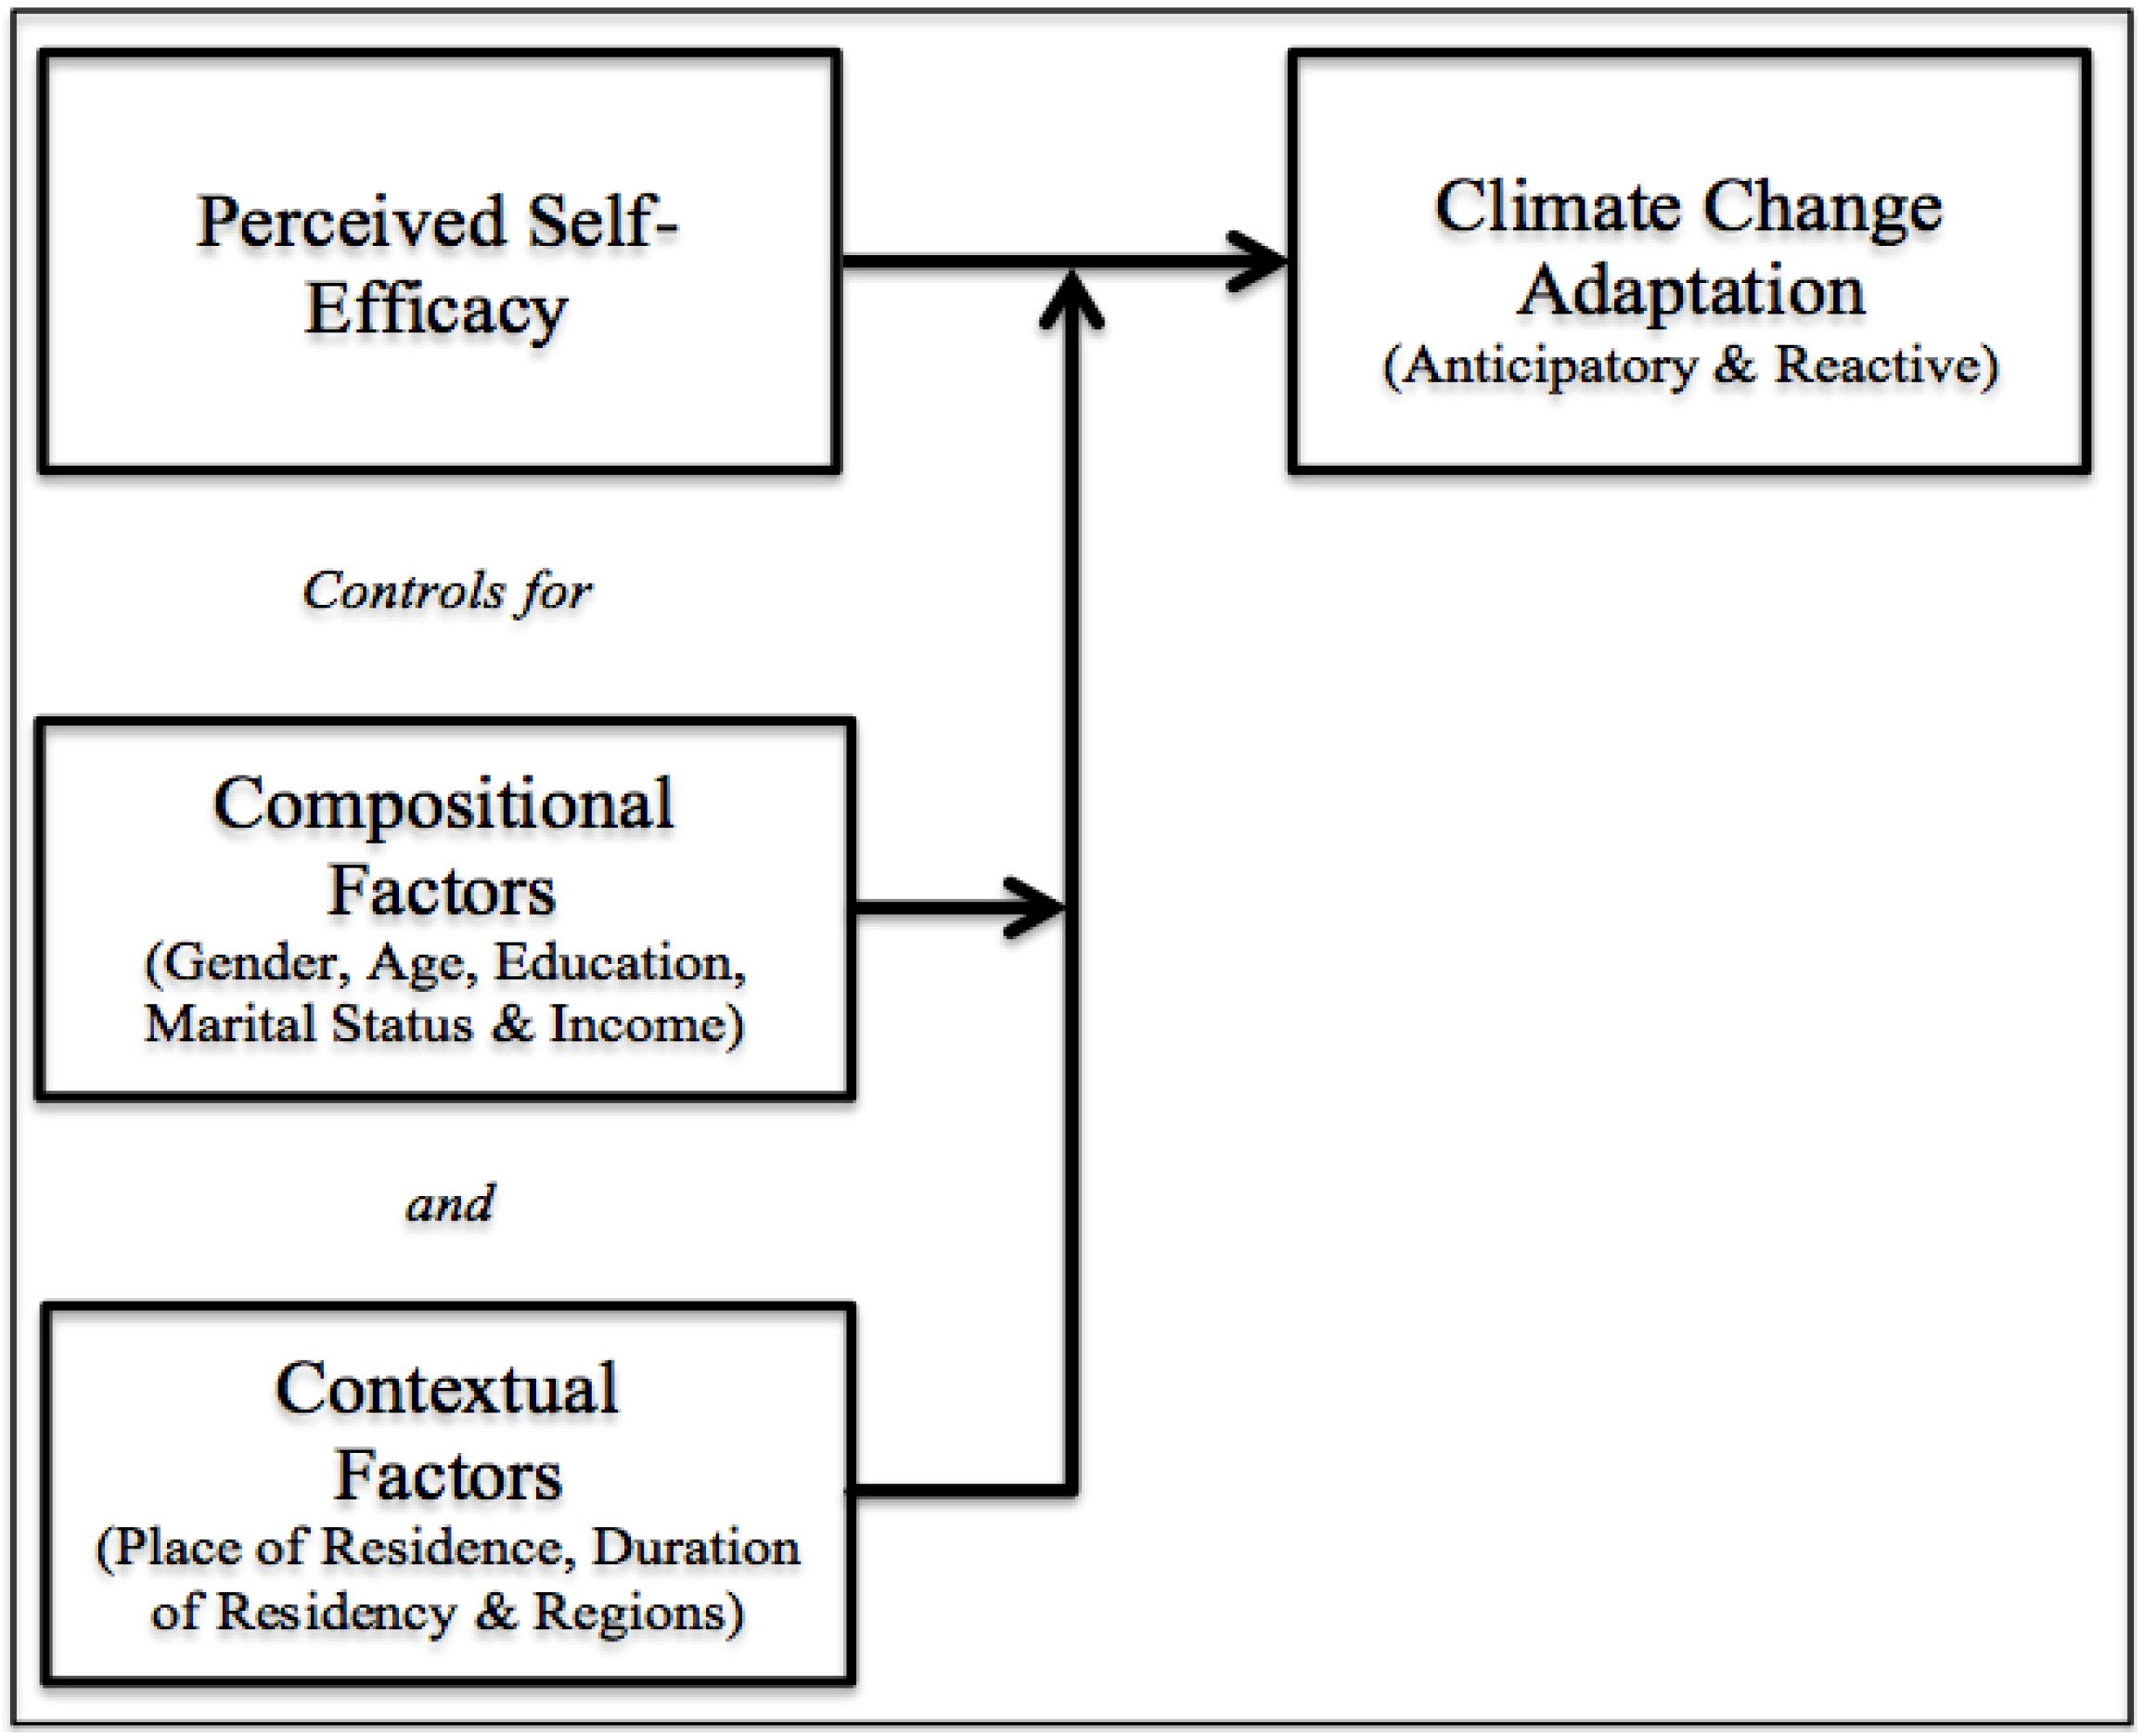
2. Theoretical Framework: Perceived Self-Efficacy
3. Method
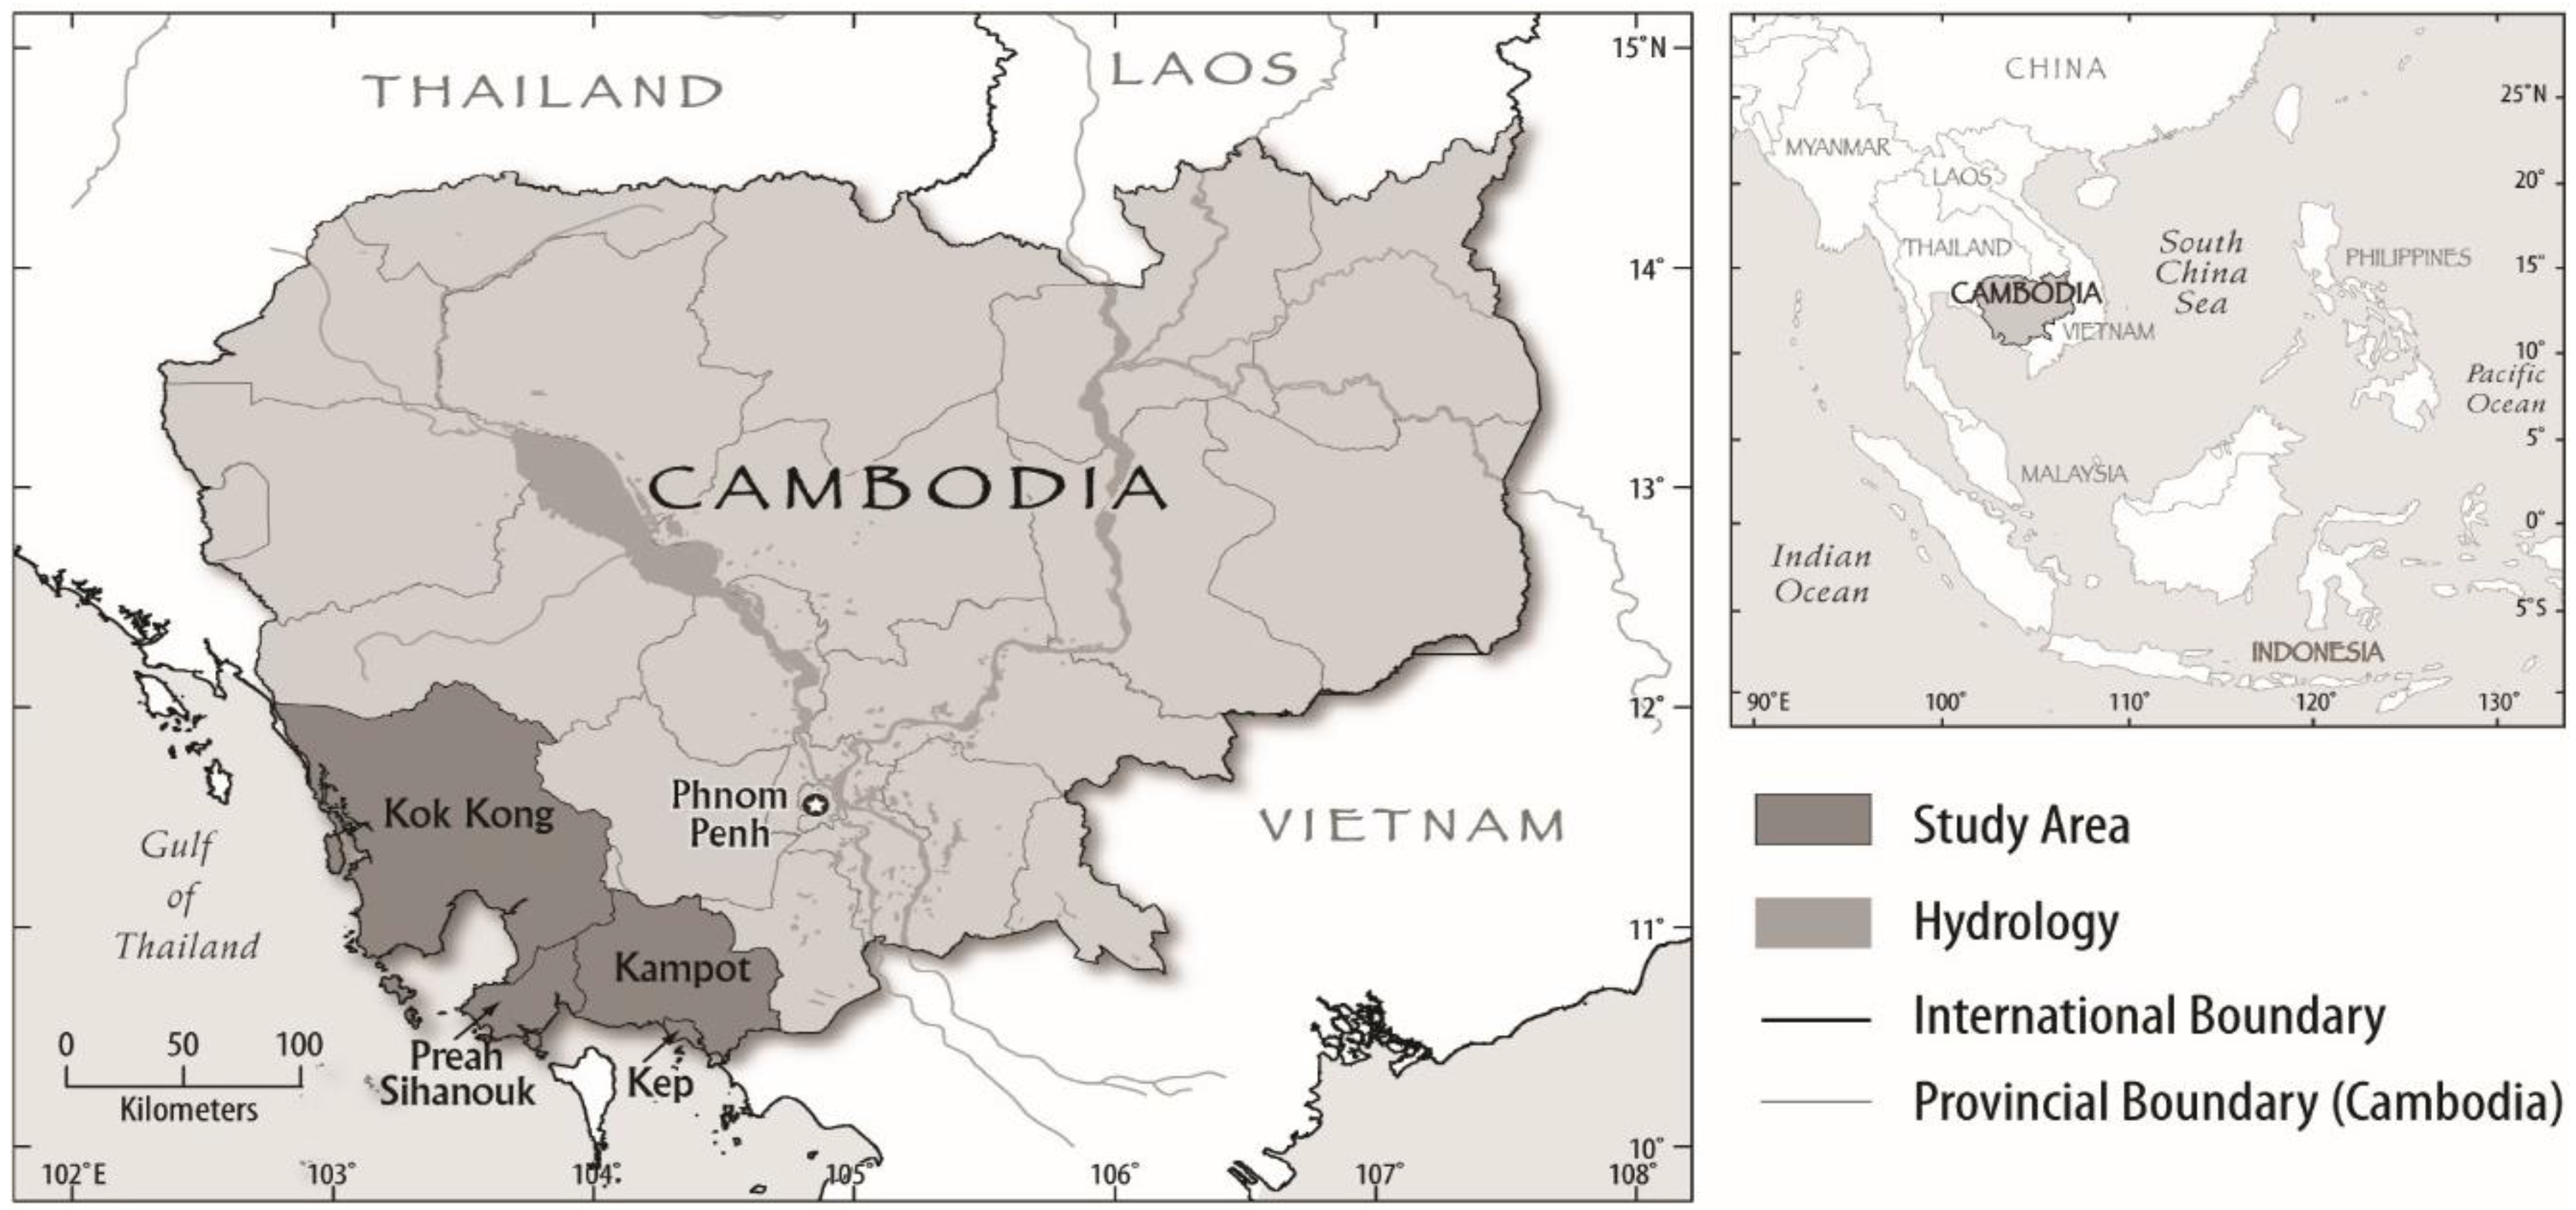
3.1. Study Context and Data Collection

3.2. Measure
3.2.1. Outcome Variables
3.2.2. Predictor Variables
3.3. Data Analysis

| Predictor Variables | Anticipatory Adaptation | |||
|---|---|---|---|---|
| Low (%) | Medium (%) | High (%) | Pearson’s χ2 (df) | |
| Perceived Self-Efficacy | ||||
| Perceived Self-Efficacy | ||||
| 1 | 0.39 | 0.29 | 0.14 | χ2 (1) = 227.11 Pr = 0.000 |
| 2 | 4.01 | 1.45 | 1.70 | Cramér’s V = 0.25 |
| 3 | 24.45 | 21.22 | 17.42 | |
| 4 | 38.55 | 28.20 | 11.19 | |
| 5 | 32.60 | 48.84 | 69.55 | |
| Compositional Factor | ||||
| Gender | ||||
| Male | 28.85 | 39.53 | 31.05 | χ2 (1) = 14.3 Pr = 0.001 |
| Female | 71.15 | 60.47 | 68.95 | Cramér’s V = 0.08 |
| Age | ||||
| 18–24 | 10.87 | 7.56 | 8.50 | χ2 (1) = 10.49 Pr =0.39 |
| 25–34 | 21.47 | 25.87 | 23.80 | Cramér’s V = 0.05 |
| 35–44 | 19.28 | 21.22 | 19.41 | |
| 45–54 | 22.77 | 21.80 | 21.39 | |
| 55–64 | 15.65 | 16.86 | 16.57 | |
| 65+ | 9.96 | 6.69 | 10.34 | |
| Education | ||||
| No Education | 24.32 | 17.15 | 16.57 | χ2 (1) = 23.72 Pr = 0.001 |
| Primary Education | 48.12 | 48.26 | 53.54 | Cramér’s V = 0.08 |
| Secondary Education | 15.91 | 21.22 | 20.25 | |
| Higher Education | 11.64 | 13.37 | 9.63 | |
| Marital Status | ||||
| Single | 6.73 | 6.10 | 4.96 | χ2 (1) = 2.09 Pr = 0.35 |
| Non-Single | 93.27 | 93.90 | 95.04 | Cramér’s V = 0.03 |
| Income | ||||
| <USD100/month | 18.89 | 9.88 | 15.44 | χ2 (1) = 14.61 Pr = 0.001 |
| >USD100/month | 81.11 | 90.12 | 84.56 | Cramér’s V = 0.09 |
| Contextual Factor | ||||
| Place of Residence | ||||
| Urban | 28.33 | 29.94 | 27.90 | χ2 (1) = 0.48 Pr = 0.78 |
| Rural | 71.67 | 70.06 | 72.10 | Cramér’s V = 0.02 |
| Duration of Residence | ||||
| 5 Years | 12.55 | 8.43 | 8.92 | χ2 (1) = 16.79 Pr = 0.01 |
| 6–10 Years | 4.66 | 8.14 | 4.96 | Cramér’s V = 0.07 |
| 11–15 Years | 6.86 | 9.59 | 6.37 | |
| 16+ Years | 75.94 | 73.84 | 79.75 | |
| Regions | ||||
| Kampot | 29.37 | 31.98 | 25.92 | χ2 (1) = 21.02 Pr = 0.002 |
| Kep | 18.24 | 15.41 | 13.60 | Cramér’s V = 0.08 |
| Presh Sihanouk | 33.25 | 30.23 | 32.72 | |
| Kok Kong | 19.15 | 22.38 | 27.76 | |
| Predictor Variables | Reactive Adaptation | ||
|---|---|---|---|
| Yes (%) | No (%) | Pearson’s χ2 (df) | |
| Perceived Self-Efficacy | |||
| Perceived Self-Efficacy | |||
| 1 | 0.11 | 0.50 | χ2 (1) = 427.96 Pr = 0.000 |
| 2 | 0.32 | 5.11 | Cramér’s V = 0.49 |
| 3 | 10.27 | 32.67 | |
| 4 | 15.14 | 36.78 | |
| 5 | 74.16 | 24.94 | |
| Compositional Factor | |||
| Gender | |||
| Male | 29.08 | 33.42 | χ2 (1) = 3.76 Pr = 0.05 |
| Female | 70.92 | 66.58 | Cramér’s V = 0.05 |
| Age | |||
| 18–24 | 9.19 | 9.73 | χ2 (1) = 5.37 Pr = 0.37 |
| 25–34 | 22.49 | 24.06 | Cramér’s V = 0.05 |
| 35–44 | 20.54 | 19.58 | |
| 45–54 | 21.41 | 22.19 | |
| 55–64 | 15.78 | 16.83 | |
| 65+ | 10.59 | 7.61 | |
| Education | |||
| No Education | 18.27 | 20.45 | χ2 (1) = 6.89 Pr = 0.07 |
| Primary Education | 52.65 | 48.63 | Cramér’s V = 0.06 |
| Secondary Education | 19.24 | 17.83 | |
| Higher Education | 9.84 | 13.09 | |
| Marital Status | |||
| Single | 5.73 | 6.48 | χ2 (1) = 0.43 Pr = 0.51 |
| Non-Single | 94.27 | 93.52 | Cramér’s V = 0.02 |
| Household Income | |||
| <USD100/month | 14.92 | 15.59 | χ2 (1) = 0.15 Pr = 0.70 |
| >USD100/month | 85.08 | 84.41 | Cramér’s V = 0.00 |
| Contextual Factor | |||
| Place of Residence | χ2 (1) = 0.06 Pr = 0.79 | ||
| Urban | 28.11 | 26.68 | Cramér’s V = 0.00 |
| Rural | 71.89 | 71.32 | |
| Duration of Residence | |||
| 5 Years | 7.35 | 13.97 | χ2 (1) = 21.84 Pr = 0.00 |
| 6–10 Years | 4.97 | 5.99 | Cramér’s V = 0.11 |
| 11–15 Years | 7.14 | 6.73 | |
| 16+ Years | 80.54 | 73.32 | |
| Regions | |||
| Kampot | 22.49 | 34.66 | χ2 (1) = 41.50 Pr = 0.00 |
| Kep | 14.81 | 16.33 | Cramér’s V = 0.15 |
| Presh Sihanouk | 34.80 | 30.30 | |
| Kok Kong | 28.00 | 18.70 | |
| Predictor Variables | Anticipatory Adaptation | Reactive Adaptation | ||
|---|---|---|---|---|
| OR | SE | OR | SE | |
| Perceived Self-Efficacy | ||||
| Perceived Self-Efficacy | ||||
| Low | 1.00 | 1.00 | 1.00 | 1.00 |
| High | 1.75 *** | 0.09 | 3.47 *** | 0.24 |
| Compositional Factor | ||||
| Gender | ||||
| Male | 1.00 | 1.00 | 1.00 | 1.00 |
| Female | 0.97 | 0.09 | 1.22 | 0.13 |
| Age | ||||
| 18–24 | 1.00 | 1.00 | 1.00 | 1.00 |
| 25–34 | 1.36 | 0.23 | 0.99 | 0.18 |
| 35–44 | 1.26 | 0.22 | 1.11 | 0.21 |
| 45–54 | 1.19 | 0.21 | 1.02 | 0.19 |
| 55–64 | 1.31 | 0.24 | 0.99 | 0.19 |
| 65+ | 1.28 | 0.26 | 1.47 | 0.33 |
| Education | ||||
| No Education | 1.00 | 1.00 | 1.00 | 1.00 |
| Primary Education | 1.54 *** | 0.18 | 1.21 | 0.16 |
| Secondary Education | 1.71 *** | 0.24 | 1.21 | 0.19 |
| Higher Education | 1.22 | 0.19 | 0.84 | 0.15 |
| Marital Status | ||||
| Single | 1.00 | 1.00 | 1.00 | 1.00 |
| Non-Single | 1.30 | 0.24 | 1.14 | 0.22 |
| Household Income | ||||
| <USD100/month | 1.00 | 1.00 | 1.00 | 1.00 |
| >USD100/month | 1.28 * | 0.16 | 1.05 | 0.14 |
| Contextual Factor | ||||
| Place of Residence | ||||
| Urban | 1.00 | 1.00 | 1.00 | 1.00 |
| Rural | 1.02 | 0.09 | 1.03 | 0.11 |
| Duration of Residence | ||||
| <5 Years | 1.00 | 1.00 | 1.00 | 1.00 |
| 6+ Years | 1.10 * | 0.05 | 1.24 *** | 0.06 |
| Regions | ||||
| Kampot | 1.00 | 1.00 | 1.00 | 1.00 |
| Other Coastal Provinces | 1.01 *** | 0.01 | 1.03 *** | 0.01 |
| Predictor Variables | Perceived Self-Efficacy | Compositional Factor | Contextual Factor | |||
|---|---|---|---|---|---|---|
| OR | SE | OR | SE | OR | SE | |
| Perceived Self-Efficacy | ||||||
| Perceived Self-Efficacy | ||||||
| Low | 1.00 | 1.00 | 1.00 | 1.00 | 1.00 | 1.00 |
| High | 1.74 *** | 0.09 | 1.75 *** | 0.09 | 1.74 *** | 0.09 |
| Compositional Factor | ||||||
| Gender | ||||||
| Male | 1.00 | 1.00 | 1.00 | 1.00 | ||
| Female | 0.93 | 0.09 | 0.92 | 0.09 | ||
| Age | ||||||
| 18–24 | 1.00 | 1.00 | 1.00 | 1.00 | ||
| 25–34 | 1.30 | 0.25 | 1.29 | 0.25 | ||
| 35–44 | 1.17 | 0.24 | 1.15 | 0.23 | ||
| 45–54 | 1.19 | 0.24 | 1.15 | 0.23 | ||
| 55–64 | 1.29 | 0.27 | 1.23 | 0.26 | ||
| 65+ | 1.53 | 0.37 | 1.46 | 0.35 | ||
| Education | ||||||
| No Education | 1.00 | 1.00 | 1.00 | 1.00 | ||
| Primary Education | 1.61 *** | 0.21 | 1.64 *** | 0.21 | ||
| Secondary Education | 2.02 *** | 0.32 | 2.06 *** | 0.32 | ||
| Higher Education | 1.65 *** | 0.29 | 1.71 *** | 0.31 | ||
| Marital Status | ||||||
| Single | 1.00 | 1.00 | 1.00 | 1.00 | ||
| Non-Single | 1.06 | 0.23 | 1.09 | 0.24 | ||
| Household Income | ||||||
| <USD100/month | 1.00 | 1.00 | 1.00 | 1.00 | ||
| >USD100/month | 1.21 | 0.15 | 1.21 | 0.15 | ||
| Contextual Factor | ||||||
| Place of Residence | ||||||
| Urban | 1.00 | 1.00 | ||||
| Rural | 1.12 | 0.22 | ||||
| Duration of Residence | ||||||
| <5 Years | 1.00 | 1.00 | ||||
| 6+ Years | 1.09 * | 0.05 | ||||
| Regions | ||||||
| Kampot | 1.00 | 1.00 | ||||
| Others Coastal Provinces | 1.01 * | 0.01 | ||||
| Log Likelihood | −1839.83 | −1825.21 | −1821.53 | |||
| Variance of Random Effect | ||||||
| Level 2 (Commune) Variance | 0.05 | 0.06 *** | 0.05 * | |||
| Level 3 (District) Variance | 0.04 | 0.01 | 0.01 | |||
| p (Same District, Different Communes) | 0.01 | 0.02 | 0.03 | |||
| p (Same Commune, Same Districts) | 0.06 | 0.03 | 0.04 | |||
| Predictor Variables | Perceived Self-Efficacy | Compositional Factor | Contextual Factor | |||
|---|---|---|---|---|---|---|
| OR | SE | OR | SE | OR | SE | |
| Perceived Self-Efficacy | ||||||
| Perceived Self-Efficacy | ||||||
| Low | 1.00 | 1.00 | 1.00 | 1.00 | 1.00 | 1.00 |
| High | 3.57 *** | 0.26 | 3.69 *** | 0.27 | 3.61 *** | 0.27 |
| Compositional Factor | ||||||
| Gender | ||||||
| Male | 1.00 | 1.00 | 1.00 | 1.00 | ||
| Female | 1.02 | 0.12 | 1.01 | 0.13 | ||
| Age | ||||||
| 18–24 | 1.00 | 1.00 | 1.00 | 1.00 | ||
| 25–34 | 0.81 | 0.19 | 0.80 | 0.19 | ||
| 35–44 | 0.94 | 0.23 | 0.91 | 0.23 | ||
| 45–54 | 0.88 | 0.21 | 0.81 | 0.20 | ||
| 55–64 | 0.80 | 0.21 | 0.70 | 0.18 | ||
| 65+ | 1.37 | 0.41 | 1.25 | 0.37 | ||
| Education | ||||||
| No Education | 1.00 | 1.00 | 1.00 | 1.00 | ||
| Primary Education | 1.41 ** | 0.22 | 1.47 ** | 0.23 | ||
| Secondary Education | 1.88 *** | 0.37 | 1.98 *** | 0.39 | ||
| Higher Education | 1.54 * | 0.34 | 1.63 * | 0.36 | ||
| Marital Status | ||||||
| Single | 1.00 | 1.00 | 1.00 | 1.00 | ||
| Non-Single | 0.72 | 0.20 | 0.77 | 0.21 | ||
| Household Income | ||||||
| <USD100/month | 1.00 | 1.00 | 1.00 | 1.00 | ||
| >USD100/month | 0.99 | 0.16 | 1.00 | 0.16 | ||
| Contextual Factor | ||||||
| Place of Residence | ||||||
| Urban | 1.00 | 1.00 | ||||
| Rural | 1.41 | 0.39 | ||||
| Duration of Residence | ||||||
| <5 Years | 1.00 | 1.00 | ||||
| 6+ Years | 1.22 *** | 0.07 | ||||
| Regions | ||||||
| Kampot | 1.00 | 1.00 | ||||
| Others Coastal Provinces | 1.03 *** | 0.01 | ||||
| Log Likelihood | −974.34 | −964.47 | −953.43 | |||
| Variance of Random Effect | ||||||
| Level 2 (Commune) Variance | 0.14 | 0.23 *** | 0.07* | |||
| Level 3 (District) Variance | 0.15 | 0.25 *** | 0.01 | |||
| p (Same District, Different Communes) | 0.04 | 0.06 | 0.01 | |||
| p (Same Commune, Same Districts) | 0.18 | 0.30 | 0.08 | |||
4. Results
4.1. Univariate Analysis
4.2. Bivariate Analysis
4.3. Multivariate Analysis
5. Discussion
6. Conclusions
Acknowledgments
Author Contributions
Conflicts of Interest
References
- Folke, C. Resilience: The emergence of a perspective for social-ecological systems analyses. Glob. Environ. Chang. 2006, 16, 253–267. [Google Scholar] [CrossRef]
- Smit, B.; Wandel, J. Adaptation, adaptive capacity and vulnerability. Glob. Environ. Chang. 2006, 16, 282–292. [Google Scholar] [CrossRef]
- Huang, C.; Vaneckova, P.; Wang, X.; Fitzgerald, G.; Guo, Y.; Tong, S. Constraints and barriers to public health adaptation to climate change: A review of the literature. Am. J. Prev. Med. 2011, 40, 183–190. [Google Scholar] [CrossRef] [PubMed]
- Adger, W.N. Vulnerability. Glob. Environ. Chang. 2006, 16, 268–281. [Google Scholar] [CrossRef]
- Adger, W.N.; Dessai, S.; Goulden, M.; Hulme, M.; Lorenzoni, I.; Nelson, D.R.; Naess, L.O.; Wolf, J.; Wreford, A. Are there social limits to adaptation to climate change? Clim. Chang. 2009, 93, 335–354. [Google Scholar] [CrossRef]
- Smit, B.; Burton, I.; Klein, R.J.T.; Street, R. The science of adaptation: A framework for assessment. Mitig. Adapt. Strategies Glob. Chang. 1999, 4, 199–213. [Google Scholar] [CrossRef]
- Smithers, J.; Smit, B. Human adaptation to climatic variability and change. Glob. Environ. Chang. 1997, 7, 129–146. [Google Scholar] [CrossRef]
- Smit, B.; Pilifosova, O. Adaptation to climate change in the context of sustainable development and equity. Sustain. Dev. 2003, 8, 876–912. [Google Scholar]
- Barros, V.R.; Field, C.B.; Dokken, D.J.; Mastrandrea, M.D.; Mach, K.J.; Bilir, T.E.; Chatterjee, M.; Ebi, K.L.; Estrada, Y.O.; Genova, R.C.; et al. Climate Change 2014: Impacts, Adaptation, and Vulnerability. Part B: Regional Aspects; Cambridge University Press: Cambridge, UK, 2014. [Google Scholar]
- Leary, N.; Adejuwon, J.; Barros, V.; Burton, I.; Kulkarni, J.; Lasco, R. Climate Change and Adaptation; Routledge: London, UK.
- McCarthy, J.J.; Canziani, O.F.; Leary, N.A.; Dokken, D.J.; White, K.S. Climate Change 2001: Impacts, Adaptation, and Vulnerability; Cambridge University Press: Cambridge, UK, 2001. [Google Scholar]
- Tol, R.S.J.; Klein, R.J.T.; Nicholls, R.J. Towards successful adaptation to sea-level rise along Europe’s coasts. J. Coast. Res. 2008, 24, 432–442. [Google Scholar] [CrossRef]
- Smit, B.; Burton, I.; Klein, R.J.T.; Wandel, J. An anatomy of adaptation to climate change and variability. Clim. Chang. 2000, 45, 223–251. [Google Scholar] [CrossRef]
- Howe, P.D. Hurricane preparedness as anticipatory adaptation: A case study of community businesses. Glob. Environ. Chang. 2011, 21, 711–720. [Google Scholar] [CrossRef]
- Burton, I.; Diringer, E.; Smith, J. Adaptation to Climate Change: International Policy Options; Pew Center on Global Climate Change: Arlington, VA, USA, 2006. [Google Scholar]
- Intergovernmental Panel on Climate Change (IPCC). Climate Change 2007: Synthesis Report; IPCC: Geneva, Switzerland, 2007. [Google Scholar]
- Grothmann, T.; Patt, A. Adaptive capacity and human cognition: The process of individual adaptation to climate change. Glob. Environ. Chang. 2005, 15, 199–213. [Google Scholar] [CrossRef]
- Lorenzoni, I.; Jordan, A.; O’Riordan, T.; Kerry Turner, R.; Hulme, M. A co-evolutionary approach to climate change impact assessment—Part II: A scenario-based case study in East Anglia (UK). Glob. Environ. Chang. 2000, 10, 145–155. [Google Scholar] [CrossRef]
- Narayan-Parker, D. Measuring Empowerment: Cross-Disciplinary Perspectives; World Bank: Washington, DC, USA, 2005. [Google Scholar]
- Reser, J.P.; Swim, J.K. Adapting to and coping with the threat and impacts of climate change. Am. Psychol. 2011, 66, 277–289. [Google Scholar] [CrossRef] [PubMed]
- Osberghaus, D.; Finkel, E.; Pohl, M. Individual adaptation to climate change: The role of information and perceived risk. Available online: ftp://ftp.zew.de/pub/zew-docs/dp/dp10061.pdf (accessed on 12 June 2015).
- Dany, V.; Bowen, K.J.; Miller, F. Assessing the institutional capacity to adapt to climate change: A case study in the Cambodian health and water sectors. Clim. Policy 2015, 15, 388–409. [Google Scholar] [CrossRef]
- Resurreccion, B.P.; Sajor, E.E.; Fajber, E. Climate Adaptation in Asia: Knowledge Gaps and Research Issues in South East Asia; Institute for Social and Environmental Transition (ISET): Kathmandu, Nepal, 2008. [Google Scholar]
- Mekong River Commission. Flood Situation Report; Mekong River Commission: Phnom Penh, Cambodia, 2011. [Google Scholar]
- Ministry of Environment. National Adaptation Programme of Action to Climate Change (NAPA); Ministry of Environment: Phnom Penh, Cambodia, 2006.
- Moriarty, C.M. Effects of Self-Efficacy and Response Efficacy Messages in Health News: Changing Health Attitudes and Behavioral Intentions. Ph.D. Thesis, University of Illinois at Urbana-Champaign, Champaign, IL, USA, 2010. [Google Scholar]
- Maiman, L.A.; Becker, M.H. The health belief model: Origins and correlates in psychological theory. Health Educ. Monogr. 1974, 2, 336–353. [Google Scholar] [CrossRef]
- Rogers, R.W. A protection motivation theory of fear appeals and attitude change1. J. Psychol. 1975, 91, 93–114. [Google Scholar] [CrossRef]
- Rogers, R.W.; Cacioppo, J.T.; Petty, R. Cognitive and physiological processes in fear appeals and attitude change: A revised theory of protection motivation. In Social Psychophysiology: A Sourcebook; The Guilford Press: New, York, NY, USA, 1983; pp. 153–177. [Google Scholar]
- Ajzen, I. From intentions to actions: A theory of planned behavior. In Action Control: From Cognition to Behavior; Springer: Berlin, Germany, 1985; pp. 11–39. [Google Scholar]
- Bandura, A. A social cognitive perspective on positive psychology. Rev. Psicol. Soc. 2011, 26, 7–20. [Google Scholar] [CrossRef]
- Bandura, A. Self-Efficacy: The Exercise of Control; Macmillan: London, UK, 1997. [Google Scholar]
- Witte, K. Putting the fear back into fear appeals: The extended parallel process model. Commun. Monogr. 1992, 59, 329–349. [Google Scholar] [CrossRef]
- Witte, K. Fear as motivator, fear as inhibitor: Using the EPPM to explain fear appeal successes and failures. In The Handbook of Communication and Emotion; Andersen, P.A., Guerrero, L.K., Eds.; Academic Press: New York, NY, USA, 1998; pp. 423–450. [Google Scholar]
- Bandura, A. Social Foundations of Thought and Action: A Social Cognitive Theory; Prentice Hall: Upper Saddle River, NJ, USA, 1986. [Google Scholar]
- Hanson-Easey, S.; Bi, P.; Williams, S. Public Understanding of Climate Change and Adaptation in South Australia; National Climate Change Adaptation Research Facility: Southport, QLD, Canada, 2013. [Google Scholar]
- Kellstedt, P.M.; Zahran, S.; Vedlitz, A. Personal efficacy, the information environment, and attitudes toward global warming and climate change in the United States. Risk Anal. 2008, 28, 113–126. [Google Scholar] [CrossRef] [PubMed]
- Ministry of Planning. General Population Census of Cambodia 2008, Provisional Population Totals National Institute of Statistics; Ministry of Planning: Phnom Penh, Cambodia, 2008.
- Kunthear, M.; Ponniah, K. Kampong cham’s great divide. Phnom Penh Post, 10 January 2014. [Google Scholar]
- Ministry of Planning. Ageing and Migration in Cambodia: A CRUMP Series Report; Ministry of Planning: Phnom Penh, Cambodia, 2013.
- Balbus, J.M.; Malina, C. Identifying vulnerable subpopulations for climate change health effects in the United States. J. Occup. Environ. Med. 2009, 51, 33–37. [Google Scholar] [CrossRef] [PubMed]
- Cramér, H. Mathematical Methods of Statistics; Princeton University Press: Princeton, NJ, USA, 1999. [Google Scholar]
- Bickel, G.; Nord, M.; Price, C.; Hamilton, W.; Cook, J. Guide to Measuring Household Food Security; United States Department of Agriculture: Naches, WA, USA, 2000.
- Rabe-Hesketh, S.; Skrondal, A.; Pickles, A. Generalized multilevel structural equation modeling. Psychometrika 2004, 69, 167–190. [Google Scholar] [CrossRef]
- Jones, L.; Boyd, E. Exploring social barriers to adaptation: Insights from Western Nepal. Glob. Environ. Chang. 2011, 21, 1262–1274. [Google Scholar] [CrossRef]
- Wolf, J.; Lorenzoni, I.; Few, R.; Abrahmson, V.; Raine, R. Conceptual and Practical Barriers to Adaptation: An. Interdisciplinary Analysis of Vulnerability and Response to Heat Waves in the UK. Adapting to Climate Change: Thresholds, Values, Governance; Cambridge University Press: Cambridge, UK, 2009. [Google Scholar]
- Deressa, T.T.; Hassan, R.M.; Ringler, C.; Alemu, T.; Yesuf, M. Determinants of farmers’ choice of adaptation methods to climate change in the Nile Basin of Ethiopia. Glob. Environ. Chang. 2009, 19, 248–255. [Google Scholar] [CrossRef]
- Asfaw, A.; Admassie, A. The role of education on the adoption of chemical fertiliser under different socioeconomic environments in Ethiopia. Agric. Econ. 2004, 30, 215–228. [Google Scholar] [CrossRef]
- Striessnig, E.; Lutz, W.; Patt, A.G. Effects of educational attainment on climate risk vulnerability. Ecol. Soc. 2013, 18. [Google Scholar] [CrossRef]
- Ackerly, D.D.; Loarie, S.R.; Cornwell, W.K.; Weiss, S.B.; Hamilton, H.; Branciforte, R.; Kraft, N.J.B. The geography of climate change: Implications for conservation biogeography. Divers. Distrib. 2010, 16, 476–487. [Google Scholar] [CrossRef]
- Adger, W.N.; Arnell, N.W.; Tompkins, E.L. Successful adaptation to climate change across scales. Glob. Environ. Chang. 2005, 15, 77–86. [Google Scholar] [CrossRef]
- Kettle, N.P. Coastal Climate Change Adaptation: The Influence of Perceived Risk, Uncertainty, Trust, and Scale. Ph.D. Thesis, University of South Carolina, Columbia, SC, USA, 2012. [Google Scholar]
- Root, T.L.; Schneider, S.H. Strategic cyclical scaling: Bridging five orders of magnitude scale gaps in climatic and ecological studies. Integr. Assess. 2002, 3, 188–200. [Google Scholar] [CrossRef]
- Wilbanks, T.J. How scale matters: Some concepts and findings. In Bridging Scales and Knowledge Systems: Concepts and Applications in Ecosystem Assessment; Reid, W.V., Berkes, F., Wilbanks, T.J., Capistrano, D., Eds.; Island Press: Washington, DC, USA, 2006; pp. 21–35. [Google Scholar]
- Wilbanks, T.J.; Kates, R.W. Global change in local places: How scale matters. Clim. Chang. 1999, 43, 601–628. [Google Scholar] [CrossRef]
© 2015 by the authors; licensee MDPI, Basel, Switzerland. This article is an open access article distributed under the terms and conditions of the Creative Commons by Attribution (CC-BY) license (http://creativecommons.org/licenses/by/4.0/).
Share and Cite
Ung, M.; Luginaah, I.; Chuenpagdee, R.; Campbell, G. Perceived Self-Efficacy and Adaptation to Climate Change in Coastal Cambodia. Climate 2016, 4, 1. https://doi.org/10.3390/cli4010001
Ung M, Luginaah I, Chuenpagdee R, Campbell G. Perceived Self-Efficacy and Adaptation to Climate Change in Coastal Cambodia. Climate. 2016; 4(1):1. https://doi.org/10.3390/cli4010001
Chicago/Turabian StyleUng, Mengieng, Isaac Luginaah, Ratana Chuenpagdee, and Gwyn Campbell. 2016. "Perceived Self-Efficacy and Adaptation to Climate Change in Coastal Cambodia" Climate 4, no. 1: 1. https://doi.org/10.3390/cli4010001