3.1. Sensitivity of Ice Nucleation Related Parameters to INPs
As described in
Section 2, N12 connects ice nucleation with the number and surface area of dust particles. Therefore, Run_N12 could give very different ice-related cloud properties for regions with high dust concentrations from regions with lower dust concentrations, while Run_M92 would not display such sensitivity.
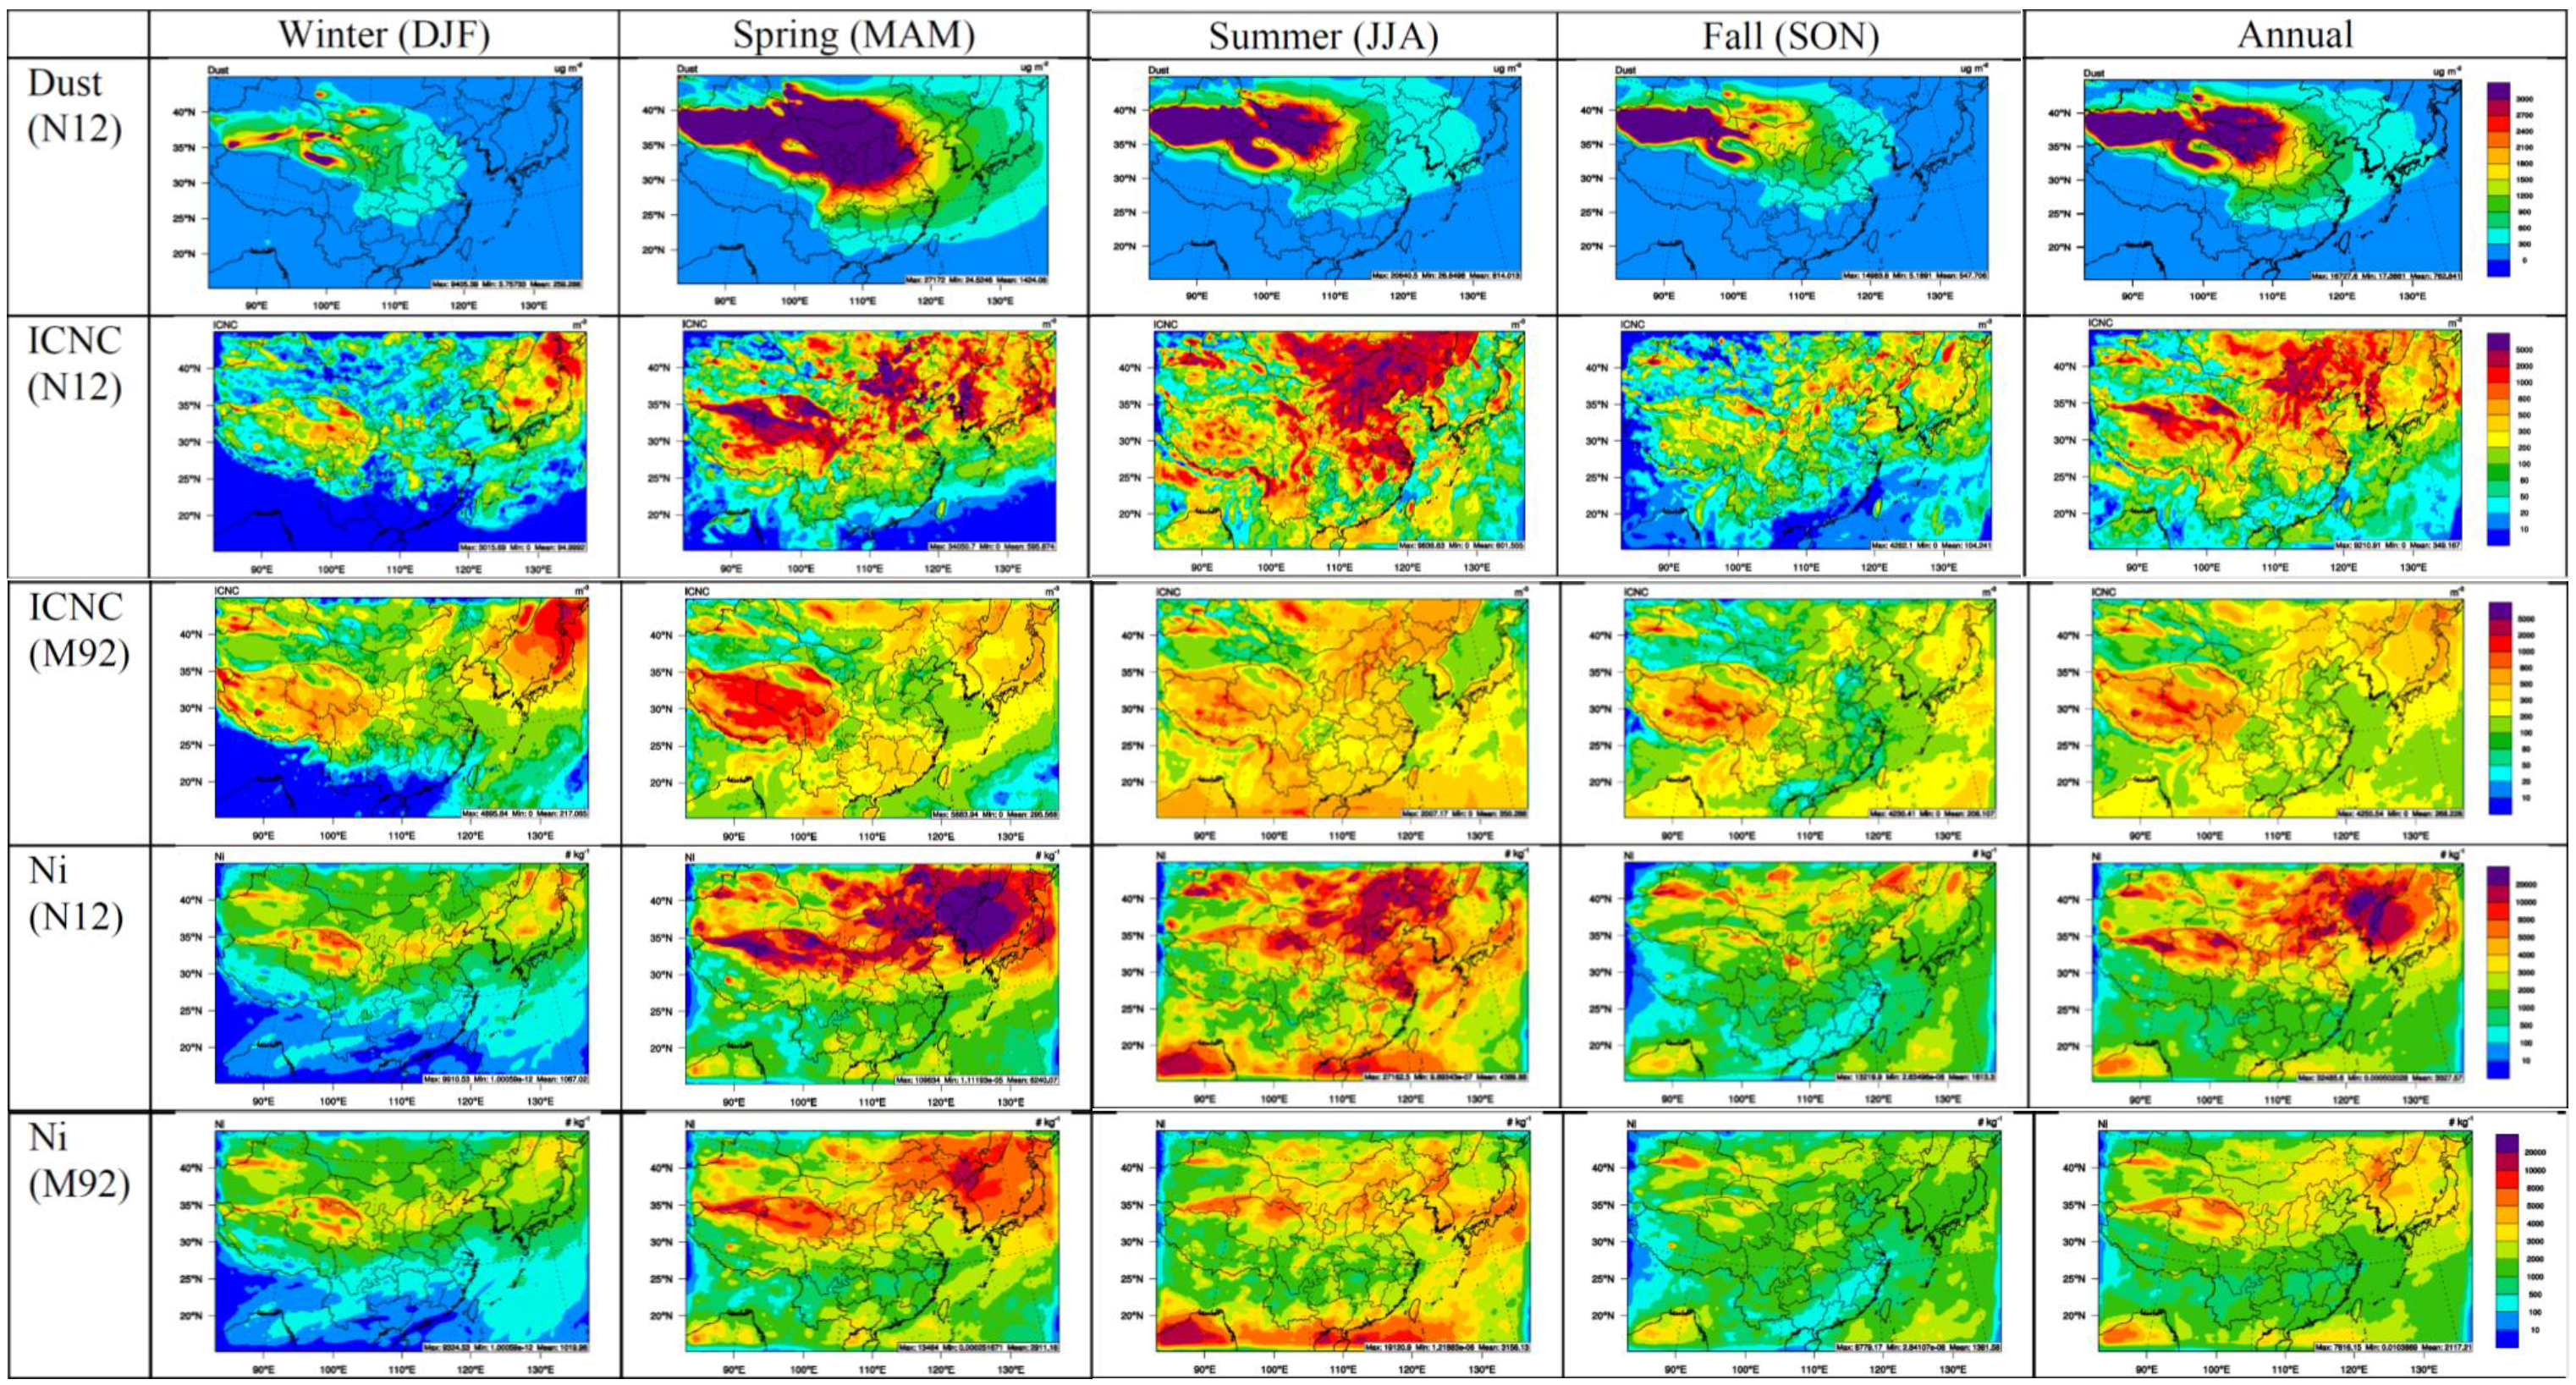
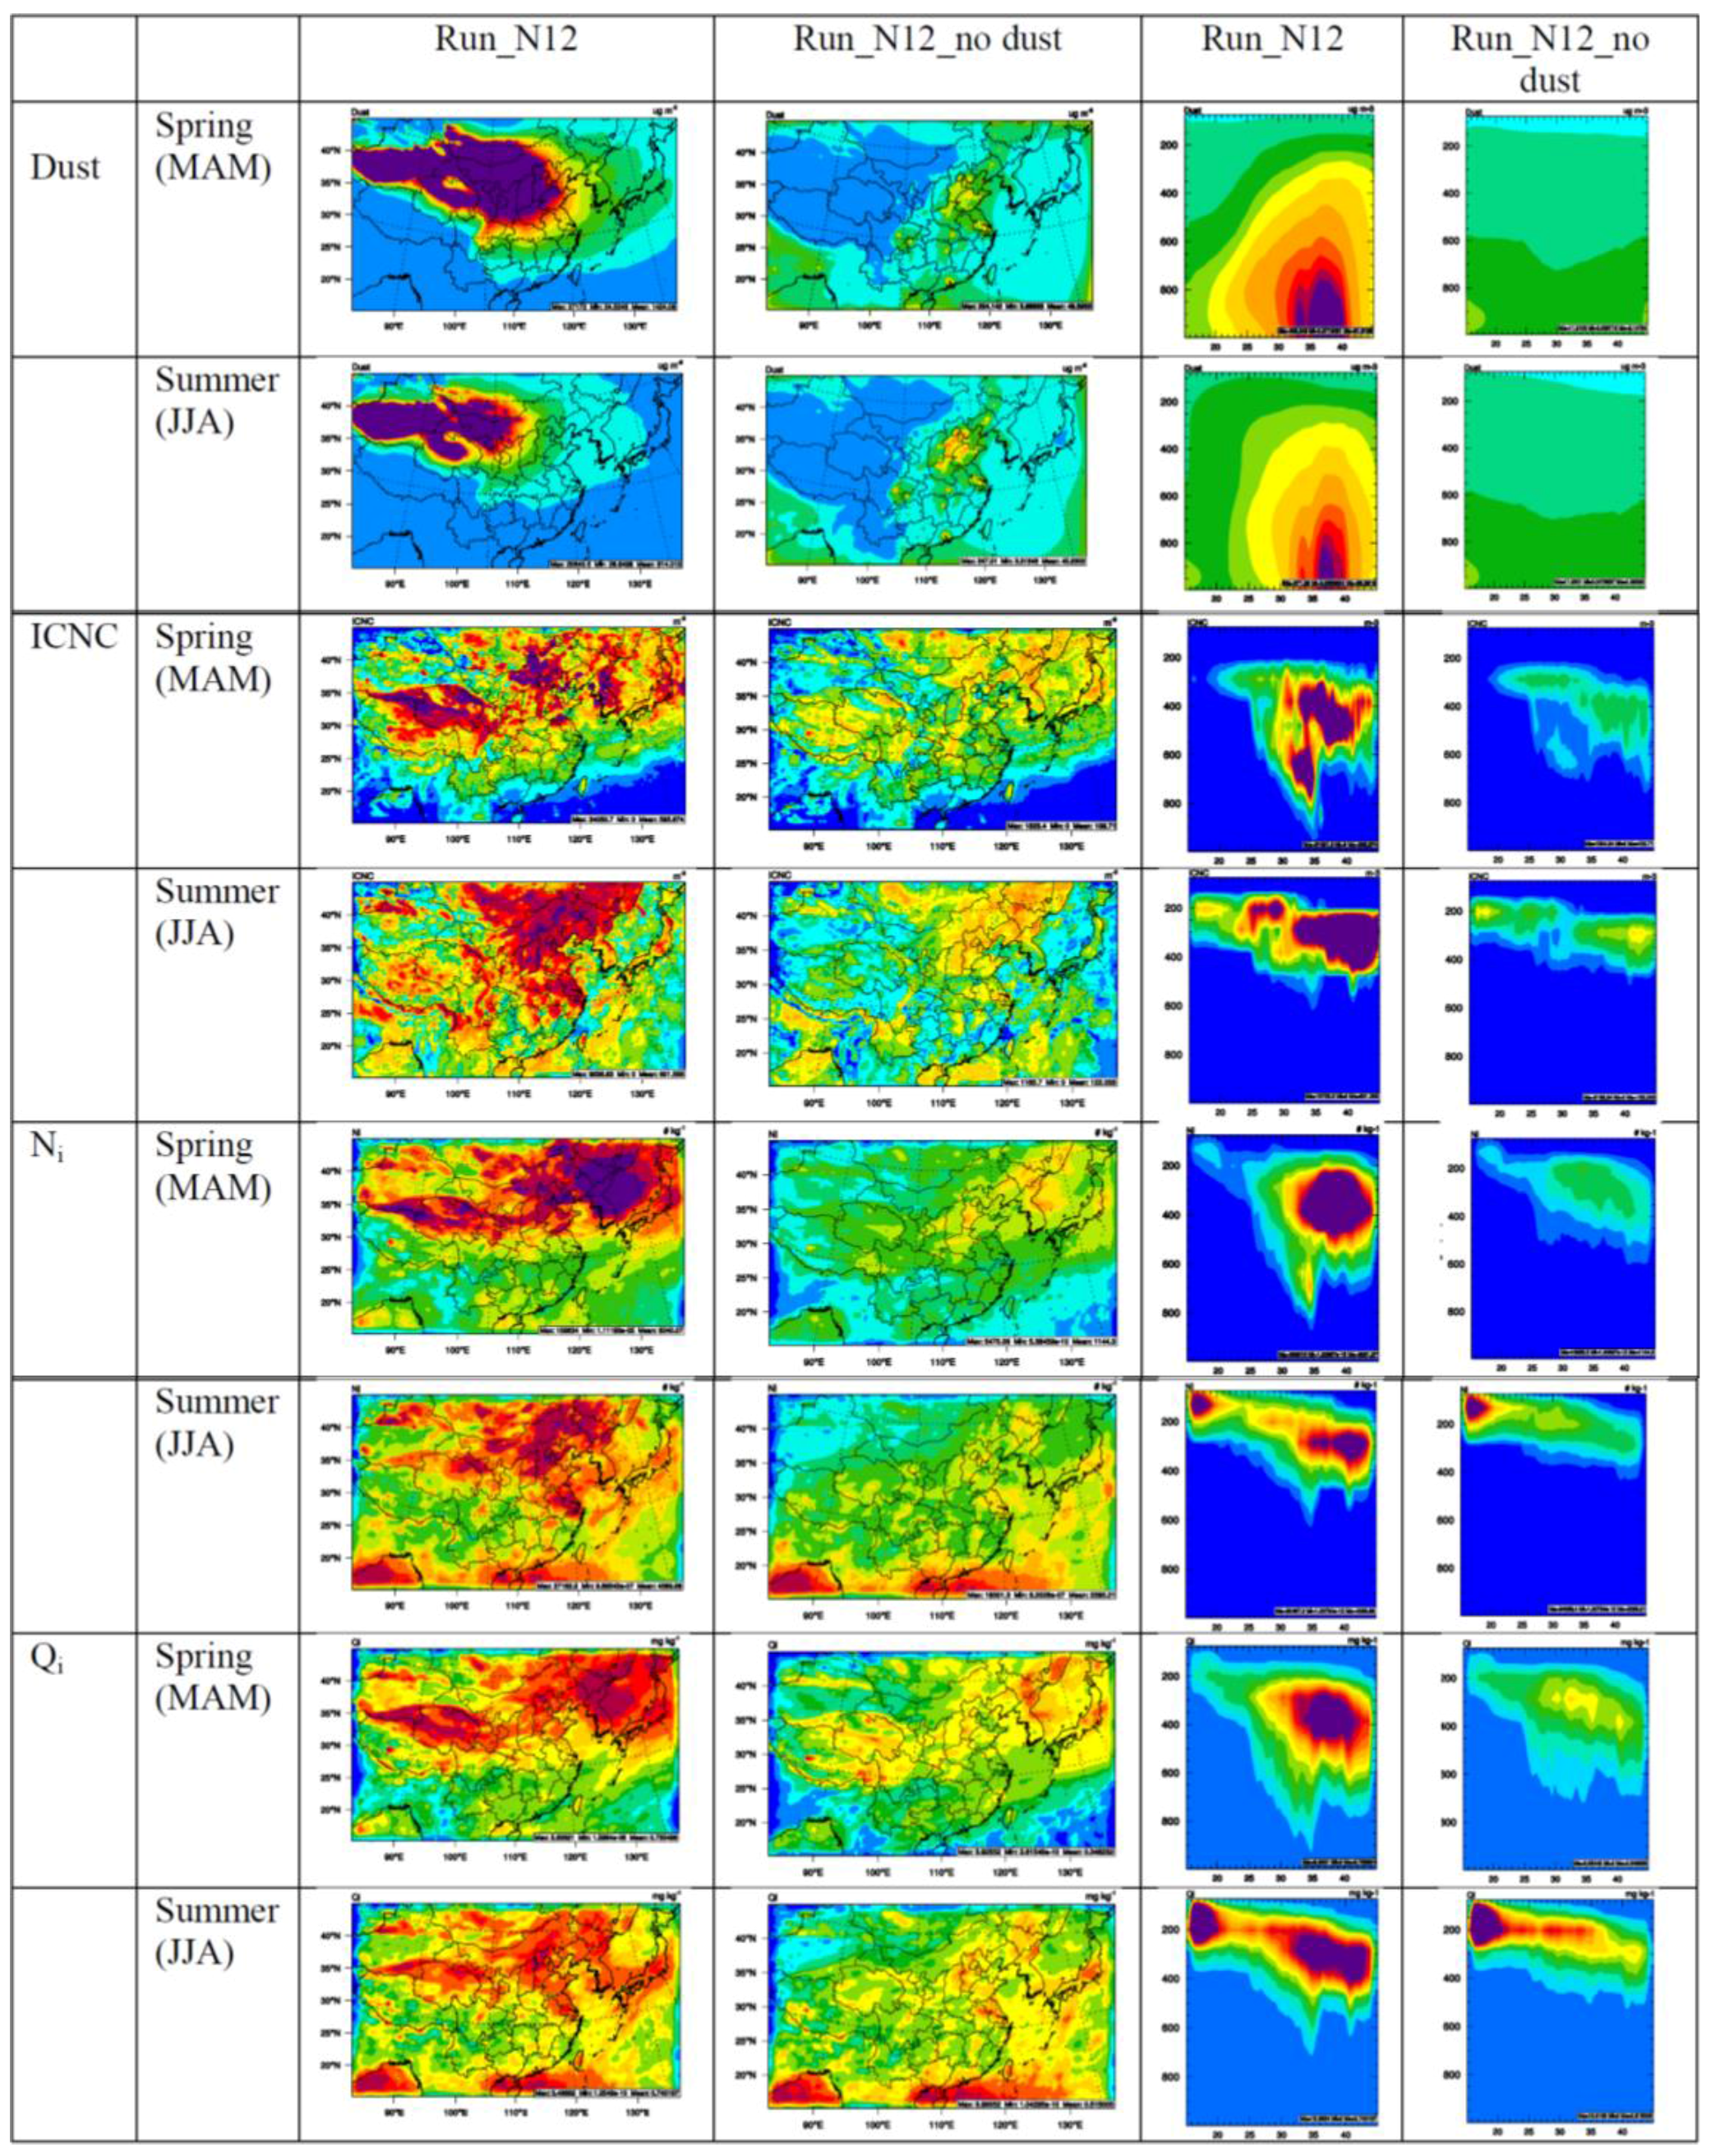
Figure 1 shows the spatial distributions of column concentrations of dust from Run_N12 (the column concentrations of dust from Run_M92 is very similar, thus not shown) and compares the spatial distributions of average values of nucleated ice crystal number concentration (ICNC) for the immersion freezing in mixed-phase cloud only and cloud ice number concentration (N
i) over all cloud layers. The results for 2011 are similar, and thus not shown. Dust concentrations are the highest in spring, followed by summer, fall, and winter. The dust source regions are located in northwestern China, and the dust plumes can travel eastward to Japan and western Pacific Ocean in spring and summer and southeastward to most southern provinces in Mainland China and Taiwan. Comparing with Run_M92, the ICNCs from Run_N12 in the northern domain are significantly higher (by 259.7 m
−3 (71.7%) in summer and by 310.4 m
−3 (101.6%) in spring) and an opposite trend is observed in the southern domain in spring and summer when dust and anthropogenic emissions are significantly lower. Run_N12 gives significantly higher ICNCs over the dust regions in the northern domain than Run_M92 due to the increase of dust emissions during spring. In the summer monsoon season (
i.e., June, July, and August), ICNCs from Run_N12 over land, especially in the polluted region, are also higher than those from Run_M92 as they are downwind of the dust plumes, whereas Run_N12 gives relatively lower ICNCs over the ocean than Run_M92. Since ICNCs in M92 only depend on the ice supersaturation, they are generally higher in the southern domain than the northern domain because of higher temperature, specific humidity, cloud fraction, and precipitation in all seasons (Figure not shown). This leads to higher net N
i from Run_N12 than Run_M92 by 47.1 and 231.7 kg
−1 or by 4.6% and 16.8% in winter and fall, respectively.
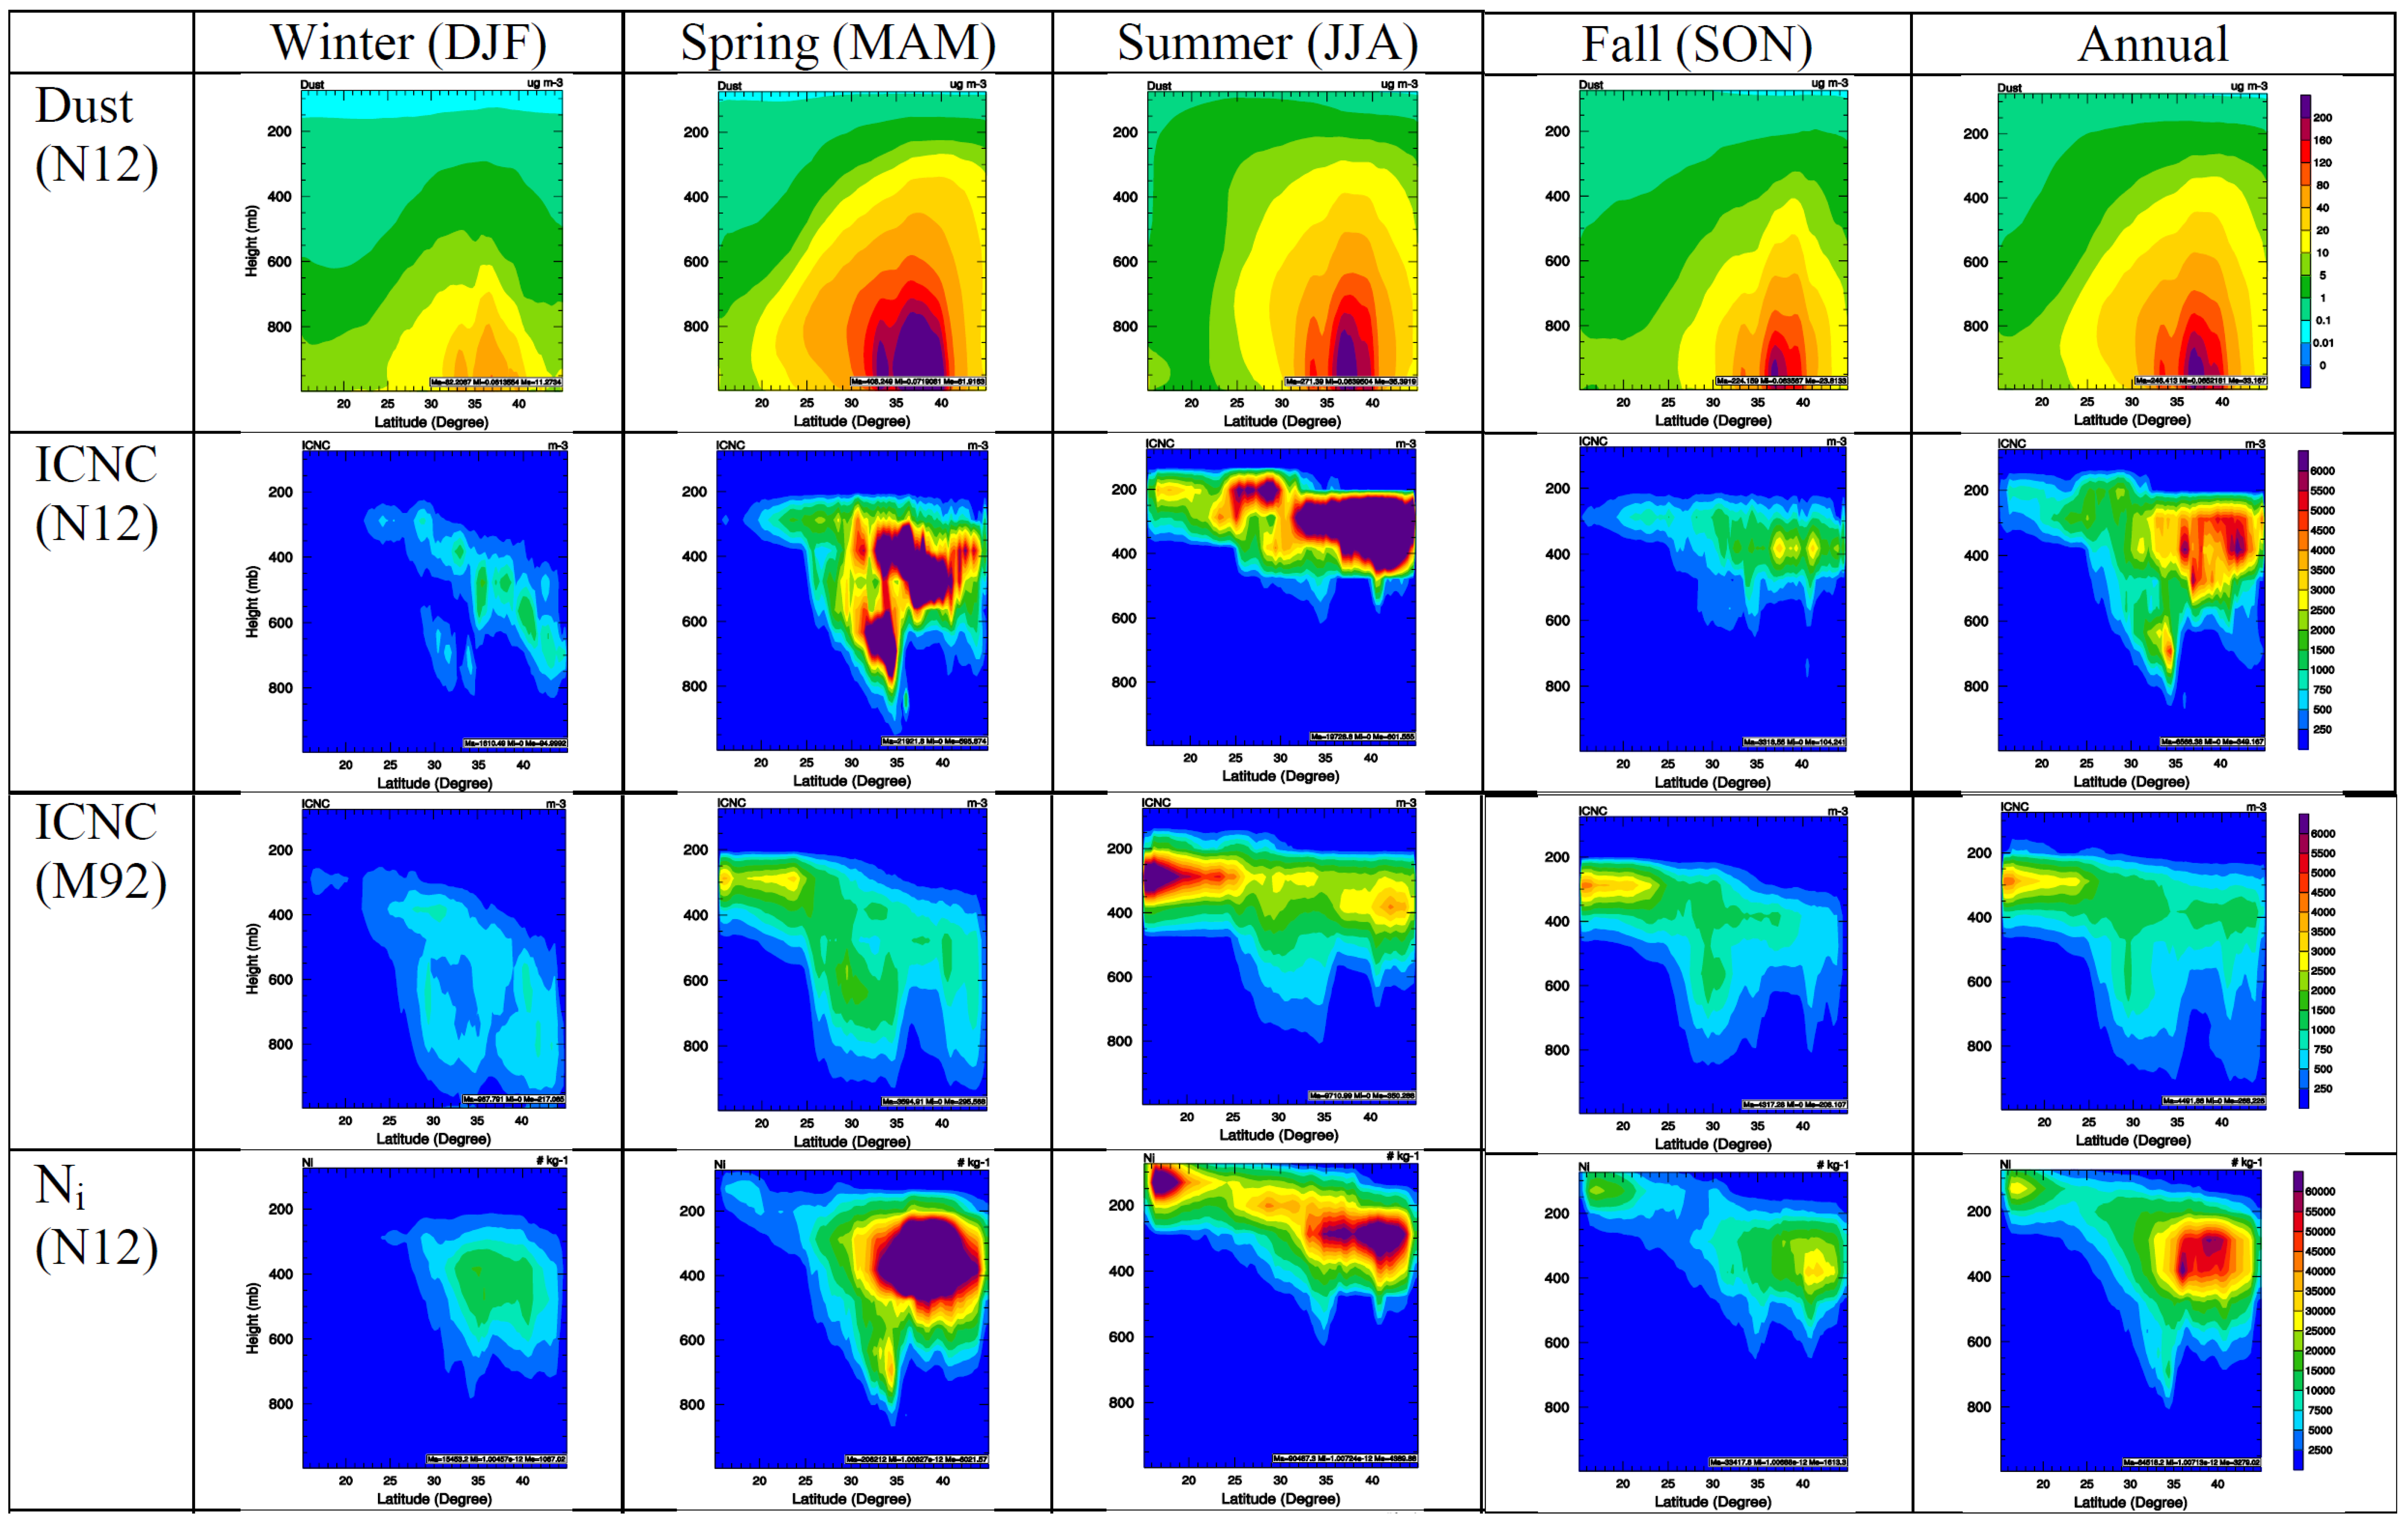
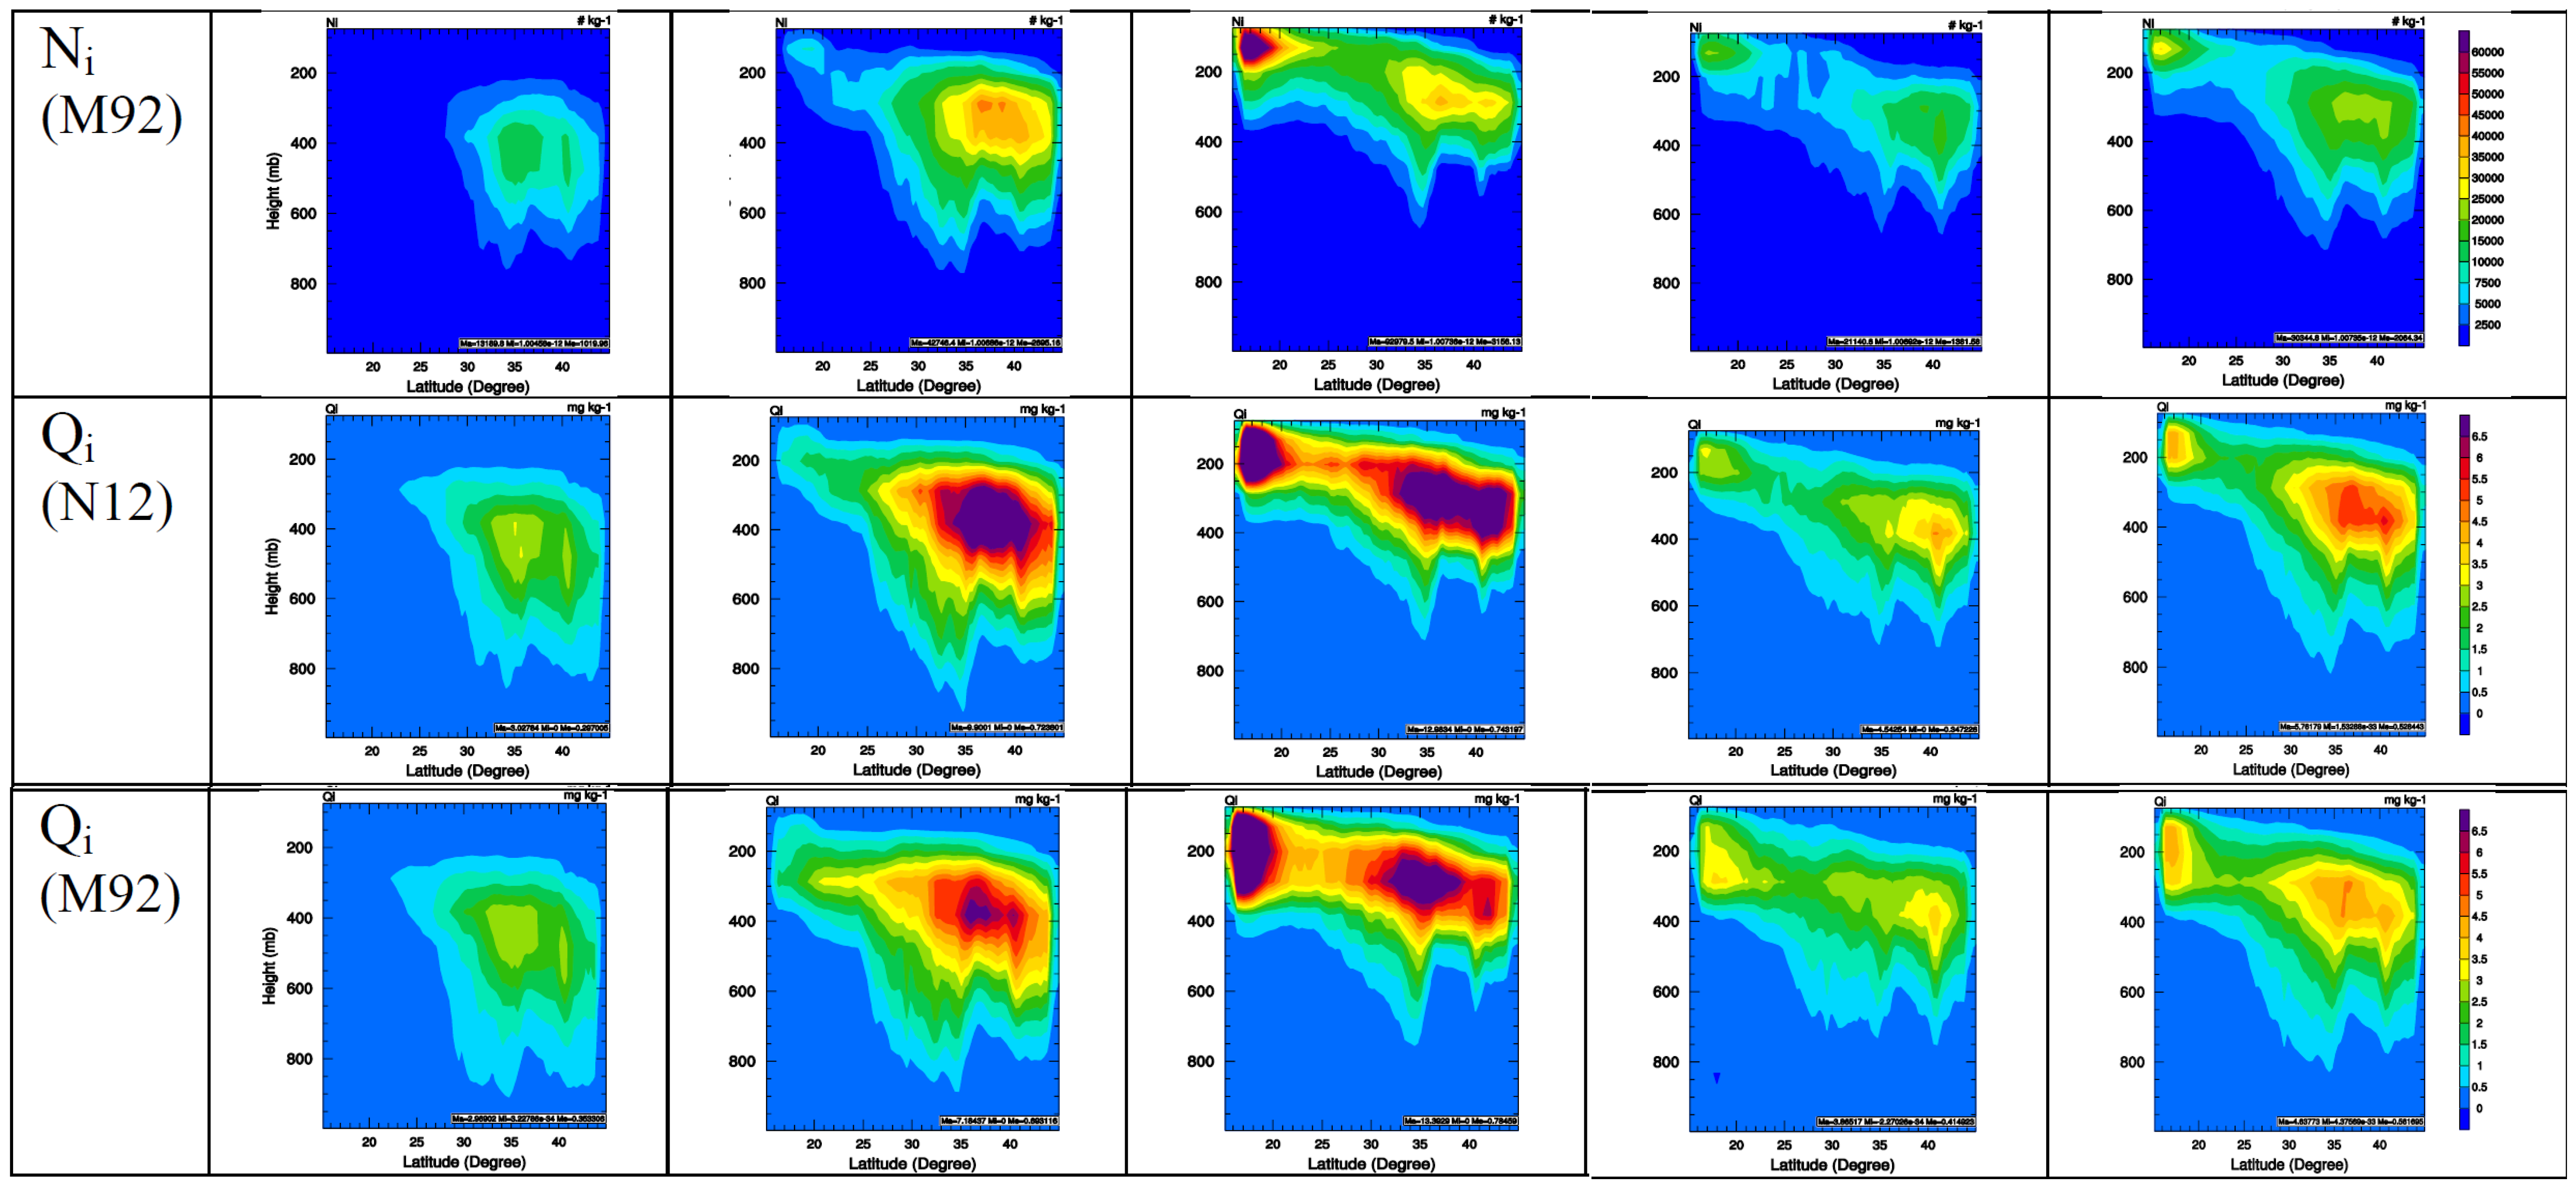
Figure 2 compares the zonal mean distributions of dust, ICNC, N
i, and Q
i over the vertical domain. ICNCs increase with height but are confined within the troposphere up to about 200 mb in all seasons, with significant changes particularly at higher latitudes where mixed-phase clouds dominate. Consistent with the spatial distributions of ICNCs shown in
Figure 1, in spring, ICNCs from Run_M92 over the low latitudes (<25°N) in the southern domain and between 200 and 400 mb are significantly larger (by factors of 2–4) than those from Run_N12. This is due to the different temperature dependencies in N12 and M92 and that Run_M92 gives higher ICNCs in the warmer atmosphere. By contrast, Run_N12 gives higher ICNCs (about factors of 2–6) than Run_M92 at middle latitudes (>30°N) in northern domain and between 200 and 800 mb where there are large mineral dust particles over the Asian deserts. This is mainly due to the consideration of dependencies on dust surfaces for the ICNC calculations by N12. In spring, the dust plume can move vertically to the model top (
i.e., 100 mb), for regions north of 25°N with concentrations reaching 1–10 µg·m
−3 above 300 mb and 0.1 µg·m
−3 above 200 mb. The spread of simulated ICNCs by Run_N12 in the vertical domain coincides with the zonal mean distributions of dust particles, indicating the importance of dust particles in IN formation through immersion freezing nucleation throughout the atmosphere. In summer, both Run_N12 and Run_M92 give high ICNCs at higher altitudes than in spring (
i.e., between 400 and 200 mb in summer, compared to 800–200 mb in spring) and spread to all latitudes for two main reasons. First, dust particles can be uplifted to a higher altitude in summer by stronger vertical mixing and turbulence than in spring, with concentrations of 1–10 µg·m
−3 above 300 mb particularly over regions south of 25°N. The relatively high dust concentrations of 1–5 µg·m
−3 throughout the atmosphere (from surface up to 100–200 mb) over the low latitudes provide sufficient dust surfaces for the formation of IN through immersion freezing nucleation. Second, the cold temperatures and high moistures needed for ice nucleation occur at higher altitudes in summer than in winter. This can be seen clearly from the zonal mean distributions of temperature and specific humidity (Figures not shown). Note that in the summer when deep convective clouds are dominant, the Ni above 200 mb where homogeneous freezing resides is significantly higher in Run_N12 compared with that in Run_M92, suggesting the enhanced homogenous aerosol freezing through L07 which might be due to enhanced convection in Run_N12 as a result of enhanced freezing and latent heat release in the mixed-phase clouds, which transports more water vapor to the upper levels. Similar to spring, the ICNCs from Run_M92 in summer and fall are higher than Run_N12 south of 0.25°N but lower than Run_N12 in the middle latitudes (>35°N) for the same reasons mentioned above. In winter when dust concentrations are the lowest compared to the rest of the year, the ICNCs from Run_M92 and Run_N12 are more similar in terms of magnitudes and zonal mean distributions, because ICNCs are mainly determined by supersaturation in M92 and by temperatures in N12. The annual mean zonal mean distributions of ICNCs are dominated by the seasonal mean distributions of ICNCs in spring and summer. Both Run_N12 and Run_M92 show similar strong seasonal variations, with the highest ICNCs in summer, followed by spring, fall, and winter.
Figure 1.
Spatial distributions of total dust concentrations over all model layers from the 2006 simulation with N12 (row 1) and spatial distributions of average values of ICNC and Ni over all model layers between simulations in 2006 with N12 and M92 (rows 2–5).
Figure 1.
Spatial distributions of total dust concentrations over all model layers from the 2006 simulation with N12 (row 1) and spatial distributions of average values of ICNC and Ni over all model layers between simulations in 2006 with N12 and M92 (rows 2–5).
Figure 2.
Zonal mean distributions of dust for the 2006 simulations with N12 (row 1) and zonal mean distributions of ICNC, Ni, and Qi for the 2006 simulations with N12 and M92 (rows 2–7) over the vertical domain.
Figure 2.
Zonal mean distributions of dust for the 2006 simulations with N12 (row 1) and zonal mean distributions of ICNC, Ni, and Qi for the 2006 simulations with N12 and M92 (rows 2–7) over the vertical domain.
Similar to the spatial distributions of ICNC, N
i is higher in the northern domain by Run_N12 but in the southern domain by Run_M92 (
Figure 1). The spatial distributions of N
i from Run_M92 and Run_N12 are similar although their magnitudes from Run_N12 are larger (by 47.1–3326.4 kg
−1 or 4.6%–123% for seasonal means and by 1214.7 kg
−1 or by 58.8% for annual mean) than those from Run_M92, particularly in spring (see
Figure 1 and
Figure 2). The differences of N
i between the two simulations are consistent with the differences of ICNCs between the two simulations in all seasons and annually. For example, in winter, spring, and fall, Run_N12 gives significantly higher N
i over the northern domain and significantly lower N
i over the southern domain. In the monsoon season (summer), the simulated N
i from Run_N12 is relatively higher over land but relatively lower over ocean than that from Run_M92. As shown in
Figure 2, in general, N
i increases with height and latitude in all seasons but exhibits strong seasonal variations in both simulations. In winter, Run_N12 gives relatively higher N
i over the middle latitudes (>30°N). In spring, especially in April, the N
i from Run_N12 is larger than that from Run_M92 for altitudes below 800 mb, corresponding to the significant increase of ICNCs due to increased dust concentrations at the same heights. In the monsoon season, more ice is found in the upper troposphere at the low latitudes (<20°N) from both simulations. Comparing to lower latitudes, the height of maxima of N
i decreases at higher latitudes in the monsoon season, which is due likely to the weaker deep convection, lower temperature, and lower cloud top height. The variation of the upper height of the ice crystal band is associated with the seasonal variation of tropopause. In the monsoon season, although the magnitudes of N
i from Run_M92 and Run_N12 at low latitudes (<20°N) are comparable, Run_M92 gives higher N
i at lower altitudes (400–300 mb) than Run_N12. Such differences are associated with more ice from Run_M92 over ocean, mainly due to the moister environment. In fall, Run_N12 gives comparable N
i in terms of magnitudes over the low latitudes (<20°N), and higher N
i over the middle latitudes (>35°N) compared with Run_M92. Despite similar strong seasonal variations, the differences in the magnitude of N
i between the two simulations are noticeable. In general, more ice from Run_ N12 exists at higher latitudes and lower altitudes, which is consistent with the differences of ICNCs between the two simulations.
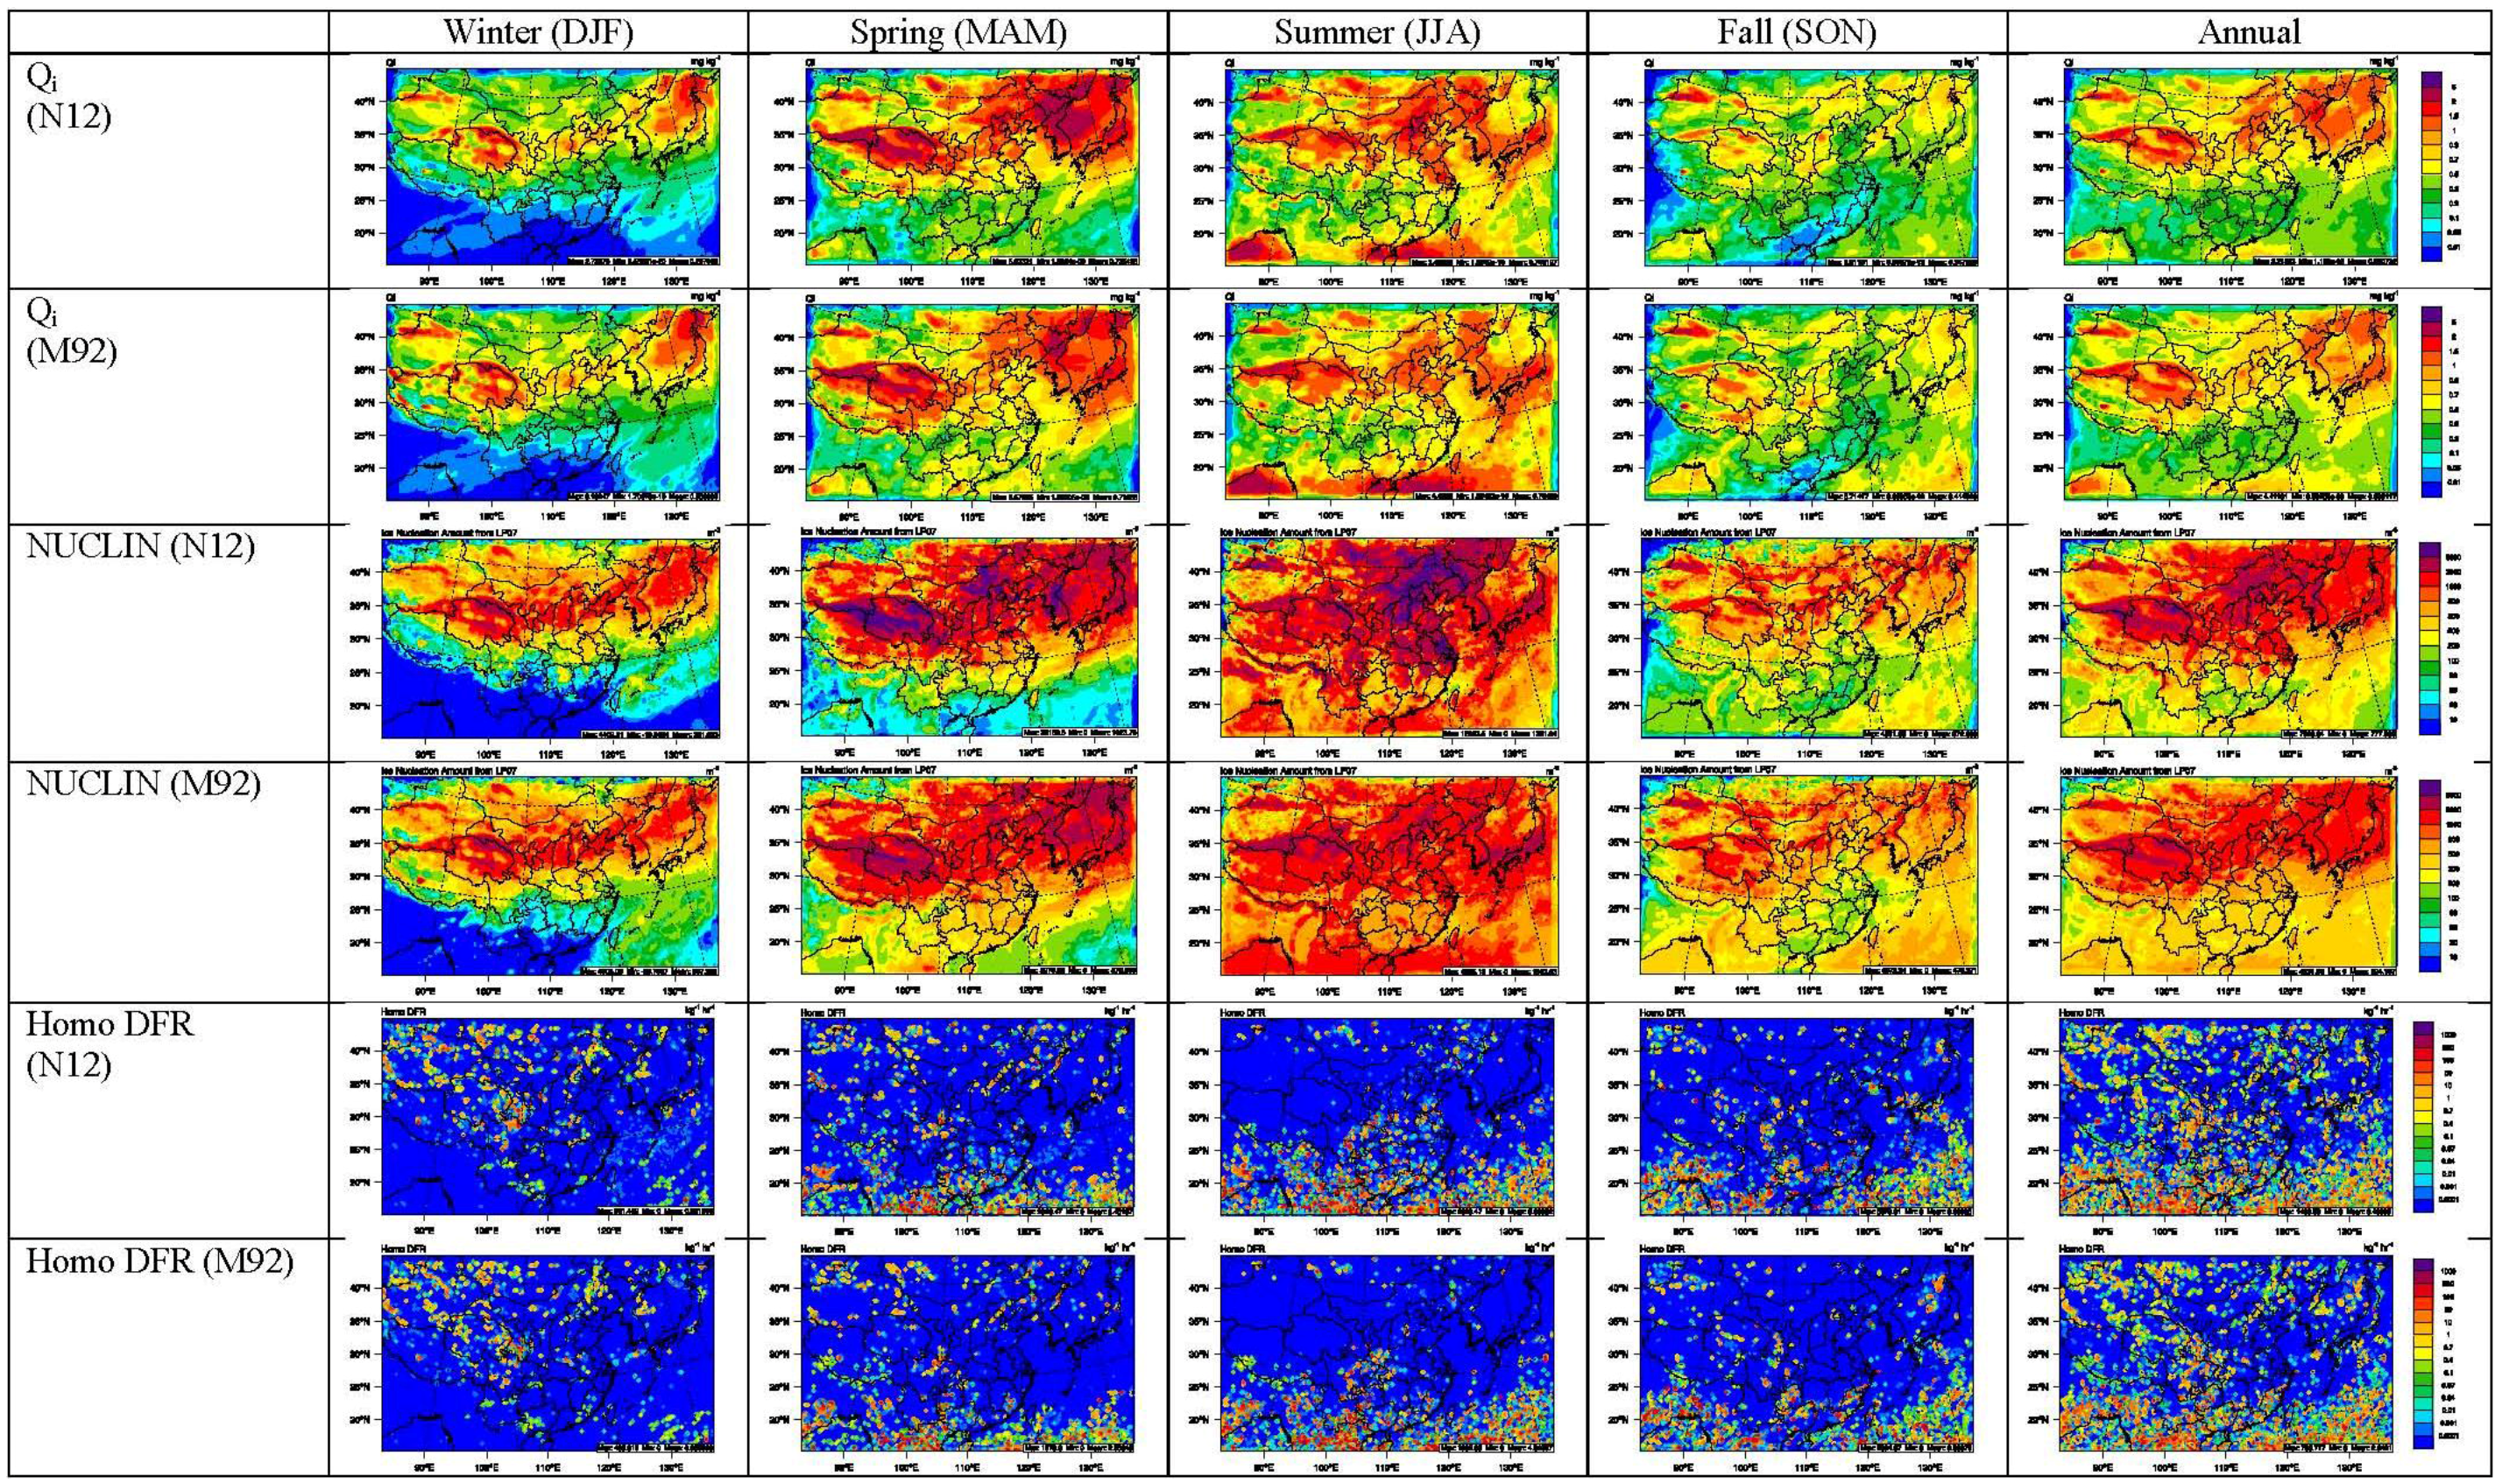
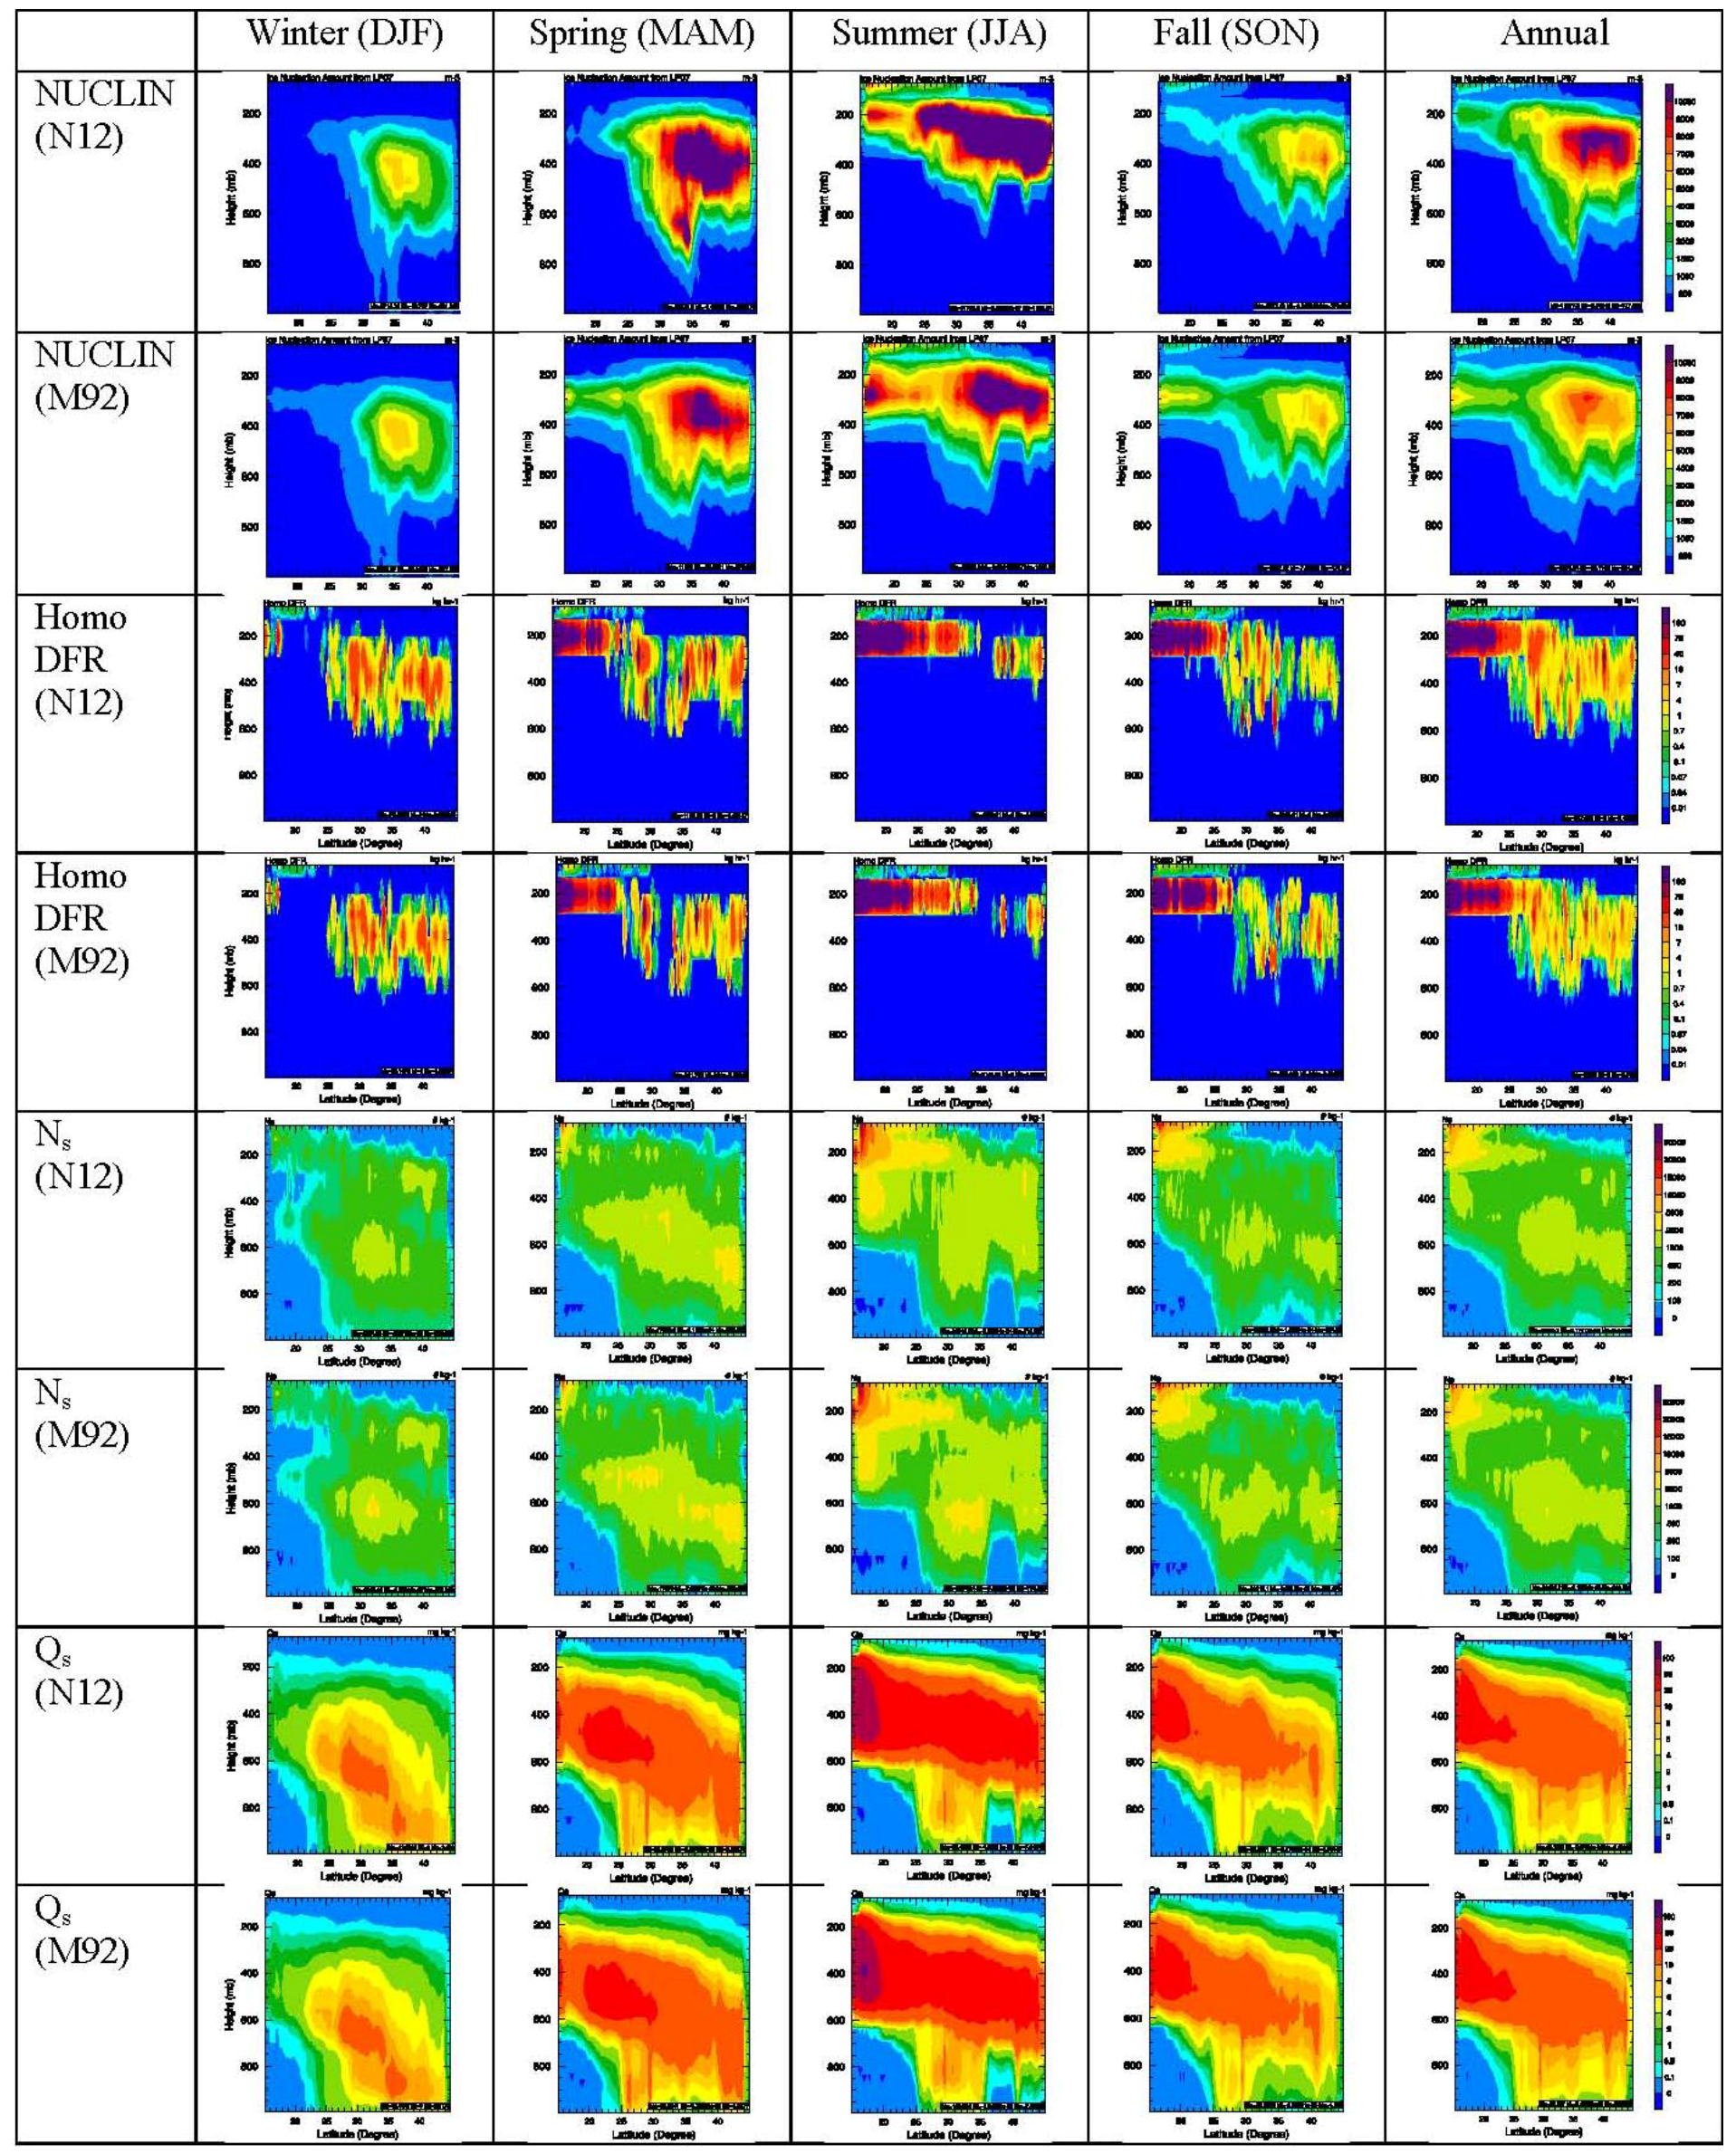
Figure 3 shows the spatial distributions of average values of ice mixing ratio (Q
i), the ice nucleation rate simulated by L07 (NUCLIN, which includes both homogeneous and heterogeneous ice nucleation rates), and homogeneous droplet freezing rate (Homo DFR) over all model layers simulated by Run_N12 and Run_M92 for 2006. Small ice crystals grow via deposition, rimming and aggregation to larger ice particles (
i.e., cloud snow) after they form. In the mixed-phase regime, more ice crystals lead to stronger WBF process as ice deposition is enhanced at the expense of droplet evaporation. As shown in
Figure 3, Q
i is higher in Run_N12 in the northern domain than Run_M92, but the opposite in the southern domain in spring and summer, consistent with the spatial distributions of ICNCs and N
i from both simulations. As a result, Run_N12 gives lower Q
i seasonal mean values (by 0.04–0.07 mg·kg
−1 or by 5.5%–16.3%) except for spring and lower annual means (by 0.03 mg·kg
−1 or by 5.9%) in 2006. For 2011 simulations, Run_N12 gives lower seasonal mean values (by 2.2%–24.9%) and annual mean value (by 12.9%) than Run_M92. The zonal mean distributions of Q
i in
Figure 2 are also consistent with those of ICNCs and N
i. Q
i increases with height and latitude in all seasons in both simulations. The variation of the upper boundaries of Q
i is consistent with the seasonal variation of tropopause. More ice crystals are produced by N12 at the middle latitudes (>25°N), where large amounts of dust are emitted. This is because the increase of IN concentrations due to the presence of large amount of dust particles in the northern domain enhances the Bergeron–Findeisen process in mixed-phase clouds, leading to a larger conversion rate from cloud liquid to ice/snow. Noticeably higher Q
i from Run_M92 than Run_N12 is found in the low latitudes (<20°N), which is associated with more N
i from Run_M92 than Run_N12 in this region.
Different heterogeneous INPs also influence other processes, which in turn affect N
i and N
s. As shown in
Figure 3, NUCLIN from Run_N12 is higher than that from Run_M92 in spring and summer when dust concentrations are the highest but lower than that from Run_M92 in winter and fall in 2006 (with a net increase by 85.9 m
−3 or 12.0% for annual mean value from Run_N12 compared to Run_M92), indicating a large impact of N12 and M92 on the ice nucleation rates through homogeneous and heterogeneous freezing for cirrus clouds by L07, particularly in North and Northwest China. Similar differences occur in the zonal mean distributions of NUCLIN shown in
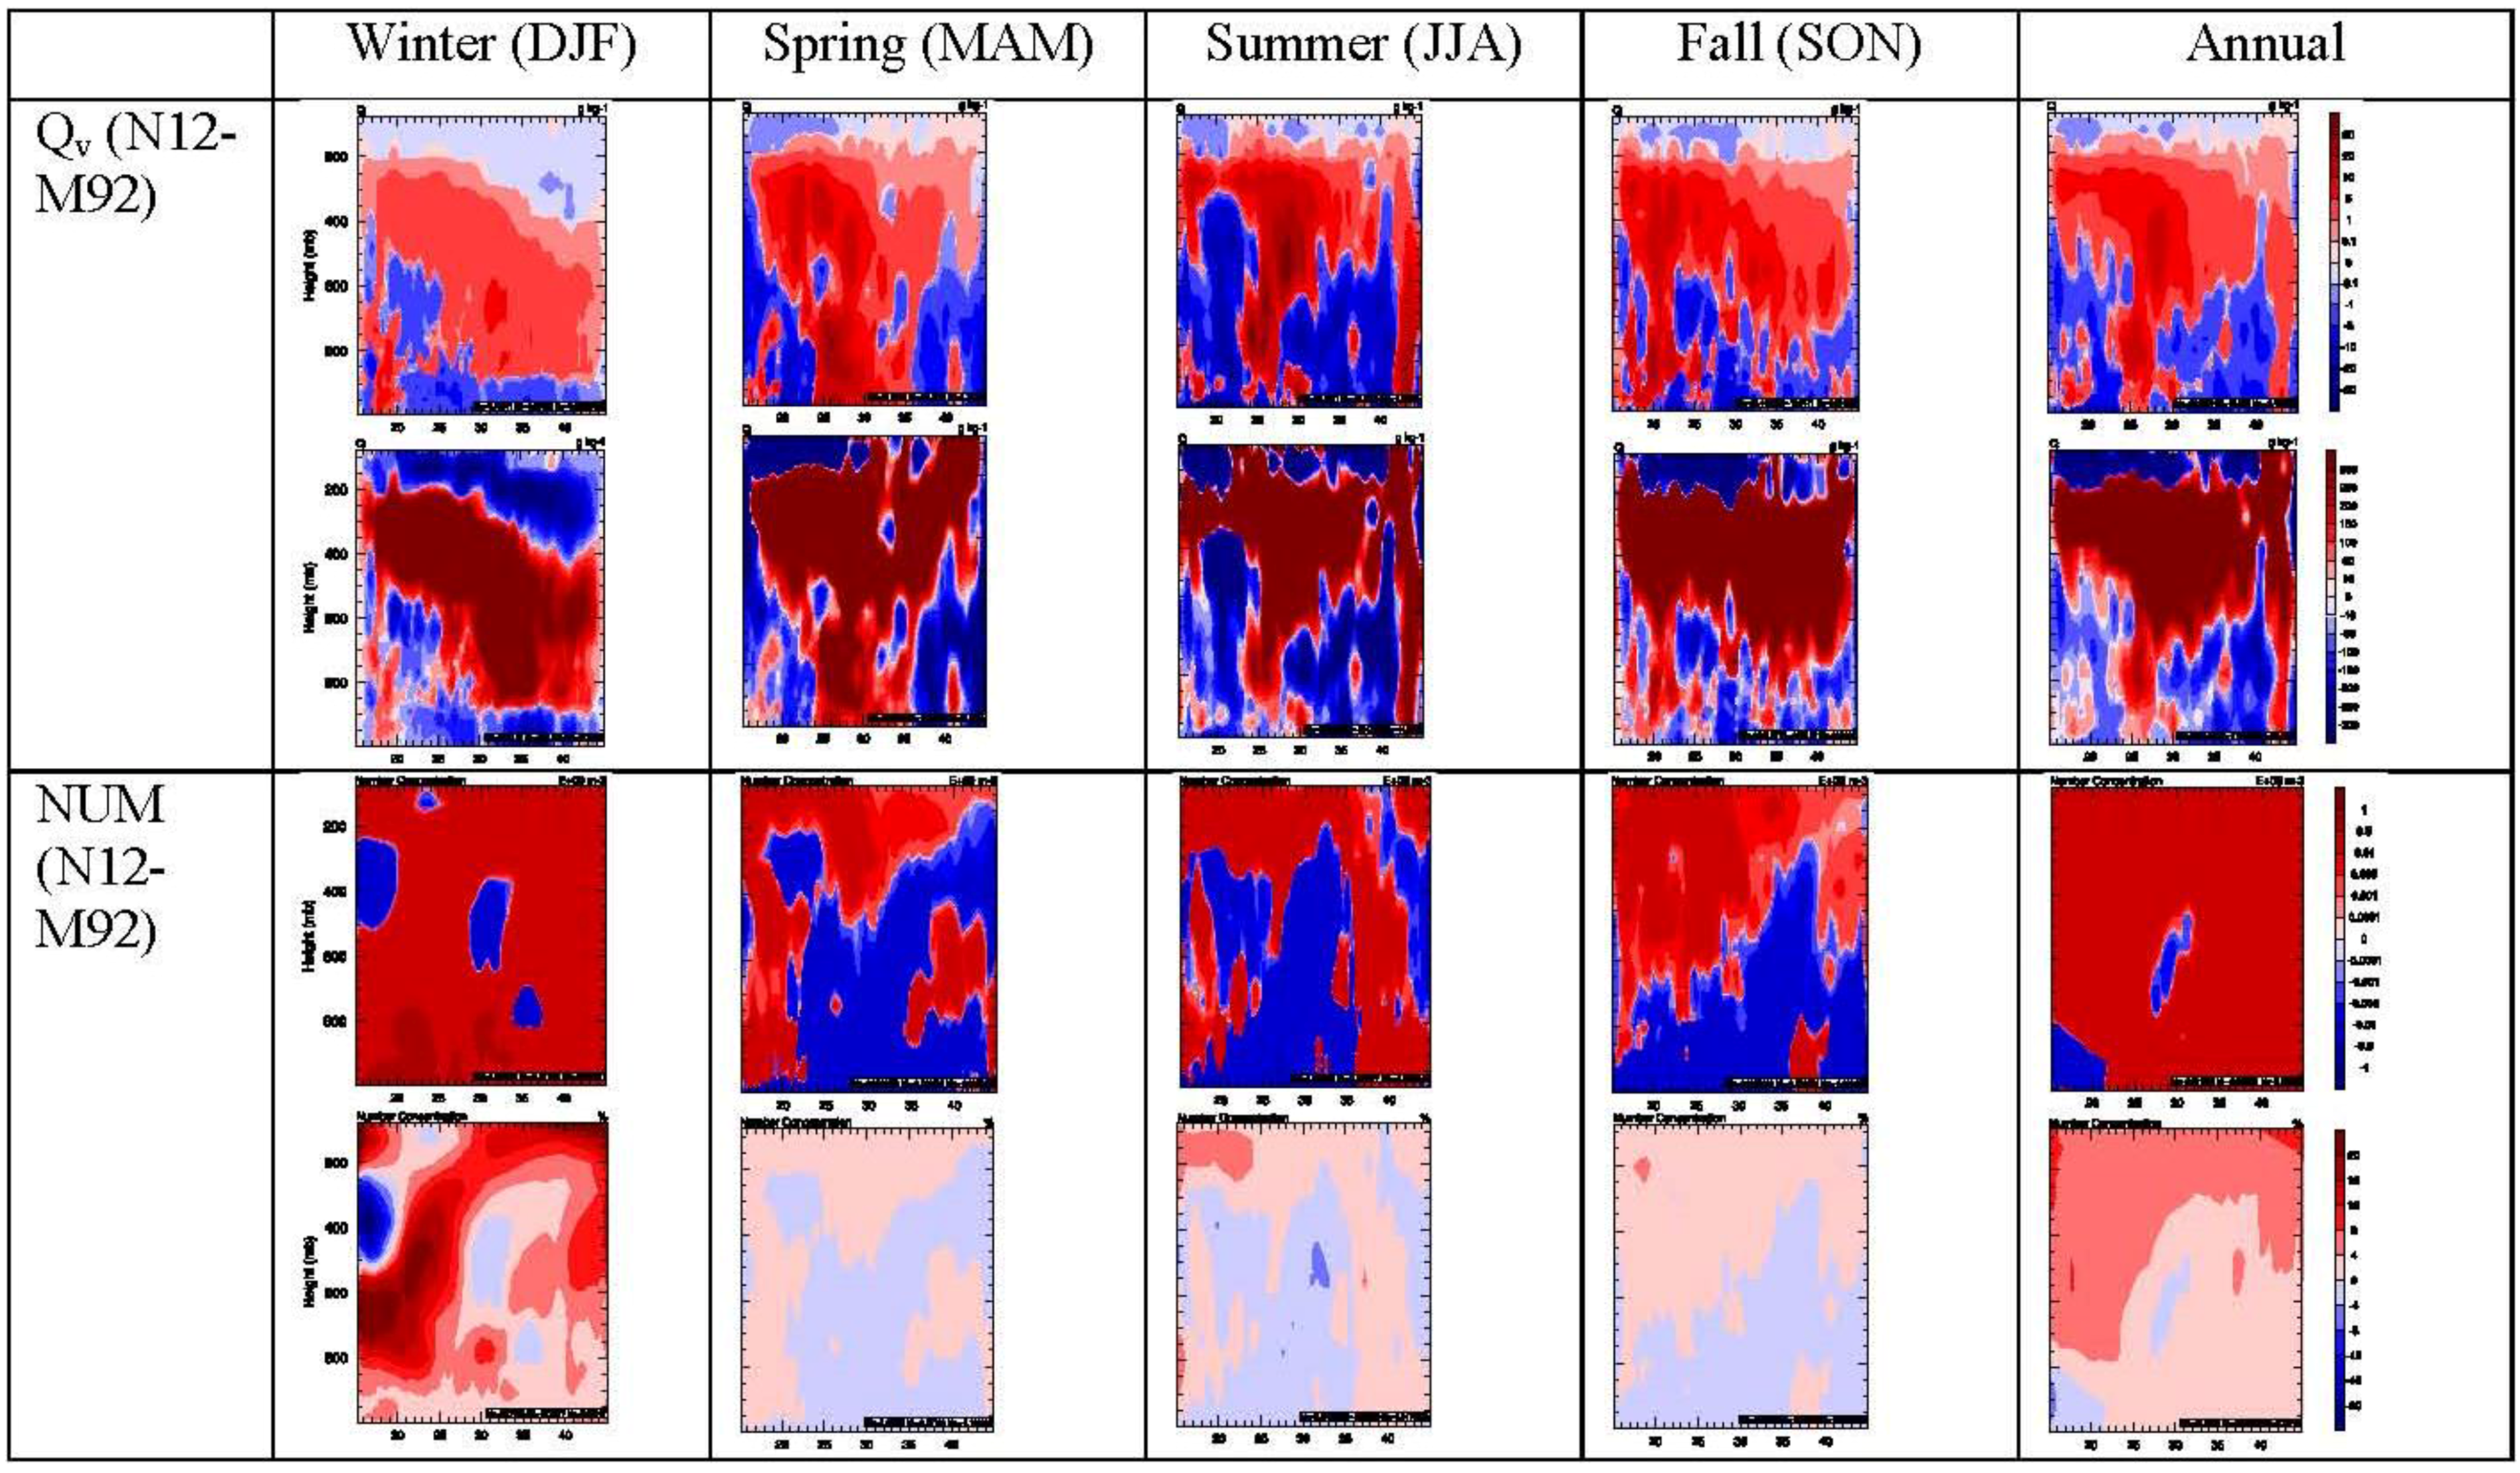
Figure 4, with a net increase in annual mean values of NUCLIN by Run_N12 relative to Run_M92, particularly in the upper levels (>600 mb). The enhanced ice nucleation in the cirrus clouds in Run_N12 is mainly caused by the much-increased water vapor, Q
v (see
Figure 5a). Although increasing aerosol concentrations could lead to larger ice nucleation through L07, the slightly increased aerosol number concentrations at the upper levels (see
Figure 5b) may be associated with the increased water vapor as well, which enhances aerosol nucleation. The larger ice concentrations in the mixed-phase enhance the conversion of liquid to ice (
i.e., WBF process), which would enhance latent heat release and then convection, leading to larger transport of water vapor to the upper-levels. Convection can also be enhanced because the larger ice nucleation rate in the mixed-phase glaciates the clouds much faster, leading to faster dissipation of clouds, which in turn increases SW at the surface and leads to stronger convection.
Compared to Run_M92, Run_N12 gives similar spatial distributions but higher magnitudes of Homo DFR in the southern region where N12 gives lower ice nucleation in the mixed-phase regime, suggesting the competition between homogenous and heterogeneous freezing in deep convective clouds. It can be seen clearly that the Homo DFR is much lower in South China in spring and summer in Run_M92, due to much higher heterogeneous freezing in the mixed-phase regime, which reduces droplets being transported to the heterogeneous freezing regimes in deep convective clouds. The zonal mean distributions of Homo DFR in
Figure 4 also show lower values in Run_M92 than in Run_N12. By contrast, as shown in
Figure 4, the impact of heterogeneous INPs on N
s and Q
s is much smaller. Comparing to Run_M92, Run_N12 gives lower N
s by 21.1–34.4 kg
−1, or 2.9%–6.3% for domain seasonal mean values and by 27.3 kg
−1, or 5.0% for annual mean value, and lower Q
s by 0.08–0.29 mg·kg
−1, or 2.1%–4.0%, for domain seasonal mean values and by 0.16 kg
−1, or 3.0%, for annual mean value. As shown in
Figure 4, there are small differences in zonal mean distributions of N
s and Q
s between Run_N12 and Run_M92.
Figure 3.
Spatial distributions of average values of Qi, NUCLIN, and Homo DFR over all model layers between simulations in 2006 with N12 and M92.
Figure 3.
Spatial distributions of average values of Qi, NUCLIN, and Homo DFR over all model layers between simulations in 2006 with N12 and M92.
Figure 4.
Zonal mean distributions of NUCLIN, Homo DFR, Ns, and Qs for the 2006 simulations with N12 and M92 over the vertical domain.
Figure 4.
Zonal mean distributions of NUCLIN, Homo DFR, Ns, and Qs for the 2006 simulations with N12 and M92 over the vertical domain.
Figure 5.
Absolute and percentage differences of zonal mean distributions of Q and aerosol number concentrations for the 2006 simulations with N12 and M92 over the vertical domain.
Figure 5.
Absolute and percentage differences of zonal mean distributions of Q and aerosol number concentrations for the 2006 simulations with N12 and M92 over the vertical domain.
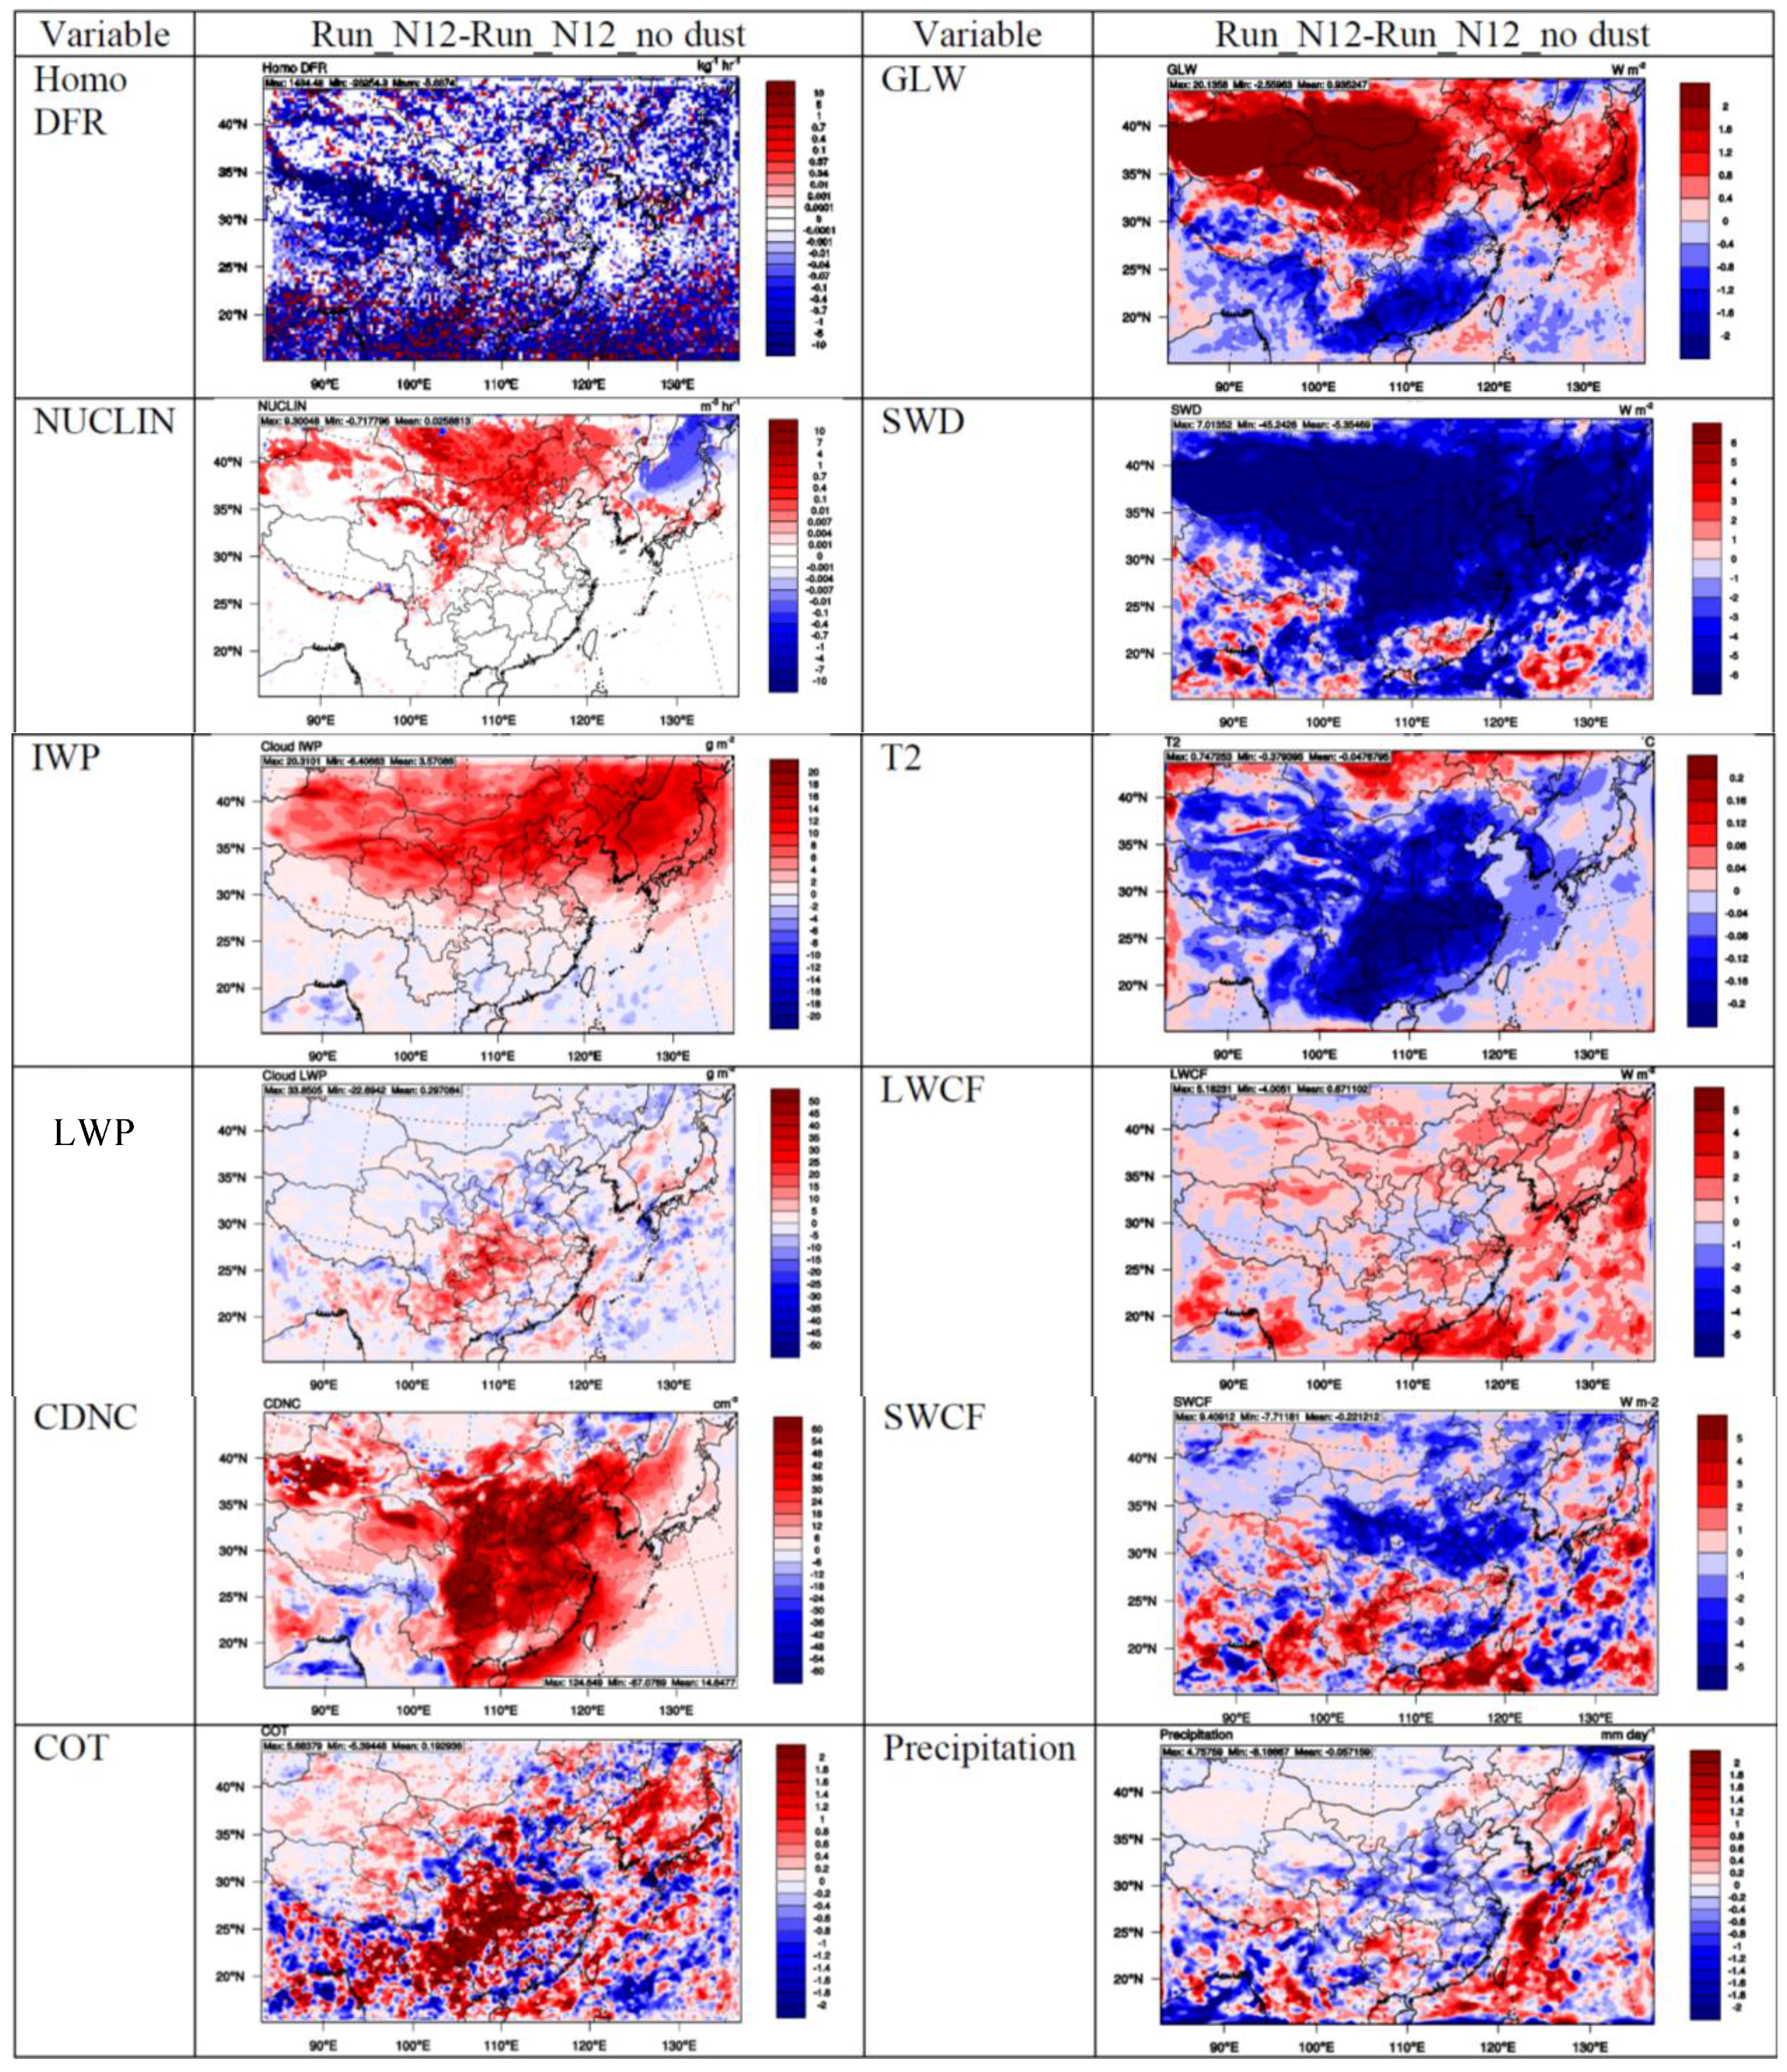
As described in the “glaciation indirect effect” of ice nucleation through the WBF process, the change of ICNC affects cloud phases, which has a large impact on radiation and precipitation by changing the cloud properties (e.g., cloud liquid water content, cloud ice content, cloud albedo, cloud amount, and cloud lifetime). The change of precipitation and radiation will in turn impact the concentrations/mixing ratios of chemical species and temperature, respectively. The ICNCs will be affected by the feedbacks of chemical species and temperatures to meteorological processes including cloud formation.
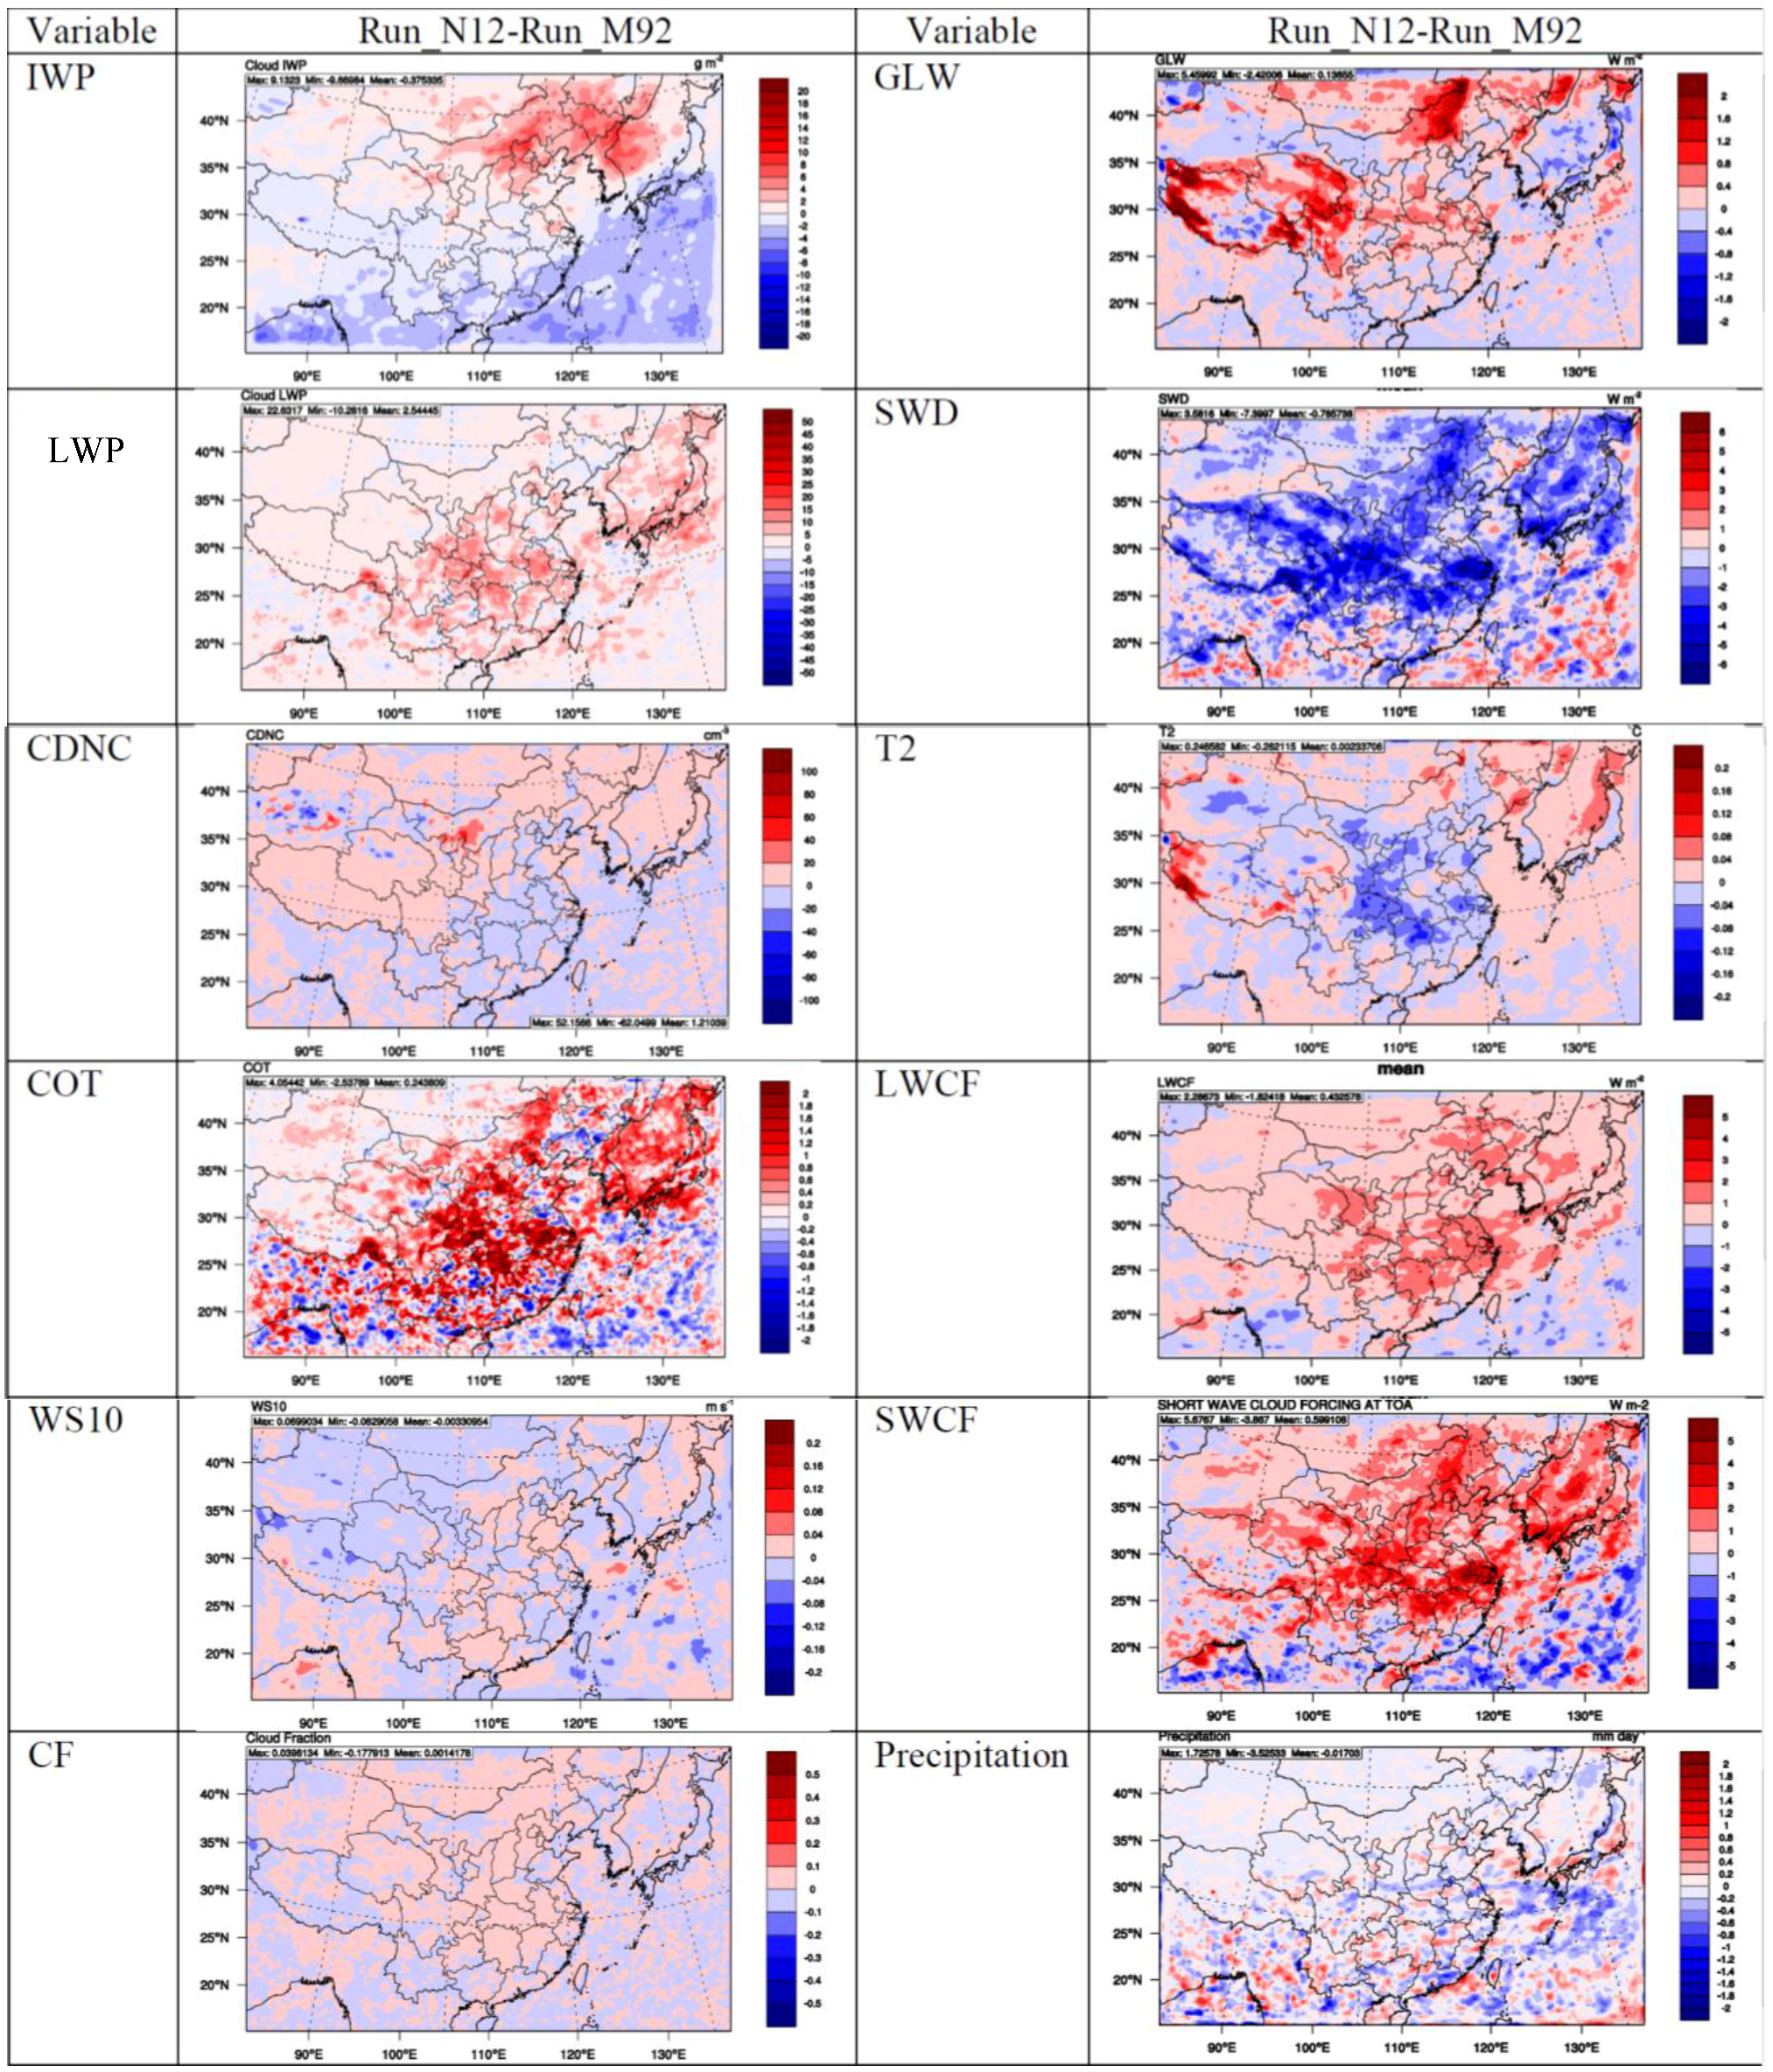
Figure 6 shows the differences in meteorological, radiative, and cloud variables between Run_N12 and Run_M92. The increases in ICNCs and N
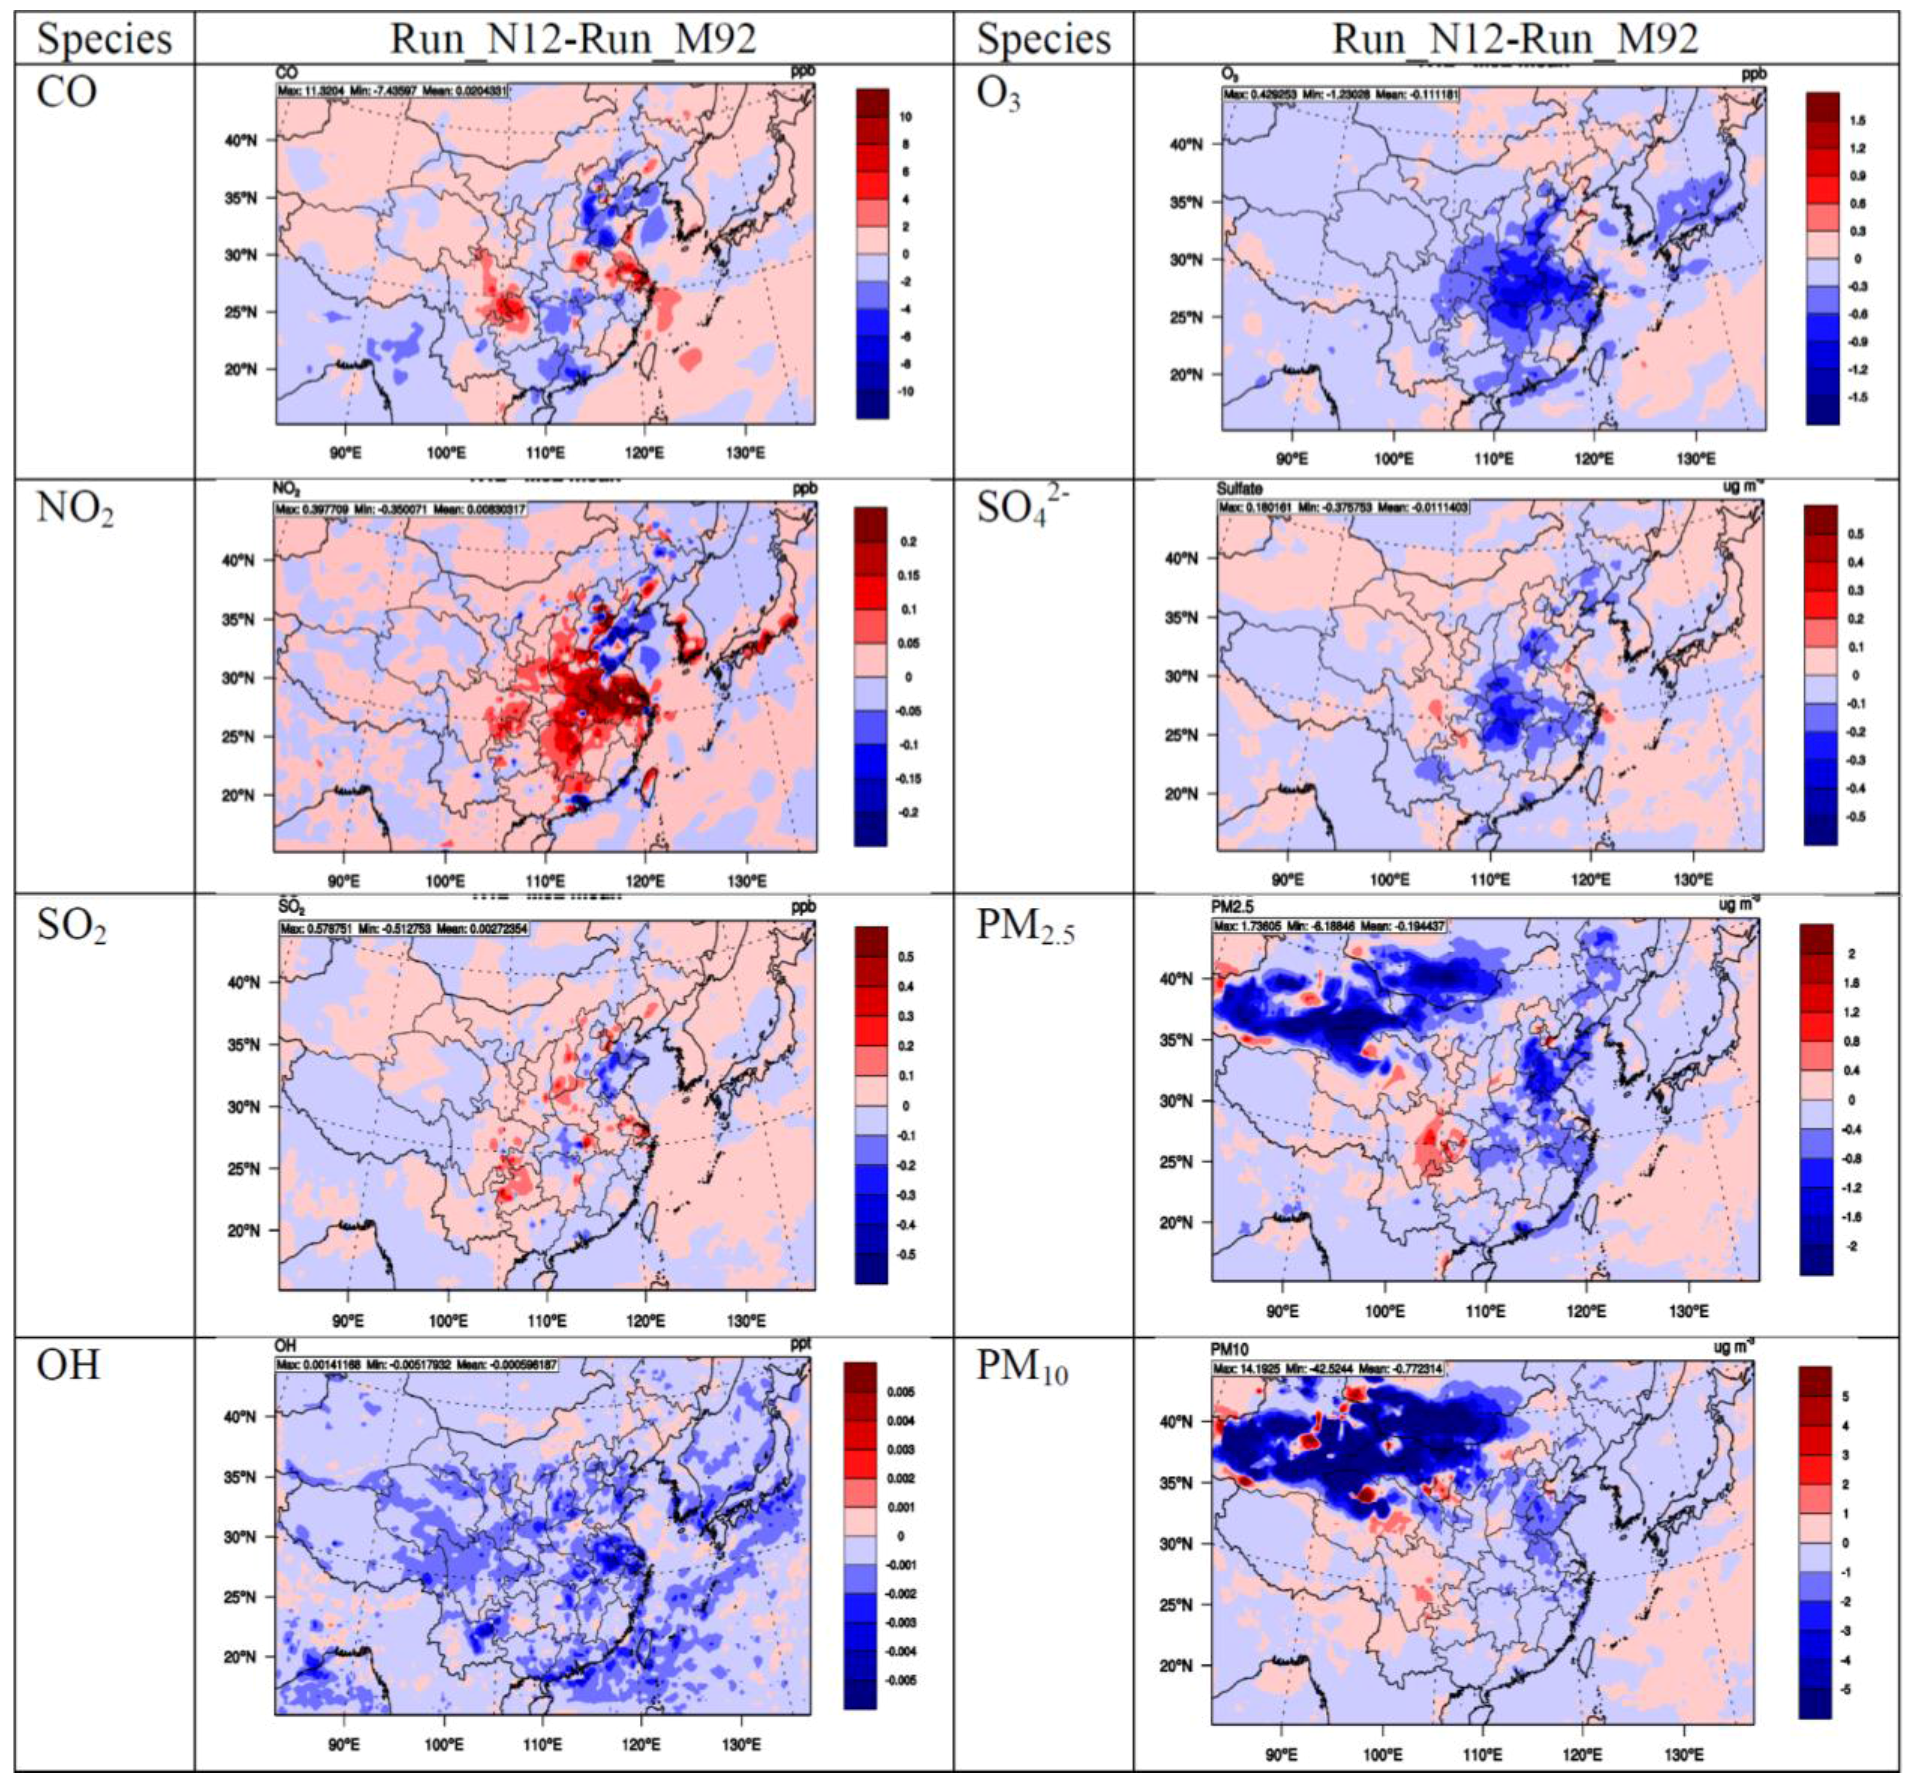
i increase domainwide downward longwave radiation (GLW), cloud droplet concentration (CDNC), cloud fraction (CF), cloud optical depth (COT), cloud ice and liquid paths (IWP and LWP), shortwave cloud forcing (SWCF), and longwave cloud forcing (LWCF), but decreases domainwide downward shortwave radiation (SWD), precipitation, temperature at 2-m (T2), and wind speed at 10-m (WS10) over most of the domain. The increases in most cloud parameters (e.g., CDNC and COT) may be due to more low-level clouds formed in Run_N12 than in Run_M92. Regional differences in simulated variables may be somewhat different from the domain mean differences. For example, there is a small increase in precipitation in the northern region, consistently with the increased amounts of ice and snow. The aforementioned changes in cloud, radiation, and other meteorological variables can subsequently change the concentrations of chemical species. For example, domain mean decreased precipitation will increase the concentrations of gaseous species such as SO
2 and NO
2, and PM species such as SO
42−, NO
3−, and NH
4+. Domain mean decreased temperatures can decrease the oxidation rates of species and the formation rate of O
3, OH, and SO
42−, thus leading to a lower overall atmospheric oxidation capacity. Domain mean decreased wind speeds can decrease the emissions of dust, leading to lower PM
10 and PM
2.5 concentrations. As shown in
Figure 7, the net impact of these changes is the lower surface concentrations of OH, O
3, SO
42−, PM
2.5, and PM
10, but higher surface concentrations of CO, NO
2, and SO
2 over most of the domain.
Figure 6.
Spatial distributions of absolute differences of IWP, LWP, CDNC, COT, WS10, CF, GLW, SWD, T2, LWCF, SWCF, and precipitation between Run_N12 and Run_M92 for 2006.
Figure 6.
Spatial distributions of absolute differences of IWP, LWP, CDNC, COT, WS10, CF, GLW, SWD, T2, LWCF, SWCF, and precipitation between Run_N12 and Run_M92 for 2006.
Figure 7.
Absolute differences in the surface concentrations of chemical species between Run_N12 and Run_M92 for 2006.
Figure 7.
Absolute differences in the surface concentrations of chemical species between Run_N12 and Run_M92 for 2006.

