Article

Application of an Online-Coupled Regional Climate Model, WRF-CAM5, over East Asia for Examination of Ice Nucleation Schemes: Part II. Sensitivity to Heterogeneous Ice Nucleation Parameterizations and Dust Emissions

1
Department of Marine, Earth, and Atmospheric Sciences, NCSU, 2800 Faucette Drive, Raleigh, NC 27695, USA
2
Atmospheric Sciences and Global Change Division, Pacific Northwest National Laboratory, Richland, WA 99354, USA
*
Author to whom correspondence should be addressed.
Climate 2015, 3(3), 753-774; https://doi.org/10.3390/cli3030753
Submission received: 21 May 2015 / Revised: 14 August 2015 / Accepted: 25 August 2015 / Published: 14 September 2015

Abstract

:
Aerosol particles can affect cloud microphysical properties by serving as ice nuclei (IN). Large uncertainties exist in the ice nucleation parameterizations (INPs) used in current climate models. In this Part II paper, to examine the sensitivity of the model predictions to different heterogeneous INPs, WRF-CAM5 simulation using the INP of Niemand et al. (N12) [1] is conducted over East Asia for two full years, 2006 and 2011, and compared with simulation using the INP of Meyers et al. (M92) [2], which is the original INP used in CAM5. M92 calculates the nucleated ice particle concentration as a function of ice supersaturation, while N12 represents the nucleated ice particle concentration as a function of temperature and the number concentrations and surface areas of dust particles. Compared to M92, the WRF-CAM5 simulation with N12 produces significantly higher nucleated ice crystal number concentrations (ICNCs) in the northern domain where dust sources are located, leading to significantly higher cloud ice number and mass concentrations and ice water path, but the opposite is true in the southern domain where temperatures and moistures play a more important role in ice formation. Overall, the simulation with N12 gives lower downward shortwave radiation but higher downward longwave radiation, cloud liquid water path, cloud droplet number concentrations, and cloud optical depth. The increase in cloud optical depth and the decrease in downward solar flux result in a stronger shortwave and longwave cloud forcing, and decreases temperature at 2-m and precipitation. Changes in temperature and radiation lower surface concentrations of OH, O3, SO42−, and PM2.5, but increase surface concentrations of CO, NO2, and SO2 over most of the domain. By acting as cloud condensation nuclei (CCN) and IN, dust particles have different impacts on cloud water and ice number concentrations, radiation, and temperature at 2-m and precipitation depending on whether the dominant role of dust is CCN or IN. These results indicate the importance of the heterogeneous ice nucleation treatments and dust emissions in accurately simulating regional climate and air quality.

1. Introduction

Ice microphysical processes in both ice-containing clouds such as cirrus clouds and mixed-phase clouds play an important role in the climate system. These processes include primary and secondary ice nucleation, vapor deposition and sublimation, ice aggregation and riming, sedimentation, droplet freezing and melting [3,4]. Ice nucleation affects the climate system by changing the microphysical properties of clouds, which modulate precipitation and the cloud radiative forcing. Ice can form through homogeneous and heterogeneous nucleation. Homogeneous nucleation occurs at temperature below −38 °C through either freezing of hazy aerosol particles under very high ice supersaturation (>140% generally) or freezing of water droplets. In contrast, heterogeneous nucleation can occur at much warmer temperatures and requires much lower ice supersaturations. Conventionally, four types of heterogeneous nucleation mechanisms were proposed: vapor deposition nucleation, condensation nucleation, immersion freezing, and contact freezing [5]. Aerosol particles can influence heterogeneous ice nucleation by serving as ice nuclei (IN) [6,7,8,9] and homogenous freezing of water droplets by serving as cloud condensation nuclei (CCN) ([10,11,12]). The enhanced ice formation in the mixed-phase clouds usually leads to enhanced transformation of liquid to ice by the Wegener-Bergeron-Findeisen (WBF) mechanism due to the higher saturation vapor pressure over liquid than ice at the same temperatures [13,14,15]. Such influence is sometimes referred to as “glaciation indirect effect” of aerosols on clouds. The efficiency of aerosol particles to act as heterogeneous IN depends on not only their chemical composition but also their surface properties. Carbonaceous particles [16,17] and various crustal particles [18,19], especially dust particles have been found to be the most abundant type of IN [20,21,22]. Once an ice crystal is formed, it may begin to grow rapidly through cloud microphysical processes, such as aggregation, accretion, and the WBF mechanism.
Despite the importance of ice nucleation to climate, there is a lack of comprehensive understanding of the mechanisms of ice nucleation, and therefore the treatment of ice nucleation in current atmospheric models is subject to large uncertainty. Most heterogeneous ice nucleation parameterizations commonly used in climate models are temperature- and/or supersaturation-dependent only (e.g., [2,23,24,25]). These ice nucleation parameterizations were developed empirically based on field or laboratory measurements within a limited range of temperatures and supersaturation. In recent years, to improve prediction of ice crystal number concentrations, a few ice nucleation parameterizations (INPs) that link the ice nucleation processes to not only supersaturation and/or temperature but also aerosol properties have been developed based on in-situ field measurement data or laboratory data (e.g., [1,6,26], ). Niemand et al. [1] proposed a parameterization, in which IN concentration is a function of particle surface area and temperature, based on a large number of laboratory experimental results of five dust samples from Asia, Sahara, Canary Island, Israel, and Arizona. This parameterization may be applied in the temperature range of −36 °C to −12 °C at or above water saturation.
In the Weather Research and Forecasting model with chemistry (WRF/Chem) coupled with the physics package of the Community Atmosphere Model version 5 (CAM5) (hereafter, WRF-CAM5), ice nucleation through homogeneous and heterogeneous freezing for cirrus clouds is simulated based on Liu et al. (L07) [27]. L07 also accounts for the competition between homogeneous freezing and heterogeneous immersion nucleation. For mixed-phase clouds, immersion freezing is represented based on the formulation of Bigg [23]; contact freezing follows the parameterization of Young [28] and Cotton et al. [25], and heterogeneous deposition/condensation nucleation is based on M92 in which ice formation is described as a function of ice supersaturation [4]. Lim et al. [29] incorporated the parameterizations of Niemand et al. [1] to connect ice nucleation with dust particles, which replaces the original immersion and deposition/condensation nucleation parameterizations in the model. Following the comprehensive evaluation of WRF-CAM5 that uses the default INP of M92 in Part I of our two-part paper, in this part II paper, we conduct sensitivity simulations with a new INP, N12, which connects ice formation with dust particle properties, to examine the sensitivity of WRF-CAM5 to heterogeneous ice nucleation parameterizations and the role of mineral dust in radiation and cloud formation via affecting ice nucleation processes only and affecting both cloud droplet and ice nucleation processes, as well as the radiation.

2. Sensitivity Simulation Design

Two sets of sensitivity simulations are performed. In the first set of simulations, WRF-CAM5 with the newly implemented Niemand et al. (N12) [1] heterogeneous INP is applied for 2006 and 2011 and the results are compared with those from the default M92 to examine the sensitivity to heterogeneous INPs. The simulations with N12 and M92 are referred to as Run_N12 and Run_M92, respectively. In the second set of sensitivity simulations, WRF-CAM5 with N12 but with no dust emissions (i.e., the dust emission scheme of Zender et al. [30] is turned off, referred to as Run_N12_no_dust) is applied for 2006 and the results are compared to those from the baseline simulation (i.e., Run_N12) to study the impact of mineral dust on clouds and climate. The year of 2006 is selected to study the role of dust because of the higher dust emissions in 2006 than 2011. Those sensitivity simulations use the same physics and chemistry options as in the baseline simulations except for the above differences. They also use the same meteorological and chemical initial and boundary conditions as the baseline simulations described in Part I. The two heterogeneous INPs used are described below.
In M92, the number of ice crystals from deposition and condensation freezing, Nid, is parameterized as
N i d = exp ( 0.639   + 0.1296   ( 100 ( S i   1 ) ) )
where (Si − 1) is the fractional ice supersaturation. The parameterization of M92 is based on data obtained from continuous-flow diffusion chambers at northern mid-latitudes and may be strictly applied over the temperature range of −20 °C to −7 °C, ice superasaturation of 2% to 25%, and water supersaturation ranging from −5% to +4.5%, although these ranges were not applied in their implementation in CAM5. In the N12 ice nucleation parameterization, ice crystal number concentration is a function of temperature and the number and surface area of dust particles, which can serve as active INs in each size bin,
N i ,   j =   N t o t ,   j ( 1   exp ( S a e ,   j   n s ( T ) ) )
n s ( T ) = exp ( 0.517 ( T     273.15 )   + 8.934 )
where T is temperature in degrees Kelvin, Ntot,j is the total number of particles in size bin j and Sae,j is the individual particle surface area in that size bin. The density of ice-active surface sites ns(T) is calculated based on a temperature-dependent fit to observations. The parameterization is valid for the temperature range of −36 °C to −12 °C at or above water saturation.
Since M92 and N12 are implemented as the immersion freezing parameterization as well in the simulations of this study, the original immersion freezing parameterization of Bigg [23] is turned off. The INPs used in the cumulus parameterization of Zhang and McFarlane [31] with the modifications from Song and Zhang [32] are consistent with those in the large-scale clouds. Other physics schemes and parameterizations used in both simulations are the same and have been described in the Part I paper.

3. Sensitivity to Heterogeneous Ice Nucleation Parameterizations

3.1. Sensitivity of Ice Nucleation Related Parameters to INPs

As described in Section 2, N12 connects ice nucleation with the number and surface area of dust particles. Therefore, Run_N12 could give very different ice-related cloud properties for regions with high dust concentrations from regions with lower dust concentrations, while Run_M92 would not display such sensitivity. Figure 1 shows the spatial distributions of column concentrations of dust from Run_N12 (the column concentrations of dust from Run_M92 is very similar, thus not shown) and compares the spatial distributions of average values of nucleated ice crystal number concentration (ICNC) for the immersion freezing in mixed-phase cloud only and cloud ice number concentration (Ni) over all cloud layers. The results for 2011 are similar, and thus not shown. Dust concentrations are the highest in spring, followed by summer, fall, and winter. The dust source regions are located in northwestern China, and the dust plumes can travel eastward to Japan and western Pacific Ocean in spring and summer and southeastward to most southern provinces in Mainland China and Taiwan. Comparing with Run_M92, the ICNCs from Run_N12 in the northern domain are significantly higher (by 259.7 m−3 (71.7%) in summer and by 310.4 m−3 (101.6%) in spring) and an opposite trend is observed in the southern domain in spring and summer when dust and anthropogenic emissions are significantly lower. Run_N12 gives significantly higher ICNCs over the dust regions in the northern domain than Run_M92 due to the increase of dust emissions during spring. In the summer monsoon season (i.e., June, July, and August), ICNCs from Run_N12 over land, especially in the polluted region, are also higher than those from Run_M92 as they are downwind of the dust plumes, whereas Run_N12 gives relatively lower ICNCs over the ocean than Run_M92. Since ICNCs in M92 only depend on the ice supersaturation, they are generally higher in the southern domain than the northern domain because of higher temperature, specific humidity, cloud fraction, and precipitation in all seasons (Figure not shown). This leads to higher net Ni from Run_N12 than Run_M92 by 47.1 and 231.7 kg−1 or by 4.6% and 16.8% in winter and fall, respectively.
Figure 2 compares the zonal mean distributions of dust, ICNC, Ni, and Qi over the vertical domain. ICNCs increase with height but are confined within the troposphere up to about 200 mb in all seasons, with significant changes particularly at higher latitudes where mixed-phase clouds dominate. Consistent with the spatial distributions of ICNCs shown in Figure 1, in spring, ICNCs from Run_M92 over the low latitudes (<25°N) in the southern domain and between 200 and 400 mb are significantly larger (by factors of 2–4) than those from Run_N12. This is due to the different temperature dependencies in N12 and M92 and that Run_M92 gives higher ICNCs in the warmer atmosphere. By contrast, Run_N12 gives higher ICNCs (about factors of 2–6) than Run_M92 at middle latitudes (>30°N) in northern domain and between 200 and 800 mb where there are large mineral dust particles over the Asian deserts. This is mainly due to the consideration of dependencies on dust surfaces for the ICNC calculations by N12. In spring, the dust plume can move vertically to the model top (i.e., 100 mb), for regions north of 25°N with concentrations reaching 1–10 µg·m−3 above 300 mb and 0.1 µg·m−3 above 200 mb. The spread of simulated ICNCs by Run_N12 in the vertical domain coincides with the zonal mean distributions of dust particles, indicating the importance of dust particles in IN formation through immersion freezing nucleation throughout the atmosphere. In summer, both Run_N12 and Run_M92 give high ICNCs at higher altitudes than in spring (i.e., between 400 and 200 mb in summer, compared to 800–200 mb in spring) and spread to all latitudes for two main reasons. First, dust particles can be uplifted to a higher altitude in summer by stronger vertical mixing and turbulence than in spring, with concentrations of 1–10 µg·m−3 above 300 mb particularly over regions south of 25°N. The relatively high dust concentrations of 1–5 µg·m−3 throughout the atmosphere (from surface up to 100–200 mb) over the low latitudes provide sufficient dust surfaces for the formation of IN through immersion freezing nucleation. Second, the cold temperatures and high moistures needed for ice nucleation occur at higher altitudes in summer than in winter. This can be seen clearly from the zonal mean distributions of temperature and specific humidity (Figures not shown). Note that in the summer when deep convective clouds are dominant, the Ni above 200 mb where homogeneous freezing resides is significantly higher in Run_N12 compared with that in Run_M92, suggesting the enhanced homogenous aerosol freezing through L07 which might be due to enhanced convection in Run_N12 as a result of enhanced freezing and latent heat release in the mixed-phase clouds, which transports more water vapor to the upper levels. Similar to spring, the ICNCs from Run_M92 in summer and fall are higher than Run_N12 south of 0.25°N but lower than Run_N12 in the middle latitudes (>35°N) for the same reasons mentioned above. In winter when dust concentrations are the lowest compared to the rest of the year, the ICNCs from Run_M92 and Run_N12 are more similar in terms of magnitudes and zonal mean distributions, because ICNCs are mainly determined by supersaturation in M92 and by temperatures in N12. The annual mean zonal mean distributions of ICNCs are dominated by the seasonal mean distributions of ICNCs in spring and summer. Both Run_N12 and Run_M92 show similar strong seasonal variations, with the highest ICNCs in summer, followed by spring, fall, and winter.
Figure 1. Spatial distributions of total dust concentrations over all model layers from the 2006 simulation with N12 (row 1) and spatial distributions of average values of ICNC and Ni over all model layers between simulations in 2006 with N12 and M92 (rows 2–5).
Climate 03 00753 g001
Figure 2. Zonal mean distributions of dust for the 2006 simulations with N12 (row 1) and zonal mean distributions of ICNC, Ni, and Qi for the 2006 simulations with N12 and M92 (rows 2–7) over the vertical domain.
Climate 03 00753 g002aClimate 03 00753 g002b
Similar to the spatial distributions of ICNC, Ni is higher in the northern domain by Run_N12 but in the southern domain by Run_M92 (Figure 1). The spatial distributions of Ni from Run_M92 and Run_N12 are similar although their magnitudes from Run_N12 are larger (by 47.1–3326.4 kg−1 or 4.6%–123% for seasonal means and by 1214.7 kg−1 or by 58.8% for annual mean) than those from Run_M92, particularly in spring (see Figure 1 and Figure 2). The differences of Ni between the two simulations are consistent with the differences of ICNCs between the two simulations in all seasons and annually. For example, in winter, spring, and fall, Run_N12 gives significantly higher Ni over the northern domain and significantly lower Ni over the southern domain. In the monsoon season (summer), the simulated Ni from Run_N12 is relatively higher over land but relatively lower over ocean than that from Run_M92. As shown in Figure 2, in general, Ni increases with height and latitude in all seasons but exhibits strong seasonal variations in both simulations. In winter, Run_N12 gives relatively higher Ni over the middle latitudes (>30°N). In spring, especially in April, the Ni from Run_N12 is larger than that from Run_M92 for altitudes below 800 mb, corresponding to the significant increase of ICNCs due to increased dust concentrations at the same heights. In the monsoon season, more ice is found in the upper troposphere at the low latitudes (<20°N) from both simulations. Comparing to lower latitudes, the height of maxima of Ni decreases at higher latitudes in the monsoon season, which is due likely to the weaker deep convection, lower temperature, and lower cloud top height. The variation of the upper height of the ice crystal band is associated with the seasonal variation of tropopause. In the monsoon season, although the magnitudes of Ni from Run_M92 and Run_N12 at low latitudes (<20°N) are comparable, Run_M92 gives higher Ni at lower altitudes (400–300 mb) than Run_N12. Such differences are associated with more ice from Run_M92 over ocean, mainly due to the moister environment. In fall, Run_N12 gives comparable Ni in terms of magnitudes over the low latitudes (<20°N), and higher Ni over the middle latitudes (>35°N) compared with Run_M92. Despite similar strong seasonal variations, the differences in the magnitude of Ni between the two simulations are noticeable. In general, more ice from Run_ N12 exists at higher latitudes and lower altitudes, which is consistent with the differences of ICNCs between the two simulations.
Figure 3 shows the spatial distributions of average values of ice mixing ratio (Qi), the ice nucleation rate simulated by L07 (NUCLIN, which includes both homogeneous and heterogeneous ice nucleation rates), and homogeneous droplet freezing rate (Homo DFR) over all model layers simulated by Run_N12 and Run_M92 for 2006. Small ice crystals grow via deposition, rimming and aggregation to larger ice particles (i.e., cloud snow) after they form. In the mixed-phase regime, more ice crystals lead to stronger WBF process as ice deposition is enhanced at the expense of droplet evaporation. As shown in Figure 3, Qi is higher in Run_N12 in the northern domain than Run_M92, but the opposite in the southern domain in spring and summer, consistent with the spatial distributions of ICNCs and Ni from both simulations. As a result, Run_N12 gives lower Qi seasonal mean values (by 0.04–0.07 mg·kg−1 or by 5.5%–16.3%) except for spring and lower annual means (by 0.03 mg·kg−1 or by 5.9%) in 2006. For 2011 simulations, Run_N12 gives lower seasonal mean values (by 2.2%–24.9%) and annual mean value (by 12.9%) than Run_M92. The zonal mean distributions of Qi in Figure 2 are also consistent with those of ICNCs and Ni. Qi increases with height and latitude in all seasons in both simulations. The variation of the upper boundaries of Qi is consistent with the seasonal variation of tropopause. More ice crystals are produced by N12 at the middle latitudes (>25°N), where large amounts of dust are emitted. This is because the increase of IN concentrations due to the presence of large amount of dust particles in the northern domain enhances the Bergeron–Findeisen process in mixed-phase clouds, leading to a larger conversion rate from cloud liquid to ice/snow. Noticeably higher Qi from Run_M92 than Run_N12 is found in the low latitudes (<20°N), which is associated with more Ni from Run_M92 than Run_N12 in this region.
Different heterogeneous INPs also influence other processes, which in turn affect Ni and Ns. As shown in Figure 3, NUCLIN from Run_N12 is higher than that from Run_M92 in spring and summer when dust concentrations are the highest but lower than that from Run_M92 in winter and fall in 2006 (with a net increase by 85.9 m−3 or 12.0% for annual mean value from Run_N12 compared to Run_M92), indicating a large impact of N12 and M92 on the ice nucleation rates through homogeneous and heterogeneous freezing for cirrus clouds by L07, particularly in North and Northwest China. Similar differences occur in the zonal mean distributions of NUCLIN shown in Figure 4, with a net increase in annual mean values of NUCLIN by Run_N12 relative to Run_M92, particularly in the upper levels (>600 mb). The enhanced ice nucleation in the cirrus clouds in Run_N12 is mainly caused by the much-increased water vapor, Qv (see Figure 5a). Although increasing aerosol concentrations could lead to larger ice nucleation through L07, the slightly increased aerosol number concentrations at the upper levels (see Figure 5b) may be associated with the increased water vapor as well, which enhances aerosol nucleation. The larger ice concentrations in the mixed-phase enhance the conversion of liquid to ice (i.e., WBF process), which would enhance latent heat release and then convection, leading to larger transport of water vapor to the upper-levels. Convection can also be enhanced because the larger ice nucleation rate in the mixed-phase glaciates the clouds much faster, leading to faster dissipation of clouds, which in turn increases SW at the surface and leads to stronger convection.
Compared to Run_M92, Run_N12 gives similar spatial distributions but higher magnitudes of Homo DFR in the southern region where N12 gives lower ice nucleation in the mixed-phase regime, suggesting the competition between homogenous and heterogeneous freezing in deep convective clouds. It can be seen clearly that the Homo DFR is much lower in South China in spring and summer in Run_M92, due to much higher heterogeneous freezing in the mixed-phase regime, which reduces droplets being transported to the heterogeneous freezing regimes in deep convective clouds. The zonal mean distributions of Homo DFR in Figure 4 also show lower values in Run_M92 than in Run_N12. By contrast, as shown in Figure 4, the impact of heterogeneous INPs on Ns and Qs is much smaller. Comparing to Run_M92, Run_N12 gives lower Ns by 21.1–34.4 kg−1, or 2.9%–6.3% for domain seasonal mean values and by 27.3 kg−1, or 5.0% for annual mean value, and lower Qs by 0.08–0.29 mg·kg−1, or 2.1%–4.0%, for domain seasonal mean values and by 0.16 kg−1, or 3.0%, for annual mean value. As shown in Figure 4, there are small differences in zonal mean distributions of Ns and Qs between Run_N12 and Run_M92.
Figure 3. Spatial distributions of average values of Qi, NUCLIN, and Homo DFR over all model layers between simulations in 2006 with N12 and M92.
Climate 03 00753 g003
Figure 4. Zonal mean distributions of NUCLIN, Homo DFR, Ns, and Qs for the 2006 simulations with N12 and M92 over the vertical domain.
Climate 03 00753 g004
Figure 5. Absolute and percentage differences of zonal mean distributions of Q and aerosol number concentrations for the 2006 simulations with N12 and M92 over the vertical domain.
Climate 03 00753 g005
As described in the “glaciation indirect effect” of ice nucleation through the WBF process, the change of ICNC affects cloud phases, which has a large impact on radiation and precipitation by changing the cloud properties (e.g., cloud liquid water content, cloud ice content, cloud albedo, cloud amount, and cloud lifetime). The change of precipitation and radiation will in turn impact the concentrations/mixing ratios of chemical species and temperature, respectively. The ICNCs will be affected by the feedbacks of chemical species and temperatures to meteorological processes including cloud formation. Figure 6 shows the differences in meteorological, radiative, and cloud variables between Run_N12 and Run_M92. The increases in ICNCs and Ni increase domainwide downward longwave radiation (GLW), cloud droplet concentration (CDNC), cloud fraction (CF), cloud optical depth (COT), cloud ice and liquid paths (IWP and LWP), shortwave cloud forcing (SWCF), and longwave cloud forcing (LWCF), but decreases domainwide downward shortwave radiation (SWD), precipitation, temperature at 2-m (T2), and wind speed at 10-m (WS10) over most of the domain. The increases in most cloud parameters (e.g., CDNC and COT) may be due to more low-level clouds formed in Run_N12 than in Run_M92. Regional differences in simulated variables may be somewhat different from the domain mean differences. For example, there is a small increase in precipitation in the northern region, consistently with the increased amounts of ice and snow. The aforementioned changes in cloud, radiation, and other meteorological variables can subsequently change the concentrations of chemical species. For example, domain mean decreased precipitation will increase the concentrations of gaseous species such as SO2 and NO2, and PM species such as SO42−, NO3, and NH4+. Domain mean decreased temperatures can decrease the oxidation rates of species and the formation rate of O3, OH, and SO42−, thus leading to a lower overall atmospheric oxidation capacity. Domain mean decreased wind speeds can decrease the emissions of dust, leading to lower PM10 and PM2.5 concentrations. As shown in Figure 7, the net impact of these changes is the lower surface concentrations of OH, O3, SO42−, PM2.5, and PM10, but higher surface concentrations of CO, NO2, and SO2 over most of the domain.
Figure 6. Spatial distributions of absolute differences of IWP, LWP, CDNC, COT, WS10, CF, GLW, SWD, T2, LWCF, SWCF, and precipitation between Run_N12 and Run_M92 for 2006.
Climate 03 00753 g006
Figure 7. Absolute differences in the surface concentrations of chemical species between Run_N12 and Run_M92 for 2006.
Climate 03 00753 g007

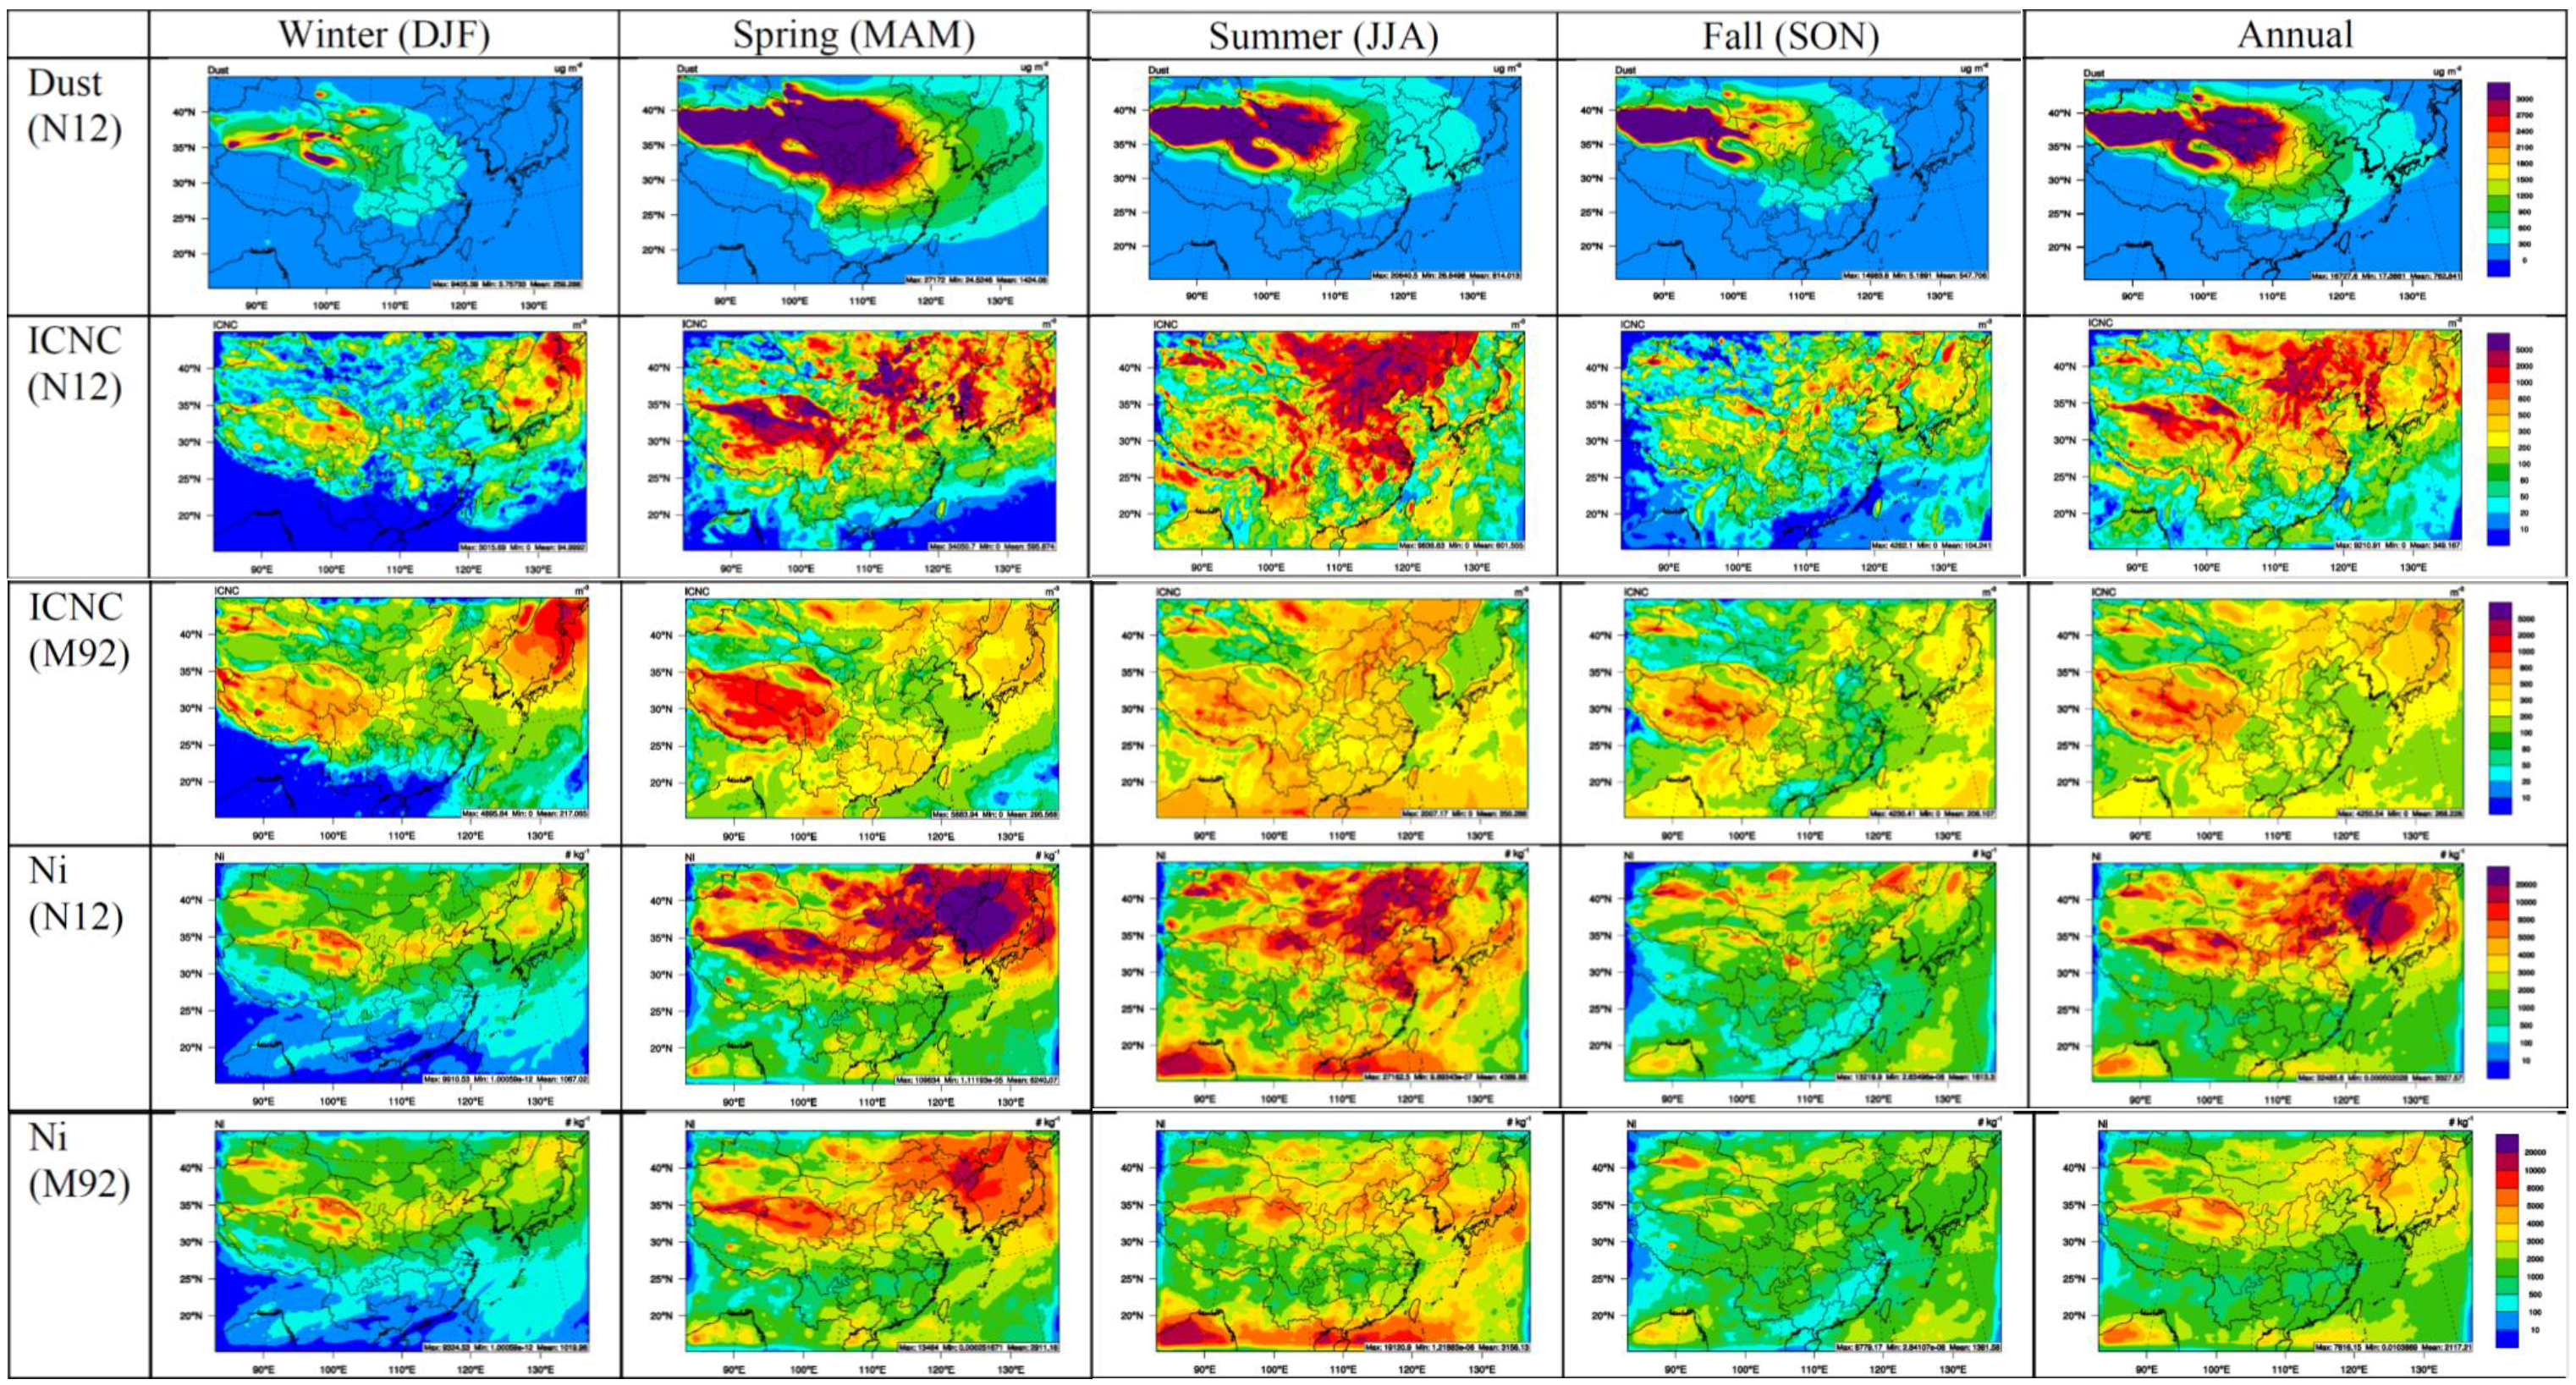
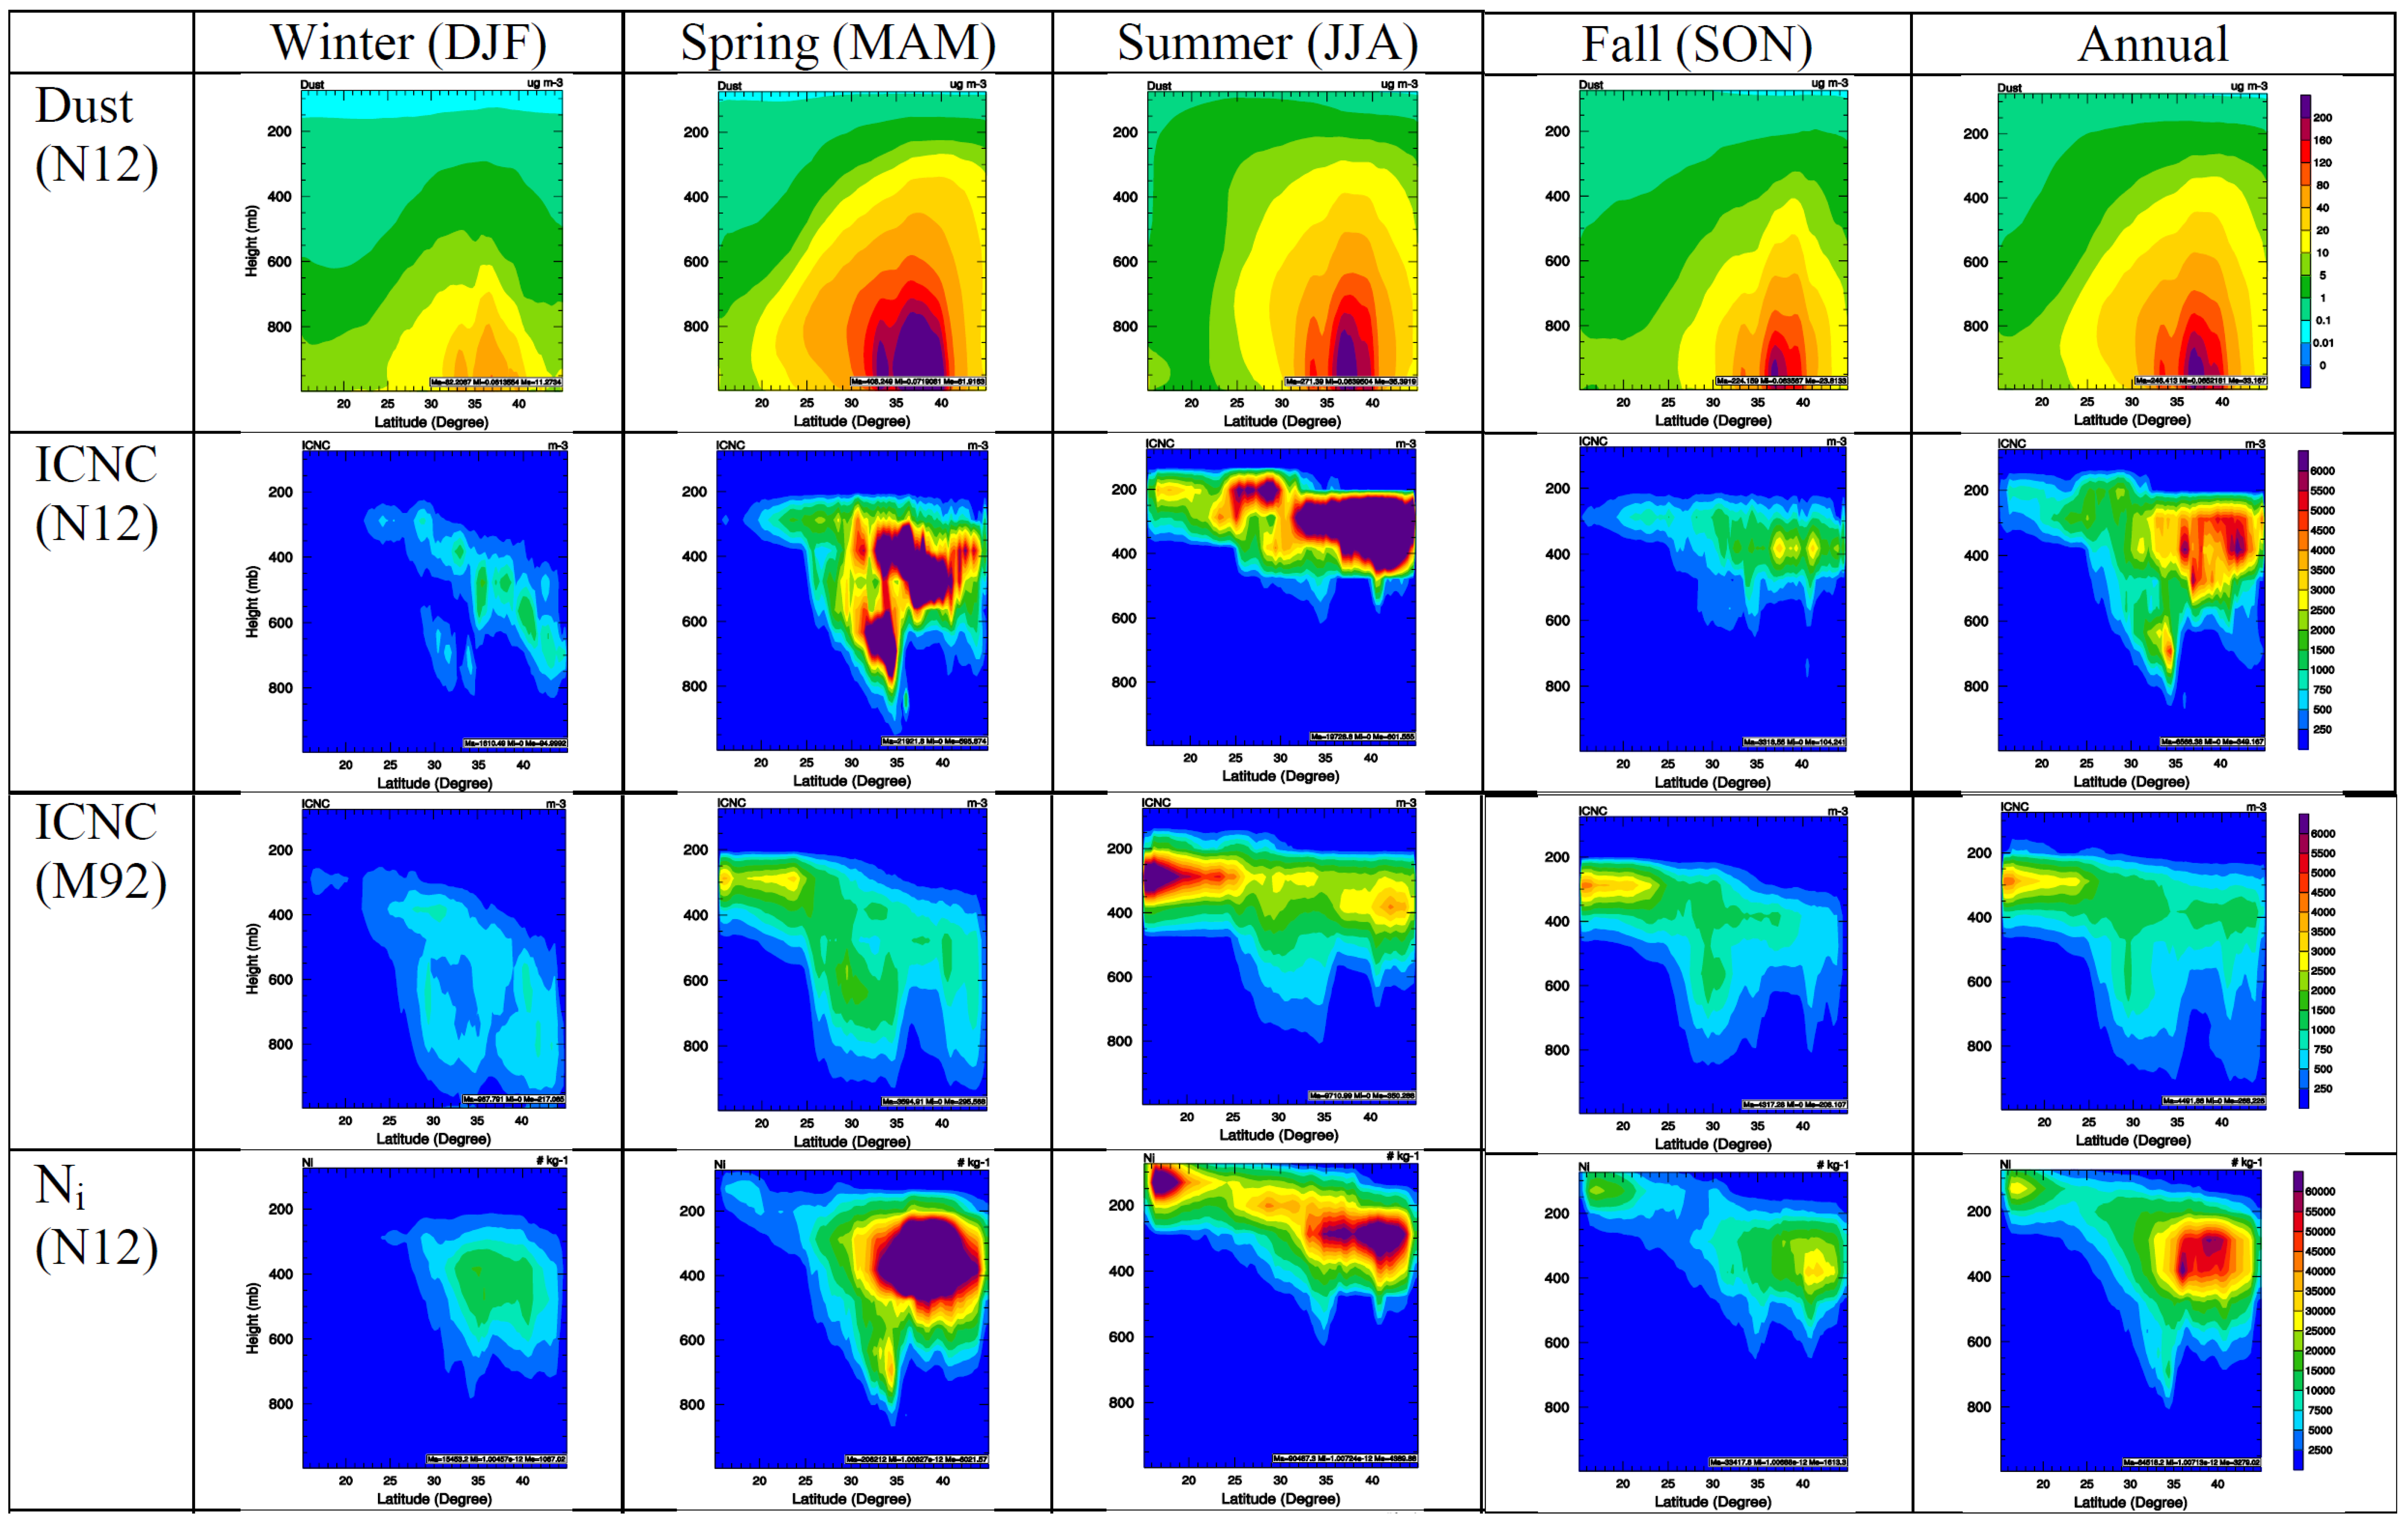
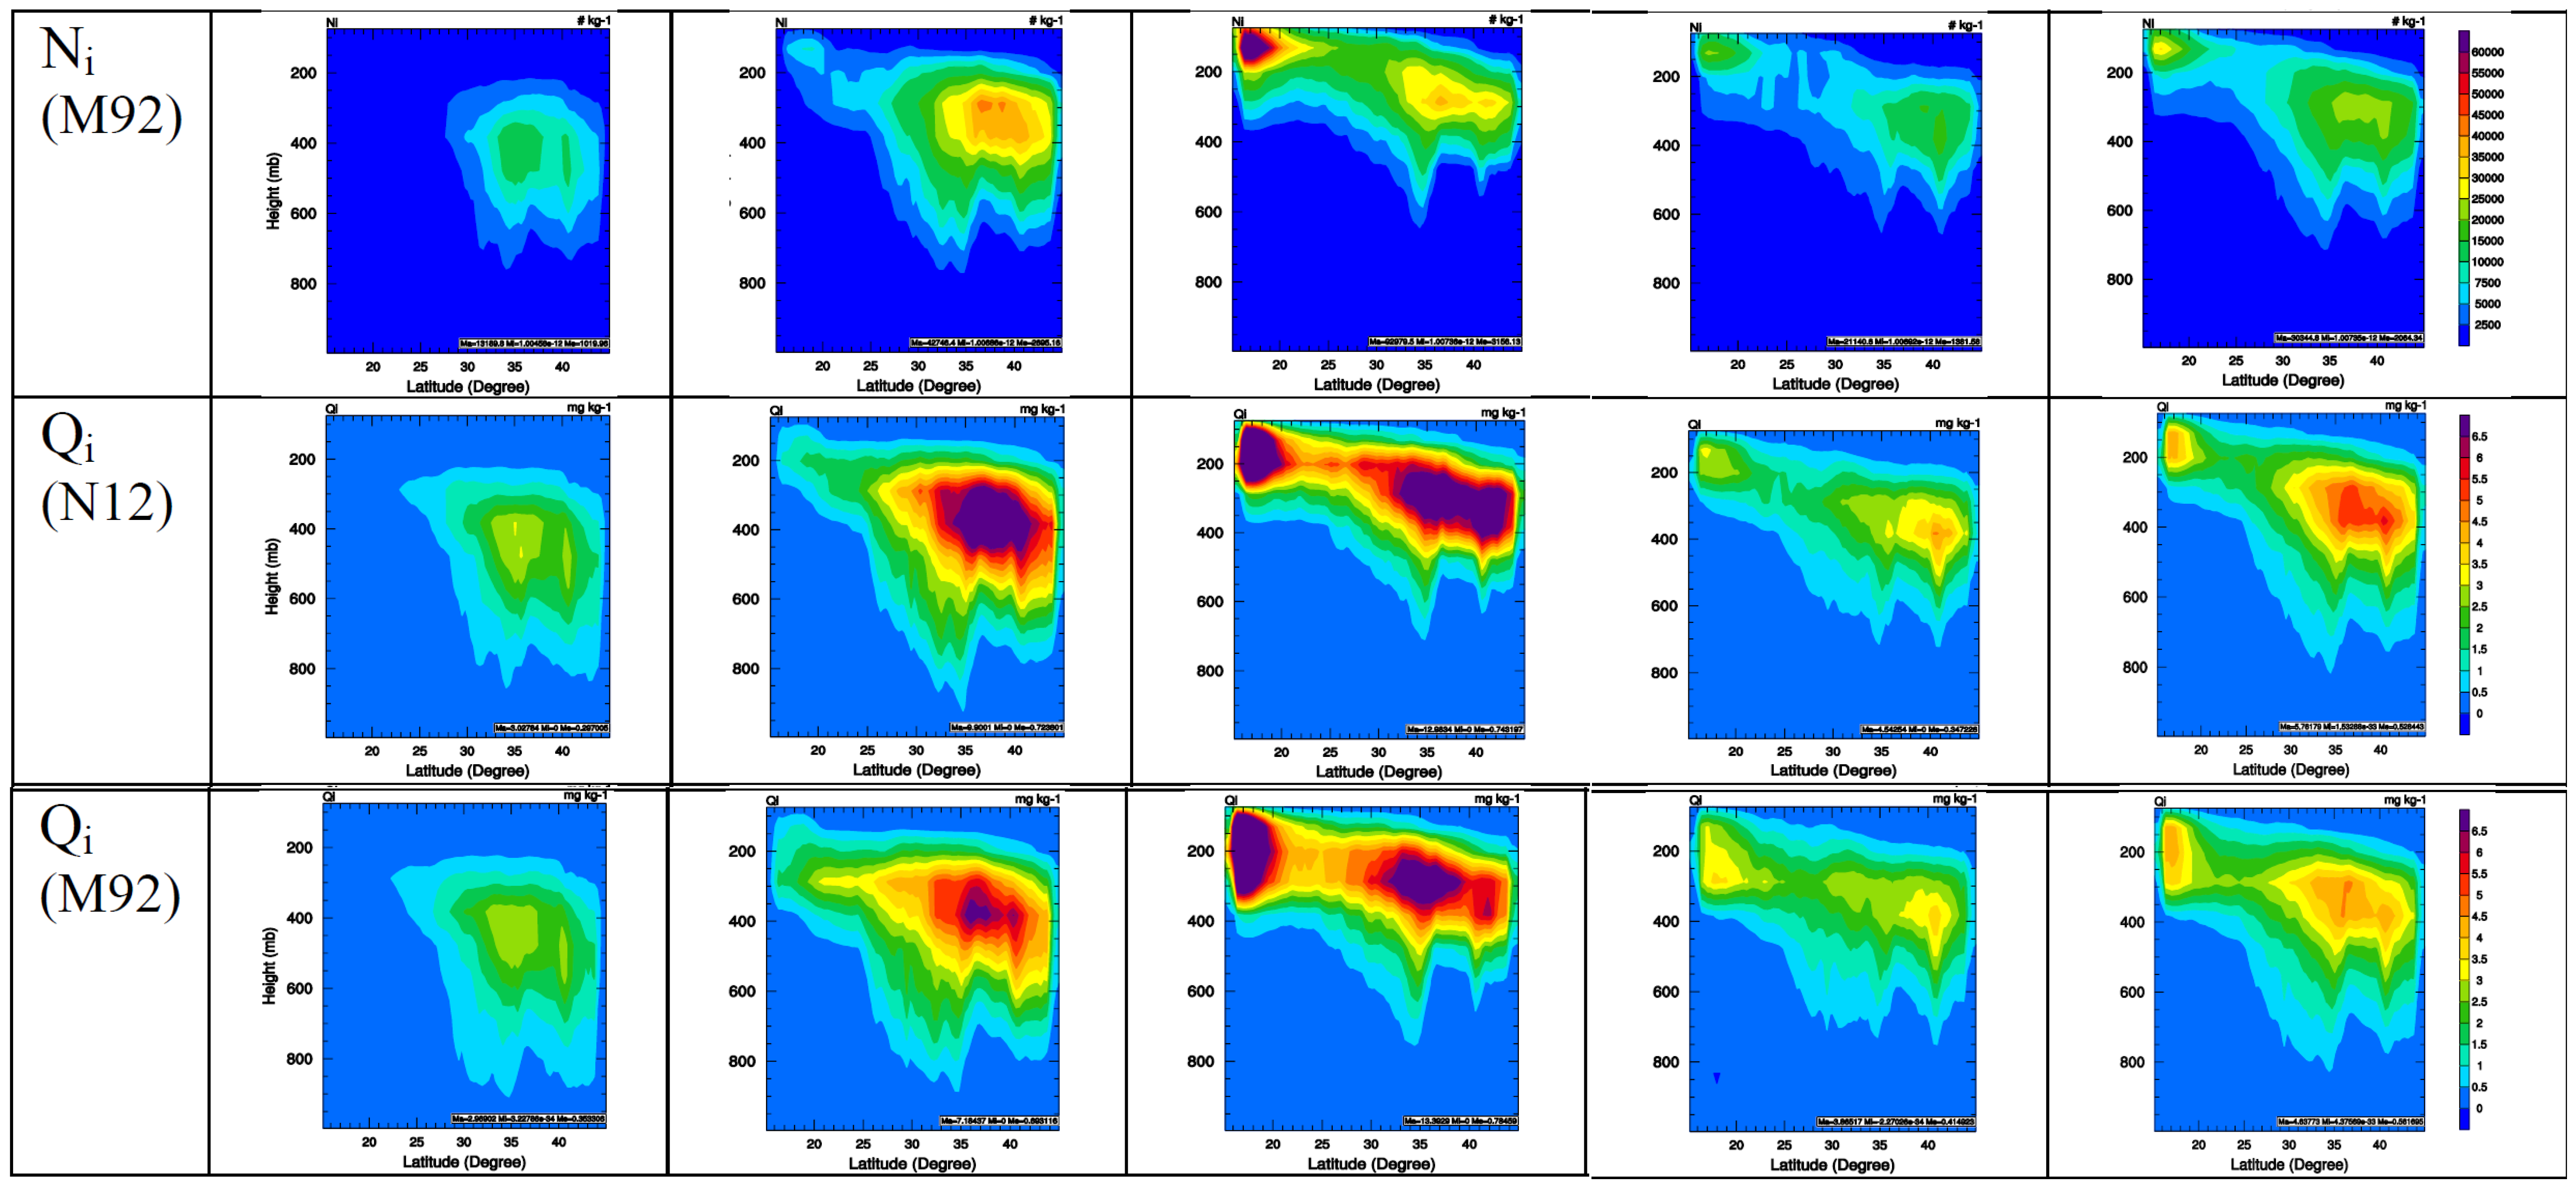
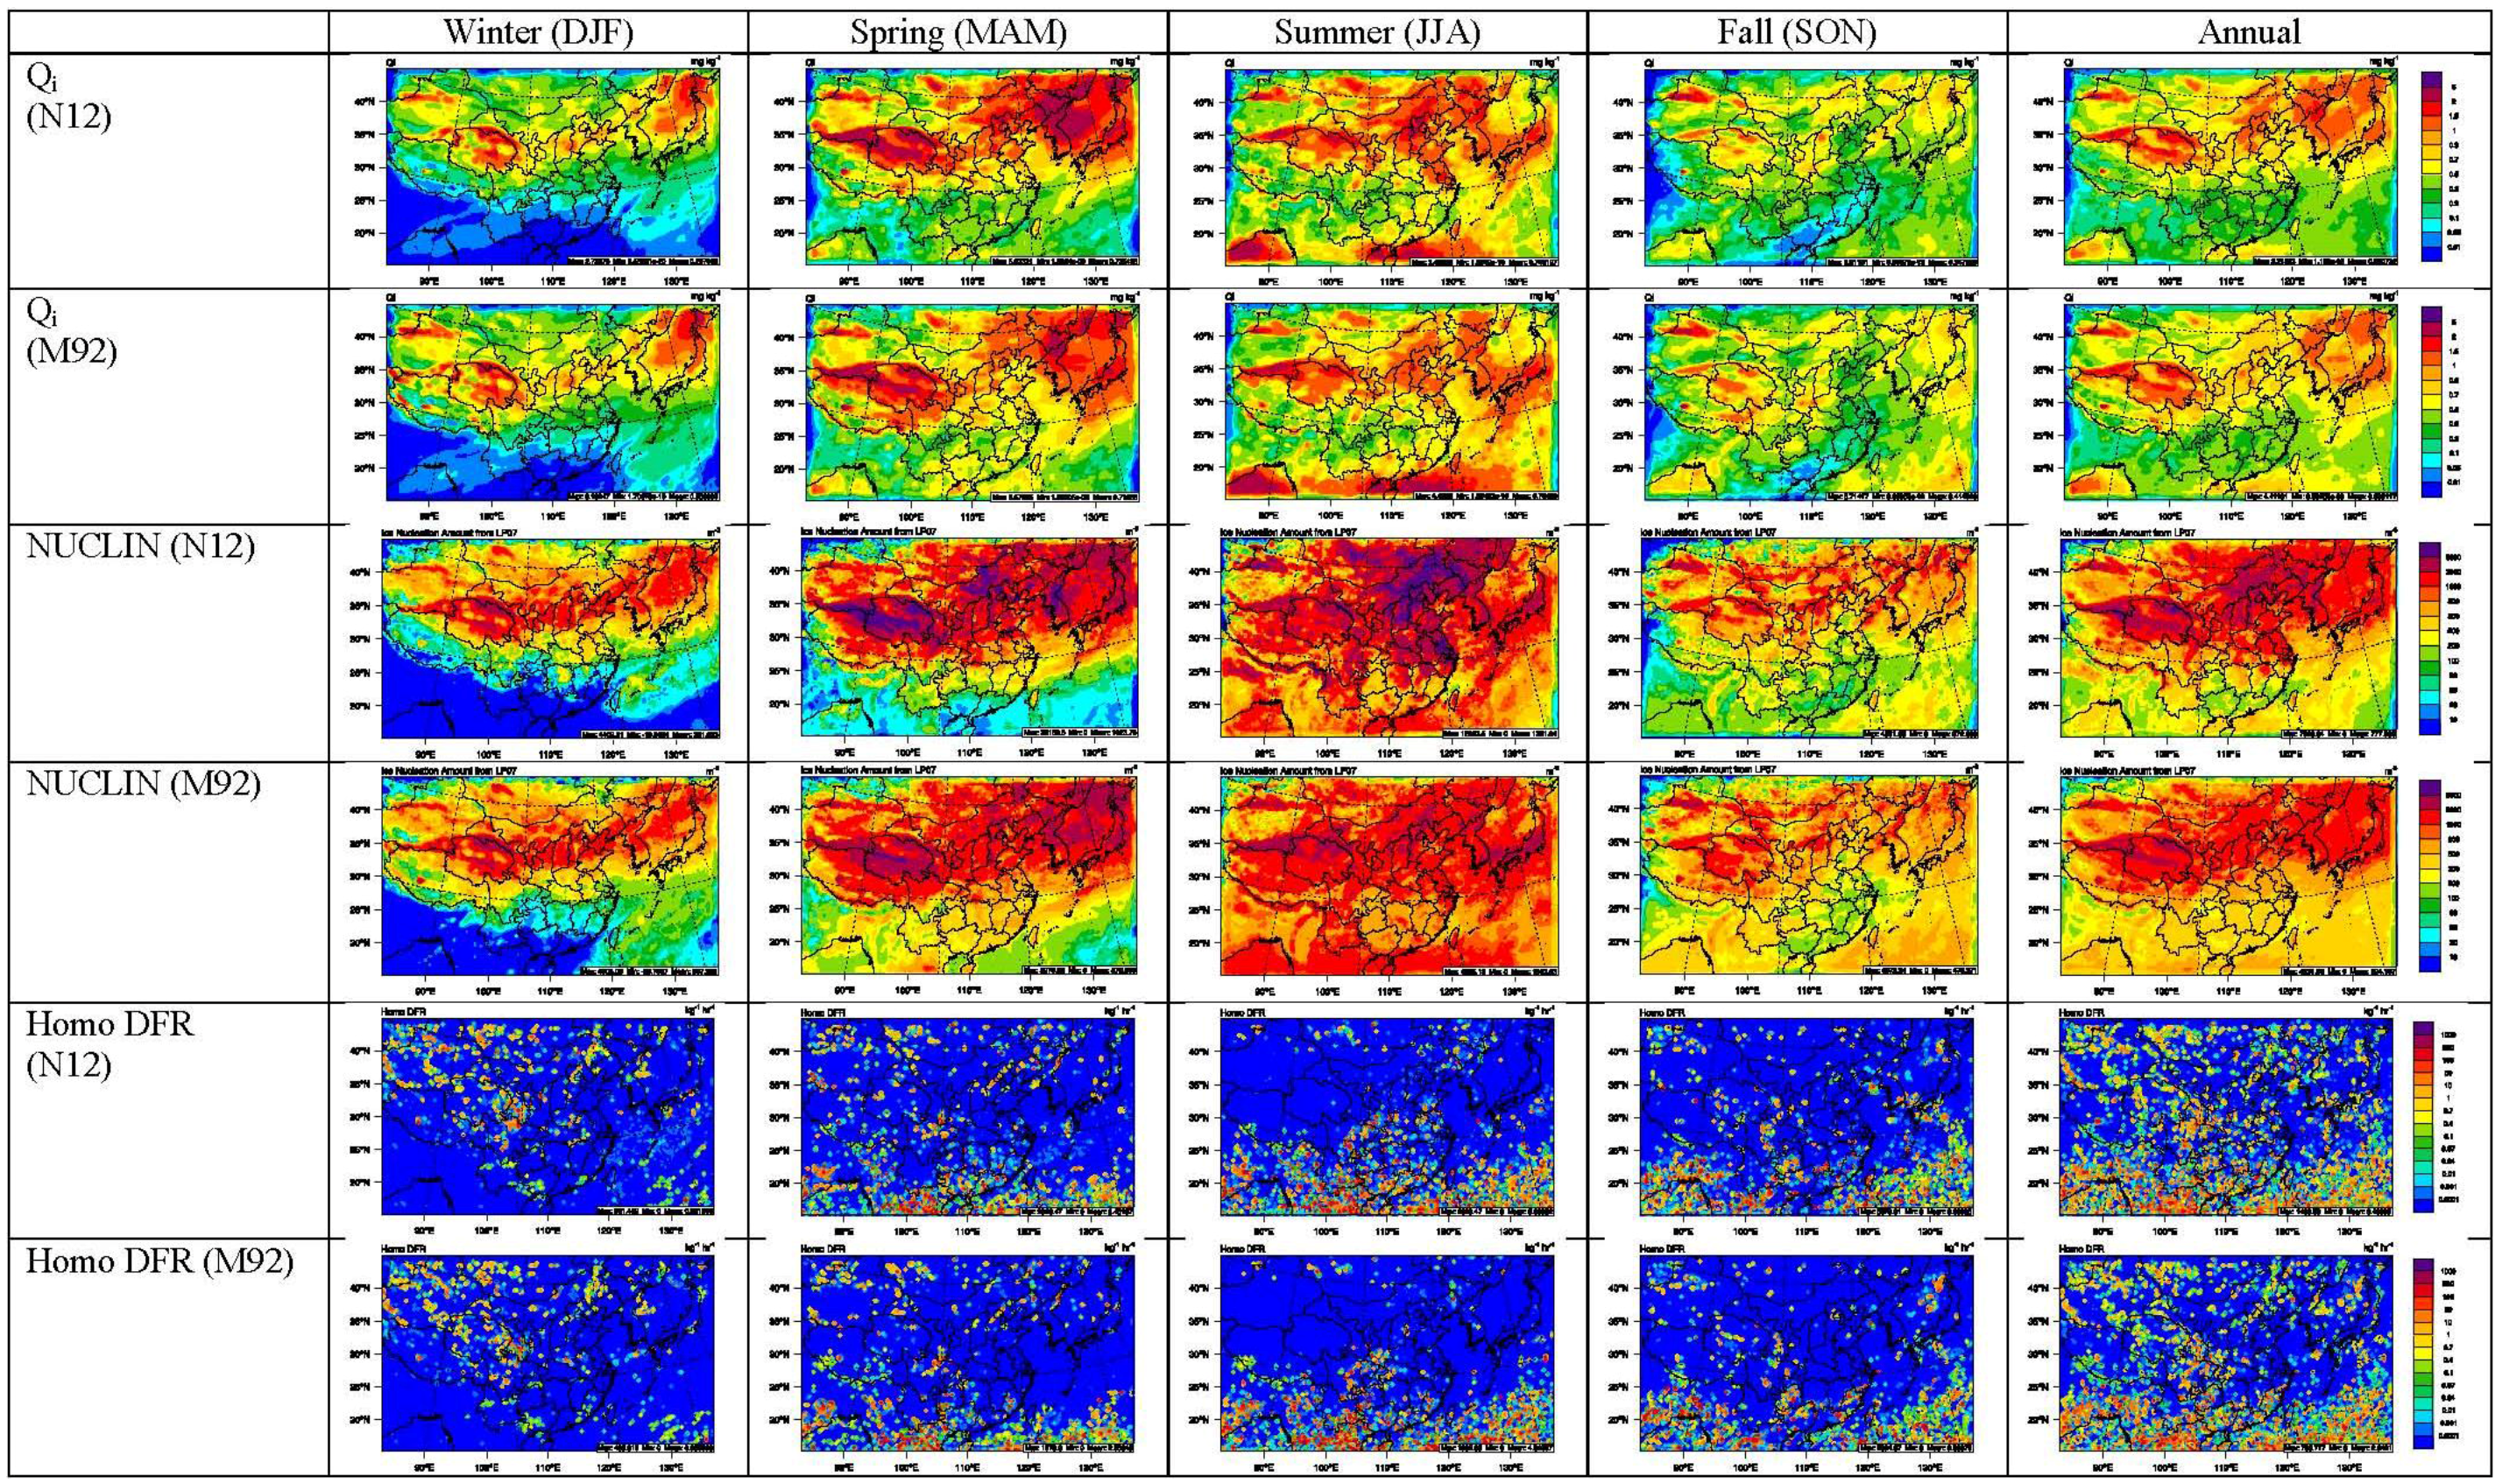
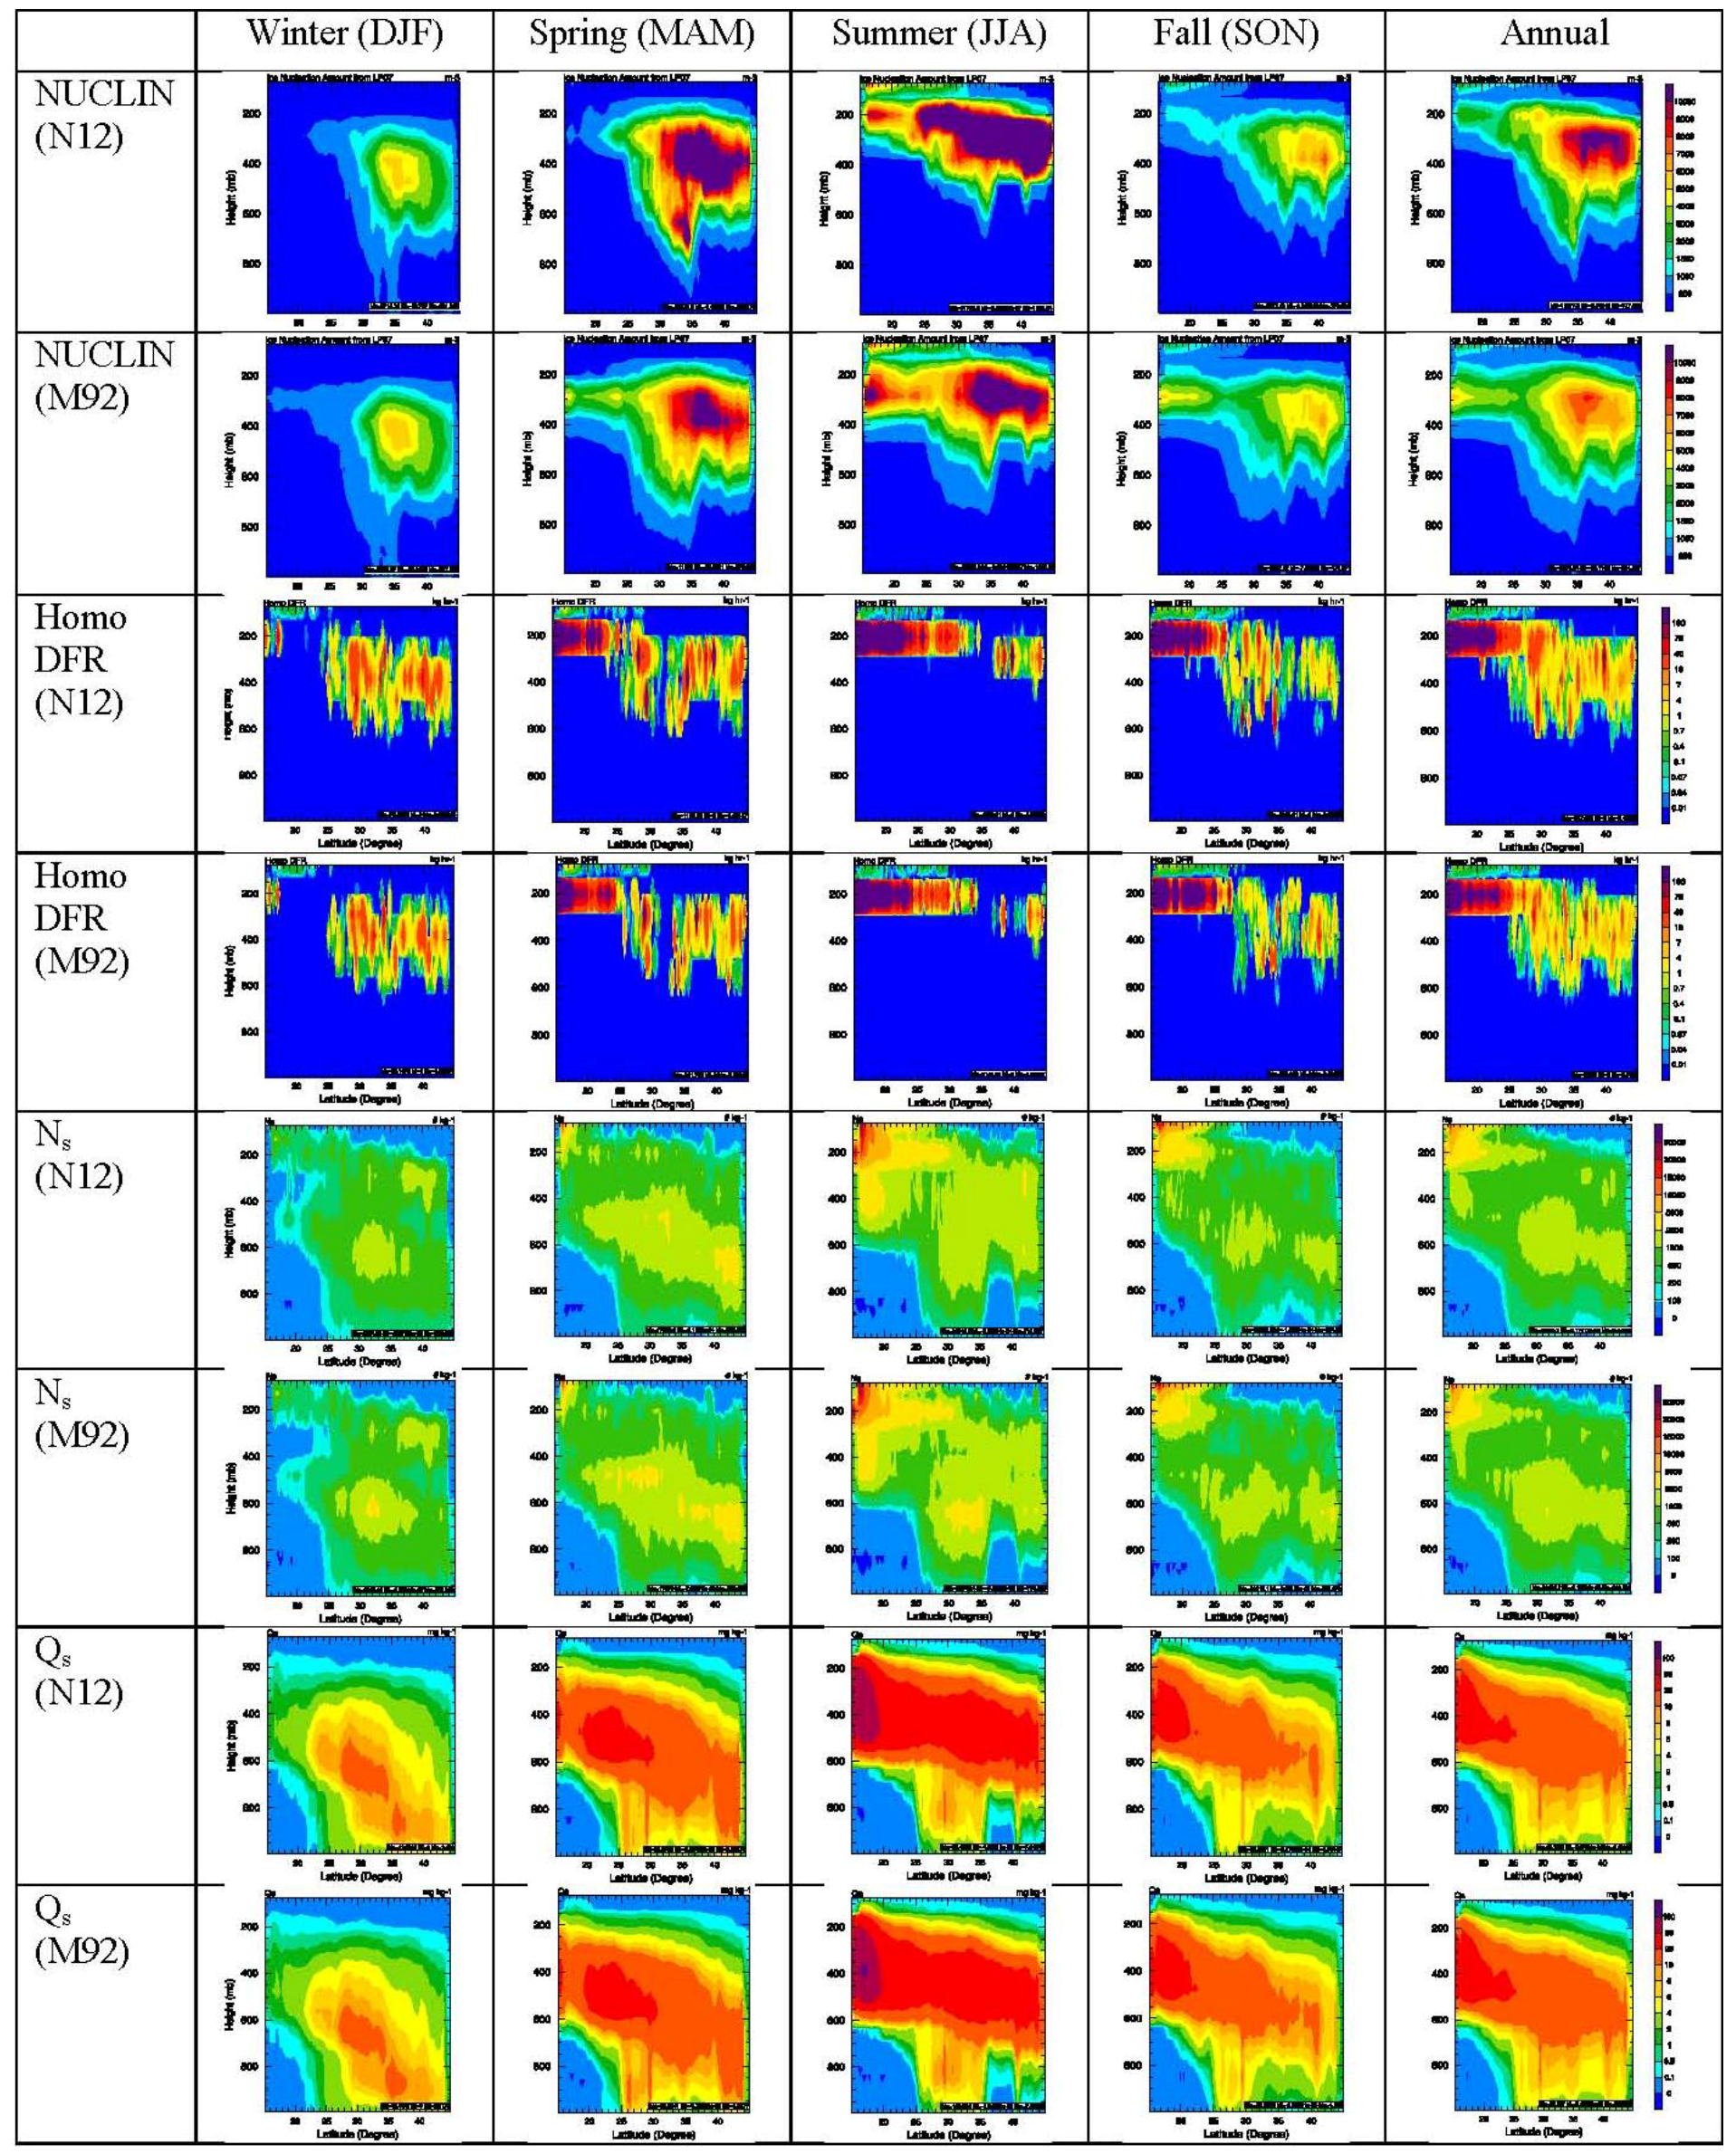
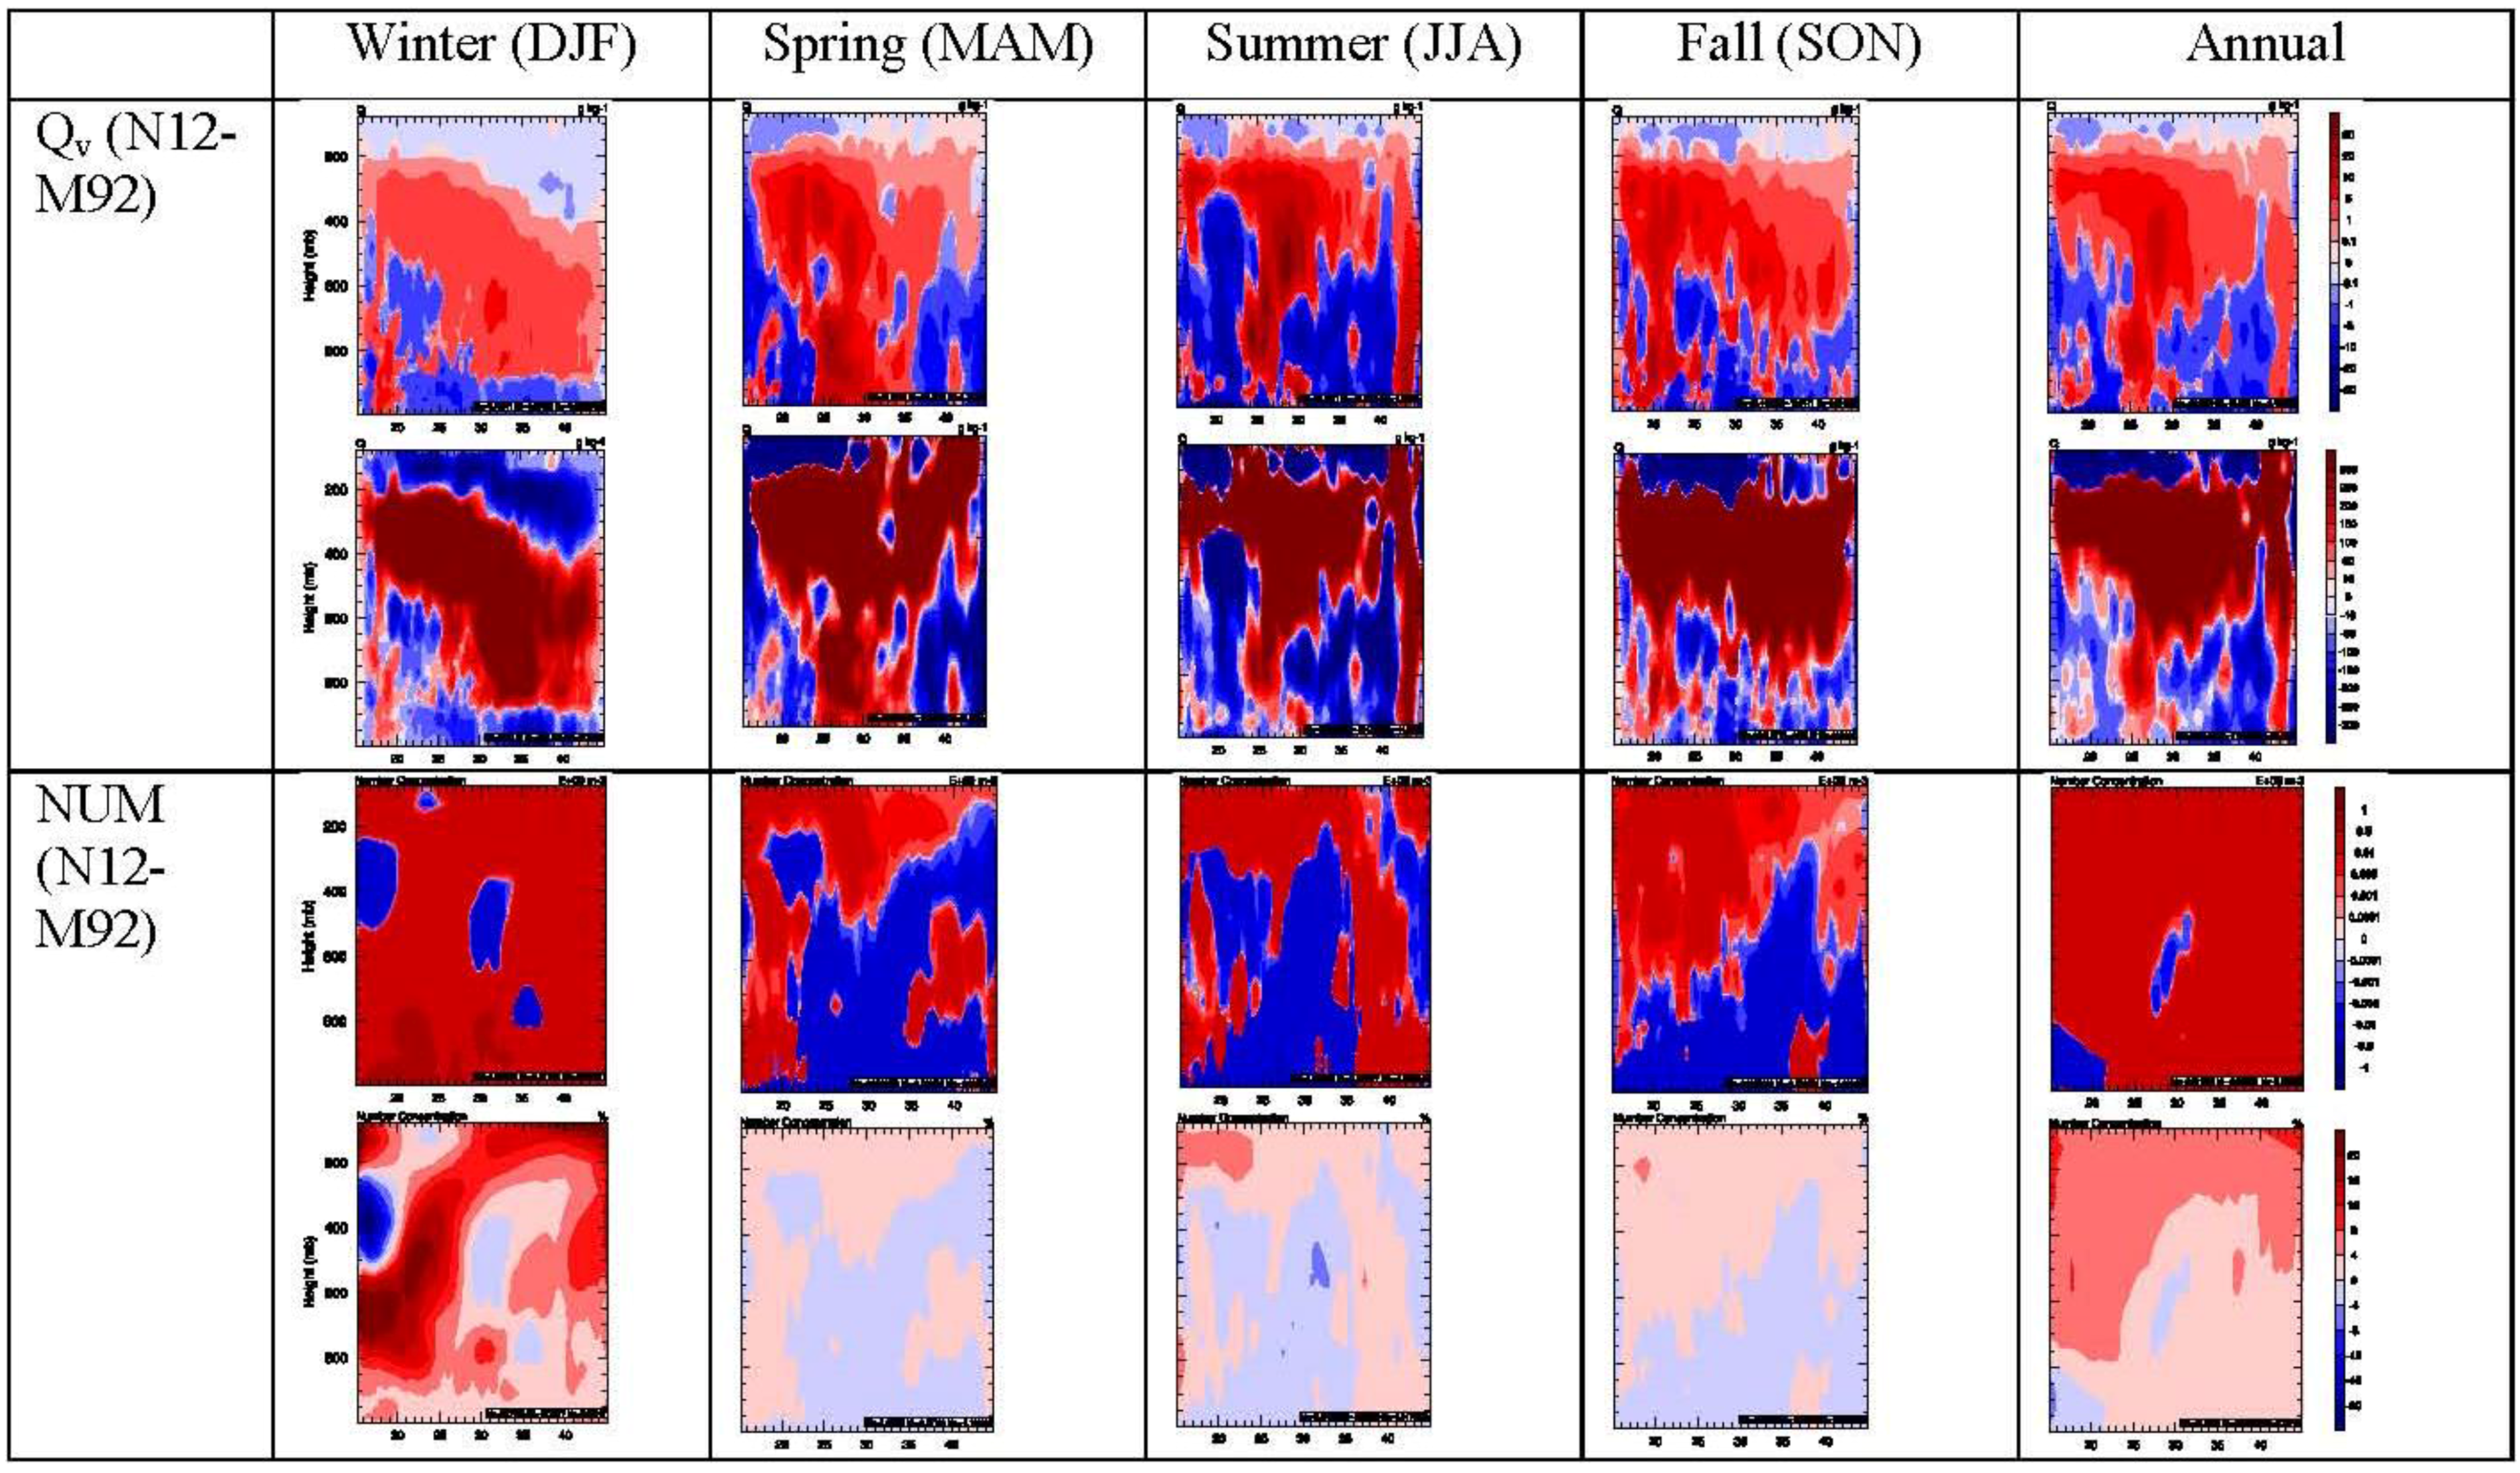
3.2. Model Performance of N12 and Its Comparison with That of M92

The performances of Run_N12 and Run_M92 in terms of meteorological and chemical predictions are generally similar but with noticeable differences in several variables that are affected by ice nucleation treatments. As expected, the largest changes occur in precipitation, with an annual mean bias (MB) of 0.8 mm·day−1 and normalized mean bias (NMB) of 28% by Run_N12 comparing to MB of 0.4 mm·day−1 and NMB of 14% in 2006, and MB of 0.7 mm·day−1 and NMB of 24.7% by Run_N12 compared to MB of 0.3 mm·day−1 and NMB of 11.1% in 2011 against the NCDC data. The enhanced precipitation is attributed to increased ICNCs and Ni, which lead to decreased SWD, but increased GLW, CDNCs, LWPs and COTs by Run_N12 than by Run_M92. Using the 2006 simulations as an example, the simulated CDNCs have an annual mean MB of −41.3 cm−3 and NMB of −28.9% by Run_N12 against MODIS-derived CDNC, comparing to an annual mean MB of −41.9 cm−3 and NMB of −29.3% by Run_M92. The simulated LWP has an annual mean MB of −59.5 g·m−2 and NMB of −54.0% by Run_N12 against MODIS-derived LWP, comparing to an annual mean MB of −62.3 g·m−2 and NMB of −56.5% by Run_M92. The simulated COT has an annual mean MB of −7.9 and NMB of −48.4% by Run_N12 against MODIS-derived COT, comparing to an annual mean MB of –8.2 and NMB of −50.0% by Run_M92. As clouds reflect solar radiation back to the space, the larger COT values by Run_N12 lead to smaller SWD, changing the MBs of SWD from 21.5 W·m−2 by Run_M92 to 18.8 W·m−2 by Run_N12 and NMBs of 11.7% by M92 to 10.3% by Run_N12. Run_N12 increases GLW slightly, changing MBs of GLW from −7.2 to −7.0 W·m−2 with the same NMBs of −2.2%. As a consequence of the above changes, the simulated LWCF has an annual mean MB of –10.3 W·m−2 and NMB of −35.3% by Run_N12 against MODIS-derived LWCF, comparing to an annual mean MB of –10.6 W·m−2 and NMB of −36.4% by Run_M92. The simulated SWCF has an annual mean MB of −9.5 W·m−2 and NMB of −18.4% by Run_N12 against MODIS-derived SWCF, comparing to an annual mean MB of −9.7 W·m−2 and NMB of 18.7% by Run_M92.

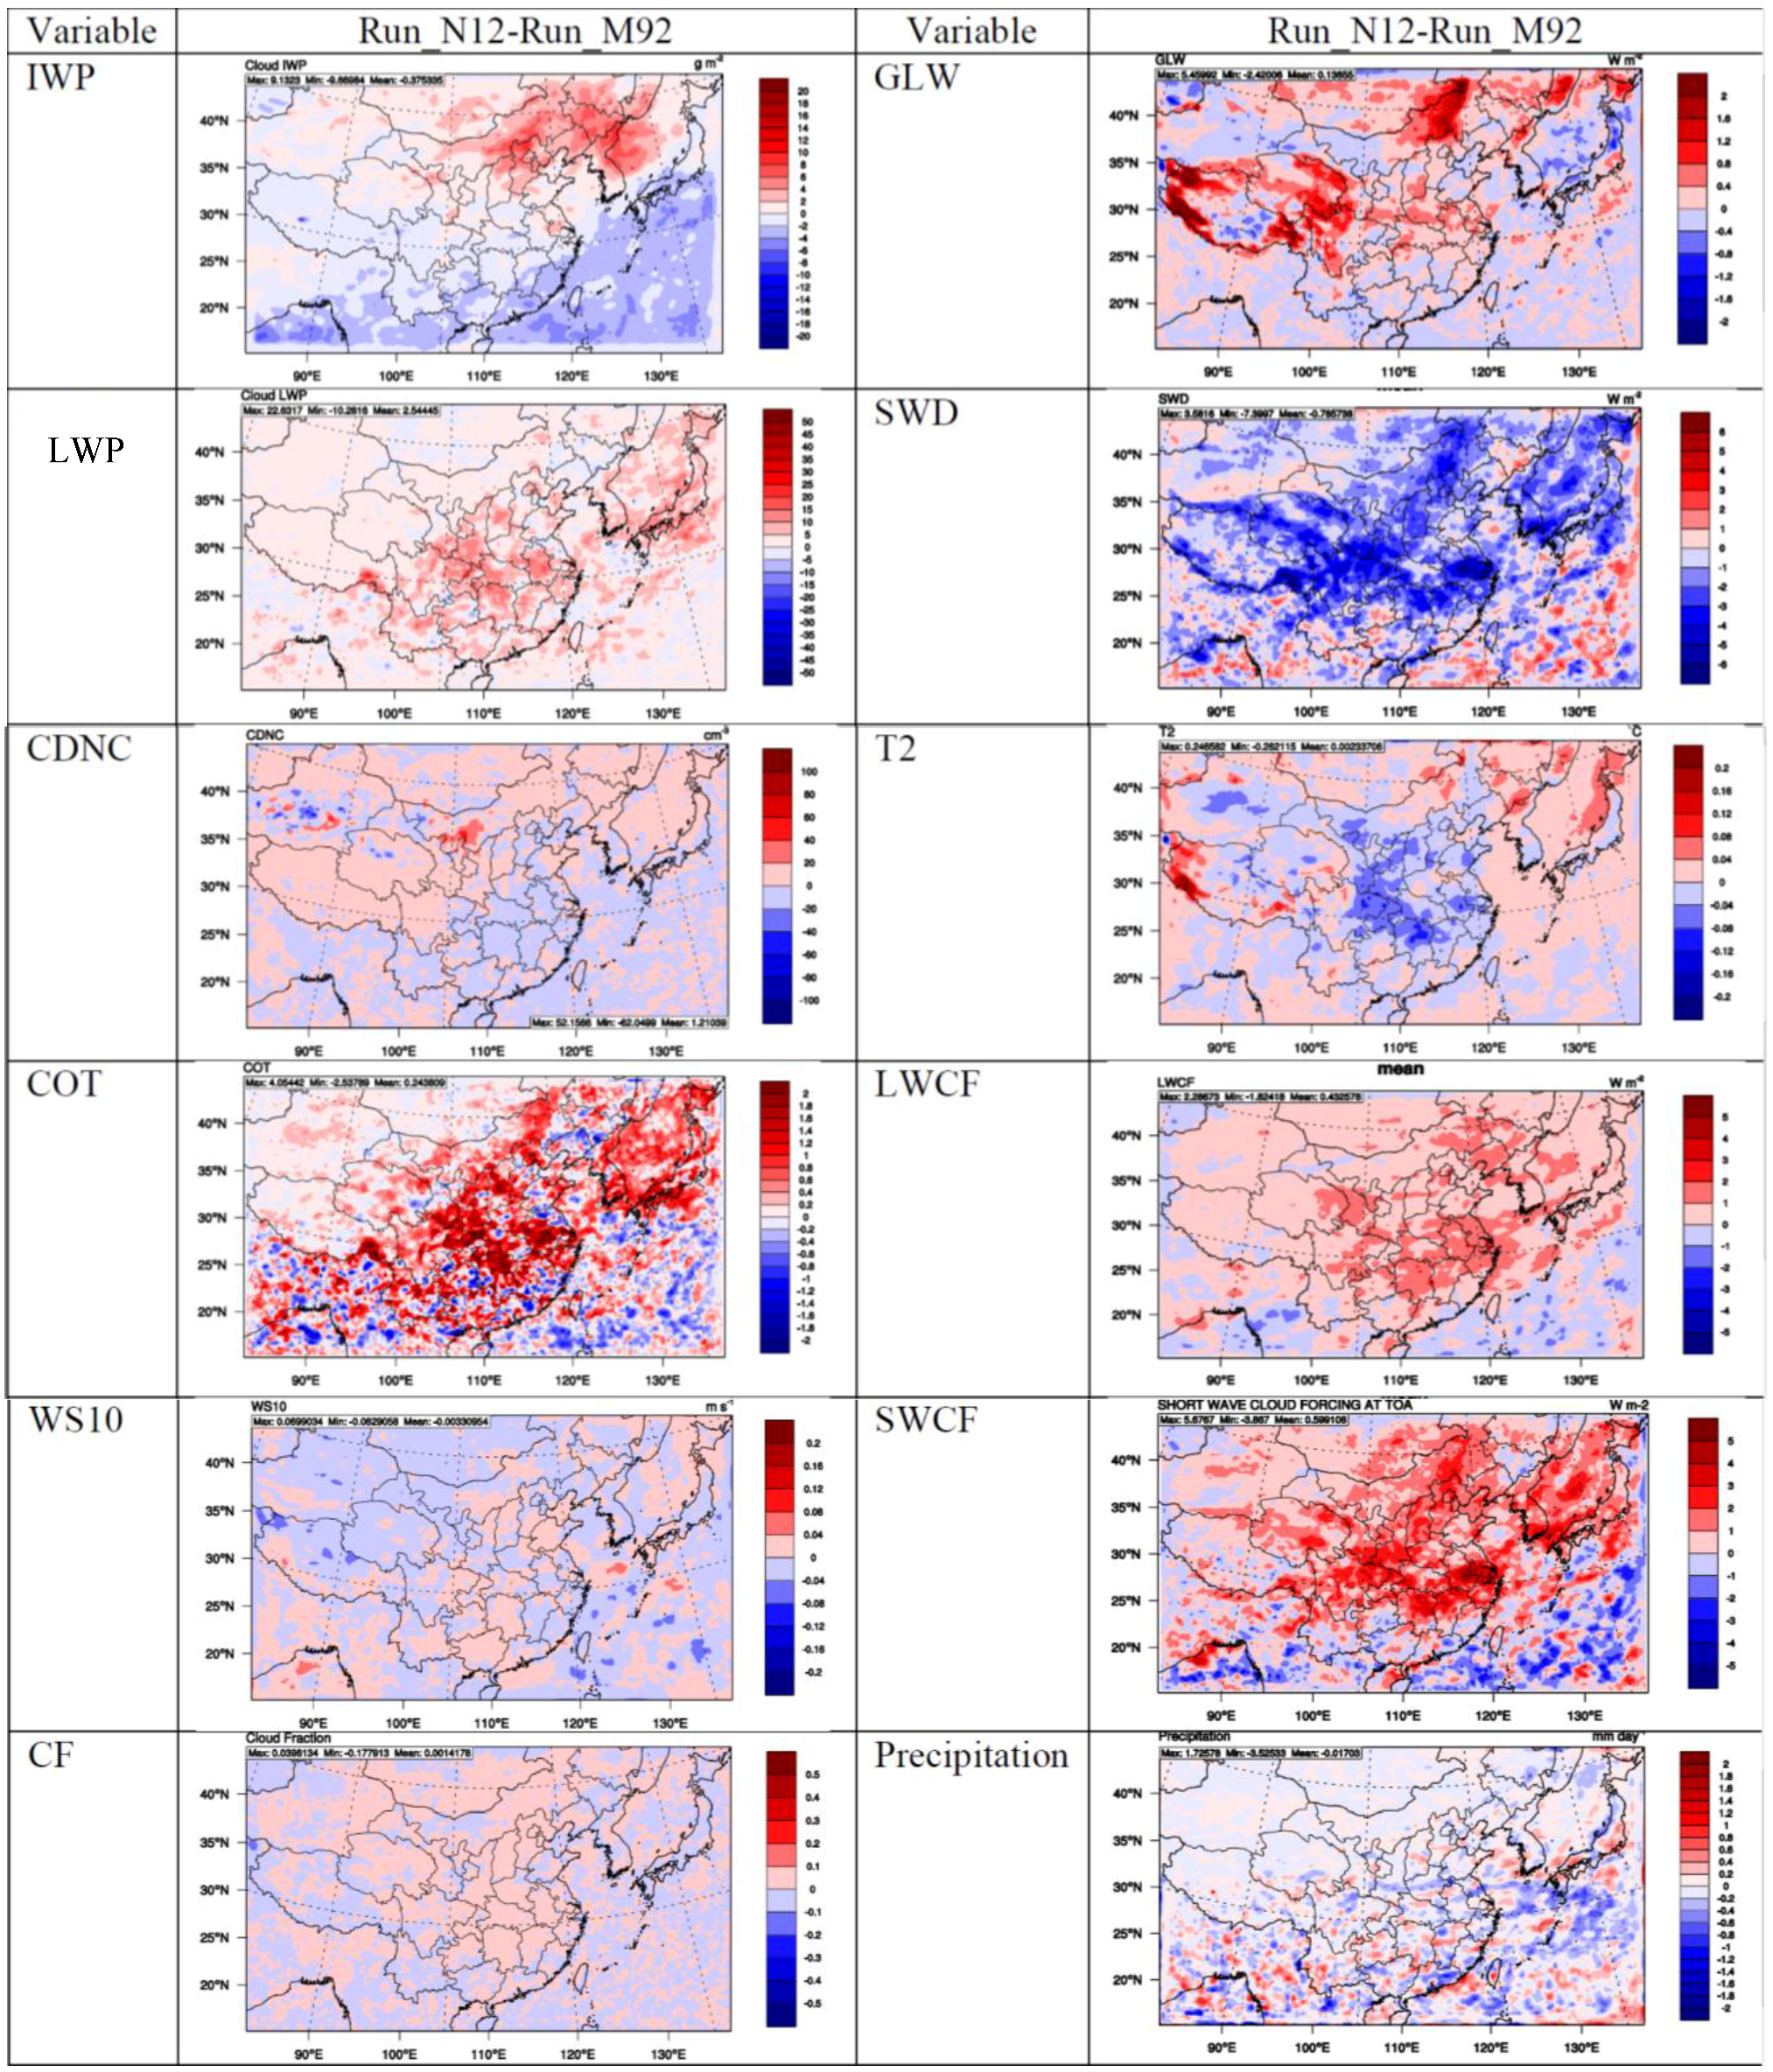
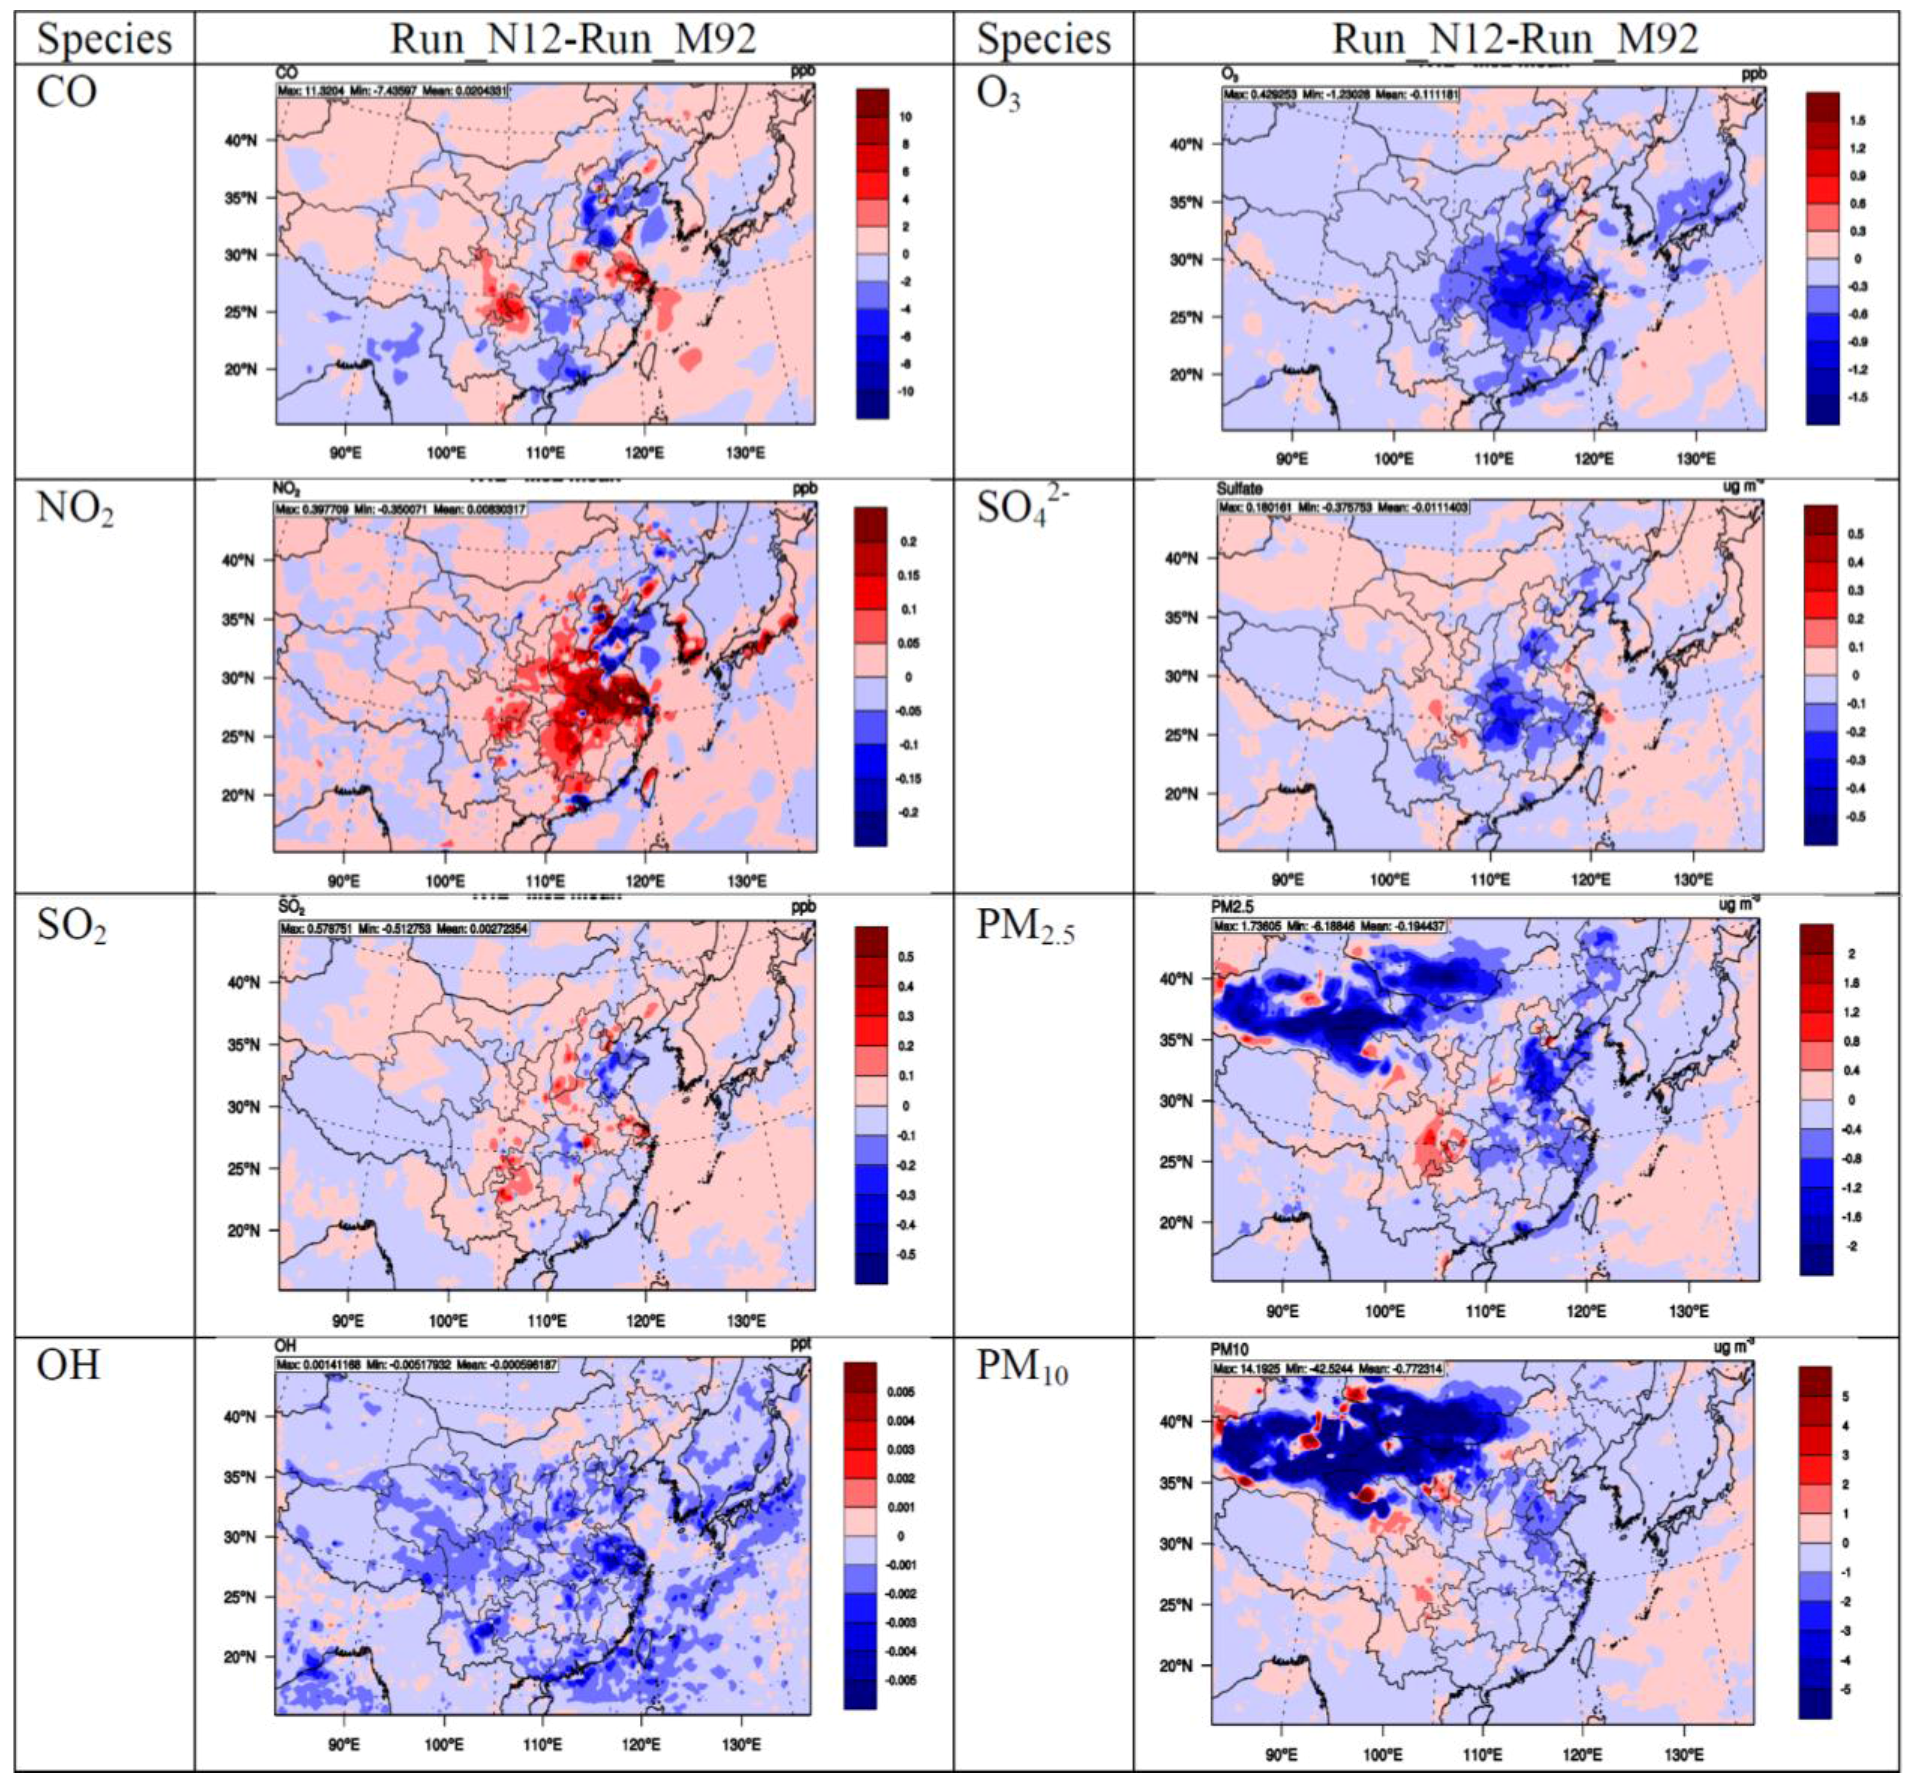
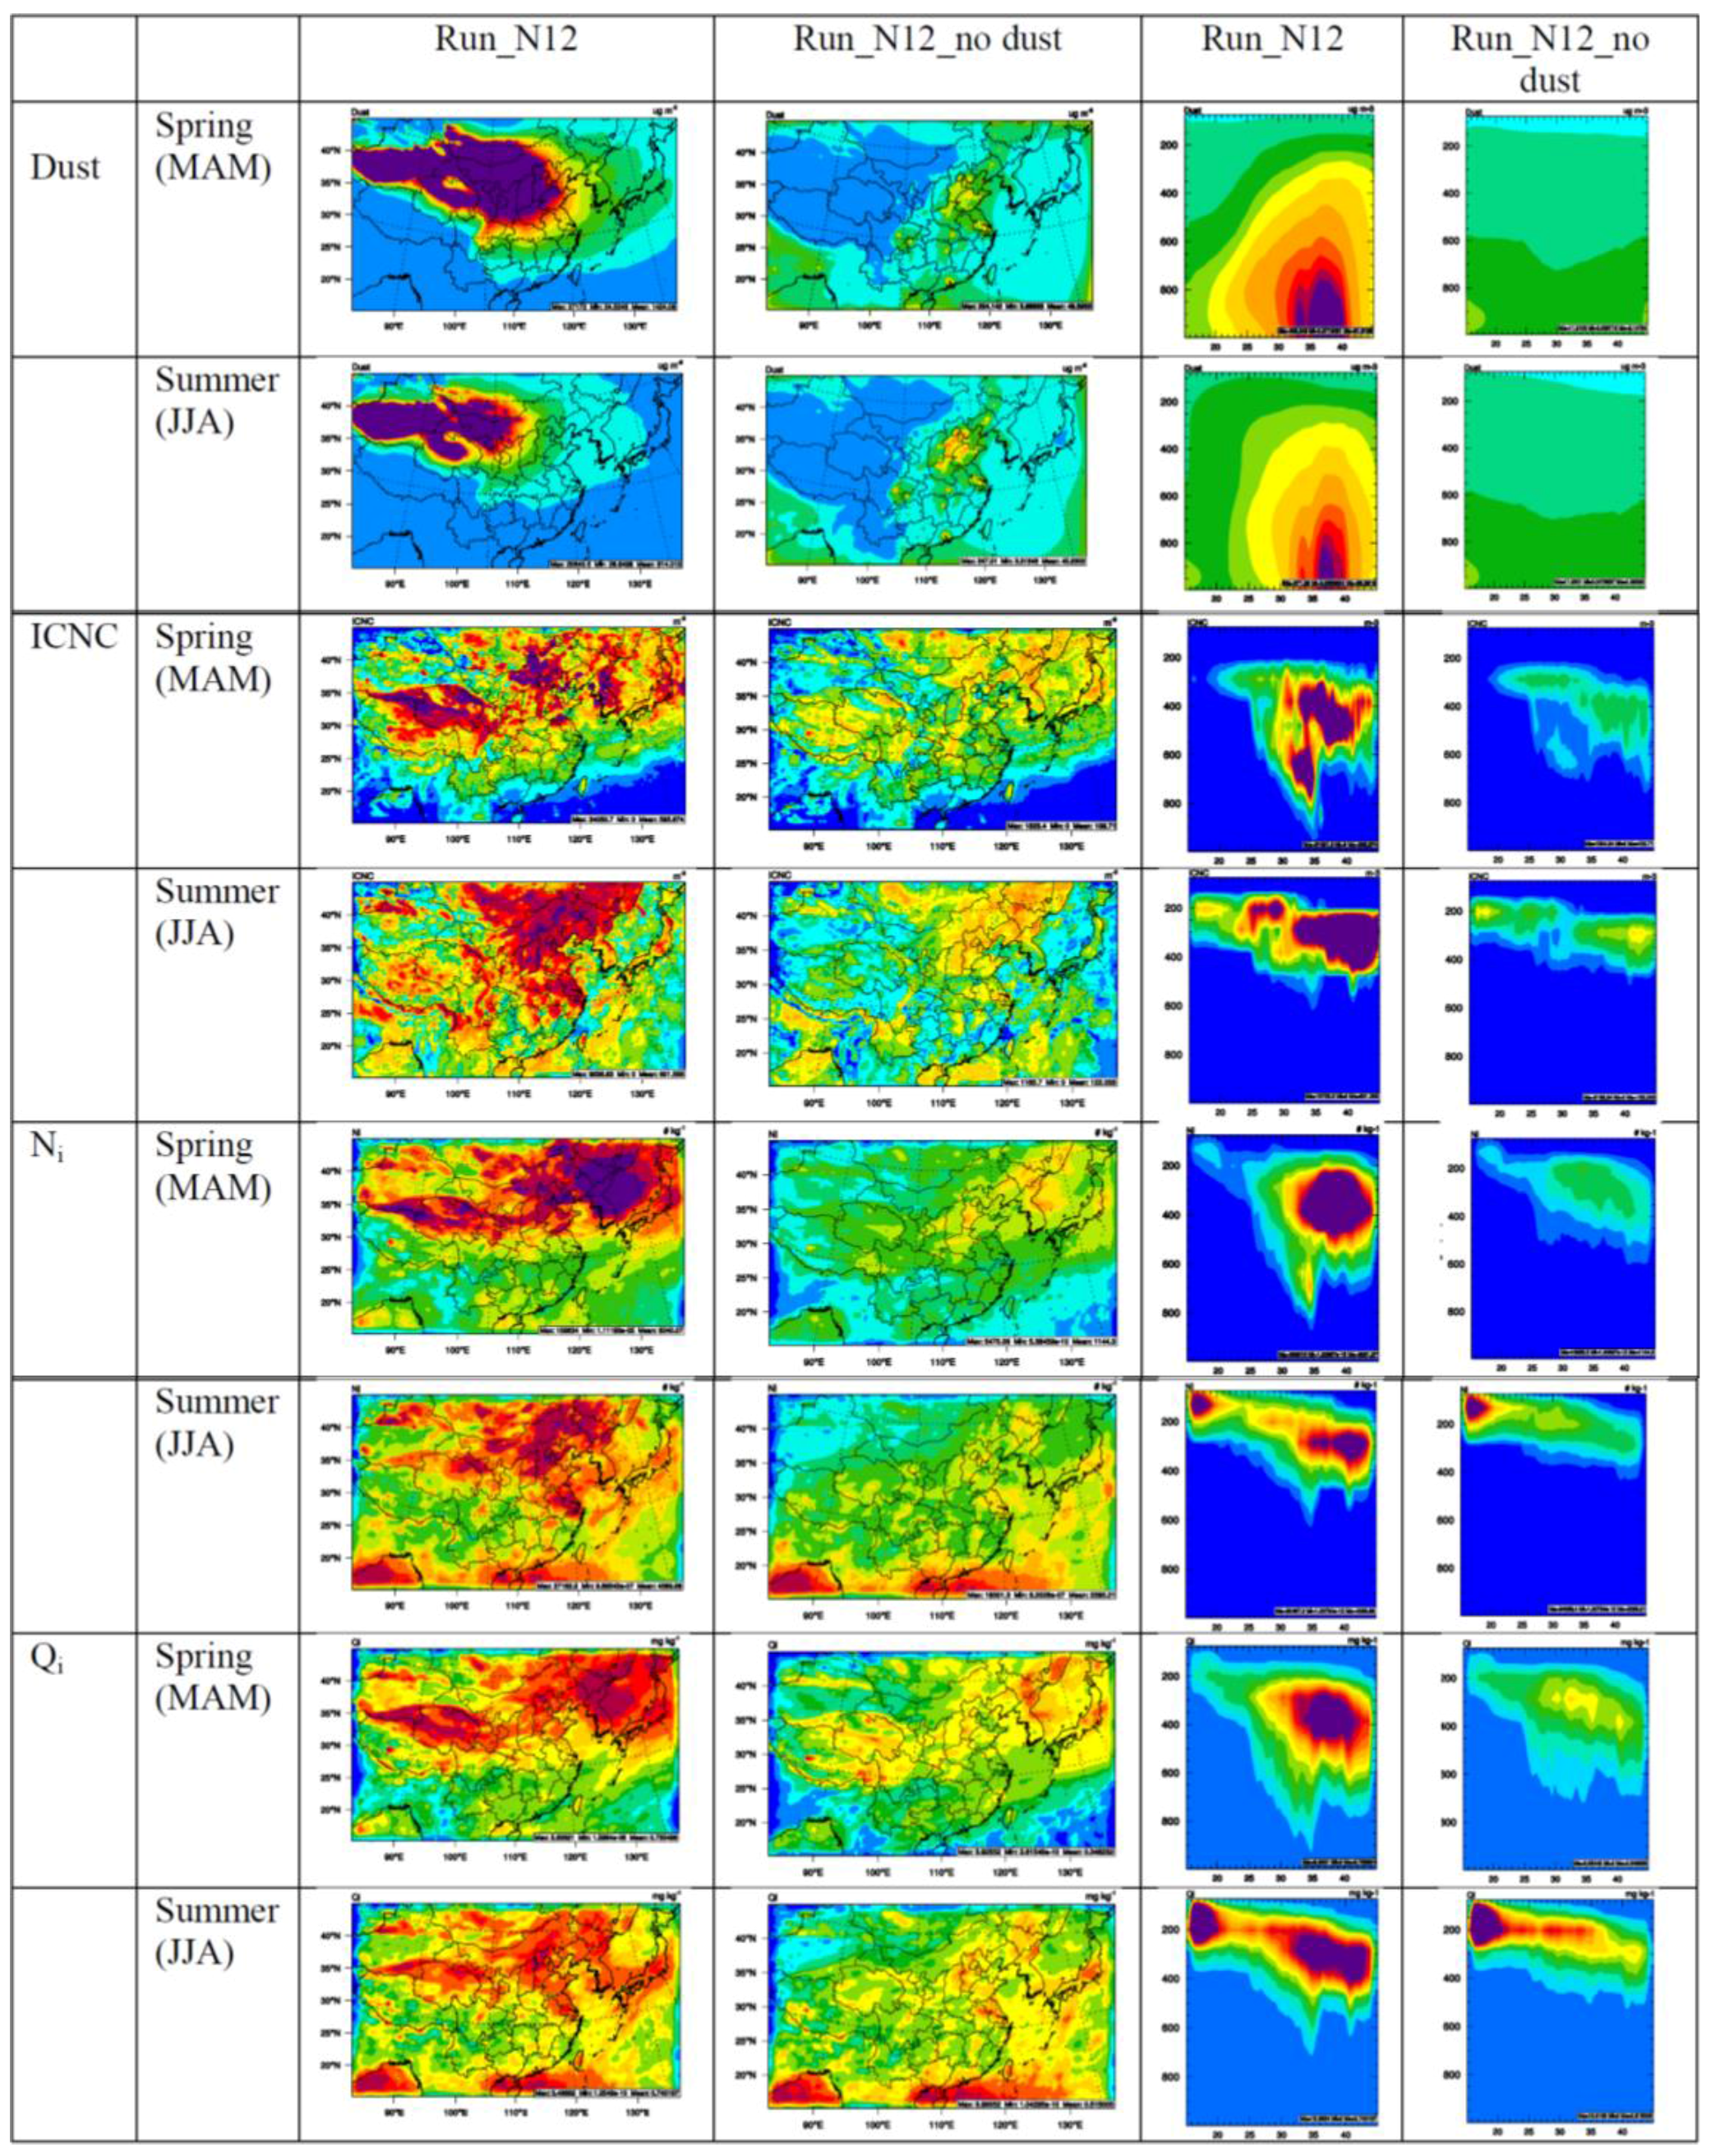
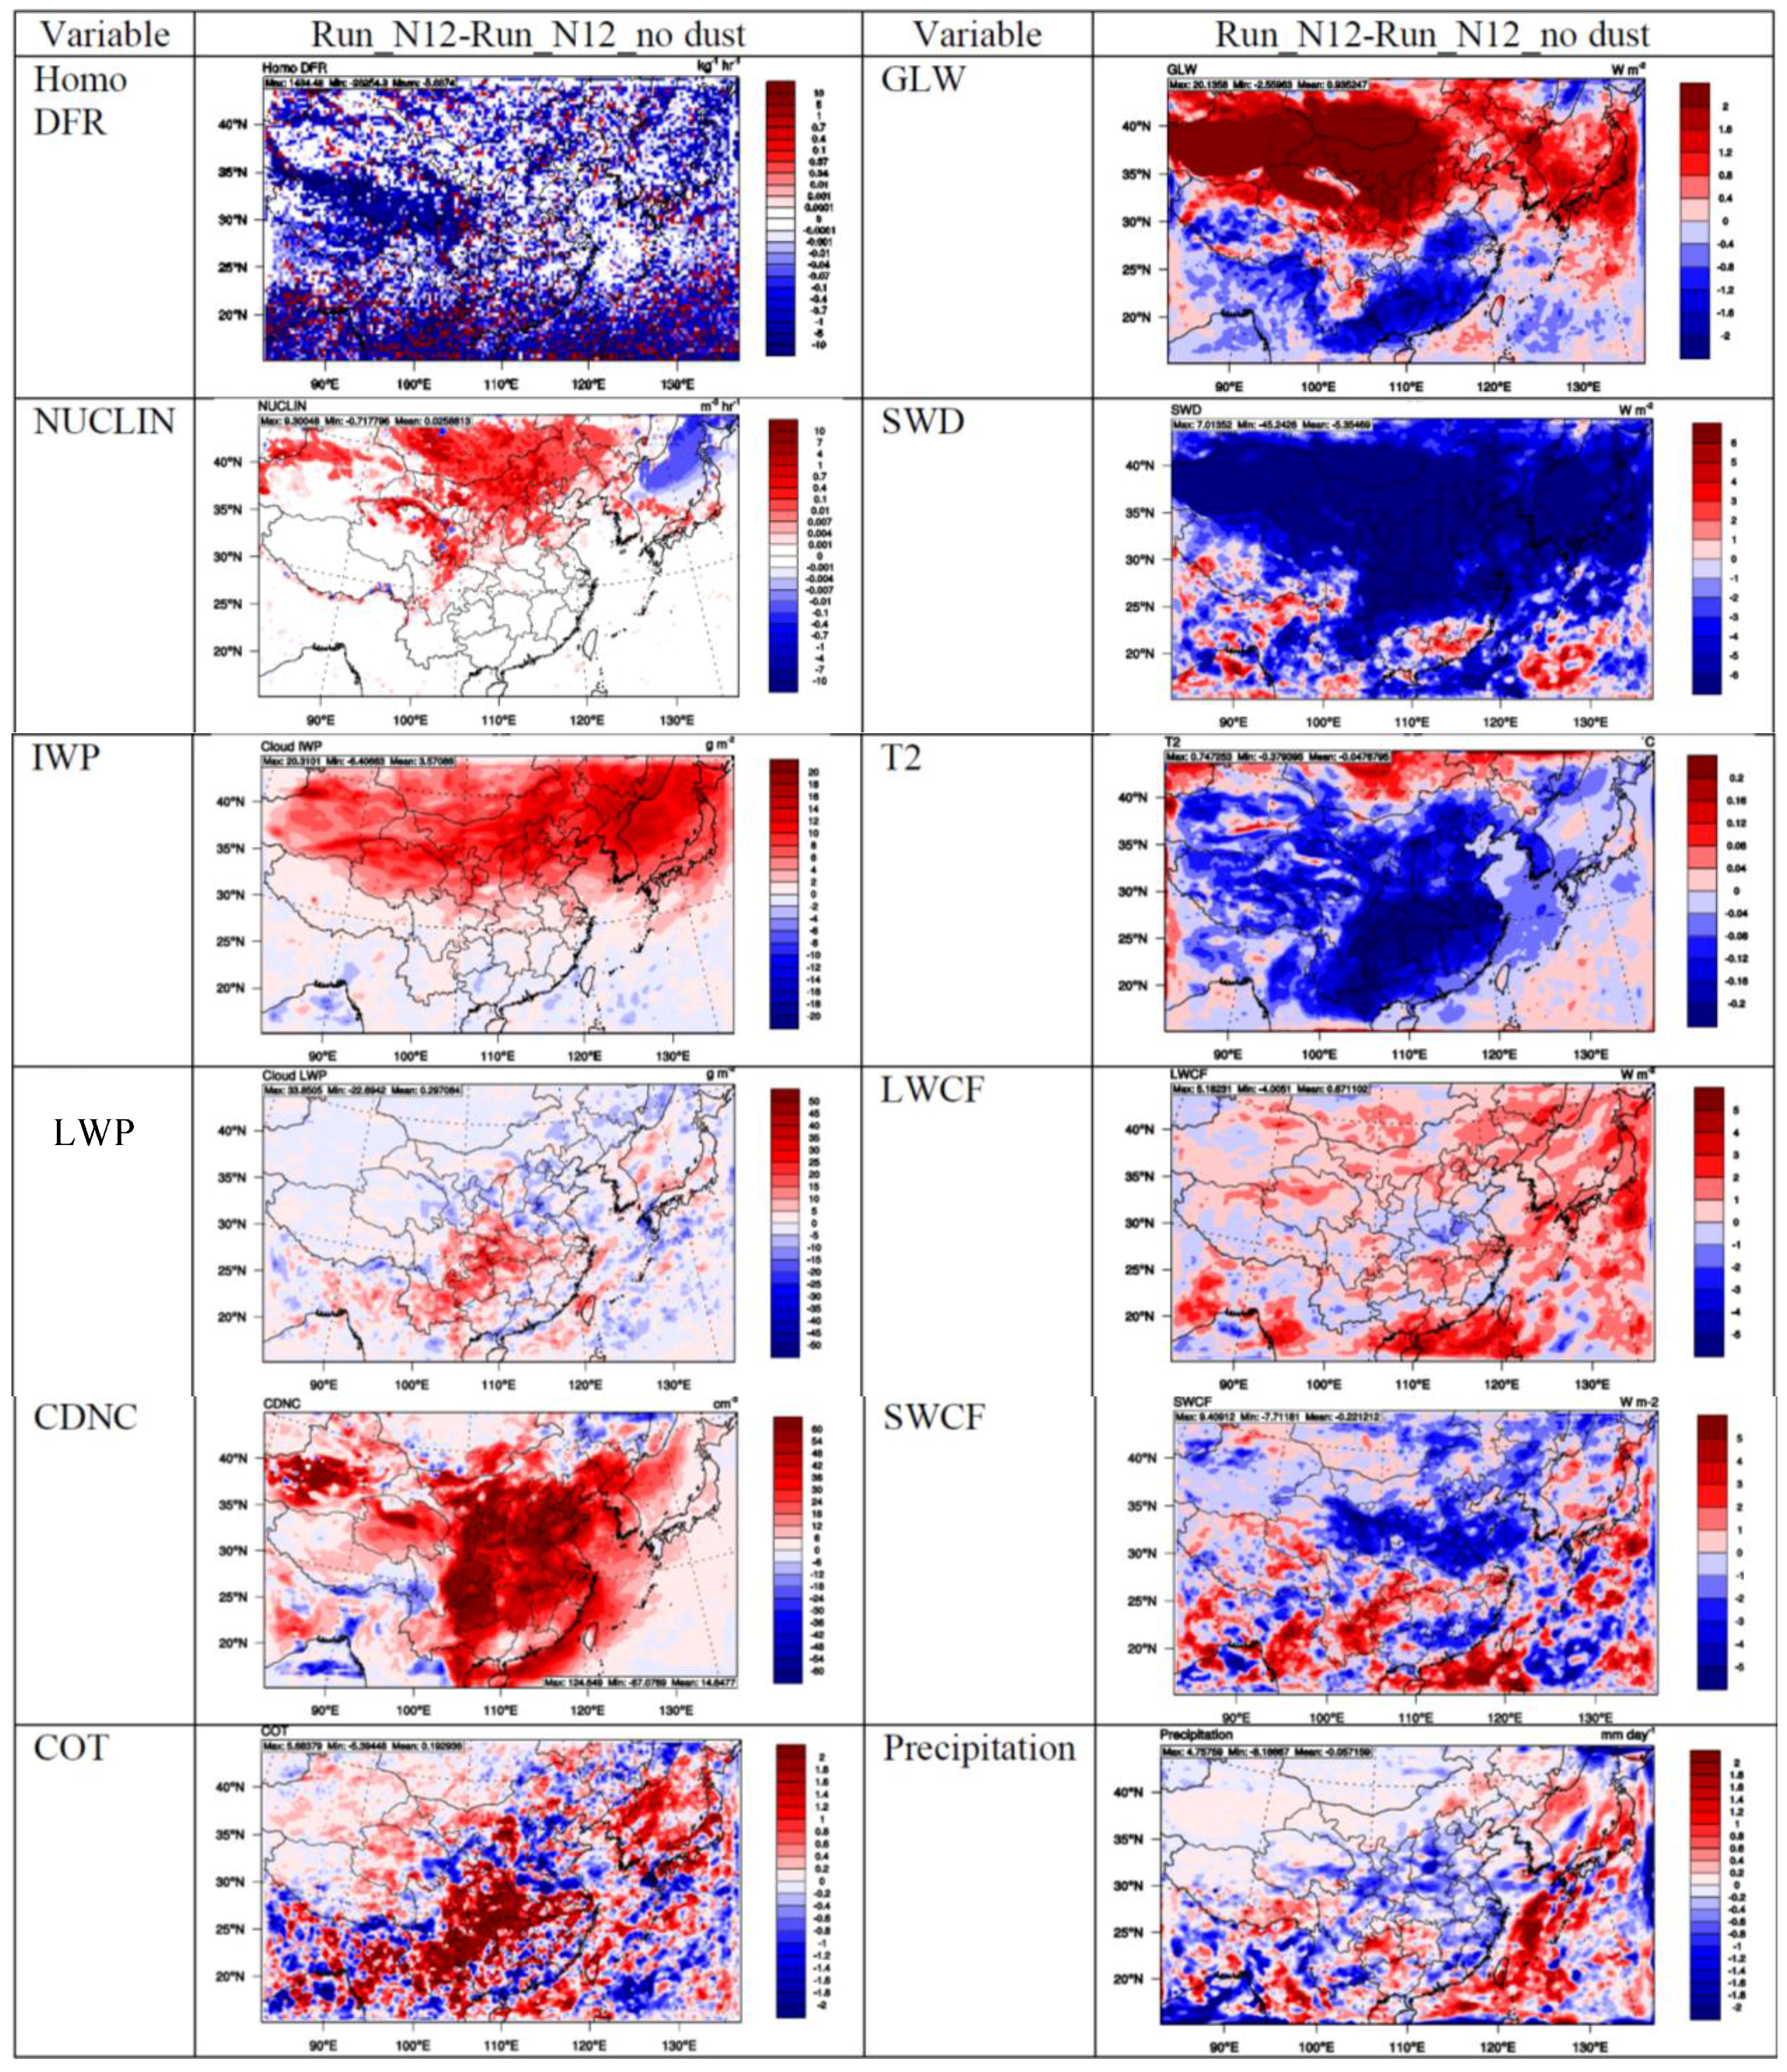
4. Role of Dust Particles in Cloud and Radiation through Direct and Indirect Effects

Dust particles play an important role in precipitation and radiation budget through direct effects and cloud formation by acting as CCN and IN. As shown in Figure 8, when dust emissions are turned off, ICNC, Ni, and Qi are significantly reduced throughout the atmosphere in both spring and summer, especially over the northern domain, indicating the crucial role of dust particles in ice nucleation. The domain mean ICNC is reduced from 595.9 m−3 to 109.7 m−3 (by a factor of 5.4) in spring, and from 601.6 m−3 to 122.0 m−3 (by a factor of 4.9) in summer. The domain mean Ni is reduced from 6240.1 kg−1 to 1144.3 kg−1 (by a factor of 5.5) in spring, and from 4389.9 kg−1 to 2293.2 kg−1 (by a factor of 1.9) in summer. The domain average Qi is reduced from 0.74 mg·kg−1 to 0.35 mg·kg−1 (by a factor of 2.1) in spring, and from 0.74 mg·kg−1 to 0.52 mg·kg−1 (by a factor of 1.4) in summer. Similar reductions occur throughout all model layers in the atmosphere for ICNC, Ni, and Qi. As shown in Figure 9, compared to Run_N12_no dust, Run_N12 increases the annual mean NUCLIN due mainly to ice nucleation induced by dust particles in spring and summer, but it decreases the annual mean Homo DFR because the homogeneous droplet freezing rate is higher in the absence of dust particles, as we explained in Section 3.1. Compared to Run_N12_no dust, Run_N12 increases IWP as a result of increased ICNCs but decreases LWPs in the northern domain due to a more efficient conversion of cloud liquid to ice through the BF process. The activation of dust particles as CCN increases CDNC and COT in most of the domain, as well as LWP in southern China, and some areas in the eastern domain. The annual mean increase of IWP is 3.6 g·m−2 for domain mean (by 39.0%) and can be up to 20.3 g·m−2 (by up to 99.8%). The increases in LWP in southern China, caused by increased cloud liquid water content due to dust-induced CCN, are compensated to some degree by the reduction in the eastern domain, leading to a small domain average increase of 0.3 g·m−2 (by 0.6%) and a maximum increase of 33 g·m−2 (by 76.6%) in LWP. The annual mean increase of CDNCs is 14.6 cm−3 for domain mean (by 12.7%) and can be up to 124.6 cm−3 (by up to 99.7%). The annual mean increase of COT is 0.2 for the domain mean (by 2.3%) and can be up to 5.7 (by up to 61.0%). These changes, coupled with the direct effects of dust particles on radiation, result in an increase in GLW and LWCF but a decrease in SWD, SWCF, T2, and precipitation in most of the domain. GLW increases by 0.9 W·m−2 in the domain mean (by 0.3%) and up to 20.1 W·m−2 (by up to 7.1%) due to dominant increase in the northern domain. SWD decreases by 5.4 W·m−2 (by 2.6%) in the domain mean and up to 6.7 W·m−2 (by up to 3.7%). Accordingly, T2 decreases by 0.05 °C domain mean (by 3.7%) and up to 0.4 °C (by up to a factor of 33709). SWCF decreases by 0.2 W·m−2 domain mean (by 1.7%) and up to 7.9 W·m−2 (by up to a factor of 8950) because the decreases in SWD dominate over the increases in CDNC and COT (although it also increases by up to 9.2 W·m−2 (by up to 82.4%) in Tibet and Yunnan provinces in China and northern Burma). On the other hand, LWCF increases by 0.7 W·m−2 domain mean (by 2.7%) and up to 5.2 W·m−2 (by up to 41.9%). As a consequence of changes in meteorological and cloud parameters, domain mean precipitation decreases by 0.06 mm·day−1 (by 8.9%) and up to 8.2 mm·day−1 (by up to a factor of 57054).
Figure 8. Spatial and zonal mean distributions of dust, ICNC, Ni, and Qi for Run_N12 (with Z03 dust emission scheme) and Run_N12_no dust (without natural dust emissions).
Climate 03 00753 g008
Figure 9. Spatial distributions of absolute differences of Homo DFR, NUCLIN, IWP, LWP, CDNC, COT, GLW, SWD, T2, LWCF, SWCF, and precipitation between Run_N12 (with Z03 dust emission scheme) and Run_N12_no dust (without natural dust emissions).
Climate 03 00753 g009

5. Summary and Conclusions

WRF-CAM5 simulations with two different ice nucleation schemes (i.e., M92 and N12) are conducted over East Asia for two full years, 2006 and 2011. Compared to the simulation with M92, the nucleated ice crystal number concentrations (ICNCs) due to heterogeneous immersion freezing nucleation simulated by N12 are significantly larger in the northern domain, which includes the dust source regions and areas downwind, but significantly lower in the southern domain. The changes in ICNCs due to the use of N12 dominate over the changes in the cloud ice number and mass concentration (Ni and Qi), cloud ice and liquid water path (IWP and LWP), resulting in significant changes in cloud droplet number concentrations and cloud optical depths (CDNCs and COTs) with significantly larger CDNCs and COTs simulated by N12 over the northern domain, and moderately smaller CDNCs and COTs simulated by N12 over the southern domain. The downward longwave radiation increases and the downward shortwave radiation decreases over most of the domain. Cloud radiative forcing is sensitive to the changes of cloud properties, with stronger LWCF (by 0.43 W·m−2 domain mean and up to 2.3 W·m−2) and SWCF (by 0.6 W·m−2 domain mean and up to 5.7 W·m−2) in Run_N12. The decrease of SWD corresponds to the increase of SWCF in Run_N12. The net cooling from the changes in cloud radiative forcing leads to a decrease (~0.3 °C) of T2. In addition, the changes in ICNCs, Ni, and Qi result in changes in precipitation. The net effects of changes in radiation, temperature, and precipitation lead to lower surface concentrations of OH, O3, SO42−, PM2.5, but higher surface concentrations of CO, NO2, and SO2 over most of the domain. The mixed-phase ice nucleation has significant impacts on cirrus clouds; that is, increasing ice nucleation rates in mixed-phase enhances ice nucleation in cirrus clouds through stronger convection, which transports more water vapor to the upper levels. The use of different heterogeneous INPs may lead to different model performance due to changes in the relevant variables. Compared to the simulation with M92, the simulation with N12 gives slightly worse performance for precipitation against NCDC data, CDNC and AOD against MODIS data, and GLW against CERES data but slightly better performance for LWP, CF, COT against MODIS data and SWD, SWCF, and LWCF against CERES data. Note that since N12 was developed for dust particles, it might not be applicable in the regions such as southern and eastern China where other IN types (e.g., black carbon or biological particles) dominate. On the other hand, M92 was developed based on field measurements at the mid-latitude, so it might not be applicable to dust regions such as northern China studied here. Hence, accurately representing ice nucleation for different regions with different IN types remains a major challenge to better simulate regional climate and air quality.
The sensitivity simulation shows that dust particles play an important role in radiation budget and cloud formation through both direct and indirect effects. Dust particles can increase ICNCs by up to a factor of 5.4, Ni by a factor of 5.5, and Qi by a factor of 2.1 during the dust seasons. They can increase the annual domain mean values in East Asia for IWP by 3.6 g·m−2 (by 71.4%), CDNC by 14.6 cm−3 (by 12.7%), COT by 0.2 (by 3.0%), GLW by 0.9 W·m−2 (by 0.4%), and LWCF by 0.6 W·m−2 (by 3.0%). They can also decrease the annual domain mean values of SWD by 5.8 W·m−2 (by 2.6%), SWCF by 0.4 W·m−2 (by 1.2%), T2 by 0.05 °C domain mean (by 3.7%), and precipitation by 0.1 mm·day−1 (by 0.3%). The impacts of dust particles on LWP are more complicated. They can increase LWP by acting as CCN for mixed-phase cloud formation and also decrease LWP by acting as IN due to more efficient conversion of cloud liquid to ice through the Bergeron–Findeisen process that competes with the dust role as CCN.
These results indicate the importance of the heterogeneous ice nucleation treatments in simulating regional climate and air quality as well as the sensitivity and uncertainty of the model predictions associated with such treatments. Our results in Parts I and II clearly indicate a need to obtain meteorological and chemical measurements for model validation, improve the emission inventories, and reduce the simplifications, the number of assumptions, and uncertainties associated with the model treatments, particularly, in the model treatments of aerosol-cloud interactions, which are very complicated yet have a large impact on projected climate change. In particular, more studies are needed to further investigate the impacts of ice nucleation treatments on climate and regional air quality in the future, as well as the relevant processes and factors involved in the ice nucleation schemes. For example, this work illustrates the importance of dust particles in simulating ice nucleation processes and resulting cloud formation. It is therefore very important to evaluate and improve the capability of dust emission schemes used in the model in order to accurately reproduce the observed dust emissions and concentrations. In addition to dust particles, other particles such as black carbon and biological particles can also serve as an effective IN for which the M92 and N12 INPs do not account for. It would be useful to evaluate additional INPs (e.g., [26,33]) that account for black carbon, biological particles, and other dependent factors such as chemical aging of particles and surface coatings in simulating ice nucleation processes.

Acknowledgments

This research was supported by the Office of Science, DOE Regional and Global Climate Modeling Program (DE-SC0006695 at NCSU and KP1703000 at PNNL) and China’s National Basic Research Program (2010CB951803 at NCSU). Simulations were performed on Kraken/Stampede, provided as an Extreme Science and Engineering Discovery Environment (XSEDE) digital service by the Texas Advanced Computing Center (TACC), supported by National Science Foundation grant number OCI-1053575, and Hopper at the National Energy Research Scientific Computing Center (NERSC), supported by the Office of Science of the U.S. Department of Energy under Contract No. DE-AC02-05CH11231. Thanks are due to Jian He, a graduate student at NCSU, for making some figures. Pacific Northwest National Laboratory is operated for DOE by Battelle Memorial Institute under contract DE-AC05-76RL01830.

Author Contributions

Yang Zhang designed the study, and wrote large portions of the manuscript. Ying Chen performed all model simulations and evaluation, data processing, and plotting, and contributed to some writing of the manuscript. Jiwen Fan and Ruby Leung provided WRF-CAM5, contributed to simulation designs, interpretation of the results, and some writing of the manuscript.

Conflicts of Interest

The authors declare no conflict of interest.

References

  1. Niemand, M.; Mohler, O.; Vogel, B.; Vogel, H.; Hoose, C.; Connolly, P.; Klein, H.; Bingemer, H.; DeMott, P.; Skrotzki, J.; Leisner, T. A particle-surface-area-based parameterization of immersion freezing on desert dust particles. J. Atmos. Sci. 2012, 69, 3077–3092. [Google Scholar] [CrossRef]
  2. Meyers, M.P.; DeMott, P.J.; Cotton, W.R. New primary ice-nucleation parameterizations in an explicit cloud model. J. Appl. Meteorol. 1992, 31, 708–721. [Google Scholar] [CrossRef]
  3. Pruppacher, H.R.; Klett, J.D. Microphysics of Clouds and Precipitation; Atmospheric and Oceanographic Sciences Library; Kluwer Academic Publishers: Dordrecht, the Netherlands, 1997. [Google Scholar]
  4. Morrison, H.; Gettelman, A. A new two-moment bulk stratiform cloud microphysics scheme in the Community Atmosphere Model, Version 3 (CAM3). Part I: Description and numerical tests. J. Clim. 2008, 21, 3642–3659. [Google Scholar] [CrossRef]
  5. Rogers, R.R.; Yau, M.K. A Short Course in Cloud Physics; Pergamon Press: Oxford, UK, 1989. [Google Scholar]
  6. DeMott, P.J.; Prenni, A.J.; Liu, X.; Kreidenweis, S.M.; Petters, M.D.; Twohy, C.H.; Richardson, M.S.; Eidhammer, T.; Rogers, D.C. Predicting global atmospheric ice nuclei distributions and their impacts on climate. Proc. Natl. Acad. Sci. USA 2010, 107, 11217–11222. [Google Scholar] [CrossRef] [PubMed]
  7. Murray, B.J.; O’Sullivan, D.; Atkinson, J.D.; Webb, M.E. Ice nucleation by particles immersed in supercooled cloud droplets. Chem. Soc. Rev. 2012, 41, 6519–6554. [Google Scholar] [CrossRef] [PubMed]
  8. Fan, J.; Ovtchinnikov, M.; Comstock, J.; McFarlane, S.A.; Khain, A. Ice formation in Arctic mixed-phase clouds—Insights from a 3-D cloud-resolving model with size-resolved aerosol and cloud microphysics. J. Geophys. Res. 2009. [Google Scholar] [CrossRef]
  9. Fan, J.; Leung, L.R.; DeMott, P.J.; Comstock, J.M.; Singh, B.; Rosenfeld, D.; Tomlinson, J.M.; White, A.; Prather, K.A.; Minnis, P.; Ayers, J.K.; Min, Q. Aerosol impacts on California winter clouds and precipitation during CalWater 2011: Local pollution versus long-range transported dust. Atmos. Chem. Phys. 2014, 14, 81–101. [Google Scholar] [CrossRef]
  10. Khain, A.; Rosenfeld, D.; Pokrovsky, A. Aerosol impact on the dynamics and microphysics of deep convective clouds. Q. J. R. Meteorol. Soc. 2005, 131, 2639–2663. [Google Scholar] [CrossRef]
  11. Fan, J.; Zhang, R.; Li, G.; Tao, W.-K. Effects of aerosols and relative humidity on cumulus clouds. J. Geophys. Res. 2007. [Google Scholar] [CrossRef]
  12. Fan, J.; Leung, L.R.; Rosendeld, D.; Chen, Q.; Li, Z.; Yu, H.; Zhang, J. Microphysical effects determine macrophysical response for aerosol impacts on deep convective clouds. Proc. Natl. Acad. Sci. USA 2013. [Google Scholar] [CrossRef] [PubMed]
  13. Wegener, A. Thermodynamik der Atmosphare; J. A. Barth: Leipzig, Poland, 1911. [Google Scholar]
  14. Bergeron, T. On the physics of clouds and precipitation. In Proces Verbaux de l’Association de Meteorologie; International Union of Geodesy and Geophysics: Prague, Czech, 1935; pp. 156–178. [Google Scholar]
  15. Findeisen, W. Kolloid-meteorologische Vorg€ange bei Neiderschlags-bildung. Meteorol. Z. 1938, 55, 121–133. [Google Scholar]
  16. DeMott, P.J. An exploratory study of ice nucleation by soot aerosols. J. Appl. Meteorol. 1990, 29, 1072–1079. [Google Scholar] [CrossRef]
  17. Chen, Y.; KreidenweisL, S.M.; McInnes, M.; Rogers, D.C.; DeMott, P.J. Single particle analyses of ice nucleating aerosols in the upper troposphere and lower stratosphere. Geophys. Res. Lett. 1998, 25, 1391–1394. [Google Scholar] [CrossRef]
  18. Heintzenberg, J.; Okada, K.; Strom, J. On the composition of non-volatile material in upper tropospheric aerosols and cirrus crystals. Atmos. Res. 1996, 41, 81–88. [Google Scholar] [CrossRef]
  19. Targino, A.C.; Krejci, R.; Noone, K.J.; Glantz, P. Single particle analysis of ice crystal residuals observed in orographic wave clouds over Scandinavia during INTACC experiment. Atmos. Chem. Phys. 2006, 6, 1977–1990. [Google Scholar] [CrossRef]
  20. Sokolik, I.N.; Toon, O.B. Direct radiative forcing by anthropogenic airborne mineral aerosol. Nature 1996, 381, 681–683. [Google Scholar] [CrossRef]
  21. Sassen, K. Indirect climate forcing over the western US from Asian dust storms. Geophys. Res. Lett. 2002, 29. [Google Scholar] [CrossRef]
  22. Prenni, A.J.; DeMott, P.J.; Kreidenweis, S.M.; Harrington, J.Y.; Avramov, A.; Verlinde, J.; Tjernström, M.; Long, C.N.; Olsson, P.Q. Can ice-nucleating aerosols affect arctic seasonal climate? B Am. Meteorol. Soc. 2007, 88, 541–550. [Google Scholar] [CrossRef]
  23. Bigg, E.K. The formation of atmospheric ice crystals by the freezing of droplets. Q. J. R. Meteorol. Soc. 1953, 79, 510–519. [Google Scholar] [CrossRef]
  24. Fletcher, N.H. The Physics of Rainclouds; Cambridge University Press: Cambridge, UK, 1962. [Google Scholar]
  25. Cotton, W.; Tripoli, G.; Rauber, R.; Mulvihill, E. Numerical simulation of the effects of varying ice crystal nucleation rates and aggregation processes on orographic snowfall. J. Clim. Appl. Meteorol. 1986, 25, 1658–1680. [Google Scholar] [CrossRef]
  26. Phillips, V.T.J.; DeMott, P.J.; Andronache, C.; Pratt, K.A.; Prather, K.A.; Subramanian, R.; Twohy, C. Improvements to an empirical parameterization of heterogeneous ice nucleation and its comparison with observations. J. Atmos. Sci. 2013, 70, 378–409. [Google Scholar] [CrossRef]
  27. Liu, X.H.; Penner, J.E.; Ghan, S.; Wang, M. Inclusion of ice microphysics in the NCAR Community Atmospheric Model Version 3 (CAM3). J. Clim. 2007, 20, 4526–4547. [Google Scholar] [CrossRef]
  28. Young, K.C. The role of contact nucleation in ice phase initiation. J. Atmos. Sci. 1974, 31, 768–776. [Google Scholar] [CrossRef]
  29. Fan, J.; Lim, K.-S.; Leung, L.R.; Zhao, C.; Ma, P.-L.; Zhang, K.; Liu, X.-H.; Yang, Q. Impacts of Uncertainty in Ice Nucleation Parameterizations and Dust on Modeling Deep Convective Clouds and Precipitation; The 2014 ASR Fall Working Groups: Bethesda, MD, USA, 2014. [Google Scholar]
  30. Zender, C.S.; Bian, H.; Newman, D. Mineral Dust Entrainment and Deposition (DEAD) model: Description and 1990s dust climatology. J. Geophys. Res. 2003. [Google Scholar] [CrossRef]
  31. Zhang, G.J.; McFarlane, N.A. Sensitivity of climate simulations to the parameterization of cumulus convection in the Canadian Climate Centre General Circulation Model. Atmos. Ocean 1995, 33, 407–446. [Google Scholar]
  32. Song, X.; Zhang, G.J. Microphysics parameterization for convective clouds in a global climate model: Description and single column model tests. J. Geophys. Res. 2011. [Google Scholar] [CrossRef]
  33. DeMott, P.J.; Prenni, A.J.; McMeeking, G.R.; Sullivan, R.C.; Petters, M.D.; Tobo, Y.; Niemand, M.; Möhler, O.; Snider, J.R.; Wang, Z.; Kreidenweis, S.M. Integrating laboratory and field data to quantify the immersion freezing ice nucleation activity of mineral dust particles. Atmos. Chem. Phys. 2015, 15, 393–409. [Google Scholar] [CrossRef]

