
A Novel Bias Correction Method for Extreme Events
by
 , ,
, ,
Laura Trentini
1 ,
,
Sara Dal Gesso
1, 
Marco Venturini
1, 
Federica Guerrini
1,
Sandro Calmanti
2 and
Marcello Petitta
1,3,* 1
Amigo s.r.l., Via Flaminia 48, 00196 Rome, Italy
2
Energy & Environment Modeling Unit, Climate & Impact Modeling Laboratory, ENEA Agenzia Nazionale Per le Nuove Tecnologie, L’energia e lo Sviluppo Economico Sostenibile, Via Anguillarese 301, 00123 Rome, Italy
3
Department of Enterprise Engineering, University of Rome Tor Vergata, 00133 Rome, Italy
*
Author to whom correspondence should be addressed.
Climate 2023, 11(1), 3; https://doi.org/10.3390/cli11010003
Submission received: 29 November 2022
/
Revised: 16 December 2022
/
Accepted: 20 December 2022
/
Published: 23 December 2022
(This article belongs to the Special Issue Seasonal Forecasting Climate Services for the Energy Industry)
Abstract
:When one is using climate simulation outputs, one critical issue to consider is the systematic bias affecting the modelled data. The bias correction of modelled data is often used when one is using impact models to assess the effect of climate events on human activities. However, the efficacy of most of the currently available methods is reduced in the case of extreme events because of the limited number of data for these low probability and high impact events. In this study, a novel bias correction methodology is proposed, which corrects the bias of extreme events. To do so, we extended one of the most popular bias correction techniques, i.e., quantile mapping (QM), by improving the description of extremes through a generalised extreme value distribution (GEV) fitting. The technique was applied to the daily mean temperature and total precipitation data from three seasonal forecasting systems: SEAS5, System7 and GCFS2.1. The bias correction efficiency was tested over the Southern African Development Community (SADC) region, which includes 15 Southern African countries. The performance was verified by comparing each of the three models with a reference dataset, the ECMWF reanalysis ERA5. The results reveal that this novel technique significantly reduces the systematic biases in the forecasting models, yielding further improvements over the classic QM. For both the mean temperature and total precipitation, the bias correction produces a decrease in the Root Mean Squared Error (RMSE) and in the bias between the simulated and the reference data. After bias correcting the data, the ensemble forecasts members that correctly predict the temperature extreme increases. On the other hand, the number of members identifying precipitation extremes decreases after the bias correction.
1. Introduction
The raw output of regional and global climate models can be used without any further processing to analyse long-term tendencies (e.g., decadal time scale and beyond it) and short-term anomalies (e.g., from seasonal to decadal time scales). However, a climate model output necessarily requires preliminary processing to remove any systematic error before being used for climate impact studies on human activities (such as those in agriculture, energy, health, safety and infrastructure, etc.) [1,2]. Impact models often describe processes of a different nature, yet they are closely related to climate variables, which depend on specific critical thresholds linked to well-defined numerical values of environmental parameters. Examples include the modelling of biological systems, including agronomic models [3] or models for the diffusion of pests and diseases, or the modelling of landslides [4] and flash floods [5]. Another possible application is the prediction of catastrophic events such as the disastrous avalanche that occurred at Chamoli in the Indian Himalayas in February 2021 [6].
Bias correction algorithms are specifically designed to remove systematic model errors, or biases, and enable direct interfacing between climate models and impact models. A systematic error is a known artefact of a numerical climate model, which is produced by undefined mechanisms related to the complex nature of the model itself, such as the interaction between the different components of a climate model, or the use of approximations to model the physics of fundamental processes. Systematic errors entail, for example, unrealistic, constant drifts of climate variables (e.g., temperature), which generally require the simple removal of the cumulated difference (delta) between the model and observations. Another example is the misrepresentation of the statistical distribution of the climate variables, which can be adjusted by remapping the model output to some reference statistical distribution [5,7]. More sophisticated bias correction algorithms may impose specific properties to the model output, such as the constraint to specific spatial patterns [8]. Another class of bias correction methods ensures that model outputs correctly represent the interdependence of related climate variables, such as temperature [9] and precipitation, in order to retain physical coherence (e.g., [10,11]).
One of the key resources for the processing of climate data is the R package CSTools [12]. It includes several implementations of bias correction methods, which represent a rather comprehensive portfolio of widely employed options. As a first example, it encompasses the approach by Torralba et al. [13], which is aimed at correcting only the mean bias. Different to this one, Van Schaeybroeck and Vannitsem [14] used a variance inflation technique to correct, at the same time, the mean bias and the variance of the signal. The method by Doblas-Reyes [15] also corrects the ensemble spread by minimising a constrained mean squared error. With a similar idea, Van Schaeybroeck [16] minimized also the ranked probability score. Eade et al. [17] corrected the seasonal and decadal forecasts by working on the variance and imposing that the ratio of the predictable components is equal to one. To conclude, Crespi et al. [18] proposed a quantile mapping method for seasonal forecast, called B-QM, which at the same time corrects the bias and downscales the data to a resolution that is comparable with the one of the reanalysis ERA5.
Other conventional techniques for adjusting climate variables include the Delta Method [19], which corrects the model outputs using the spatial interpolation of the anomalies. Moreover, it is worth mentioning the multiple linear regression method [20], which performs a regression analysis using observations and climate model outputs from the past and constructs bias-adjusted future time series using the regression parameters. Parallel to this, an assessment of the data quality and model performance has been the subject of recent scientific research, and new assessment techniques have been developed, such as the CCHZ-DISO method (by Chen, Chen, Hu and Zho who observed the distance between indices of simulation and observation) [21]. Among all of the existing methods, one of the most popular ones is doubtlessly the quantile mapping approach [22]. Such a method is often used for bias correcting climate data which are employed as inputs for climate impact models. Because of its wide use, the concept behind this technique are an optimal starting point for further elaboration.
This paper aims at responding to the needs of risk assessment studies, focusing on the impact of extreme events, with a particular focus on applications where the climate model output is fed into impact models with a critical dependence on a specific threshold. To this end, we designed a novel bias correction method to consistently correct extreme events of temperature and precipitation. Indeed, one of the limitations of bias correction methods based on quantile mapping is that they show poor performance when they are dealing with the tails of Cumulative Distribution Functions (CDFs) [23], where low-probability extreme events are found. Therefore, we conceptually extend one of the classic quantile mapping methods [1] by improving the description of the tail of the distribution. The proposed methodology is based on fitting a parametric transformation to the quantile–quantile relationship of observed and modelled values over the centre of the distribution. For the tail of the distribution, the quantile–quantile relationship of the modelled data is remapped onto the appropriate generalised extreme value (GEV) distribution.
In this paper, we focus on bias correcting seasonal forecasts, which provide information about long-term average conditions, typically covering a timescale from one to six months [24]. In the framework of climate services, seasonal forecasts play a pivotal role in measuring the potential climate impact on different sectors, such as renewable energy [25,26], water resource management [27,28,29] and agriculture [30]. In particular, the presented methodology was used to perform the bias correction of 2 m temperature and total precipitation for the three widespread seasonal forecasting systems developed by ECMWF, Météo-France and DWD (see Section 3 for more details). However, the proposed approach can be seamlessly applied to any other model forecast, regardless of the timescale.
This article is organized as follows. In Section 2, we provide a description of our bias correction methodology, explaining how it has been applied. In Section 3, we describe the data and the study area. The results of the bias correction of temperature and precipitation over the SADC are displayed in Section 4. Finally, the discussions and the conclusions are presented in Section 5 and Section 6, respectively.
2. Methodology
The proposed technique is the combination of two approaches: quantile mapping (QM) and the fitting of a generalized extreme value distribution (GEV). QM is applied to the central part of the statistical distribution, while GEV is applied to the tails of the distribution, i.e., to the extremes. In the remainder of the section, we describe the two components of our method in detail.
Quantile mapping assumes that the cumulative distribution function (CDF) of a variable in the forecast and observation time series does not change in the future period [31]. When it is given a variable x, QM minimises the discrepancy between the CDF of the model data and that of the reference data over a given calibration period. In practice, in a quantile mapping algorithm, the model output x is mapped to an observation output y by means of a transform function h, in such a way that their two CDFs are equivalent [32]:
where CDF−1 is the inverse function of the CDF.
The generalised extreme value, or GEV, is a family of continuous probability distributions that is often used for modelling extreme events. The GEV has three parameters: location μ, scale σ and one shape ξ parameter. Depending on the value of the latter one, the GEV distribution is classified as Gumbel (ξ = 0), Fréchet (ξ > 0) and Weibull (ξ < 0). The cumulative distribution function (CDF) of the GEV distribution is the following:
This second component is applied to the extremes, which are defined as the values exceeding the 95th percentile. It is worth mentioning that the same considerations apply for negative extremes, such as, for instance, the values lower than the 5th percentile. In all of the other cases, the data are bias corrected using the classic quantile mapping.
The presented approach has been implemented in a Python library. This choice is motivated by the flexibility of Python, which makes it an optimal option for the development of climate services that are to be run operationally. However, there is a very limited availability of Python libraries performing bias correction. The most widely used one is the bias_correction module, which was released in August 2021 (https://pypi.org/project/bias-correction/ (accessed on 22 December 2022)). It consists of functions to remove the biases across datasets. Implemented methods include quantile mapping, modified quantile mapping, and scaled distribution mapping (gamma and normal corrections). This library performs the calculation of the parameters for remapping the model data onto the observational distribution concurrently with the application of the bias correction. As a result, the library is rather computationally demanding if it is employed operationally, i.e., on a monthly basis.
The developed Python library can be applied on an ongoing basis, which is a fundamental requirement for the operation of a climate service. The procedure consists of two phases, and it is applied for each month separately (e.g., for all of the Januarys in the time series).
In the first phase, which can be called the training phase, the parameters of two statistical distributions are computed, i.e., the one with the data that are to be bias corrected and the one with the reference data. In our case, the data to be corrected are the seasonal forecasts provided by ECMWF, Météo-France and DWD, respectively, while as a reference, we use the ERA5 reanalysis. The data are divided into extremes and not extremes. We have two types of parameters corresponding to the central part of the distribution and the tails. As for the central part of the distribution, the parameters required are the CDF values corresponding to a given number of quantiles. In our case, we selected 20 quantiles. Regarding the tails, the parameters will be the three characteristics of the GEV: location μ, scale σ and shape ξ.
The second phase entails the application of the bias correction technique by using the parameters obtained during the training phase to correct the seasonal forecast data by applying the inverse function of the CDF. Our bias correction method, therefore, provides the possibility to save the parameters calculated in the training phase and to reuse them to apply the correction. In this way, the time and calculation resources are drastically reduced because the computation of the parameters takes place only once and then, assuming the stationarity of the time series, the parameters of the statistical distribution remain unchanged.
3. Data
Three seasonal forecasting systems have been used for the analysis and correction of their bias, namely, the ECMWF seasonal forecasting system 5 (SEAS5), the Météo-France System7 and the DWD GCFS2.1 seasonal forecasts, which are products that are available through the Copernicus Climate Data Store (CDS) [33]. Seasonal forecasts are ensemble predictions, where each member of the ensemble represents an independent realisation of the forecast. The characteristics of each model, such as the ensemble size and the horizontal resolution, are listed in Table 1.
The SEAS5 seasonal forecasting system dataset includes real-time forecasts since 2017 and hindcasts in the period of 1993–2016. The difference between the forecasts and hindcasts is that real-time forecasts consist of 51 ensemble members, i.e., independent realisations of the forecast, while the hindcasts include 25 ensemble members. The three datasets cover the global surface on a 1° × 1° regular grid, and the forecasted variables are provided at a daily temporal resolution. The variables considered are the 2 m mean temperature and the total precipitation, which were evaluated over the Southern African Development Community (SADC) in the interval region between 0°–40° S and 5°–51° E during the 1993–2020 period.
The reference data used for the bias adjustment of forecasts were derived from the fifth generation of the ECMWF global reanalysis, ERA5 [37]. ERA5 spans the period of 1950–present with an hourly temporal resolution, and it is provided on a regular 0.25° × 0.25° grid. In this study, the reanalysis data were used as they are the best alternative to observations over the large African domain that is considered. This enables us to obtain a more reliable assessment of the ECMWF SEAS5 forecasts and calibration methods, independent from the heterogeneity in space and time of the in situ data availability. Moreover, it improved the replicability of the methodology over other regions where no or scarce observations are available.
In this article, we focused on analysing the months of January, February and March, which are the ones related to the rainy season in the SADC region. However, in seasonal forecasts, predictions of the same month are provided at different starting months, and these outputs are identified by a different “lead time”. For example, we can have the forecast of January 2020 which is provided by the seasonal forecast initialised in December 2019: in this case, the lead time would be one. Instead, the forecast of January 2020 initialised in July 2019 is identified by lead time six. In the remainder of the analysis, special attention was put on the lead time. Since the results are different depending on the lead time, as forecasts corresponding to different lead times can have diverse performances, we considered them independently. Hence, for each month, six results will be produced, corresponding to the six lead times.
4. Results
In this section, we evaluate the bias-corrected predictions for three forecast centres (ECMWF, Météo-France and DWD) by comparing them against the reanalysis ERA5. Moreover, we compare the results of the bias correction obtained with standard QM to understand the extent of the improvement for the extremes. A first evaluation of the performance of the proposed bias correction method consists of comparing the extreme values of the seasonal forecast corresponding to two percentiles, the 97th and 99th ones, with the respective values of the reanalysis ERA5. For this purpose, we show the difference between the seasonal forecast dataset and the reference one in three situations: before applying the bias correction (i.e., using raw data), after applying the classic Quantile Mapping approach and after using our method (i.e., the combination of Quantile Mapping and GEV). To perform all of these operations, we re-gridded the reanalysis data onto the same coordinates of the seasonal forecast, which have a resolution of 1°, using a nearest neighbours interpolation.
As an example, we show the difference between the value of temperature extremes corresponding to the 99th percentile for the three models (SEAS5, System 7 and GCFS2.1), and the value of the 99th percentile of ERA5. The results are displayed in Figure 1, which refers to January and lead time one. In this figure, the columns represent the type of data: raw data (i.e., without any correction), data bias corrected by quantile mapping and by our proposed method.
The raw seasonal forecasts underestimate the temperature extremes corresponding to the 99th percentile in almost the entire study area regardless of the model, as can be seen from the left-hand side panels in Figure 1. This underestimation is more pronounced for SEAS5. The application of quantile mapping produces a clear reduction of this discrepancy, although a negative bias remains in the southwestern part of the SADC region (central panels). The use of GEV fitting for the tails produces a further improvement on the final results, as can be seen from the differences between the bias-corrected data and reanalysis (right panels). Similar results are also found for the 97th percentile and for the other months and lead times (not shown).
In a second step, we generalize these analysis to all of the considered month and lead times. We use the Root Mean Squared Error (RMSE) as a metric for evaluating the overall performance of the prediction datasets, as it measures the deviation between the predicted and reference data. This statistical metric has been widely used, often together with other indices such as the mean bias [38] and correlation coefficients [39] to evaluate the degree of agreement between the observations and the forecasts. RMSE is a measure of the average error, weighted according to the square of the error. Being a squared quantity, RMSE puts greater influence on the large errors than it does on the smaller errors.
For both of the variables, temperature and precipitation, we computed the RMSE between the extremes at the 99th and 97th percentiles of the seasonal forecasts and those of ERA5. We performed the calculation for both the raw and corrected data. The RMSE values obtained for temperature are summarized in Figure 2, Figure 3 and Figure 4, which show the RMSE related to each month and lead time. Both the quantile mapping and the proposed bias correction approaches (panels b and c in Figure 2, Figure 3 and Figure 4, respectively) improve the performance of the predictions, as can be seen from the reduction of the values of this metric when they are compared to the raw forecasts (panel a in Figure 2, Figure 3 and Figure 4). Our proposed methodology further lowers the RMSE. As compared to standard quantile mapping, the results improve from 5% to 30%. Moreover, the RMSE of the raw seasonal forecasts of 2 m temperature tends to vary with the lead time, while the RMSE of bias-corrected data becomes essentially independent of the lead time.
Figure 5, Figure 6 and Figure 7 show the RMSE values computed, which were described previously, but for total precipitation. As for the temperature, the bias-corrected precipitation data show a consistent decrease in the RMSE. In this case, the application of a bias correction methodology produces a decrease in the RMSE of one order of magnitude and sometimes, for System 7, Météo-France (Figure 6) and GCFS2.1, DWD (Figure 7), the decrease is of two orders of magnitude. Additionally, in this case, the proposed method further improves the effect of standard QM by reducing the RMSE up to 50%.
The next goal of our analysis was to understand the ability of bias-corrected seasonal forecasts to identify the timing of extreme events. To this end, we analysed the percentage of ensemble members that correctly forecasted extreme values before and after applying the bias correction.
First, we identify the extreme events in the ERA5 reanalysis products. For each grid point, independently, we considered any value above a specific threshold to be “extreme” (97th or 99th percentile). Then, for each forecasting system, we computed the number of ensemble members that overcame the threshold at least once in a time window centred on the date of the event under consideration. As these are long-term forecasts, it makes no sense to look at the exact date when the extreme event occurred as the seasonal forecast is unlikely to identify the phenomenon on that specific day. For this reason, we considered a 14-day window centred on each date of the extreme events (the previous and the following week). In this time window, we identified the maximum value of the variable and compared it with the threshold value. If the maximum value is higher than the quantile, the threshold is exceeded at least once, and according to our definition, that ensemble member identifies an extreme event.
For each cell and timestep, we counted the number of ensemble members for which the threshold (97th or 99th percentile) was exceeded. By dividing this number by the total number of ensemble members, we obtained, for each event, the percentage of members that have correctly forecasted the extremes. Finally, for each cell, we computed the average percentage for all of the considered events. This calculation was carried out for every month and lead time, independently.
In Figure 8, Figure 9 and Figure 10, we show, as an example, the maps depicting the percentage of members correctly predicting extremes in each cell of the domain. The figures refer to January (panels a, b), February (panels c, d) and March (panels e, f), which were predicted with lead time one. We only show the raw data (first column) and data corrected with our bias correction method (second column).
In general, the proposed bias correction method improves the percentage of ensemble members predicting extreme events. For SEAS5, the percentage increases in the whole study area after the correction. This applies also to System 7 and GCFS2.1 in most of the domain. Some areas present a worsening of the performances after the correction.
The percentages for each month and lead time, averaged over the entire domain, are summarised in Figure 11, Figure 12 and Figure 13. As can be seen from the figures, the proposed bias correction method produces a net increase in the percentage of members that are able to correctly predict temperature extremes. The improvement is particularly drastic for SEAS5, whose raw data present a very low percentage (under 1%). Thanks to the correction, we move to a percentage that ranges from 16 to 23%, depending on month and lead time.
The same analysis performed on precipitation is depicted in Figure 14 for SEAS5. System 7 and GCFS2.1 have similar behaviours (not shown). The values reveal that the proposed method produces a lowering of the percentage of ensemble members predicting extreme events. The lowering is larger for February and March, compared to that of January. After the correction, the variation of the percentage with the month and lead time is less pronounced. This might be related to the erratic nature of precipitation, especially convective precipitations which are common in the analysed period. However, more analyses are necessary to understand this behaviour.
5. Discussion
Extremes are the most impactful events for human activities. Hence, special attention needs to be paid to impact modelling. This study attempts to take a step forward in this respect by defining a new bias correction methodology that is suitable for the identification of extreme events. Such a method extends the classic quantile mapping by improving the description of the tail of the distribution by means of a generalized extreme value distribution (GEV) fitting. Our method outperforms quantile mapping, with a reduction of up to 50% of the RMSE of the forecasting data with respect to the reference data. Furthermore, the presented bias correction method leads to an improvement of the ability of the ensemble members to predict extreme temperature events.
The method showed its potential with seasonal forecasts, which play a pivotal role in measuring the potential climate impact on different sectors. For instance, the potential of the method to increase the percentage of ensemble members predicting droughts would be crucial in applications for the water management sector. In the case of the climate service presented in [27,28], the proposed method would lead to better performances and a more accurate decision support system for the climate-informed management of water resources in the Mediterranean areas. Another example is the application to the agricultural sector, which has been proposed by [30]. The article shows how important it is to bias correct seasonal forecasts data for the prediction of the productivity of the next season through specific indices, e.g., the growing season index. The results focused mostly on temperature as it was not possible to bias correct precipitation. Our method would be a good candidate to complement the results of that study by extending it to outlooks of precipitation-related indices.
Besides the application to seasonal forecasts, the proposed approach can be employed for bias correcting reanalysis products with in situ observations. Such results might be used for evaluating the effect of climate events on our society in retrospect. A possible use of these bias corrected data is for assessing the potential and/or the effectiveness of policies to mitigate the climate risk. However, as for the standard quantile mapping techniques, care must be taken in adopting this methodology for applications in which spatial coherence or physical coherence between the climate variables needs to be handled properly. Furthermore, considering the limited sampling of the tails of the distribution, the extension of the proposed methodology to the multivariate case is not straightforward, and this should be the object of additional development.
A possible future development is certainly the application of the technique to decadal predictions and scenarios, which is more delicate due to the uncertainty characterising the development of future climatic conditions. Furthermore, due to the coarse resolution of multi-annual predictions and climate projections, the bias correction should be combined with a downscaling process in order to improve the spatial resolution.
6. Conclusions
A novel bias correction method was developed to correct the bias in extreme temperature and rainfall events simulated by seasonal forecasts. The proposed method corrects the bias in the entire data set by applying GEV fitting to the tails of the statistical distribution and standard quantile mapping elsewhere. Temperature and rainfall simulations from SEAS5, System7 and GCFS2.1 were bias corrected using both our method and quantile mapping alone. The effectiveness of the approaches was assessed by comparison with the reanalysis ERA5. The proposed method was observed to perform better than the quantile mapping method did, with a reduction of 30% in the RMSE for temperature and up to 50% for precipitation with respect to the conventional method. Additionally, the bias-corrected temperature forecasts have a larger number of ensemble members which rightly predict extreme values compared to that of the raw forecast. Another effect of the bias correction is the decrease in the number of members identifying rainfall extremes. This brings up one of the main limitations in this kind of analysis, the lack of information about extreme events, which make it difficult to build robust statistics describing the phenomena.
Author Contributions
Conceptualization, M.P. and S.C.; Methodology, M.P., S.D.G. and S.C.; Software, L.T. and M.V.; validation L.T., F.G. and S.D.G., Formal analysis, L.T., M.P. and S.D.G.; Investigation, L.T. and S.D.G.; resources, M.V.; Data curation, L.T., M.V., M.P. and S.D.G.; Writing—Original draft preparation, L.T. and M.P.; Writing—Review and editing, L.T., F.G., M.P., S.D.G. and S.C.; Supervision, M.P., S.D.G. and S.C.; Project administration, M.P.; Funding acquisition, M.P. All authors have read and agreed to the published version of the manuscript.
Funding
This research funded by the EU H2020 FOCUS Africa Project GA869575.
Data Availability Statement
All data used in this study are openly available in the Climate Data Store of the Copernicus Climate Change Service (https://cds.climate.copernicus.eu/#!/home, accessed on 26 October 2021).
Acknowledgments
The authors thank the financial support from the EU H2020 FOCUS Africa Project GA869575.
Conflicts of Interest
The authors declare no conflict of interest.
References
- Sippel, S.; Otto, F.E.L.; Forkel, M.; Allen, M.R.; Guillod, B.P.; Heimann, M.; Reichstein, M.; Seneviratne, S.I.; Thonicke, K.; Mahecha, M.D. A novel bias correction methodology for climate impact simulations. Earth Syst. Dyn. 2016, 7, 71–88. [Google Scholar] [CrossRef] [Green Version]
- Chen, J.; Brissette, F.P.; Lucas-Picher, P. Assessing the limits of bias-correcting climate model outputs for climate change impact studies. J. Geophys. Res. Atmos. 2015, 120, 1123–1136. [Google Scholar] [CrossRef]
- Macadam, I.; Argüeso, D.; Evans, J.P.; Liu, D.L.; Pitman, A.J. The effect of bias correction and climate model resolution on wheat simulations forced with a regional climate model ensemble. Int. J. Clim. 2016, 36, 4577–4591. [Google Scholar] [CrossRef] [Green Version]
- Ciervo, F.; Rianna, G.; Mercogliano, P.; Papa, M.N. Effects of climate change on shallow landslides in a small coastal catchment in southern Italy. Landslides 2017, 14, 1043–1055. [Google Scholar] [CrossRef]
- Bruyère, C.L.; Done, J.M.; Holland, G.J.; Fredrick, S. Bias corrections of global models for regional climate simulations of high-impact weather. Clim. Dyn. 2014, 43, 1847–1856. [Google Scholar] [CrossRef] [Green Version]
- Shugar, D.H.; Jacquemart, M.; Shean, D.; Bhushan, S.; Upadhyay, K.; Sattar, A.; Schwanghart, W.; McBride, S.; De Vries, M.V.W.; Mergili, M.; et al. A massive rock and ice avalanche caused the 2021 disaster at Chamoli, Indian Himalaya. Science 2021, 373, 300–306. [Google Scholar] [CrossRef] [PubMed]
- Bennett, J.C.; Grose, M.R.; Corney, S.P.; White, C.J.; Holz, G.K.; Katzfey, J.J.; Post, D.A.; Bindoff, N.L. Performance of an empirical bias-correction of a high-resolution climate dataset. Int. J. Clim. 2014, 34, 2189–2204. [Google Scholar] [CrossRef]
- Maraun, D.; Widmann, M. Statistical Downscaling and Bias Correction for Climate Research; Cambridge University Press: Cambridge, UK, 2017. [Google Scholar] [CrossRef] [Green Version]
- Weber, T.; Haensler, A.; Jacob, D. Sensitivity of the atmospheric water cycle to corrections of the sea surface temperature bias over southern Africa in a regional climate model. Clim. Dyn. 2018, 51, 2841–2855. [Google Scholar] [CrossRef] [Green Version]
- Cannon, A.J.; Piani, C.; Sippel, S. Bias correction of climate model output for impact models. In Climate Extremes and Their Implications for Impact and Risk Assessment; Elsevier: Amsterdam, The Netherlands, 2020; pp. 77–104. [Google Scholar] [CrossRef]
- Vrac, M.; Thao, S.; Yiou, P. Should Multivariate Bias Corrections of Climate Simulations Account for Changes of Rank Correlation Over Time? J. Geophys. Res. Atmos. 2022, 127, e2022JD036562. [Google Scholar] [CrossRef]
- Pérez-Zanón, N.; Caron, L.P.; Terzago, S.; Van Schaeybroeck, B.; Lledó, L.; Manubens, N.; Roulin, E.; Alvarez-Castro, M.C.; Batté, L.; Delgado-Torres, C.; et al. The CSTools (v4.0) Toolbox: From Climate Forecasts to Climate Forecast Information. Geosci. Model Dev. Discuss. 2021, 15, 6115–6142. [Google Scholar] [CrossRef]
- Torralba, V.; Doblas-Reyes, F.J.; MacLeod, D.; Christel, I.; Davis, M. Seasonal Climate Prediction: A New Source of Information for the Management of Wind Energy Resources. J. Appl. Meteorol. Clim. 2017, 56, 1231–1247. [Google Scholar] [CrossRef]
- Van Schaeybroeck, B.; Vannitsem, S. Post-processing through linear regression. Nonlinear Process. Geophys. 2011, 18, 147–160. [Google Scholar] [CrossRef] [Green Version]
- Doblas-Reyes, F.J.; Hagedorn, R.; Palmer, T.N. The rationale behind the success of multi-model ensembles in seasonal forecasting—II. Calibration and combination. Tellus A Dyn. Meteorol. Oceanogr. 2005, 57, 234. [Google Scholar] [CrossRef] [Green Version]
- Van Schaeybroeck, B.; Vannitsem, S. Ensemble post-processing using member-by-member approaches: Theoretical aspects. Q. J. R. Meteorol. Soc. 2015, 141, 807–818. [Google Scholar] [CrossRef]
- Eade, R.; Smith, D.; Scaife, A.; Wallace, E.; Dunstone, N.; Hermanson, L.; Robinson, N. Do seasonal-to-decadal climate predictions underestimate the predictability of the real world? Geophys. Res. Lett. 2014, 41, 5620–5628. [Google Scholar] [CrossRef]
- Crespi, A.; Petitta, M.; Marson, P.; Viel, C.; Grigis, L. Verification and Bias Adjustment of ECMWF SEAS5 Seasonal Forecasts over Europe for Climate Service Applications. Climate 2021, 9, 181. [Google Scholar] [CrossRef]
- Navarro-Racines, C.; Tarapues, J.; Thornton, P.; Jarvis, A.; Ramirez-Villegas, J. High-resolution and bias-corrected CMIP5 projections for climate change impact assessments. Sci. Data 2020, 7, 7. [Google Scholar] [CrossRef] [Green Version]
- Ibarra-Berastegi, G.; Saénz, J.; Ezcurra, A.; Elías, A.; Diaz Argandoña, J.; Errasti, I. Downscaling of surface moisture flux and precipitation in the Ebro Valley (Spain) using analogues and analogues followed by random forests and multiple linear regression. Hydrol. Earth Syst. Sci. 2011, 15, 1895–1907. [Google Scholar] [CrossRef]
- Hu, Z.; Chen, D.; Chen, X.; Zhou, Q.; Peng, Y.; Li, J.; Sang, Y. CCHZ-DISO: A Timely New Assessment System for Data Quality or Model Performance From Da Dao Zhi Jian. Geophys. Res. Lett. 2022, 49, e2022GL100681. [Google Scholar] [CrossRef]
- Shin, J.-Y.; Lee, T.; Park, T.; Kim, S. Bias correction of RCM outputs using mixture distributions under multiple extreme weather influences. Theor. Appl. Clim. 2018, 137, 201–216. [Google Scholar] [CrossRef]
- White, R.H.; Toumi, R. The limitations of bias correcting regional climate model inputs. Geophys. Res. Lett. 2013, 40, 2907–2912. [Google Scholar] [CrossRef]
- Luo, J.-J.; Behera, S.K.; Masumoto, Y.; Yamagata, T. Impact of Global Ocean Surface Warming on Seasonal-to-Interannual Climate Prediction. J. Clim. 2011, 24, 1626–1646. [Google Scholar] [CrossRef]
- Lledó, L.; Torralba, V.; Soret, A.; Ramon, J.; Doblas-Reyes, F. Seasonal forecasts of wind power generation. Renew. Energy 2019, 143, 91–100. [Google Scholar] [CrossRef]
- Goodess, C.M.; Troccoli, A.; Vasilakos, N.; Dorling, S.; Steele, E.; Amies, J.D.; Brown, H.; Chowienczyk, K.; Dyer, E.; Formenton, M.; et al. The Value-Add of Tailored Seasonal Forecast Information for Industry Decision Making. Climate 2022, 10, 152. [Google Scholar] [CrossRef]
- Arnone, E.; Stavridis, G.C.; Ortolani, L.; Rammos, T.; Cucchi, M.; Gkiourou, A.; Gesso, S.D.; Psomas, B.; Calmanti, S.; Petitta, M. The drought-alert decision support system for water resources management. Desalination Water Treat. 2020, 194, 304–314. [Google Scholar] [CrossRef]
- Arnone, E.; Cucchi, M.; Gesso, S.D.; Petitta, M.; Calmanti, S. Droughts Prediction: A Methodology Based on Climate Seasonal Forecasts. Water Resour. Manag. 2020, 34, 4313–4328. [Google Scholar] [CrossRef]
- Marcos, R.; Llasat, M.C.; Quintana-Seguí, P.; Turco, M. Seasonal predictability of water resources in a Mediterranean freshwater reservoir and assessment of its utility for end-users. Sci. Total Environ. 2017, 575, 681–691. [Google Scholar] [CrossRef] [PubMed]
- Vajda, A.; Hyvärinen, O. Development of seasonal climate outlooks for agriculture in Finland. Adv. Sci. Res. 2020, 17, 269–277. [Google Scholar] [CrossRef]
- Tong, Y.; Gao, X.; Han, Z.; Xu, Y.; Xu, Y.; Giorgi, F. Bias correction of temperature and precipitation over China for RCM simulations using the QM and QDM methods. Clim. Dyn. 2021, 57, 1425–1443. [Google Scholar] [CrossRef]
- Piani, C.; Haerter, J.O.; Coppola, E. Statistical bias correction for daily precipitation in regional climate models over Eu-rope. Theor. Appl. Climatol. 2010, 99, 187–192. [Google Scholar] [CrossRef] [Green Version]
- Climate Data Store. Available online: https://cds.climate.copernicus.eu/#!/home (accessed on 10 November 2021).
- Johnson, S.J.; Stockdale, T.N.; Ferranti, L.; Balmaseda, M.A.; Molteni, F.; Magnusson, L.; Tietsche, S.; Decremer, D.; Weisheimer, A.; Balsamo, G.; et al. SEAS5: The new ECMWF seasonal forecast system. Geosci. Model Dev. 2019, 12, 1087–1117. [Google Scholar] [CrossRef] [Green Version]
- Stevens, B.; Giorgetta, M.; Esch, M.; Mauritsen, T.; Crueger, T.; Rast, S.; Salzmann, M.; Schmidt, H.; Bader, J.; Block, K.; et al. Atmospheric component of the MPI-M Earth System Model: ECHAM6. J. Adv. Model. Earth Syst. 2013, 5, 146–172. [Google Scholar] [CrossRef]
- Voldoire, A.; Saint-Martin, D.; Sénési, S.; Decharme, B.; Alias, A.; Chevallier, M.; Colin, J.; Guérémy, J.F.; Michou, M.; Moine, M.P.; et al. Evaluation of CMIP6 DECK Experiments With CNRM-CM6-1. J. Adv. Model. Earth Syst. 2019, 11, 2177–2213. [Google Scholar] [CrossRef] [Green Version]
- Hersbach, H.; Bell, B.; Berrisford, P.; Hirahara, S.; Horanyi, A.; Muñoz-Sabater, J.; Nicolas, J.; Peubey, C.; Radu, R.; Schepers, D.; et al. The ERA5 global reanalysis. Q. J. R. Meteorol. Soc. 2020, 146, 1999–2049. [Google Scholar] [CrossRef]
- Kostadinov, T.S.; Schumer, R.; Hausner, M.; Bormann, K.J.; Gaffney, R.; McGwire, K.; Painter, T.H.; Tyler, S.; Harpold, A.A. Watershed-scale mapping of fractional snow cover under conifer forest canopy using lidar. Remote. Sens. Environ. 2019, 222, 34–49. [Google Scholar] [CrossRef]
- Muhuri, A.; Gascoin, S.; Menzel, L.; Kostadinov, T.S.; Harpold, A.A.; Sanmiguel-Vallelado, A.; Moreno, J.I.L. Performance Assessment of Optical Satellite-Based Operational Snow Cover Monitoring Algorithms in Forested Landscapes. IEEE J. Sel. Top. Appl. Earth Obs. Remote. Sens. 2021, 14, 7159–7178. [Google Scholar] [CrossRef]
Figure 1.
2 m temperature extreme value corresponding to the difference between the 99th percentile for the three seasonal forecast systems SEAS5 (a–c), System7 (d–f) and GCFS2.1 (g–i), and the 99th percentile of ERA5 dat. The columns refer to the type of data: raw seasonal forecasts (a,d,g), seasonal forecast data corrected with quantile mapping (b,e,h), and seasonal forecast data corrected with the proposed bias correction method (c,f,i). Maps refer to January and lead time one.
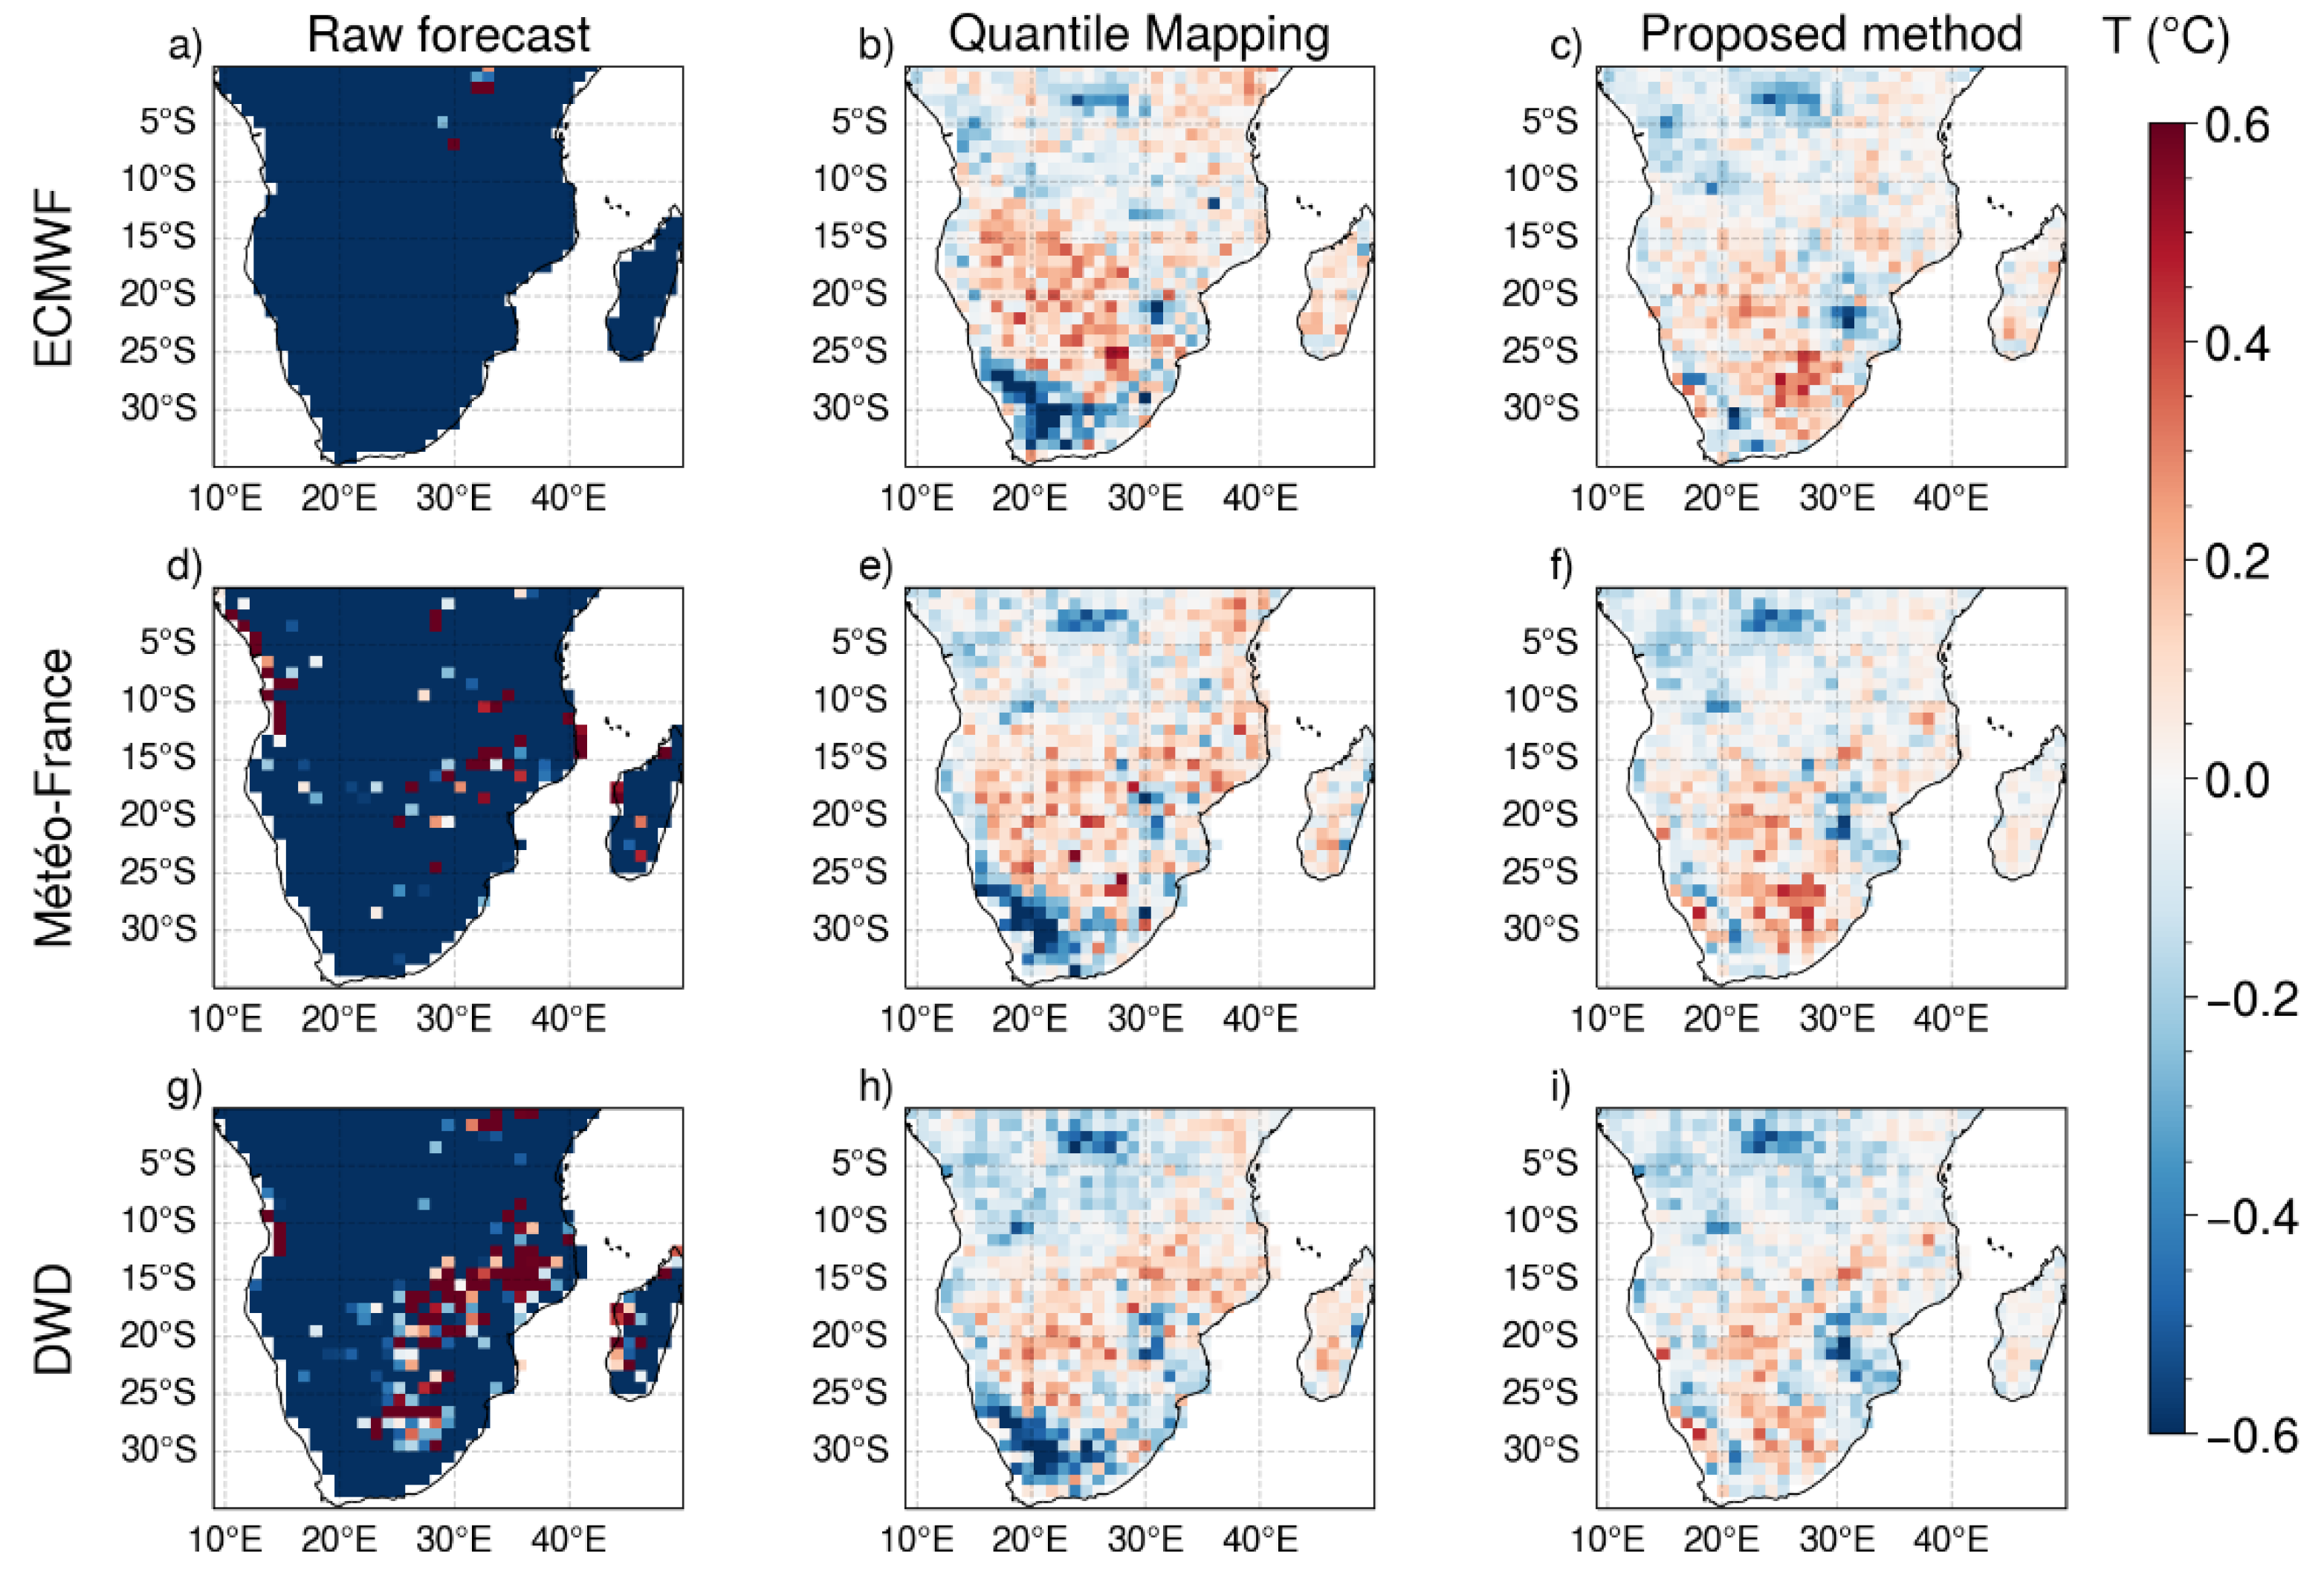
Figure 2.
RMSE (in K) of the 2 m mean temperature 99th percentile value for seasonal forecast SEAS5 (ECMWF) compared to ERA5 reanalysis: (a) raw data, (b) data corrected with standard quantile mapping and (c) corrected with the proposed bias correction method. The colour scale ranges from white (RMSE = 0) to dark red, increasing in intensity as the metric increases. The most intense colour corresponds to the maximum value (in this case, 4.27 K for January and lead time zero).

Figure 3.
RMSE (in K) of the 2 m mean temperature 99th percentile value for seasonal forecast System 7 (Météo-France) compared to ERA5 reanalysis: (a) raw data, (b) data corrected with standard quantile mapping and (c) corrected with the proposed bias correction method. The colour scale ranges from white (RMSE = 0) to dark red, increasing in intensity as the metric increases. The most intense colour corresponds to the maximum value.

Figure 4.
RMSE (in K) of the 2 m mean temperature 99th percentile value for seasonal forecast GCFS2.1 (DWD) compared to ERA5 reanalysis: (a) raw data, (b) data corrected with standard quantile mapping and (c) corrected with the proposed bias correction method. The colour scale ranges from white (RMSE = 0) to dark red, increasing in intensity as the metric increases. The most intense colour corresponds to the maximum value.

Figure 5.
RMSE (m) of the total precipitation 99th percentile value for seasonal forecast SEAS5 (ECMWF) compared to ERA5 reanalysis: (a) raw data, (b) data corrected standard with quantile mapping and (c) data corrected with the proposed bias correction method. The colour scale ranges from white (RMSE = 0) to dark red, increasing in intensity as the metric increases. The most intense colour corresponds to the maximum value (in this case, 0.013 m for January and lead time six).

Figure 6.
RMSE (m) of the total precipitation 99th percentile value for seasonal forecast System 7 (Météo-France) compared to ERA5 reanalysis: (a) raw data, (b) data corrected standard with quantile mapping and (c) data corrected with the proposed bias correction method. The colour scale ranges from white (RMSE = 0) to dark red, increasing in intensity as the metric increases. The most intense colour corresponds to the maximum value.

Figure 7.
RMSE (m) of the total precipitation 99th percentile value for seasonal forecast GCFS2.1 (DWD) compared to ERA5 reanalysis: (a) raw data, (b) data corrected standard with quantile mapping and (c) data corrected with the proposed bias correction method. The colour scale ranges from white (RMSE = 0) to dark red, increasing in intensity as the metric increases. The most intense colour corresponds to the maximum value.
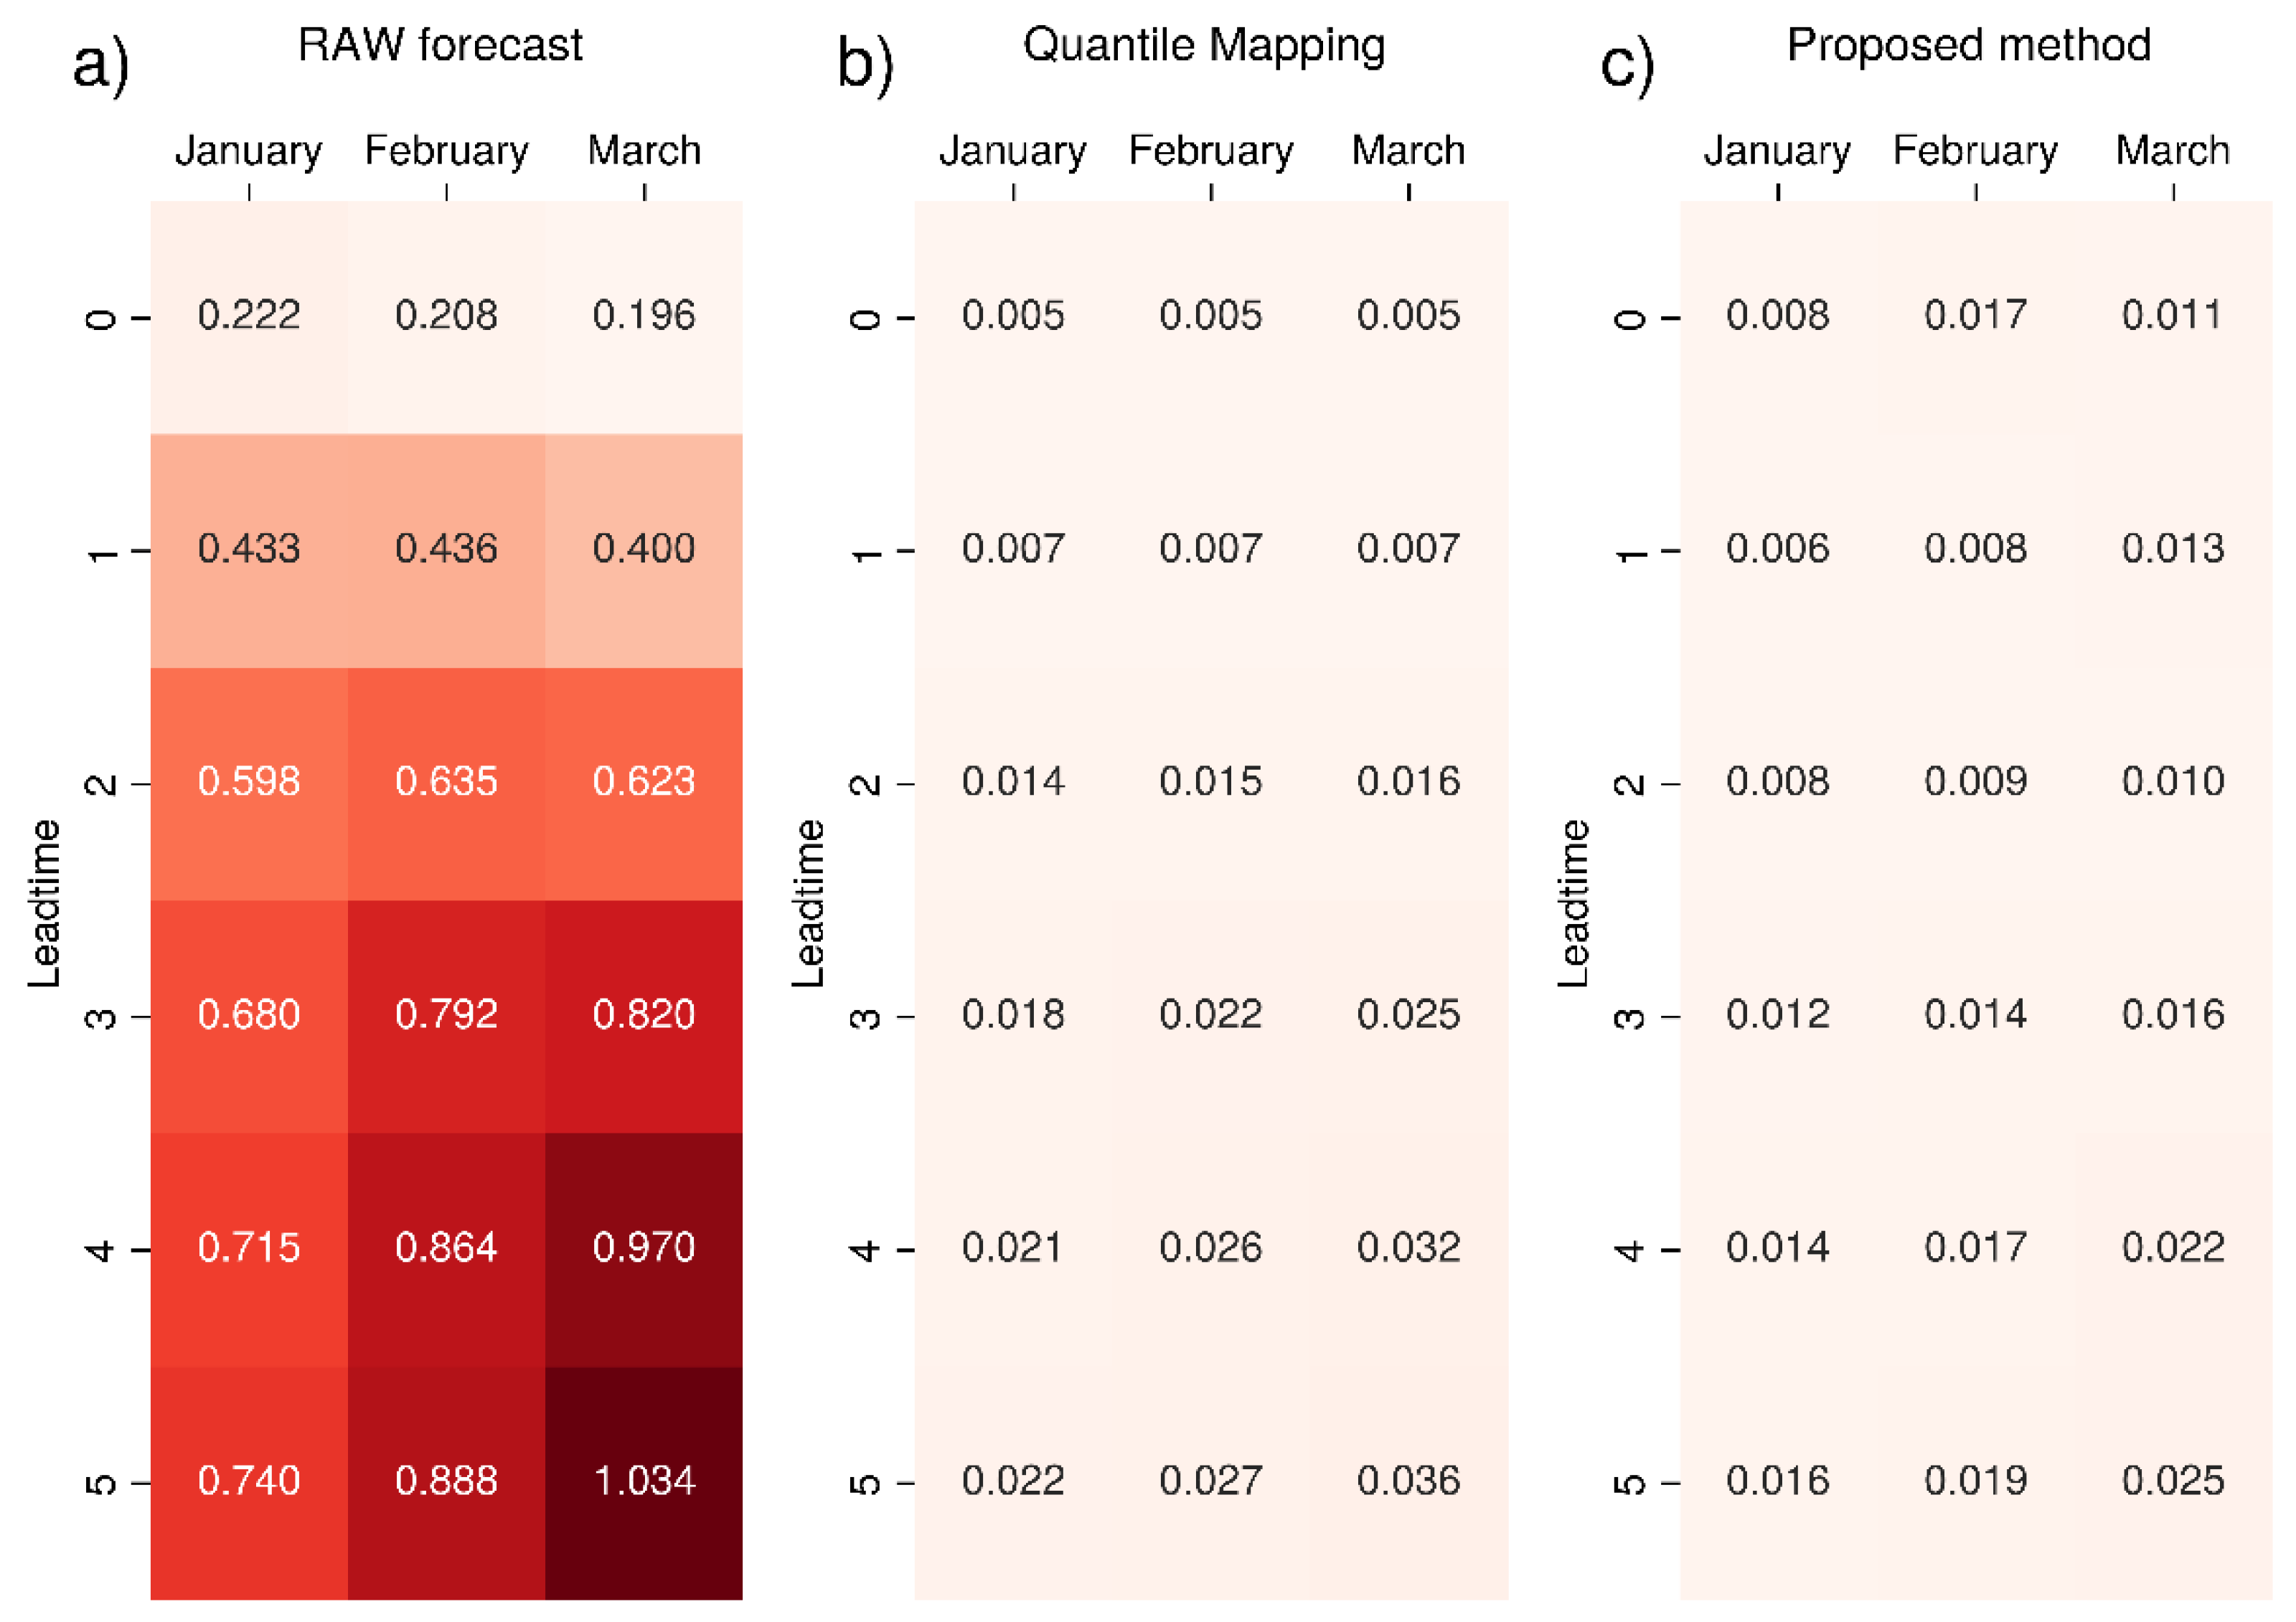
Figure 8.
Spatial distribution of average percentage of ensemble members that correctly predict extreme events defined as the values of 2 m mean temperature exceeding the 99th percentile: raw data (a,c,e) and bias-corrected data (b,d,f). The maps refer to seasonal forecast SEAS5 (ECMWF). Results are shown for the three months (row-wise) and lead time one.

Figure 9.
Spatial distribution of average percentage of ensemble members that correctly predict extreme events defined as the values of 2 m mean temperature exceeding the 99th percentile: raw data (a,c,e) and bias-corrected data (b,d,f). The maps refer to seasonal forecast System 7 (Météo-France). Results are shown for the three months (row-wise) and lead time one.

Figure 10.
Spatial distribution of average percentage of ensemble members that correctly predict extreme events defined as the values of 2 m mean temperature exceeding the 99th percentile: raw data (a,c,e) and bias-corrected data (b,d,f). The maps refer to seasonal forecast GCFS2.1 (DWD). Results are shown for the three months (row-wise) and lead time one.

Figure 11.
Mean percentage of ensemble members correctly predicting 2 m mean temperature over the 99th percentile value for seasonal forecast SEAS5 (ECMWF): (a) raw data and (b) data corrected with the proposed bias correction method. The colour scale ranges from white (0%) to dark blue, increasing in intensity as the percentage increases. The most intense colour corresponds to the maximum value (in this case, 21.9% for March and lead time one).

Figure 12.
Mean percentage of ensemble members correctly predicting 2 m mean temperature over the 99th percentile value for seasonal forecast System 7 (Météo-France): (a) raw data and (b) data corrected with the proposed bias correction method. The colour scale ranges from white (0%) to dark blue, increasing in intensity as the percentage increases. The most intense colour corresponds to the maximum value.

Figure 13.
Mean percentage of ensemble members correctly predicting 2 m mean temperature over the 99th percentile value for seasonal forecast GCFS2.1 (DWD): (a) raw data and (b) data corrected with the proposed bias correction method. The colour scale ranges from white (0%) to dark blue, increasing in intensity as the percentage increases. The most intense colour corresponds to the maximum value.

Figure 14.
Mean percentage of ensemble members correctly predicting total precipitation over the 99th percentile value for seasonal forecast SEAS5 (ECMWF): (a) raw data and (b) data corrected with the proposed bias correction method. The colour scale ranges from white (0%) to dark blue, increasing in intensity as the percentage increases. The most intense colour corresponds to the maximum value.


Table 1.
The three forecasting systems in the Copernicus Climate Change Service (C3S) and their original configurations.
Table 1.
The three forecasting systems in the Copernicus Climate Change Service (C3S) and their original configurations.
| Forecasting System Name | Forecasting Centre | Hindcast Ensemble Size | Hindcast Period | Horizontal Resolution | Reference |
|---|---|---|---|---|---|
| SEAS5 | ECMWF | 25 | 1981–2016 | 1° × 1° | [34] |
| System 7 | Météo-France | 25 | 1993–2018 | 1° × 1° | [35] |
| GCFS2.1 | DWD | 30 | 1993–2019 | 1° × 1° | [36] |
Disclaimer/Publisher’s Note: The statements, opinions and data contained in all publications are solely those of the individual author(s) and contributor(s) and not of MDPI and/or the editor(s). MDPI and/or the editor(s) disclaim responsibility for any injury to people or property resulting from any ideas, methods, instructions or products referred to in the content. |
© 2022 by the authors. Licensee MDPI, Basel, Switzerland. This article is an open access article distributed under the terms and conditions of the Creative Commons Attribution (CC BY) license (https://creativecommons.org/licenses/by/4.0/).
Share and Cite
MDPI and ACS Style
Trentini, L.; Dal Gesso, S.; Venturini, M.; Guerrini, F.; Calmanti, S.; Petitta, M. A Novel Bias Correction Method for Extreme Events. Climate 2023, 11, 3. https://doi.org/10.3390/cli11010003
AMA Style
Trentini L, Dal Gesso S, Venturini M, Guerrini F, Calmanti S, Petitta M. A Novel Bias Correction Method for Extreme Events. Climate. 2023; 11(1):3. https://doi.org/10.3390/cli11010003
Chicago/Turabian StyleTrentini, Laura, Sara Dal Gesso, Marco Venturini, Federica Guerrini, Sandro Calmanti, and Marcello Petitta. 2023. "A Novel Bias Correction Method for Extreme Events" Climate 11, no. 1: 3. https://doi.org/10.3390/cli11010003
Note that from the first issue of 2016, this journal uses article numbers instead of page numbers. See further details here.