Article

The Value-Add of Tailored Seasonal Forecast Information for Industry Decision Making

by
Clare Mary Goodess
1,*,
Alberto Troccoli
1,2,
Nicholas Vasilakos
3,
Stephen Dorling
1,
Edward Steele
4,
Jessica D. Amies
4,
Hannah Brown
4,
Katie Chowienczyk
4,
Emma Dyer
4,
Marco Formenton
5,
Antonio M. Nicolosi
5,
Elena Calcagni
5,
Valentina Cavedon
6,
Victor Estella Perez
7,8,
Gertie Geertsema
9,
Folmer Krikken
9,
Kristian Lautrup Nielsen
2,7,
Marcello Petitta
10,11,12,
José Vidal
7,
Martijn De Ruiter
13,
Ian Savage
14 and
Jon Upton
15
add Show full author list remove Hide full author list
1
School of Environmental Sciences, University of East Anglia, Norwich NR4 7TJ, UK
2
World Energy Meteorology Council, The Enterprise Centre, University of East Anglia, University Drive, Norwich NR4 7TJ, UK
3
Norwich Business School, University of East Anglia, Norwich NR4 7TJ, UK
4
Met Office, FitzRoy Road, Exeter EX1 3PB, UK
5
Enel Global Trading S.P.A., Viale Regina Margherita 125, 00198 Roma, Italy
6
PAT-Province of Trento, Service for Torrent Control, 38121 Trento, Italy
7
UL Solutions, Caravel·la la Niña 12, 08017 Barcelona, Spain
8
Lobelia Earth S.L., Marie Curie, 8-14, A226, 08042 Barcelona, Spain
9
KNMI, Utrechtseweg 297, 3731 GA De Bilt, The Netherlands
10
Laboratory Climate Modelling, SSPT-MET-CLIM, ENEA, 00123 Rome, Italy
11
Institute for Earth Observation, Eurac Research, 39100 Bolzano, Italy
12
Department of Enterprise Engineering, University of Tor Vergata, 00133 Rome, Italy
13
TenneT, Utrechtseweg 310, 6812 AR Arnhem, The Netherlands
14
Thames Water Utilities Ltd., Clearwater Court, Vastern Road, Reading RG1 8DB, UK
15
Shell U.K. Limited, Shell Centre, London SE1 7NA, UK
*
Author to whom correspondence should be addressed.
Climate 2022, 10(10), 152; https://doi.org/10.3390/cli10100152
Submission received: 17 August 2022 / Revised: 7 October 2022 / Accepted: 10 October 2022 / Published: 16 October 2022
(This article belongs to the Special Issue Seasonal Forecasting Climate Services for the Energy Industry)

Abstract

:
There is a growing need for more systematic, robust, and comprehensive information on the value-add of climate services from both the demand and supply sides. There is a shortage of published value-add assessments that focus on the decision-making context, involve participatory or co-evaluation approaches, avoid over-simplification, and address both the quantitative (e.g., economic) and qualitative (e.g., social) values of climate services. The 12 case studies that formed the basis of the European Union-funded SECLI-FIRM project were co-designed by industrial and research partners in order to address these gaps while focusing on the use of tailored sub-seasonal and seasonal forecasts in the energy and water industries. For eight of these case studies, it was possible to apply quantitative economic valuation methods: econometric modelling was used in five case studies while three case studies used a cost/loss (relative economic value) analysis and avoided costs. The case studies illustrated the challenges in attempting to produce quantitative estimates of the economic value-add of these forecasts. At the same time, many of them highlighted how practical value for users—transcending the actual economic value—can be enhanced; for example, through the provision of climate services as an extension to their current use of weather forecasts and with the visualisation tailored towards the user.

1. Introduction

The development of European and international markets for climate services [1,2,3,4] is driving increased interest in understanding and quantifying their socioeconomic benefits [5,6,7], including those providing seasonal forecast information [8]. The growing need for more systematic, robust, and comprehensive information on the value-add of climate services comes from both the demand (pull) and supply (push) sides [6,8,9]. On the demand side, users want evidence of the potential benefits before committing to the procurement and integration of climate services into their business activities and decision making. On the supply side, developers and providers need to know how best to tailor their climate services to maximise user value [8,9]. At the same time, funders and investors, whether of services freely provided as a public good/merit good [5,6] or through commercial subscriptions, need to plan, measure, and justify their financial investment.
Despite this growing need, there is a shortage of publicly available value-add assessments that avoid oversimplifying the decision-making process(es), involve participatory or co-evaluation approaches, and address both the quantitative (e.g., economic) and qualitative (e.g., social) value of climate services [5,6,7,8,10]. The 12 case studies (CS) (Table 1) that formed the basis of The Added Value of Seasonal Climate Forecasts for Integrated Risk Management (SECLI-FIRM) project addressed these gaps. SECLI-FIRM was a European Union (EU) Horizon 2020-funded project that was active between February 2018 and October 2021 (http://www.secli-firm.eu accessed on 20 August 2022). It aimed to demonstrate how the use of improved, tailored sub-seasonal and seasonal forecasts—from several days out to several months ahead—can add value in both the energy and water sectors [11]. In this context, value-add refers to the potential benefits associated with the use of tailored (sub)seasonal forecasts for specific user decision making and outputs.
The SECLI-FIRM case studies provided an opportunity for micro-level (i.e., company-level) assessment and detailed evaluation of value-add for individual users within concrete decision contexts while focusing on verifiable forecasts [5]. In most cases, the value-add assessment was performed ex ante (i.e., based on estimates rather than actual results), but in the later stages of the project, when some of the trial climate services were close to operational, some attempts at post ante assessment (i.e., based on actual results) were possible.
This paper describes the application and assessment of selected valuation approaches (Table 1) to the SECLI-FIRM case studies. The emphasis was on the value and quality of the resultant decision making rather than the quality of the outputs or the quality of co-production and user engagement [12,13,14,15]. The quality of the seasonal forecasts and the trial climate services developed for the case studies are discussed in more detail elsewhere [16,17].
Section 2 outlines the co-production approach adopted in SECLI-FIRM (Section 2.1) and the process of selecting the specific value-add assessment methods adopted (Section 2.2) before introducing the twin experiment approach and baseline used (Section 2.3). It also outlines the two main metrics—Indicators of Performance (Section 2.4) and Relative Economic Value (Section 2.5)—used in SECLI-FIRM to quantify economic value, the results of which are summarised in Section 3. The discussion of these results in Section 4 considers the relationship between forecast quality and forecast value (Section 4.1) as well as the benefits of event case studies (Section 4.2) and the challenges associated with quantitative valuations (Section 4.3). The more qualitative and practical value of seasonal forecasts for the case studies is discussed in Section 5 while focusing on how this value can be enhanced through co-design of climate services. A summary and recommendations are presented in Section 6.

2. The SECLI-FIRM Methodological Approaches

2.1. Co-Production of the SECLI-FIRM Case Studies

The SECLI-FIRM case studies (Table 1) were co-designed, co-developed, and co-evaluated by research and industrial partners following established co-production principles [13,18,19,20,21]. For all case studies, research institutes were paired to an industrial partner. Three of the original nine case studies had two pairings, effectively presenting 12 case studies overall. In addition, several of the case studies focused on past extreme events that were identified as having been problematic for the industrial partner (see the first column of Table 1).
Decision trees were developed to understand and specify the concrete decision-making context for each case study (Decision trees for each of the case studies are shown in a series of non-technical summary documents at: http://www.secli-firm.eu/case-studies) (accessed on 8 October 2022). These provided an important tool for visualisation and engagement within the project and also helped the seasonal forecast experts within the SECLI-FIRM team to best tailor the seasonal forecast information for each case study in terms of the required temporal and spatial resolution, relevant variables, and location of interest.
The climate inputs provided for the case studies were identified through iterative engagement between the project scientists and industry practitioners. These extended beyond the ‘standard’ ones of temperature and precipitation to include river discharge, solar radiation, onshore and offshore wind speed, and significant wave height (Table 1). They also included derived sector-specific variables such as water and energy demand and hydropower production.
The forecasting models used for each case study are indicated in Table 1, together with the forecast horizon and the temporal resolution. The forecast lead times ranged from several days to several weeks ahead (considered here as sub-seasonal forecasts)-to more than 1.5 months ahead (seasonal forecasts). The temporal resolution varied from daily (typically using rolling averages) to monthly or three-monthly averages. The different characteristics of the forecast information used reflect both the case study application and the levels of awareness and capacity of the industrial partners.

2.2. Selection of Valuation Methods

The start point for the identification of appropriate valuation methods for each case study was an overview of economic assessment methods [22] based on detailed existing review information [8,9,23]. The most appropriate method(s) for each case study was identified through discussions between the case-study teams and the SECLI-FIRM economic expert while drawing on the individual case study decision trees (Decision trees for each of the case studies are shown in a series of non-technical summary documents at: http://www.secli-firm.eu/case-studies accessed on 20 August 2022). The outcomes of this iterative process, which were discussed in more detail by Vasilakos et al. [22], are summarised in the final two columns of Table 1. The choice of method(s), particularly the use of avoided costs and cost/loss models for company-level assessments where direct verification of forecasts was possible, are supported by a more recent review of relevant valuation methods [5].

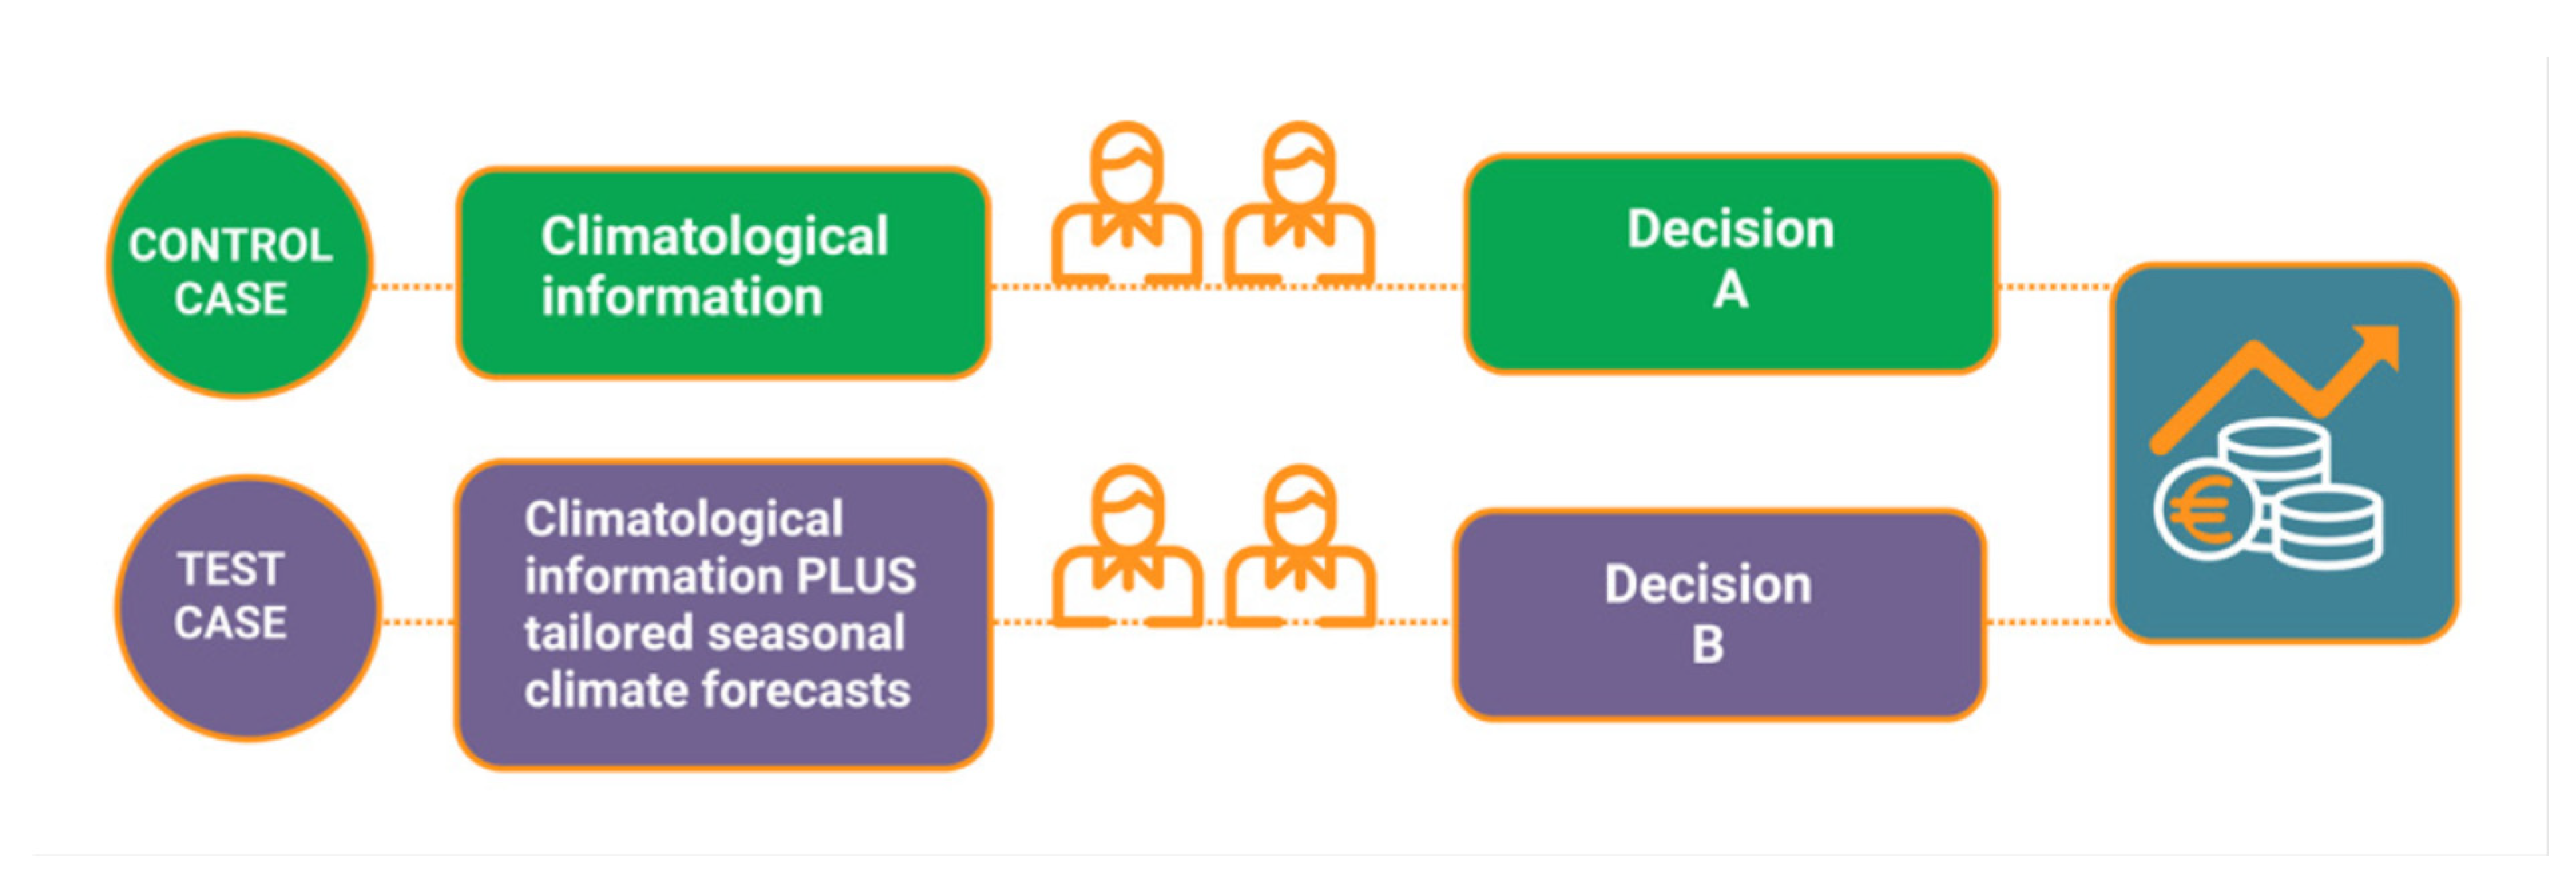
2.3. Baseline and Economic Approaches for Value-Add Assessment

The central concept underpinning forecast value is that services only have value if a user takes action as a result and the action saves that user money [24]. Therefore, to assess the value-add of using seasonal forecasts (the test case), an appropriate baseline or control case must be identified. The ‘twin experiment’ approach adopted by SECLI-FIRM is represented in Figure 1 and can be considered as an example of the ‘differential’ approach, which endeavours to identify the benefits of using climate forecasts/services (or better ones) compared with using no forecasts/services (or inferior ones) [6,8]. At the beginning of the SECLI-FIRM project, the case studies’ industrial partners did not frequently or routinely use seasonal forecasts. In order to represent existing practice, the most appropriate baseline for the SECLI-FIRM case studies was therefore long-term averages of modelled or observed values (climatology) as typically constructed using ERA5 reanalysis [25] or in some cases local observational records (Table 1).
The observed conditions associated with the events of interest were also used. These can be considered as a ‘perfect’ forecast [9]. In reality, a ‘perfect’ forecast does not exist, but the observational data provide an indication of the potential upper value of using seasonal forecasts [26,27]. This principle is embodied in the two main approaches to quantitative assessment used in SECLI-FIRM (Table 1) exemplified by: (i) the Indicators of Performance approach in CS1-5a (with Enel, an Italian-based energy company; Section 2.4); and (ii) the Relative Economic Value approach in CS7 (with Shell, a multi-national energy company) and CS9 (with Thames Water, a large private utility company responsible for the public water supply and wastewater treatment in the southeast of the UK) (Section 2.5).

2.4. Econometric Indicators of Performance

For CS1 to CS5a, Enel implemented an approach that was based on its business processes that included the use of econometric models [22] to produce strategies to reduce the exposures to the markets and the weather (Table 1). The details of the decision-making process and the in-house modelling are commercially sensitive, but were based on so-called Indicators of Performance (IPs). IPs are calculated at the end of the decision-making process as profit margin (M) minus profit at risk (R) in units of millions of Euros and are defined as:
I P k = M k R k
where k is the k-th set of input data.
IPs linked to historical average weather data (climatology), the trial seasonal forecast services under investigation, and the actual weather data (perfect forecasts) are denoted by I P c ,   I P f   , and I P p , respectively. The impact of a seasonal climate forecast has added value if:
|IpfIpp| < |IpcIpp|
This approach is based on the assumption that seasonal forecasts add value when the decision taken is as similar as possible to the one that would be taken knowing exactly the weather variables associated with the event of interest.

2.5. Relative Economic-Value-Based Verification

For CS7 (offshore maintenance with Shell as the industrial partner) and CS9 (water asset management with Thames Water as the industrial partner), the Met Office implemented a Relative Economic Value approach, which assumes that value (V) is achieved if the forecast helps the user to make a better decision than they otherwise would have. A simplified expression for the Relative Economic Value can be presented in terms of the mean expense of the best climate-based option, Ec; the mean expense of a perfect forecast, Ep (derived from contingency table hits and correct rejection terms); and the mean expense of the actual forecast, Ef, when considered over a number of events (such as comprising four years of archived biweekly forecasts here). The maximum value (V = 1) would be obtained from a ‘perfect’ forecast in which the correct decision is always made (i.e., decision to protect only made when the adverse weather event occurs). In contrast, using climatology would have a baseline of V = 0. The Relative Economic Value, V, of this system compared to a climatological baseline and expressed as a fraction of the maximum value achieved by using a perfect forecast can therefore be defined as [28,29]:
V = E c E f E c E p
For an ensemble forecast, the Relative Economic Value is estimated for a range of probability thresholds in terms of the user cost/loss ratio, which allows parameterisation of the risk within the framework [28,30]. This cost/loss ratio is obtained using the (known) monetary cost (C) and loss (L) associated with the specific binary decision made by the operator (e.g., choosing to postpone a planned task). For example, a decision for which the cost of mitigation is low and/or the loss is substantial is characterised by a low cost/loss ratio (C/L << 1), whereas a decision for which the cost of mitigation is high and/or the loss is not substantial will be characterised by a high cost/loss ratio (C/L~1). It is always assumed that C << L [31].

3. Economic Valuation Results

3.1. Econometric Indicators of Performance

The results of the economic valuation for case studies CS1 to CS5a (with Enel) are summarised in Table 2 and expressed in IPs calculated in terms of millions of Euros (see Section 2.4 and Equation (2)). These are shown for three different forecast lead times (five months, three months, and one month ahead) and for a single forecast model (European Centre for Medium-range Weather Forecasts’ SEAS5 [32]) as well as a multi-model average of four models (see Table 1).
Table 2 shows the difference between the IPs computed using the forecast (test; columns A and E) and the climatology (control; columns B and F) with respect to the actual data (see Equation (2)). Columns D and H show the difference between the performance of the seasonal forecast and the climatology; i.e., the capability of the forecasts to provide scores closer to the actual data than by means of climatology. A ‘YES’ in columns C and G means that the seasonal forecast provided a better performance in the very complex value chain of the Enel business process than the traditional method using climatology.
According to Equation (2), the aim was to obtain an IP based on the forecast as close as possible to the one obtained using the actual data. Table 2 suggests that some economic value was achieved in the majority (70%) of cases. However, in several cases, this benefit was relatively low; i.e., the difference between the left-hand side and right-hand side of Equation (2) was small. Such differences ranged between about −40 (an improvement in performance) up to about +25 (a degradation in performance)—as shown in columns D and H—but many of them were quite small. This could be partly attributed to the weakness of the signals coming from the seasonal forecasts, especially in the deterministic approach (see discussion in Section 5 and Section 6) and partly due to the consolidated output of a complex decision process that involved many tasks and other non-weather-related factors such as availability of the plants, markets, and non-linear internal combined processes.
Enel explored the underlying reasons for each of these outcomes. As noted above, many related to the generally weak forecast signals even when the multi-model signal was boosted using an approach developed by SECLI-FIRM The calibration boost (or boosted mean) was developed to attempt to overcome the often weak signal of the forecast ensemble mean. In essence, a sample of members was selected based on the confidence of the forecast. For example, if more than 70% of ensemble members agreed on the sign of the anomaly, then these ensemble members were retained and the ‘boosted mean’ was computed using only these members. For the Enel case studies, this approach was applied to each of the four forecast model ensembles (Table 1) before averaging. Due to time constraints, a simpler weighted mean approach was used for the single model (ECMWF) forecasts. This was particularly the case for extreme events, including the heat wave event associated with CS1 and the drought event associated with CS2a. For CS3, the average wind speed for March 2016 was predicted reasonably well but the forecast failed to capture the week of high wind speed followed by the week with very weak wind. Ideally, Enel would have adopted two different hedging strategies for each of these weeks. When forecasts are very close to climatology (whether due to forecast errors or because it was actually the case) as determined by confidence intervals based on sampling from the observations, the decision based on the forecast will be the same as for climatology.
In other cases, decisions based on the weather input were confounded by non-weather related factors such as the wider energy mix. The performance at one-month lead time for CS2a, for example, showed a very low value (Table 2) because the prevalence of thermoelectric production caused a rise in the estimated price and reduced the profit margin. For CS5a, power prices depended on the performance for the whole of Colombia, whereas Enel only operates hydropower plants at two locations. In the latter case, it emerged that it would be preferable to have forecasts with a time horizon of 10–12 months in advance because the basins in Colombia are very large with long response times.

3.2. Relative Economic-Value-Based Verification

For CS7, with Shell as an industrial partner (Table 1), the Relative Economic Value (Section 2.5 and Equation (3)) of both a weather-pattern downscaling [30] and direct ECMWF wave forecasts were estimated. The latter approach was also chosen by KNMI for CS6 with TenneT (a European electricity transmission system operator) as the industrial partner and also addressed similar questions for offshore maintenance planning in a different area of the North Sea.
Relative Economic Value considers the choice facing a hypothetical decision maker who, depending on the assessment of likelihood of an adverse weather event, must seek to minimise their overall expense as guided by the forecast. For example, in the case of offshore operations, the user must choose to protect a planned period of maintenance (or not) depending on the forecast probability of the significant wave height (Hs) exceeding a given wave height threshold (e.g., 2.5 m). Expressed in this way, the Relative Economic Value is therefore analogous to a skill score of expected expenses [28]. A typical choice of C/L ratio by an offshore industry user for whom the cost of taking preventative action is low but the loss would be substantial is often considered as being around 0.1 [33]. However, while this is a generic estimate used for the parameterisation of risk within the decision model, it is acknowledged that depending on the desired framing of the decision by a different user, then they may select a different C/L ratio for their analysis accordingly.
The results suggested the value of both the direct and weather-pattern-derived wave forecasts were dependent not only on the C/L ratio, but also on the Hs threshold of interest. For example, using a typical C/L ratio for offshore operations of 0.1, the Relative Economic Value for a decision limited by a threshold of Hs < 3.5 m at one particular North Sea location of interest to Shell was shown to be ~0.3 at a sub-seasonal lead time of between 10 and 30 days ahead (Figure 2) while recognising that there was a considerable variability (oscillations) in the exact estimates as a consequence of the small sample size. There was still a small benefit over climatology (i.e., V > 0) when using these approaches for a decision limited by a threshold of Hs < 2.5 m for the same period, albeit with a lower value of ~0.05, whereas it was shown these achieved a negligible value over climatology for a decision limited by a threshold of Hs < 1.5 m—possibly as a consequence of the location being characterised by a higher typical wave climate.
The ability of the forecasts to discriminate between exceedance and non-exceedance events for different Hs thresholds, and therefore the Relative Economic Value, also varied with season. Again, despite oscillations as a consequence of the small sample size, results for the C/L ratio of 0.1 and the same example location showed that both forecast methods offered a greater Relative Economic Value in spring than autumn at a lead time of up to 30 days ahead with value for using the forecasts in decision making at Hs thresholds of both 2.5 m and 3.5 m. In the context of planning offshore operations in the seasonal ‘shoulder’ months on either side of the traditional summer work season, this suggested that these forecasts have more use in planning an early start to tasks than in scheduling an extension to an operation that perhaps experienced delays.
A similar approach to evaluation was taken in CS9 (Table 1). Much like the offshore equivalent, maintenance planning of a water treatment plant is an important consideration because decisions must be balanced to ensure these are able to continue to operate at full capacity when required and to minimise expenses from last-minute task cancellations. Amongst other factors, water companies such as Thames Water must schedule maintenance plans during periods of low water demand because water treatment capacity will be reduced during any scheduled maintenance windows. The costs of deferring maintenance increase closer to the planned period of maintenance; therefore, there is an economic advantage in making a decision as to whether to proceed or not as early as possible.
In this case, the cost of action three weeks ahead was minimal; i.e., a high C/L ratio. If, however, the action had to be cancelled less than three weeks ahead, the loss was much greater; i.e., a low C/L ratio. The decision to cancel a maintenance plan at a longer lead time was dependent on the perceived risk of high water demand putting strain on the system; i.e., the risk of water demand exceeding a user-specified threshold.
As for CS7, the Relative Economic Value varied with the season, although for CS9 the greatest value was observed in winter and spring for the particular threshold and C/L ratio combination considered. Again, the shape of the Relative Economic Value curves were similar across lead times. Figure 3 suggests that value was maintained with C/L ratios between ~0.1 and ~0.4, out to the full 30 days (note that only discrete lead time results are shown in Figure 3). These results suggested that averaged over time, making a decision based on the forecast will provide more benefit than using climatology regardless of the lead time considered. Moreover, the value was highest for decisions with a low C/L ratio, with a peak at 0.2 (Figure 3).
These two examples demonstrated that economic value could be achieved if the forecast helped the user to make a better decision than they otherwise would have.

4. Discussion of Economic Valuation Results

4.1. Forecast Quality/Skill vs. Economic Value

The focus in SECLI-FIRM was the value-add for decision making (Section 2 and Section 3). It was not intended to conduct a comprehensive assessment of how seasonal forecast quality affected value and it was beyond the scope of this paper to present all the comparisons of quality and value that were undertaken. These two aspects are, however, clearly related and forecast quality (or performance) cannot be ignored when considering value or barriers to uptake of seasonal forecasts [8,26,34].
Several different approaches were used within SECLI-FIRM to verify or assess the quality of the tailored seasonal forecasts developed for each case study with respect to a climatological baseline—in many cases it was ERA5 reanalysis data, while in others it was local observations (Table 1). The approaches used were established through interaction between the project scientists and industrial partners. These ranged from presentation of simple biases for deterministic forecasts (i.e., forecast minus observations; CS1 to CS5a) to simple evaluation of anomaly correlation and root-mean-square error (CS4b and CS5b) and comparison of distributions (CS8) to more complex metrics for the verification of probabilistic forecasts (Table 3) such as the use of the Continuous Ranked Probability Skill Score (CRPSS) (CS2b and CS6), as well as the Brier Skill Score (BSS) (CS5b, CS7 and CS9) and Receiver Operating Characteristic Skill Score (ROCSS) (CS7 and CS9).
Many of the latter metrics tend to be more complex for users to understand and interpret and encompass very specific meanings for terms such as ‘skill’ (Table 3) and ‘reliability’. This can cause issues in communication between different communities. Therefore, the term forecast ‘quality’ was used here. Nonetheless, metrics such as BSS and ROCSS have much utility. This is illustrated in the context of CS7 and CS9 below.
For CS7 (Table 1), the skill of probabilistic forecasts of significant wave height exceedance for various thresholds for North Sea locations of interest to the industrial partner Shell was assessed in terms of the BSS and ROCSS (Table 3). These metrics demonstrated that:
  • The direct model output had more skill than weather-pattern-derived wave forecasts at lead times less than 10 days ahead, whereafter both methods converged and tended towards climatology.
  • Both methods successfully discriminated between exceedance/non-exceedance events. At lead times less than 10 days ahead, the weather-pattern-derived wave forecasts were less able to differentiate hits and false alarms than the direct simulations, although they exhibited a similar skill beyond that.
  • The results indicated a strong dependence on the site, season, and Hs threshold of interest.
Importantly, however, forecast skill (as assessed through traditional performance metrics such as those shown in Table 3) was not the same as value to the user [35]. Forecast value was assessed in terms of the Relative Economic Value based on the cost/loss impact of a decision to proceed or postpone a planned operation (Section 2.5 and Section 3.2). The Relative Economic Value results demonstrated that despite the BSS indicating overall that there was less skill in the forecast beyond approximately 15 days, there was still value in the forecast at longer lead times (Figure 2). The reason for this apparent discrepancy was that measures such as the BSS or ROCSS present a summary of performance rather than being specific to a particular user decision or application, as is achieved by using the Relative Economic Value. In the latter case, ‘usefulness’ was defined by the user.
Similar conclusions were reached with respect to water demand thresholds for CS9. In this case, the demand forecast performed much better at longer lead times in winter than in summer. The ROCSS showed that the forecast was able to better discriminate between events above and below critical demand thresholds than climatology for all lead times out to 30 days ahead.
The value-add for CS9 was derived from understanding the cost/loss implications of the operational control teams within the water sector making decisions at different lead times combined with an understanding of the skill in the demand forecast at these different lead times. As seen in the other forecast performance metrics, the Relative Economic Value varied with the season, with the greatest values being observed in winter and spring. The Relative Economic Value curves, however, showed a greater similarity across different lead times than did the skill scores. This suggested that despite performance metrics indicating limited skill beyond ~15 days, value was maintained, with C/L ratios between ~0.1 and ~0.4 out to the full 30 days (Figure 3).
These examples from CS7 and CS9 illustrated that forecast quality (as assessed through metrics such as skill and discrimination—Table 3) was not the same as forecast value; therefore, verifying forecasts using classical skill scores would not necessarily result in the most useful model or decision point being selected, but only provided (in a general sense) a condensed view of the available skill without knowledge of the operation-specific requirements [30].

4.2. The Value of Event-Based Case Studies

Many of the SECLI-FIRM case studies focused on specific extreme events identified by the industrial partners. During the preparation of the SECLI-FIRM proposal, Enel, for example, identified a number of historical events that had affected its operations (Table 1). These events provided the basis for Enel’s work in SECLI-FIRM, which co-developed its case studies in conjunction with economic and seasonal forecast experts.
While it is instructive to assess the performance of seasonal forecasts for single events such as those considered in CS1 to CS5, it is clear that no general conclusions about the performance of a (probabilistic) seasonal forecasting system can be drawn from just a single event. At the same time, however, it is essential to learn how seasonal forecast systems can behave under single critical events because they significantly affect the management and business decisions of large corporations such as Enel. Single events also provide a good opportunity to learn about the nuances of seasonal forecasting and how to embed it in an operational system without the burden of extensive datasets. They ease the communication with users because they can often relate better to such case studies than to statistical metrics. Therefore, they provide a highly beneficial step towards the long-term uptake of seasonal forecasts by industrial users (Section 5).
Event-based case studies and real-time data were also used in CS7 and CS9 (Table 1) to demonstrate the tangible benefits of integrating the sub-seasonal climate services developed with both Shell and Thames Water into the decision processes. Following cold weather at the end of February/start of March 2018 (the so-called ‘Beast from the East’ event (https://www.metoffice.gov.uk/binaries/content/assets/metofficegovuk/pdf/weather/learn-about/uk-past-events/summaries/uk_monthly_climate_summary_201802.pdf; https://www.metoffice.gov.uk/binaries/content/assets/metofficegovuk/pdf/weather/learn-about/uk-past-events/summaries/uk_monthly_climate_summary_201803.pdf; and https://www.metoffice.gov.uk/binaries/content/assets/metofficegovuk/pdf/weather/learn-about/uk-past-events/summaries/uk_monthly_climate_summary_202102_v1.pdf, all accessed on 20 August 2022), freezing temperatures affected many offshore platforms with adverse wave conditions compounding access (Shell). Similarly, more than 200,000 customers were left without water for more than four hours and tens of thousands had their supply cut off for days due to a spike in water demand caused by increased leakage due to burst pipes (Thames Water). A case study analysis showed that prior to this event the new sub-seasonal climate services would have provided the user with a warning of an increased risk of adverse weather in terms of both the significant wave height (Shell) and spike in water demand (Thames Water) up to three weeks ahead of the incident. Following the ‘Beast from the East’, water companies reported paying around GBP 7 million in compensation. As such, this case study suggested the potential for a cost-saving benefit to the water sector that could be achieved through the earlier identification of severe demand events in winter.
The benefits of integrating (sub-)seasonal forecast data into both the Shell and Thames Water planning were also assessed in real-time; i.e., an ex post assessment [5,8], with a trial forecast set up at the start of November 2020. The forecast was updated twice a week with the latest ECMWF extended-range (30-day) forecast and disseminated to Thames Water. At the start of February 2021, the UK experienced similar weather to that observed in 2018 during the ‘Beast from the East’. Although not as significant for Shell (since it was not accompanied by adverse wave conditions), the cold weather in the second week of February particularly impacted Thames Water because it resulted in an increased number of burst pipes, leading to a spike in demand. However, earlier preparation in response to the forecast meant that Thames Water was able to build resilience in their network and as such, despite experiencing similar weather to the ‘Beast from the East’, the impact of the event was much smaller. For example, in 2018, almost 57,000 Thames Water customers experienced prolonged supply interruptions during the incident, whereas no customers were impacted during the 2021 event.

4.3. Challenges for Quantitative and Economic Valuation

The extent to which quantitative economic valuation could be implemented in practice varied among the case studies (Table 1). In large part, this depended on factors such as the availability of appropriate in-house modelling tools and historical economic data [22], existing use of weather information, and the ability of the industrial partners to share sensitive and commercial information with the case studies’ research partners. Several of these factors or challenges, particularly those relating to data, were also identified in earlier reviews of value-add assessment [6,8]. Vasilakos et al. [22] provided an example of how issues with available vessel hire costs were overcome for CS7.
The nature of the case studies, which focused on specific user decisions and applications, inevitably meant that even when quantitative assessments could be made, the results were in quite diverse forms; were based on different assumptions, inputs, and modelling tools (Table 1); and could not be directly intercompared.
Nonetheless, even when appropriate economic data were available, all of the case studies faced a number of challenges in producing economic estimates of value-add. These included:
  • Weak seasonal forecast signals close to climatology;
  • Limited forecast quality, particularly for extreme events;
  • Averaging of intra-season and intra-month variability, particularly for extreme events (see Section 3.1);
  • Non-weather-related confounding effects (e.g., energy mix, impacts of dam operations on inflow, and market effects beyond company control—see Section 3.1);
  • Changes in sector-specific models precluding long-term evaluation (e.g., National Grid energy demand models are updated annually);
  • Changes in forecasting systems confounding long-term verification and valuation assessment.
For the case studies that used deterministic approaches (albeit based on ensemble information (Table 1)), the first three challenges could be addressed, at least in part, by moving to fully probabilistic approaches (see Section 5 and Section 6) and considering shorter-term variability rather than monthly averages.

5. Enhancing the Practical Value of Seasonal Forecasts

Given the challenges associated with implementing economic valuation approaches (Section 4.3), many of the SECLI-FIRM case studies also took a more qualitative stance—either to complement the economic valuation (Table 1) or in place of it. These qualitative approaches gave consideration to the practical value of seasonal forecast information and could identify aspects of value not captured by the more quantitative approaches (Section 1 [8]).
While a number of user surveys were undertaken to gain feedback on the trial climate services co-developed for each of the SECLI-FIRM case studies, a systematic evaluation of practical value was not undertaken. Nonetheless, the experiences of co-developing these services highlighted several ways in which the uptake of seasonal forecast services and therefore practical value could be enhanced; e.g., by providing seasonal forecasts that are:
  • Usable: in formats that easily integrate with the user’s existing tools, systems, and approaches
  • Useful: as part of a seamless approach to the provision of information on different timescales, particularly if gradually extending the existing approach of the current user, who may already be basing decisions on weather forecasts as in the case of the SECLI-FIRM users.
  • User-friendly: in formats such as Teal Tool visualization (a tailored in-house version of the public Teal Tool (https://www.wemcouncil.org/wp/teal accessed on 20 August 2022) was developed by WEMC for Enel during SECLI-FIRM) that are easy to use, even for users unfamiliar with many of the intricacies of weather/climate data.
The three factors listed above all help to increase the fitness for purpose and reduce the usage costs of climate services, thereby enhancing their practical value [5].
This seamless approach to information provision was exemplified by the web interfaces/dashboard (Figure 4; for further information, please contact [email protected] or [email protected]) developed by KNMI for CS6 with TenneT as the industrial partner and a complementary focus to CS7 (Table 1). During co-design discussions, the industrial partner TenneT expressed the need for a forecasting system for significant wave height and wind speed with a consistent presentation across the full period relevant to planning of offshore operations. In this case, the availability of uniform information helped to increase the usability of the service [8]. In order to construct such a seamless multi-time-scale product ranging from hours to a year, KNMI combined four different probabilistic products from ECMWF (https://www.ecmwf.int/en/forecasts/documentation-and-support accessed on 20 August 2022):
  • Medium-range ensemble forecasts for day 0 to 14 (ENS).
  • Extended-range ensemble forecasts for day 15 to day 46 (ENS Extended).
  • Seasonal forecasts beyond 46 days and up to seven months ahead (SEAS5).
  • The remaining period up to one year ahead was provided by climatology based on ERA5 data over the period 1981–2020.
The approach taken in CS6 acknowledged that existing offshore maintenance planning decisions are typically made with an expectation of the conditions likely to be encountered for the time of year combined with the use of short-range (three days ahead) deterministic forecasts to support the final decision to proceed or not with an operation as an event draws nearer in time. Similarly, the developments pursued in CS7 focused only on the sub-seasonal period of between 10 and 32 days ahead, again with a focus on significant wave height as the key variable limiting the viability of these types of operations.
Discussions between the industrial and research partners and with seasonal forecast experts and developers of the trial climate services highlighted the importance of enhancing practical value by providing seasonal forecasts in such a way that users do not need to substantially change their decision-making processes or tools.
For the Enel case studies (CS1 to CS5a), this implied the use of single deterministic values (based on ensemble information derived from a single model or an average of four models–Table 1) as input to in-house modelling tools. Through participation in SECLI-FIRM, Enel now appreciates the benefits of a probabilistic approach (and indeed has been moving towards such a system with the development of in-house tools for Monte Carlo analysis of market scenarios now also incorporating weather information following SECLI-FIRM). Nonetheless, Enel acknowledged that this is still a challenge to adopt for many of the management decisions made by the company.
Moreover, although seasonal forecast models do not currently offer performances that are able to perfectly reproduce the extreme events of relevance, the use of these models for Enel represented an important intermediate step. Discussions such as those about the use of ensemble and probabilistic forecasts encourage users to think beyond the present and consider how their systems could be upgraded in the longer term. Enel also highlighted that innovation plays a key role within any company that wants to stay tuned into a very competitive market such as the Italian one. In a long-term view, attention needs to be given to the development of scientific research and to promising new research technologies. The expectation is that when seasonal forecast models improve their skill in the mid-/high latitudes, then they will be well placed with more awareness of their usage, strengths, and caveats, providing a further intangible benefit.
Work associated with CS8 (Table 1) with National Grid (one of the world’s largest publicly listed utility companies focused on the transmission and distribution of electricity and gas) as the industrial partner also highlighted the wider practical value of using seasonal forecasts to support decision making. The National Grid winter energy demand forecast is published in the Winter Outlook, a document that presents the company’s view of the security of supply for UK electricity systems for the winter ahead. The Winter Outlook has a broad range of users, from energy traders to utility companies. Despite challenges with engagement resulting from the COVID-19 pandemic, qualitative research was conducted to understand the requirements of these different decision makers and to understand the value-add of integrating seasonal forecast data into the Winter Outlook. The latter step was met with unanimous approval from the participants interviewed in the study. In general, seasonal forecasts are not skilful in the same way as short-term forecasts and have accepted limitations within the energy industry. For most potential users interviewed for CS8, this new data source would therefore contribute to influencing thinking rather than acting as a trigger for a specific decision or action. In this case, National Grid can be considered as a provider of climate information rather than as a final end-user, so there is potential value to National Grid in terms of reputation as a supplier of improved and useful seasonal forecast information.

6. Summary and Recommendations

6.1. Summary

The SECLI-FIRM case studies used several different approaches to assess the value-add of sub-seasonal and seasonal forecasts for decision making (Table 1) based on established co-production principles (Section 1). For the two groups of case studies, it was possible to apply quantitative economic valuation methods (Section 2): econometric modelling with Indicators of Performance to assess the outcomes (Enel CS1 to CS5a—Section 2.4 and Section 3.1); and both cost/loss (Relative Economic Value) analysis and avoided costs (CS7 with Shell and CS9 with Thames Water—Section 2.5 and Section 3.2, as well as CS6 with TenneT). Despite the generally low forecast skill typical of mid-latitudes and a tendency towards relatively weak seasonal forecast signals (particularly in the case of extremes such as heat waves, droughts, and high offshore winds and waves), a positive economic value was able to be established in the majority of cases (Table 2; Figure 2 and Figure 3). In particular, the event case studies illustrated that such forecasts can help the user make better decisions than they otherwise would have (Section 4.2).
These results highlighted that forecast quality/skill (Table 3) and value were not the same, although the skill may be a limiting factor for value (Section 4.1). They also illustrated the importance of assessing value from the perspective of specific user decisions and applications. Forecast quality and skill varied not only with the forecast and forecast method selected, but also by season, location, and variable and forecast lead times. This variability was also evident to some extent in the case study results for value-add. However, value-add also varied with user aspects such as attitude to perceived risk and acceptable cost/loss ratios (Section 3.2).
Similarly, it was evident that metrics such as Indicators of Performance and Relative Economic Value did not capture the full value-add for decision makers, particularly in terms of early adoption of seasonal forecasts. Many of the SECLI-FIRM case studies highlighted how practical value can be enhanced by providing seasonal forecasts as part of a seamless approach to using weather information (from short-term forecasts a few days ahead to seasonal forecasts a few months ahead) and in formats that do not require users to make major changes in their decision-making tools and processes (Section 5).
For industrial users who themselves supply derived weather-related information to downstream users, the ability to produce the best possible seasonal forecast information may bring value in the form of enhanced reputation and more uptake. For industrial users such as Enel that are working in highly competitive markets, early adoption of new technologies is also considered advantageous (Section 5).
The most frequent situation with respect to the Enel case studies (Table 1) was that the seasonal forecast models could follow the evolution of an extreme event but with a magnitude that had a very low influence on the portfolio management (Section 3.1). In other words, in many cases the business process would need stronger signals to be clearly influenced by the seasonal forecasts. For example, at the present time, Enel considers that while seasonal forecast models can be useful for a qualitative assessment of future scenarios, it is difficult to use them within an automated numerical process due to the weakness of the signals. Nonetheless, the company will continue to use seasonal forecasts and, with the development of their own economic models based on a probabilistic approach, will eventually be able to make the most of the seasonal forecast model information directly in their decision-making process. This shift in perspective by Enel is considered as one of the successes of SECLI-FIRM and was achieved through extensive and deep mutual dialogue.
Implementing each of the SECLI-FIRM case studies was time-consuming. It required the development of trust and understanding between the industrial and research partners in order to effectively co-design, co-develop, and assess the value-add for specific decisions and applications. It is encouraging that all industrial partners considered this investment worthwhile and remained on board despite the additional COVID-19-related challenges faced during a substantial part of the project.

6.2. Recommendations

6.2.1. Early Adopters and Champions

The sharing of the narratives and experiences of several of the industrial partners with their broader communities in meetings, workshops, and webinars, for example, was particularly valuable in helping to raise awareness and interest and therefore in helping to build the potential market for climate services [36]. Building relationships with such individuals who can be considered as early adopters and champions within their respective sectors is highly recommended.

6.2.2. Economic Expertise

As well as benefitting from the active involvement of early adopters and champions, the involvement of economic experts was beneficial and also recommended. Nonetheless, a number of challenges were identified in attempting to produce economic estimates of value-add (Section 4.3), particularly with respect to the availability of appropriate non-confidential economic data and when extreme events were not predicted with confidence. In general, all case studies found that economic value was harder to assess than was anticipated. Recommendations on future work to address the challenges relating to economic data availability were discussed by Vasilakos et al. [22].

6.2.3. Qualitative Approaches

The SECLI-FIRM experience supported the view that more qualitative approaches can identify aspects of value not captured by the more quantitative approaches (see Section 1 [7,8]). The examples of practical value and how to enhance this value presented in Section 5 were, however, obtained in a rather ad hoc way. A clear recommendation from SECLI-FIRM was the need to develop a more systematic framework for capturing the practical value of seasonal forecasts for decision making. Such a framework would facilitate a more robust and transparent approach. Due to the complex interactions and factors that influence the use of new services, it would require the strong involvement of social scientists. It should be seen as a complementary or parallel approach rather than replacing more quantitative approaches.

6.2.4. Forecast Performance

Forecast errors identified in the mid-to-high latitudes can be significant, especially for precipitation and wind associated with individual case study events (Section 4.1). A key recommendation from the industrial partners that were involved in the SECLI-FIRM case studies was that, while acknowledging the potential benefits of adopting probabilistic approaches, there remains a need to improve the forecast quality and increase performance through improved model physics while recognising that there are inevitably limits to predictability and that this is an enduring research challenge for the international scientific community [17].

6.2.5. Focus on the Decisions

The SECLI-FIRM case studies helped to fill a gap in the availability of comprehensive value-add assessments that focus on the decision-making context, embrace the principles of co-production, consider both the quantitative (e.g., economic) and qualitative (e.g., social) value of climate services, and provide examples of both ex ante and post ante assessment. They provide real-world demonstrations of how many of the challenges discussed in these previous studies can be addressed; for example, by using decision trees (Decision trees for each of the case studies are shown in a series of non-technical summary documents at: http://www.secli-firm.eu/case-studies accessed on 20 August 2022) to engage and to initiate sustained conversations with users and to identify the most appropriate points in specific decision-making processes at which to embed climate information and to assess value. The use of tools such as decision trees as a focus for co-production is highly recommended.

6.2.6. Building the Climate Services Market—From Micro to Macro Scale

SECLI-FIRM considered the value to individual users of climate services tailored to their specific needs; i.e., on the micro (company level) rather than macro scale. More efforts will be needed in the future in order to conceive climate services able to optimise energy efficiency—for overall value and socio-economic/environmental benefit—for the national and European markets. Furthermore, in order to fully assess value in the context of the wider climate services market and from a business model perspective, additional factors need to be considered such as the costs of providing and learning to use the services as well as any feedback or second-order effects associated with the increased uptake of climate services [5,6,36].

6.2.7. Building the Climate Services Market—Transferability to Other Sectors

The SECLI-FIRM case studies primarily considered the energy and, to a lesser extent, the water sectors, both of which can be considered as early adopters in the European climate services market [2,3,37,38]. Nonetheless, key insights and learning from the SECLI-FIRM case studies are potentially transferable to other sectors; notably, the broader energy and water sectors, as well as agriculture, forestry and timber, infrastructure, insurance, logistics and transport (particularly offshore and river), and retail including food and drink.

Author Contributions

Conceptualisation: C.M.G. and A.T.; Methodology: C.M.G., A.T., N.V., S.D., E.S. and M.F.; Case-study co-design and implementation: J.D.A., H.B., E.C., V.C., K.C., M.D.R., E.D., V.E.P., M.F., G.G., F.K., A.M.N., K.L.N., M.P., I.S., E.S., J.U. and J.V.; Writing—Original Draft Preparation, C.M.G.; Writing—review and editing: all authors. Visualization: A.T. (Figure 1), E.S., J.D.A., H.B., K.C. and E.D. (Figure 2 and Figure 3), G.G. and F.K. (Figure 4); Project administration: A.T.; Funding acquisition: A.T. All authors have read and agreed to the published version of the manuscript.

Funding

The SECLI-FIRM project was funded by the European Union’s Horizon 2020 Research and Innovation Program under Grant Agreement 776868.

Institutional Review Board Statement

Not applicable.

Informed Consent Statement

Not applicable.

Data Availability Statement

Not applicable.

Acknowledgments

We thank all members of the SECLI-FIRM consortium, including all industrial and research organizations and members of the Advisory Board, for their wider contributions to the research. We also thank Andrea Alessandri of the Institute of Atmospheric Science and Climate of the National Research Council, Bologna, Italy, for his valuable review comments on the manuscript.

Conflicts of Interest

The authors declare no conflict of interest.

References

  1. European Commission. A European Research and Innovation Roadmap for Climate Services; European Commission: Brussels, Belgium, 2015. [Google Scholar]
  2. Cortekar, J.; Themessl, M.; Lamich, K. Systematic analysis of EU-based climate service providers. Clim. Serv. 2020, 17, 100125. [Google Scholar] [CrossRef]
  3. Hoa, E.; Perrels, A.; Le, T.-T. From generating to using climate services—How the EU-MACS and MARCO projects help to unlock the market potential. Clim. Serv. 2018, 11, 86–88. [Google Scholar] [CrossRef]
  4. Tart, S.; Groth, M.; Seipold, P. Market demand for climate services: An assessment of users’ needs. Clim. Serv. 2020, 17, 100109. [Google Scholar] [CrossRef]
  5. Perrels, A. Quantifying the uptake of climate services at micro and macro level. Clim. Serv. 2020, 17, 100152. [Google Scholar] [CrossRef]
  6. Perrels, A.; Le, T.T.; Cortekar, J.; Hoa, E.; Stegmaier, P. How much unnoticed merit is there in climate services? Clim. Serv. 2020, 17, 100153. [Google Scholar] [CrossRef]
  7. Vaughan, C.; Dessai, S. Climate services for society: Origins, institutional arrangements, and design elements for an evaluation framework. Wires Clim. Change 2014, 5, 587–603. [Google Scholar] [CrossRef] [PubMed]
  8. Soares, M.B.; Daly, M.; Dessai, S. Assessing the value of seasonal climate forecasts for decision-making. Wires Clim. Change 2018, 9, e523. [Google Scholar] [CrossRef] [Green Version]
  9. Bosello, F.; Delpiazzo, E.; Dasgupta, S.; Costigliola, G.; Bagli, S. CLARA D4.1 Assessment Framework and Methodological Toolkit. Available online: https://www.researchgate.net/publication/324080018_Assessment_framework_and_methodological_toolkit_for_assessing_the_value_of_climate_services (accessed on 13 October 2022).
  10. Suhari, M.; Dressel, M.; Schuck-Zoller, S. Challenges and best-practices of co-creation: A qualitative interview study in the field of climate services. Clim. Serv. 2022, 25, 100282. [Google Scholar] [CrossRef]
  11. Troccoli, A. How are seasonal climate forecasts contributing to energy and water industry management? Open Access Government, 16 December 2020. 13 October 2022. Available online: https://www.openaccessgovernment.org/seasonal-climate-forecasts/100258/ (accessed on 13 October 2022).
  12. Gardiner, E.P.; Herring, D.D.; Fox, J.F. The U.S. Climate Resilience Toolkit: Evidence of progress. Clim. Change 2019, 153, 477–490. [Google Scholar] [CrossRef]
  13. Goodess, C.M.; Troccoli, A.; Acton, C.; Anel, J.A.; Bett, P.E.; Brayshaw, D.J.; de Felice, M.; Dorling, S.R.; Dubus, L.; Penny, L.; et al. Advancing climate services for the European renewable energy sector through capacity building and user engagement. Clim. Serv. 2019, 16, 100139. [Google Scholar] [CrossRef]
  14. Schuck-Zoller, S.; Cortekar, J.; Jacob, D. Evaluating co-creation of knowledge: From quality criteria and indicators to methods. Adv. Sci. Res. 2017, 14, 305–312. [Google Scholar] [CrossRef] [Green Version]
  15. Visman, E.; Vincent, K.; Steynor, A.; Karani, I.; Mwangi, E. Defining metrics for monitoring and evaluating the impact of co-production in climate services. Clim. Serv. 2022, 26, 100297. [Google Scholar] [CrossRef]
  16. Crespi, A.; Petitta, M.; Marson, P.; Viel, C.; Grigis, L. Verification and bias adjustment of ECMWF SEAS5 seasonal forecasts over Europe for climate service applications. Climate 2021, 9, 181. [Google Scholar] [CrossRef]
  17. Alessandri, A. On the optimization of Grand multi-model probabilistic performance and the independence of the contributing seasonal prediction systems. In preparation.
  18. Durose, C.; Richardson, L.; Perry, B. Craft metrics to value co-production. Nature 2018, 562, 32–33. [Google Scholar] [CrossRef] [Green Version]
  19. Laudien, R.; Boon, E.; Goosen, H.; van Nieuwaal, K. The Dutch adaptation web portal: Seven lessons learnt from a co-production point of view. Clim. Change 2019, 153, 509–521. [Google Scholar] [CrossRef]
  20. Meadow, A.M.; Ferguson, D.B.; Guido, Z.; Horangic, A.; Owen, G.; Wall, T. Moving toward the deliberate coproduction of climate science knowledge. Weather Clim. Soc. 2015, 7, 179–191. [Google Scholar] [CrossRef] [Green Version]
  21. Máñez Costa, M.; Oen, A.M.P.; Neset, T.-S.; Celliers, L.; Suhari, M.; Huang-Lachmann, J.-T.P.R.; Blair, B.; Jeuring, J.; Rodriguez-Camino, E.P.C.; Columbié, Y.J.; et al. Co-Production of Climate Services. CSPR Report No 2021:2; Centre for Climate Science and Policy Research: Norrköping, Sweden, 2021. [Google Scholar]
  22. Vasilakos, N.; Others, A.N. An introduction to methods for the economic assessment of seasonal climate forecasts: The SECLI-FIRM experience. Climate, In preparation for this special issue.
  23. Clements, J.; Ray, A.; Anderson, G. The Value of Climate Services Across Economic and Public Sectors: A Review of Relevant Literature; United States Agency for International Development (USAID): Washington DC, USA, 2013.
  24. Mylne, K.R. Decision-making from probability forecasts based on forecast value. Met. Apps. 2006, 9, 307–315. [Google Scholar] [CrossRef]
  25. Hersbach, H.; Bell, B.; Berrisford, P.; Hirahara, S.; Horanyi, A.; Munoz-Sabater, J.; Nicolas, J.; Peubey, C.; Radu, R.; Schepers, D.; et al. The ERA5 global reanalysis. Q. J. Roy. Meteor. Soc. 2020, 146, 1999–2049. [Google Scholar] [CrossRef]
  26. Alessandri, A.; Borrelli, A.; Navarra, A.; Arribas, A.; Deque, M.; Rogel, P.; Weisheimer, A. Evaluation of probabilistic quality and value of the ENSEMBLES multimodel seasonal forecasts: Comparison with DEMETER. Mon. Weather Rev. 2011, 139, 581–607. [Google Scholar] [CrossRef]
  27. Wilks, D.S. Statistical Methods in the Atmospheric Sciences; Academic Press: Burlington, VT, USA, 2011. [Google Scholar]
  28. Steele, E.; Neal, R.; Bunney, C.; Evans, B.; Fournier, N.; Gill, P.; Mylne, K.; Saulter, A. Making the most of probabilistic marine forecasts on timescales of days, weeks and months ahead. In Proceedings of the Offshore Technology Conference, Houston, TX, USA, 1–4 May 2017. [Google Scholar] [CrossRef]
  29. Richardson, D.S. Skill and relative economic value of the ECMWF ensemble prediction system. Q. J. Roy. Meteor. Soc. 2000, 126, 649–667. [Google Scholar] [CrossRef]
  30. Steele, E.; Neal, R.; Dankers, R.; Fournier, N.; Mylne, K.; Newell, P.; Saulter, A.; Skea, A.; Upton, J. Using weather pattern typology to identify calm weather windows for local marine operations. In Proceedings of the Offshore Technology Conference, Houston, TX, USA, 30 April– 3 May 2018. [Google Scholar] [CrossRef]
  31. Palmer, T.N. The economic value of ensemble forecasts as a tool for risk assessment: From days to decades. Q. J. Roy. Meteor. Soc. 2002, 128, 747–774. [Google Scholar] [CrossRef]
  32. Johnson, S.J.; Stockdale, T.N.; Ferranti, L.; Balmaseda, M.A.; Molteni, F.; Magnusson, L.; Tietsche, S.; Decremer, D.; Weisheimer, A.; Balsamo, G.; et al. SEAS5: The new ECMWF seasonal forecast system. Geosci. Model Dev. 2019, 12, 1087–1117. [Google Scholar] [CrossRef] [Green Version]
  33. Carrasco, A.; Saetra, O.; Bidlot, J.R. Cost-loss analysis of calm weather windows. J. Oper. Ocean. 2013, 6, 17–22. [Google Scholar] [CrossRef] [Green Version]
  34. Soares, M.B.; Dessai, S. Barriers and enablers to the use of seasonal climate forecasts amongst organisations in Europe. Clim. Chang. 2016, 137, 89–103. [Google Scholar] [CrossRef] [PubMed] [Green Version]
  35. Steele, E.; Brown, H.; Bunney, C.; Gill, P.; Mylne, K.; Saulter, A.; Standen, J.; Blair, L.; Cruickshank, S.; Morten, G. Using Metocean forecast verification information to effectively enhance operational decision-making. In Proceedings of the Offshore Technology Conference, Virtual/Houston, TX, USA, 16–19 August 2021. [Google Scholar] [CrossRef]
  36. Larosa, F.; Mysiak, J. Business models for climate services: An analysis. Clim. Serv. 2020, 17, 100111. [Google Scholar] [CrossRef]
  37. Soares, M.B.; Dessai, S. Exploring the use of seasonal climate forecasts in Europe through expert elicitation. Clim. Risk Manag. 2015, 10, 8–16. [Google Scholar] [CrossRef] [Green Version]
  38. Bruno Soares, M.; Alexander, M.; Dessai, S. Sectoral use of climate information in Europe: A synoptic overview. Clim. Serv. 2018, 9, 5–20. [Google Scholar] [CrossRef]
Figure 1. The twin experimental approach to assess the value-add adopted in SECLI-FIRM using a climatological baseline (control case) augmented by seasonal forecasts (test case).
Climate 10 00152 g001
Figure 2. Relative Economic Value of ensemble significant wave height (Hs) forecasts with lead times up to 30 days calculated for a cost/loss (C/L) ratio of 0.1 at a North Sea location corresponding to Hs thresholds of 1.5 (green), 2.5 (orange), and 3.5 (purple) meters. Direct forecasts (dashed lines) are shown together with those for the weather pattern (WP)-derived forecasts (solid lines).
Climate 10 00152 g002
Figure 3. Relative Economic Value (vertical axis) for different cost/loss ratios (horizontal axis) and forecast intervals of 3 to 28 days (coloured lines) estimated for water treatment maintenance planning (CS9).
Climate 10 00152 g003
Figure 4. Screenshot of the interactive dashboard to disseminate seamless forecasts of significant wave height and wind speed for CS6. The user can select different thresholds and risks profiles to transform the probabilistic forecast to a go/no go answer.
Climate 10 00152 g004
Table 1. Overview of the SECLI-FIRM case studies from the perspective of value-add assessment.
Case Study and Co-Design PartnersClimate InputSource of Observed DataForecast InformationForecast VerificationEconomic Valuation ApproachEconomic Valuation Metric and Data Used
Case study 1: Heat waves in Italy—July 2015
Case study 2a: Mild conditions in Italy—October–December 2015 (drought) and January–March 2016 (wet)
Case study 3: Wind variability in Southern Italy—March 2016 strong/weak winds
Case study 4a: High/low winds in Spain—January–March 2014 (strong winds) and December 2014–January 2015 (low winds)
Case study 5a: El Niño and Colombia energy mix—January–March 2015 and 2016
ENEL
Temperature, precipitation, and wind speed.
Energy demand and generation estimated from climate input by means of proprietary models and link functions, respectively.
ERA5Deterministic.
ECMWF SEAS5 (weighted mean of ensemble members).
Multi-model average: ECMWF, Météo-France, Met Office, and Deutscher Wetterdienst (average of boosted mean of each model—calculated from ensemble members).
Monthly averages forecast with lead times of 1/3/5 months.
Simple biases (forecast minus observations).
Mean absolute error.
Econometric modelling using Enel’s in-house models, including hedging strategy on market risks and weather exposure.Profit-company data.
Indicators of Performance (IP) = margin minus profit at risk (millions of Euros).
Case study 2b
Hydropower in Italy
Alperia
Inflow estimated from weather variables using downscaling and machine learning.ERA5 and local gaugesProbabilistic.
ECMWF SEAS5.
Monthly averages forecast at lead times of 1–6 months.
Mean error, mean absolute error, root-mean-square error.
Continuous Ranked Probability Skill Score (CRPSS).
Three different input configurations evaluated for estimation of inflow, hydropower production, and total production.Potential value of profits.
Results not presented in this paper.
Case study 4b
Wind prediction in Spain—January–March 2014 (strong winds) and December 2014–January 2015 (low winds).
UL
Wind flow estimated using random forest models with various predictors.Local observations from the State Meteorological Agency of Spain (AEMET).Deterministic.
ECMWF SEAS5.
Monthly averages forecast at lead times of 1–5 months.
Time series correlation and root-mean-square error.Performance of different forecasting approaches assessed. No valuation assessed as there was no partner with an economic model.Results not presented in this paper.
Case study 5b
Colombia hydropower
UL/Celsia
Inflow estimated (a) directly from forecasts, (b) using teleconnections based on sea surface temperature, and (c) random forest models with various predictors. Inflow measured at Celsia’s hydro plants, precipitation from nearby observations of the State Meteorological Agency of Colombia (IDEAM) and ERA5, ERA5-LAND, and GPCC datasets.Deterministic/probabilistic, depending on the forecast model.
Forecast source using (a) best model combination selected from 11 independent forecasting models, (b) ERA5S.
Monthly averages forecast at lead times of 1–3 months.
Time series correlation and root-mean-square error.
Brier Skill Score (BSS).
Performance of different forecasting approaches assessed and compared with analog forecasts based on synoptic conditions of the last 3–6 months.
Confidentiality issues precluded formal economic assessment. An estimate based on forecast performance was attempted instead.
Results not presented in this paper.
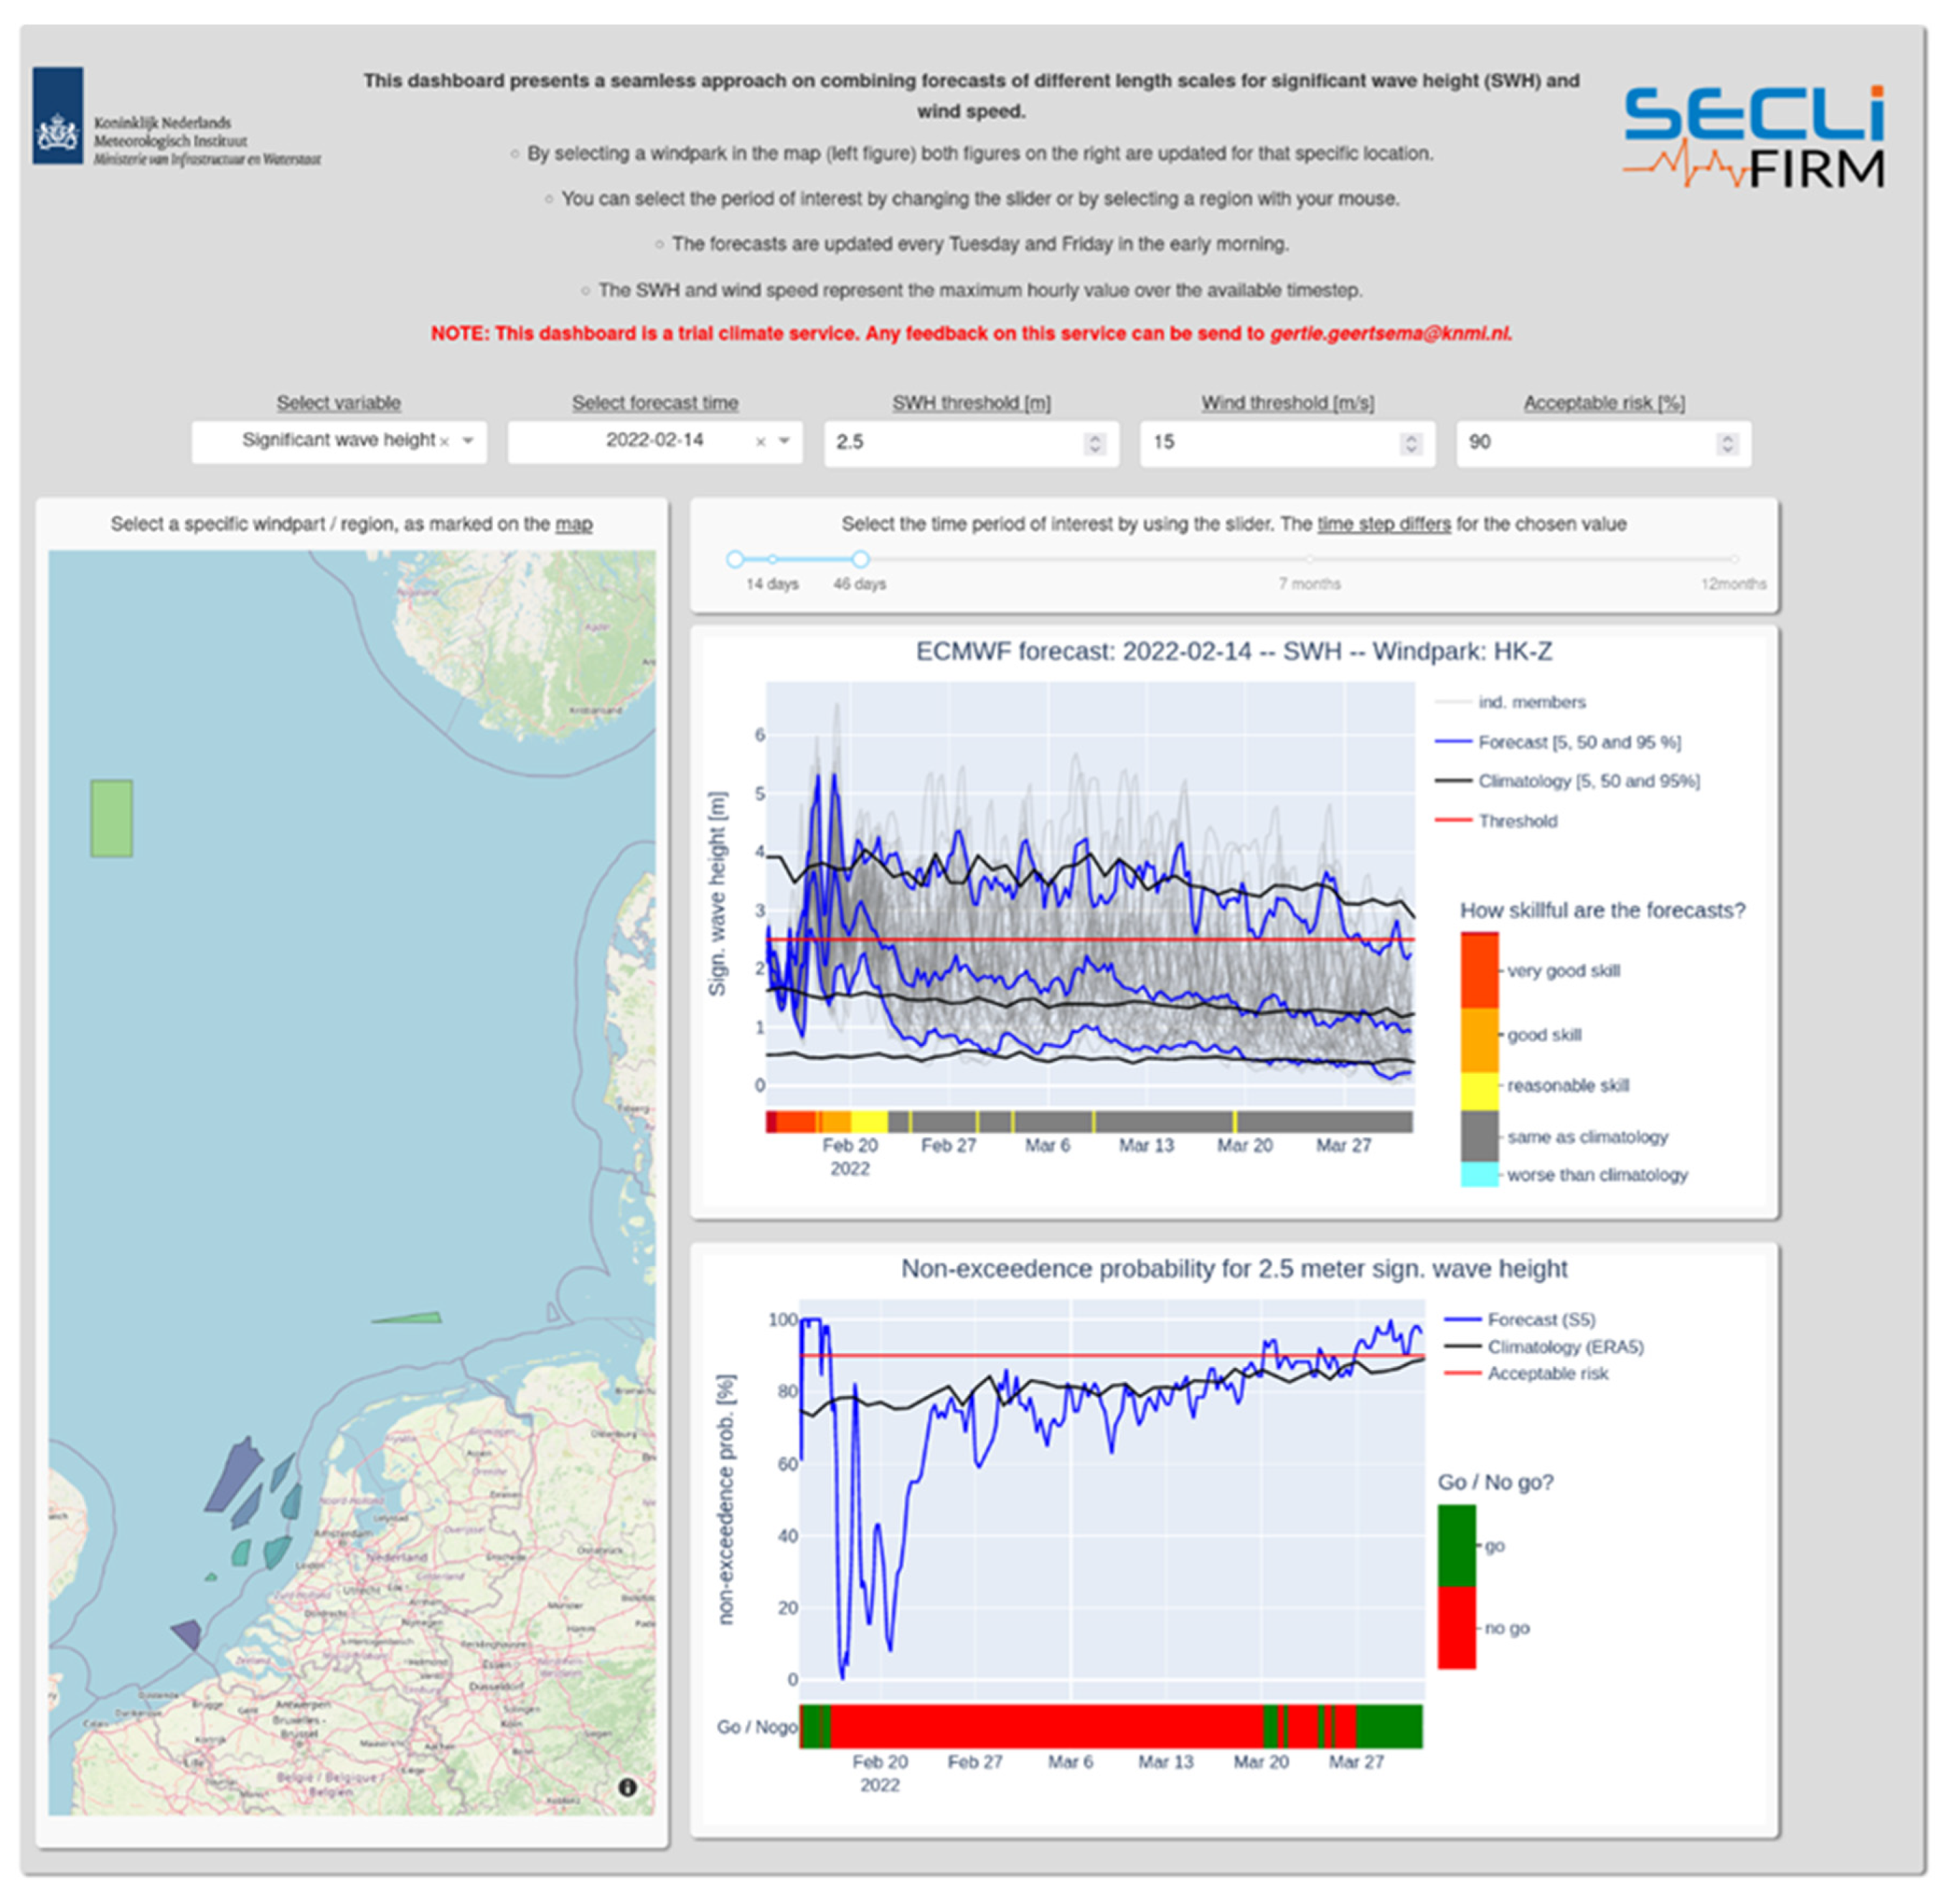
Case study 6
Offshore maintenance
KNMI/TenneT
Probability of exceedance of user-specified thresholds for significant wave height and wind speed.ERA5Probabilistic.
ECMF SEAS5.
Daily averages forecast at lead times of 46 days to seven months
(also used in the trial climate service: ECMWF extended-range and medium-range forecasts; see Section 5).
Root-mean-square error.
Continuous Ranked Probability Skill Score (CRPSS).
Avoided costs.
Direct vessel hire cost savings investigated jointly with and reported in case study 7.
Vessel hire daily rates allow estimation of avoided costs.
Results not shown in this paper.
Case study 7
Offshore maintenance
Met Office/Shell
Probability of exceedance of user-specified thresholds for significant wave height.
Estimated directly from forecast values and using weather patterns.
Local observations.Probabilistic.
ECMWF extended range forecast.
Daily values forecast up to 30 days ahead.
Brier Skill Score (BSS).
Receiver Operating Characteristics Skill Score (ROCSS).
Relative Economic Value. Avoided costs. Relative Economic Value.
Avoided costs based on vessel hire daily rates used in the Beast from the East case study.
Case study 8
Winter Outlook for energy demand and generation
Met Office/National Grid
Temperature including average cold spell, precipitation, and wind.
Forecasts used to adjust climatological distributions presented in the Winter Outlook.
Local observations.Probabilistic.
Met Office three-monthly outlook (based on GloSea5).
Seasonal (3-monthly) means and daily standard deviations forecast at lead times of 1–3 months.
Comparison of distributions.Qualitative, including survey. See Section 5.National Grid demand simulations.
Results not shown in this paper.
Case study 9
Water demand and asset maintenance/management
Met Office/Thames Water
Probability of exceedance of user specified water demand thresholds. User-demand data.Probabilistic.
ECMWF Extended-range forecast.
Daily values forecast up to 30 days ahead.
Brier Skill Score (BSS).
Receiver Operating Characteristics Skill Score (ROCSS).
Relative Economic Value. Avoided costs (regulatory fines).Relative Economic Value.
Cost estimates/fines, costs of extreme weather events, maintenance associated with the Beast from the East case study.
Table 2. Summary of results for the quantification of value-add in the Enel evaluation process for case studies CS1 to CS5a. Results are shown for different lead times (five (M-5) months, three (M-3) months, and one (M-1) month) and for a single model (ECMWF—columns A–D) and a multi-model average (Columns E–H). Indicators of Performance (IP) expressed in millions of Euros (millions of US dollars for CS5): IPf = seasonal forecast IP (test); IPp = actual IP (perfect forecast using actual data); IPc = climatology IP (control). Columns C and G show: YES—Equation (2) was fulfilled; NO—Equation (2) was not fulfilled. Columns D and H show the differences between the forecast and climatology performances; the value shows an improvement (−) or degradation (+) in the IP.
Single Model ECMWFMulti-Model Average
ABCDEFGH
Mni EUR/Mni USD IPf − IPpIPc − IPp|IPf − IPp| < |IPc − IPp||IPf − IPp| − |IPc − IPp|IPf − IPpIPc − IPp|IPf − IPp| < |IPc − IPp||IPf − IPp| − |IPc − IPp|
CS1M-5−3.7−9.0YES−5.3−3.7−9.0YES−5.3
M-3−5.2−9.0YES−3.8−4.7−9.0YES−4.3
M-1−7.5−9.0YES−1.5−0.8−9.0YES−8.2
CS2a-Period 1M-320.022.0YES−2.021.322.0YES−0.7
M-115.022.0YES−7.021.522.0YES−0.5
CS2a-Period 2M-31.04.4YES−3.42.04.4YES−2.4
M-1−22.54.4NO18.1−30.44.4NO26.0
CS3M-54.8−1.0NO3.80.8−1.0YES−0.1
M-3−2.7−1.0NO1.7−5.9−1.0NO4.9
M-1−0.4−1.0YES−0.6−1.9−1.0NO0.9
CS4a-Period 1M-345.153.6YES−8.552.253.6YES−1.4
M-174.953.6NO21.356.353.6NO2.7
CS4a -Period 2M-30.5−3.4YES−3.0−5.1−3.4NO1.7
M-1−18.4−3.4NO14.9−17.6−3.4NO14.1
CS5a Period 1M-3−28.4−37.0YES−8.56.6−37.0YES−30.4
M-18.6−37.0YES−28.423.6−37.0YES−13.4
CS5a Period 2M-36.8−44.4YES−37.6−23.8−44.4YES−20.6
M-1−37.4−44.4YES−7.0−4.0−44.4YES−40.5
Table 3. Metrics used to verify performance of probabilistic seasonal forecasts in SECLI-FIRM case studies.
Verification MeasureMethodDescriptionUse in SECLI-FIRM
SkillBrier Skill Score (BSS)A measure of the mean squared error of the ensemble forecast. How skilful is the forecast relative to climatology? Maximum score is 1, while negative values indicate less skill than climatology.CS5b
CS7
CS8
SkillContinuous Ranked Probability Skill Score (CRPSS)A measure of the difference between the forecast and observed cumulative distributions, equal to the integral of the Brier score over all possible thresholds. How skilful is the forecast relative to climatology?CS2b
CS6
DiscriminationReceiver Operating Characteristics Skill Score (ROCSS)A measure of the ability of the forecast to discriminate between observations; that is, to have a higher prediction frequency for an outcome whenever that outcome occurs. Does the forecast discriminate between true positives (hits) and false positives (false alarms)? CS7
CS8
Publisher’s Note: MDPI stays neutral with regard to jurisdictional claims in published maps and institutional affiliations.

