Assessing News Contagion in Finance

Department of Economics and Management Science, University of Pavia, Pavia, 27100 Lombardy, Italy
*
Author to whom correspondence should be addressed.
Econometrics 2018, 6(1), 5; https://doi.org/10.3390/econometrics6010005
Submission received: 29 May 2017
/
Revised: 18 December 2017
/
Accepted: 25 January 2018
/
Published: 3 February 2018
(This article belongs to the Special Issue Big Data in Economics and Finance)
Abstract
:The analysis of news in the financial context has gained a prominent interest in the last years. This is because of the possible predictive power of such content especially in terms of associated sentiment/mood. In this paper, we focus on a specific aspect of financial news analysis: how the covered topics modify according to space and time dimensions. To this purpose, we employ a modified version of topic model LDA, the so-called Structural Topic Model (STM), that takes into account covariates as well. Our aim is to study the possible evolution of topics extracted from two well known news archive—Reuters and Bloomberg—and to investigate a causal effect in the diffusion of the news by means of a Granger causality test. Our results show that both the temporal dynamics and the spatial differentiation matter in the news contagion.
JEL Classification:
C83; C12; E58; E61; G02; G141. Introduction and Motivation
With the rapid growth of online information, text analysis and categorization have become core topics in many different disciplines ranging from politics to finance and all the social sciences in general. Text analytics techniques are an essential part of text mining and are used to classify documents (of any kind) and to find interesting information therein.
The interpretation of text by machines, the task of natural language processing (NLP), is complex due to the richness of human language, as well as the ambiguity present at many levels, including the syntactic and semantic ones. From a computational point of view, processing language means dealing with sequential, highly variable and sparse symbolic data, with surface forms that cover the deeper structures of meaning. Despite these difficulties, there are several methods able to extract part of the information content present in collections of texts. Some of these rely on handcrafted features, while others that are data driven exploit statistical regularities in language and often rely on word representations. Class based models, for example, learn classes of similar words based on distributional information, such as Brown clustering (Brown et al. 1992) and Exchange clustering (Martin et al. 1998; Clark 2003). Soft clustering methods, such as Latent Semantic Analysis (LSA) (Landauer et al. 1998) and Latent Dirichlet Allocation (Blei et al. 2003), associate words to topics through a distribution over words of how likely each word is in each cluster/topic. In the last years, many contributions employ neural networks and semantic vector representations (Mikolov et al. 2013; Pennington et al. 2014; Hochreiter and Schmidhuber 1997; Cho et al. 2014) to model complex and non-local relationships in the sequential input (see also Socher et al. 2011, 2013; Collobert et al. 2011; Kalchbrenner et al. 2014). If we focus specifically on the finance related research area, we can list several papers that take advantage of text analytics per se or as an additional source of information to be used. Central banks themselves have been recently starting to recognize the utility of text data in financial risk analytics (Bholat et al. 2015; Hokkanen et al. 2015).
In this paper, we follow a stream of research based on official news and we deepen a particular aspect: improving information elicitation to enhance the model with contextual information (metadata and covariates) related to the characteristics and environment in which the entities of interest are operating to discover and analyze contagion pattern in the information flow. Indeed, the introduction of contextual information in the models is not a straightforward process but requires a careful choice of the additional information provided in order not to introduce additional noise. The addition of metadata aims at increasing the potential value of text as a source in data analysis (Soo 2013). More in detail, we choose as covariates temporal and spatial variables, so to help the understanding of possible evolution pattern or contagion effects in the information flows. In this respect, we employ a modified version of the well-known Latent Dirichlet Allocation topic model called Structural Topic Model (STM) proposed by Roberts et al. (2016a) that explicitly includes covariates in the model fitting. To our knowledge, this is the first attempt to assess the contagion effect through news in finance. In particular, we propose to analyze banks’ related news and correlate the news topics with the banks’ nationality and the news time stamp aggregated at either monthly or weekly basis.
This recent rise of interest around the integration of text-based computational methods for the assessment of financial risk is fuelling a rapidly growing literature that can be divided in two main streams according to the type of textual source: social media blogs and platform (namely Twitter, Facebook, and Google Trends) or official news archive (above all, Reuters and Blomberg).
In the first case, the constant production of detailed online information streaming from social networking and micro-blogging platforms, is increasingly attracting the attention of researchers and practitioners especially for the detection and monitoring of sentiments and opinions. Indeed, social media contents may constitute a relevant asset for financial institutions to gain useful insights about the clients’ needs and perceptions in real time. Insofar, extracting sentiments from Twitter has been already employed for several purposes: to predict the trends of Dow Jones Index (Bollen et al. 2011); to check the effects of sentiments on stock price and volume in the Dow Jones Index (Ranco et al. 2015); to predict market prices in the Italian financial market (Cerchiello and Giudici 2016); or to estimate Italian banks systemic risk (Cerchiello et al. 2017b). There are many other papers in this field leveraging Twitter for financial analysis and prediction (e.g., Sprenger and Welpe 2010; Brown 2012; Mittal and Goel 2012; Rao and Srivastava 2012; Nann et al. 2013; Oliveira et al. 2013). Another strand of literature uses social media as an alternative way to release information, thus reducing information asymmetry and improving stock liquidity, attracting more investors. Other papers, such as Chawla et al. (2016) or Giannini et al. (2013), use Twitter data dynamically to investigate how information diffusion affects trading and how tracks changes in investor disagreement.
On the other hand, if we consider official news as source of information, not only sentiment but also content analysis is crucial, since the resulting outcomes are used for assessing correlation with events of interest (typically stress events). Many of the proposed approaches have been based on hand-crafted dictionaries that, despite requiring work to be adapted to single tasks, can guarantee good results due to the direct link to human emotions and the capability of generalizing well through different datasets (e.g., Nyman et al. 2015; Soo 2013). The first analyzes sentiment trends in news narratives in terms of excitement/anxiety and find increased consensus to reflect pre-crisis market exuberance, while the second correlates the sentiment in news with the housing market. Despite the good results, there are applications where it could be preferable to avoid dictionaries in favour of more data driven methods, which have the advantage of higher data coverage and capability of going beyond single word sentiment expression. Malo et al. (2014) provide an example of a more sophisticated supervised corpus-based approach, in which they apply a framework modeling financial sentiment expressions by a custom dataset of annotated phrases. In the last years, different papers, embracing the data driven approach, have used the deep learning models to analyze textual data and have shown good results in predicting distress events of financial institutions (Rönnqvist and Sarlin 2017; Cerchiello et al. 2017a) and in predicting S&P500 stocks (Ding et al. 2015).
This paper continues exploiting this line of research by applying a fully data driven model with unsupervised semantic generalization, supervised only by a posterior interpretation of the discovered topics.
2. The Model
Text analysis is a complex task that poses several different issues ranging from the problem of polysems (multiple senses for given words) and synonyms (same meaning for different words) to the computational effort and allocation of largely sparse data matrices. One of the first effective models able to solve some of those issues is represented by Latent semantic analysis (LSA) (Deerwester et al. 1990). The basic idea of LSA is to work at a semantic level by reducing the vector space through Singular Value Decomposition (SVD), producing occurrence tables that are not sparse and that help in discovering associations between documents. To establish a solid theoretical statistical framework in this context, Hofmann (1999) proposed a probabilistic version of LSA (pLSA). Such model, also known as the aspect model, is rooted in the family of latent class models and is based on a mixture of conditionally independent multinomial distributions for modeling the words-documents pair. The intention from the introduction of pLSA was to offer a formal statistical framework, helping the parameter interpretation issue as well. The goal was achieved only partially, because the multinomial mixtures, which components can be interpreted as topics, offer a probabilistic justification at words but not at documents level. In fact, the latter are represented merely as a list of mixing proportions derived from mixture components. Moreover, the multinomial distribution presents as many values as there are in the training documents and therefore it learns topic mixture on those trained documents. The extension to previously unseen documents is not appropriate since there can be new topics. To overcome the asymmetry between words and documents and to produce a real generative model, Blei et al. (2003) proposed the LDA (Latent Dirichlet Allocation). The idea for this new approach emerges from the concept of exchangeability referred to the words in a document that unfolds in the “bag of words” assumption: the order of words in a text is not important. In fact, the LDA model is able to capture either the words or documents exchangeability unlike LSA and pLSA. On the other hand, LDA is a generative model in any sense since it posits a Dirichlet distribution over documents in the corpus, while each topic is drawn from a Multinomial distribution over words. However, note that Girolami and Kaban (2003) have shown that LDA and pLSA are equivalent if the latter is under a uniform Dirichlet prior distribution. Obviously, LDA does not solve all the issues. The main restriction embedded in the LDA approach (due to the Dirichlet distribution) refers to the assumption of independence among topics. The immediate consequence was to tackle the issue by introducing the Correlated Topic Model (CTM), as proposed in (Blei and Lafferty 2006). CTM introduces correlations among topics by replacing the Dirichlet random variable with the logistic normal distribution. Unlike LDA, CTM presents a clear complication in terms of inference and parameter estimation since the logistic normal distribution and the Multinomial are not conjugate. To bypass the problem, the most recent alternative is represented by the Independent Factor Topic Models (IFTM) introduced in (Putthividhya et al. 2009). Such proposal makes use of a latent variable model approach to detect hidden correlations among topics. The choice to explore the latent model world allows to choose among several alternatives ranging from the type of relation, linear or not linear, to the type of prior to be specified for the latent source.
In this paper, we focus on one of the most recent version of the LDA model proposed by Roberts et al. (2016a). This new model, called Structural Topic Model (STM), considers the explicit inclusion of covariates that can help in describing and interpreting the topics along the corpus. More specifically, STM allows for covariates to influence two elements of the model: the topic prevalence and the topical content. With the former, the authors refer to the proportion of a document devoted to a topic, while the latter describes the word rates used in discussing a topic. Roberts et al. take advantage of the Generalized Linear Models framework to accommodate for general covariate information (or meta-data) into topics model thanks also to two previous papers from Mimno and McCallum (2008) and Eisenstein et al. (2011).
Since STM depends upon LDA, we first summarize the latter and then we move to the former. Blei et al. (2003) defines the model as follows:
where for is collection of N documents and words within each document listed in a common vocabulary containing V words, with N the number of documents and the number of words in the document . Assuming that we have k topics for , is the length-K per document topic distribution for document , is the length-V per topic word distribution for the k-th topic and is the topic for the j-th word in . Finally, and are hyperparameters that influences respectively the documents distributions over topics and the topics distributions over words.
Coming to the Structural Topic Model, Roberts et al. (2016a) defines it as follows:
where , , is the covariates matrix, is the coefficient vector, is the covariance matrix, is the word distribution for document and k-th topic, m is a reference log-word distribution while , and represent the deviations from the baseline due, respectively, to the topics, the covariates and their interaction effect.
The strength of the model relies on its three different components clearly represented in Equations (5)–(8): the topic prevalence is modeled by Equation (5) through a logistic normal distribution which mean is not constant but it depends on the covariates. The topical content is represented by Equation (6) according to which the word occurrences are modeled in terms of log-transformed rate deviations from a corpus based distribution m. The parameters , , represent the specific deviations: respectively for the topic, for the covariates and for the interaction topic-covariates. Finally, Equations (7) and (8) comprise the central part of the model reporting the distribution of topics and of words both sampled from a Multinomial distributions. LDA and STM are similar in the core language of the model that is the sampling mechanism of the topics and of the words as appear from Equations (3), (4), (7) and (8). The main difference is in the parameters of the Multinomials that, for the STM model, depend upon covariates.
Since our research hypothesis aims at analyzing a contagion effect and its pattern in the diffusion of topics among countries according to a temporal dimension, we need a method to assess such effect. In the following, we introduce the Granger causality test, a well-known econometric test useful when causality is the object of interest.
Granger causality entails the statistical notion of causality based on the relative forecast power of two time series. Time series j is said to “Granger-cause” time series i if past values of j contain information that helps in predicting i above and beyond the information contained in past values of i alone.
In a well known paper (Granger 1969), Granger has proposed a useful test based on the following principle: if lagged values of time series contribute to foresee current values of time series in a forecast achieved with lagged values of both and , then we say Granger causes . As was first shown in (Sims 1972), the Granger causality corresponds to the concept of exogeneity and it is therefore necessary to have a unidirectional causality in order to guarantee consistent estimation of distributed lag models. The mathematical formulation of this test is based on linear regressions of on and
In our research framework, we propose to calculate the Granger causality test on pairs of times series defined as follows:
- : given a topic k, the vector of document counts showing a topic prevalence larger than a specified threshold with regards to country q at time t.
- : given a topic k, the vector of document counts showing a topic prevalence larger than a specified threshold with regards to country p at time t.
To ease the notation, we refer to given the topic k and country q (similar to country p).
Thus, applying the test for a given pair of count vectors for topic k and countries q − p, we result in fitting the following equations:
Our null hypothesis is therefore: . Taking into account that we are dealing with monthly time series and weekly time series, in our tests, we have considered up to two lags as plausible windows of analysis.
3. The Data
The data come from two public financial news dataset extracted by Reuters News and Bloomberg News containing respectively 106,521 and 447,145 documents1. The data span a period from October 2006 to November 2013. Such time frame is very interesting from a financial perspective since it comprehends the sub-prime crisis started in 2007 and its following evolution with modest recovery and the beginning of the sovereign debt crisis. Moreover, beside these major topics, there have been many spot hot topics which have periodically grabbed the attention of the media like for example the Madoff fraud, Barclays and Deutsche bank Libor manipulation investigation and UBS tax evasion controversy.
The datasets contain a broad variety of articles ranging from analysts’ recommendations to earning announcements to legal investigation news. All the news report the timestamp of the corresponding day. Such datasets need to be carefully inspected and cleaned up according to the purpose of the analysis. In our case, the analysis focuses on the SIFIs banks (Systemically Important Financial Institution according to Basel Committee definition) listed in Table 1 and thus we cleaned the dataset to reduce as much as possible the non-bank related news. Then, we have tokenized each document into sentences and kept only those containing SIFI labels (see Table 1). We have developed a dictionary of bank names to be matched with the available sentences and we do not include bank tags and tickers due to their possible ambiguity with other entities (for example City Group ticker C and Santander SAN can be easily confused with something else). In addition, to associate a phrase to a single bank and to avoid multiple imputation, we have kept sentences referring only to one bank. Finally, since many of these institutions are very active in the investment banking sector and often release reports on other companies, we have dropped the sentences containing keywords associated with this kind of news, such as “analyst”, “analysts”, “said”, “note”, “report”, and “rating”. These words have been easily detected by looking at the wordcloud of news referred to such news. This selection procedure is somehow restrictive, but it is necessary to deal with a clean dataset focused only on banks related news. The phrases remaining after this filtering are 136,419 and cover many of the SIFI with the proportions reported in Table 1.
In Table 2, we report the number of sentences grouped by country. It clearly appears that the distribution of the sentences across the country is heterogeneous and this has an impact on the comparability of results across banks and countries. Thus countries, not showing enough news have been excluded from the analysis according to criteria we explain below.
To fit the STM model, we are requested to choose appropriate covariates that we consider relevant in the description of the topics. To this purpose, we have considered a temporal variable reporting the month or the week in which the news have been released. For sake of comparability and robustness, the analysis has been carried out with two different versions of the Reuters-Bloomberg dataset with regards to the temporal dimension. Thus, the time covariate has been considered according to two different aggregation strategies:
- Monthly-based: The time stamp of each news has been grouped on a monthly basis, obtaining 85 months starting with October 2006 (Month 1) and ending with November 2013 (Month 85).
- Weekly-based: The time stamp of each news has been grouped on a weekly basis, obtaining 370 weeks starting with 23rd October 2006 (Week 1) and ending with 19th November 2013 (Week 370).
This strategy allowed us to fit and compare two final configurations of the STM: the first one assuming a monthly contagion effect, the second one, indeed more realistic, a weekly contagion transmission. However, this approach has a huge impact on the list of SIFI banks that can be reliably evaluated: we do not have enough news on a weekly basis for all banks, thus we must consider only the most covered ones by the media. As a result, in the monthly based analysis, we cope with 25 banks, that is those having at least 10 sentences per month on average or at least 1000 sentences during the considered period. In the weekly based analysis we consider 10 banks, that is those having at least 10 sentences per week on average during the considered period.
Along with the temporal variable, we have considered a spatial information mapping each SIFI banks onto the corresponding country (namely the country in which the headquarters is based, the CEO works and the board meets). Then, we have introduced as many dummy variables as the involved countries: five in the monthly based case (France, Germany, Switzerland, UK and USA) and four in the weekly based case (Germany, Switzerland, UK and USA).
The rationale behind the creation of a couple of temporal and spatial covariate is the following: while the formers help us in monitoring the evolution of news along the time horizon, the latter is useful in disentangling the country/institution effect.
4. Results
To select a model with a good interpretability, we have tested different topic numbers and inspected manually the meaning of the resulting configurations. To evaluate the clarity power of the resulting configurations, we have considered the top 20 words associated to each topic according to the highest probability measure and to the frequency measure “FREX”. In (Roberts et al. 2016b), the FREX metric has been proposed to measure exclusivity in a way that balances word frequency. FREX is the weighted harmonic mean of the word’s rank in terms of exclusivity and frequency.
We tested six different configurations for the monthly based analysis with 5, 10, 12, 15, 25, and 35 (simulation time in Table 3), and we concluded that results with 10, 12 and 15 topics are stable and consistent with each other in terms of arguments identified (see Table 4). We also tested different configurations for the weekly based analysis with 10, 15 and 25 (with simulation time analogous to the monthly case), and we concluded that results with 15 topics are consistent with the monthly case with 15 topics in terms of arguments identified.
To have a fair comparison, in each simulation run, we applied the same data cleaning process removing English stopwords, keeping only the words with length between 4 and 15 letters appearing in more than 30 and less than 45,000 documents. We kept also the STM model parameter set to an Expectation Maximization improvement tolerance equal to 1 × 10 (as suggested by the package developers and by empirical evidence). In the following, we describe the 15 topics model configuration since it shows well defined and interpretable topics. Moreover, as emerges in Table 4, it is fully comparable to other configurations such as 10 or 12 topics, but with an increased level of clarity and definition and with the addition of relevant topics such as “Madoff scandal” and “Spanish banks news”.
Our findings show that the identified topics represent some of the most discussed financial events that took place between 2007 and 2013, in particular:
“UBS tax fraud” (Topic 1), “Market performance” (Topic 2), “Stock recommendation” (Topic 3), “Chinese companies news” (Topic 4), “Hedge Funds, Private Equity and Investment Banking” (Topic 5), “Press comments and PR” (Topic 6), “Citigroup bailout” (Topic 7), “Advisory” (Topic 8), “Morgan Stanley Investment Banking” (Topic 9), “Euro area banks” (Topic 10), “Madoff fraud scandal” (Topic 11), “Barclays and Deutsche Bank LIBOR manipulation” (Topic 12), “Bond, Equity and CDS markets” (Topic 13), “Mortgage crisis” (Topic 14), and “Spanish banks” (Topic 15). For sake of completeness, we report in Table 5 the complete list of words associated to each topic according to the Frex measure that accounts for their overall frequency and how exclusive they are to the topic.
The wordcloud in Figure 1 reports the most relevant words along the whole analyzed corpus and it clearly highlights some words specifically connected to the 15 topics such as Citigroup, Barclays, Morgan, mortgage, etc.
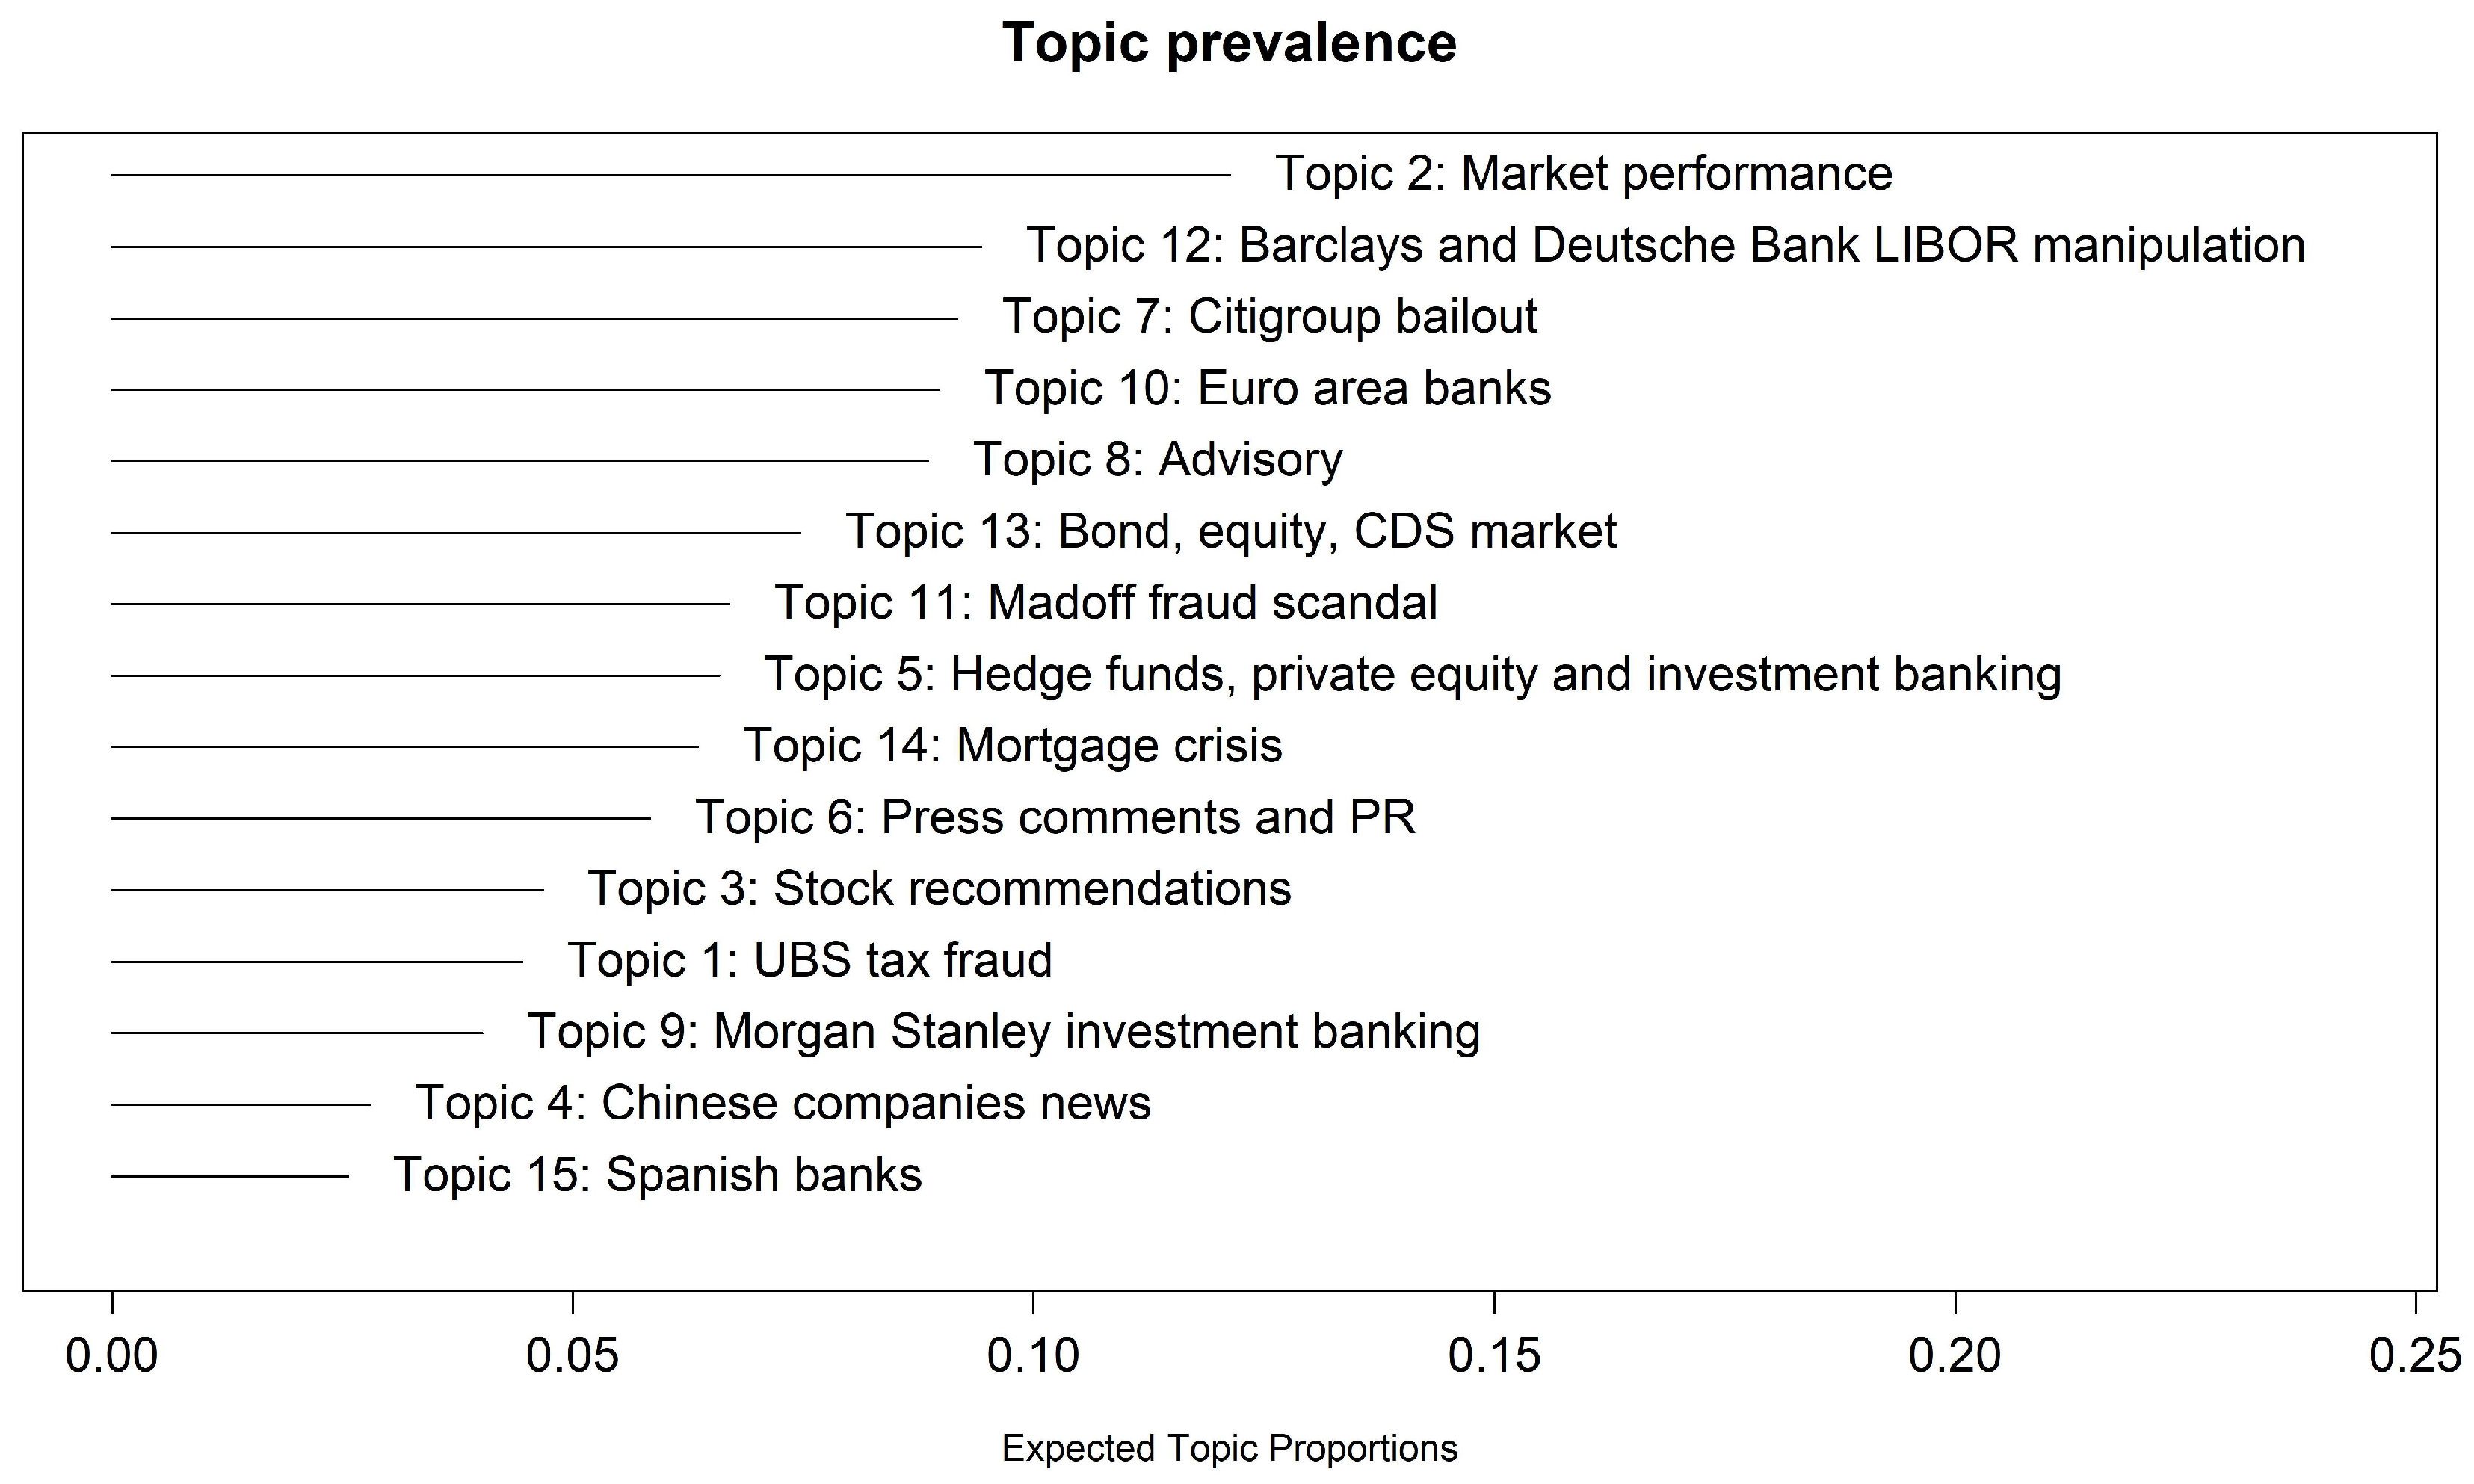
To further evaluate topics’ relevance, we report in Figure 2 the 15 topics sorted according to their prevalence, which represents the proportion of documents devoted to each topic. Market performance, Barclays and Deutsche Bank Libor manipulation and City group bailout represent the most relevant and covered topics showing a prevalence greater than 0.08.
In Table 6, we report the results of the most relevant words for the weekly based STM with 15 topics. The topics appear quite consistent between the two analysis, easing the comparability of the final results. The additional topics highlighted by this analysis are: (Topic 17) “Insider trading investigation”, (Topic 18) “Wells Fargo-Wachovia acquisition”, (Topic 19) “Bank management changes” and (Topic 20) “US banks stocks performance”.
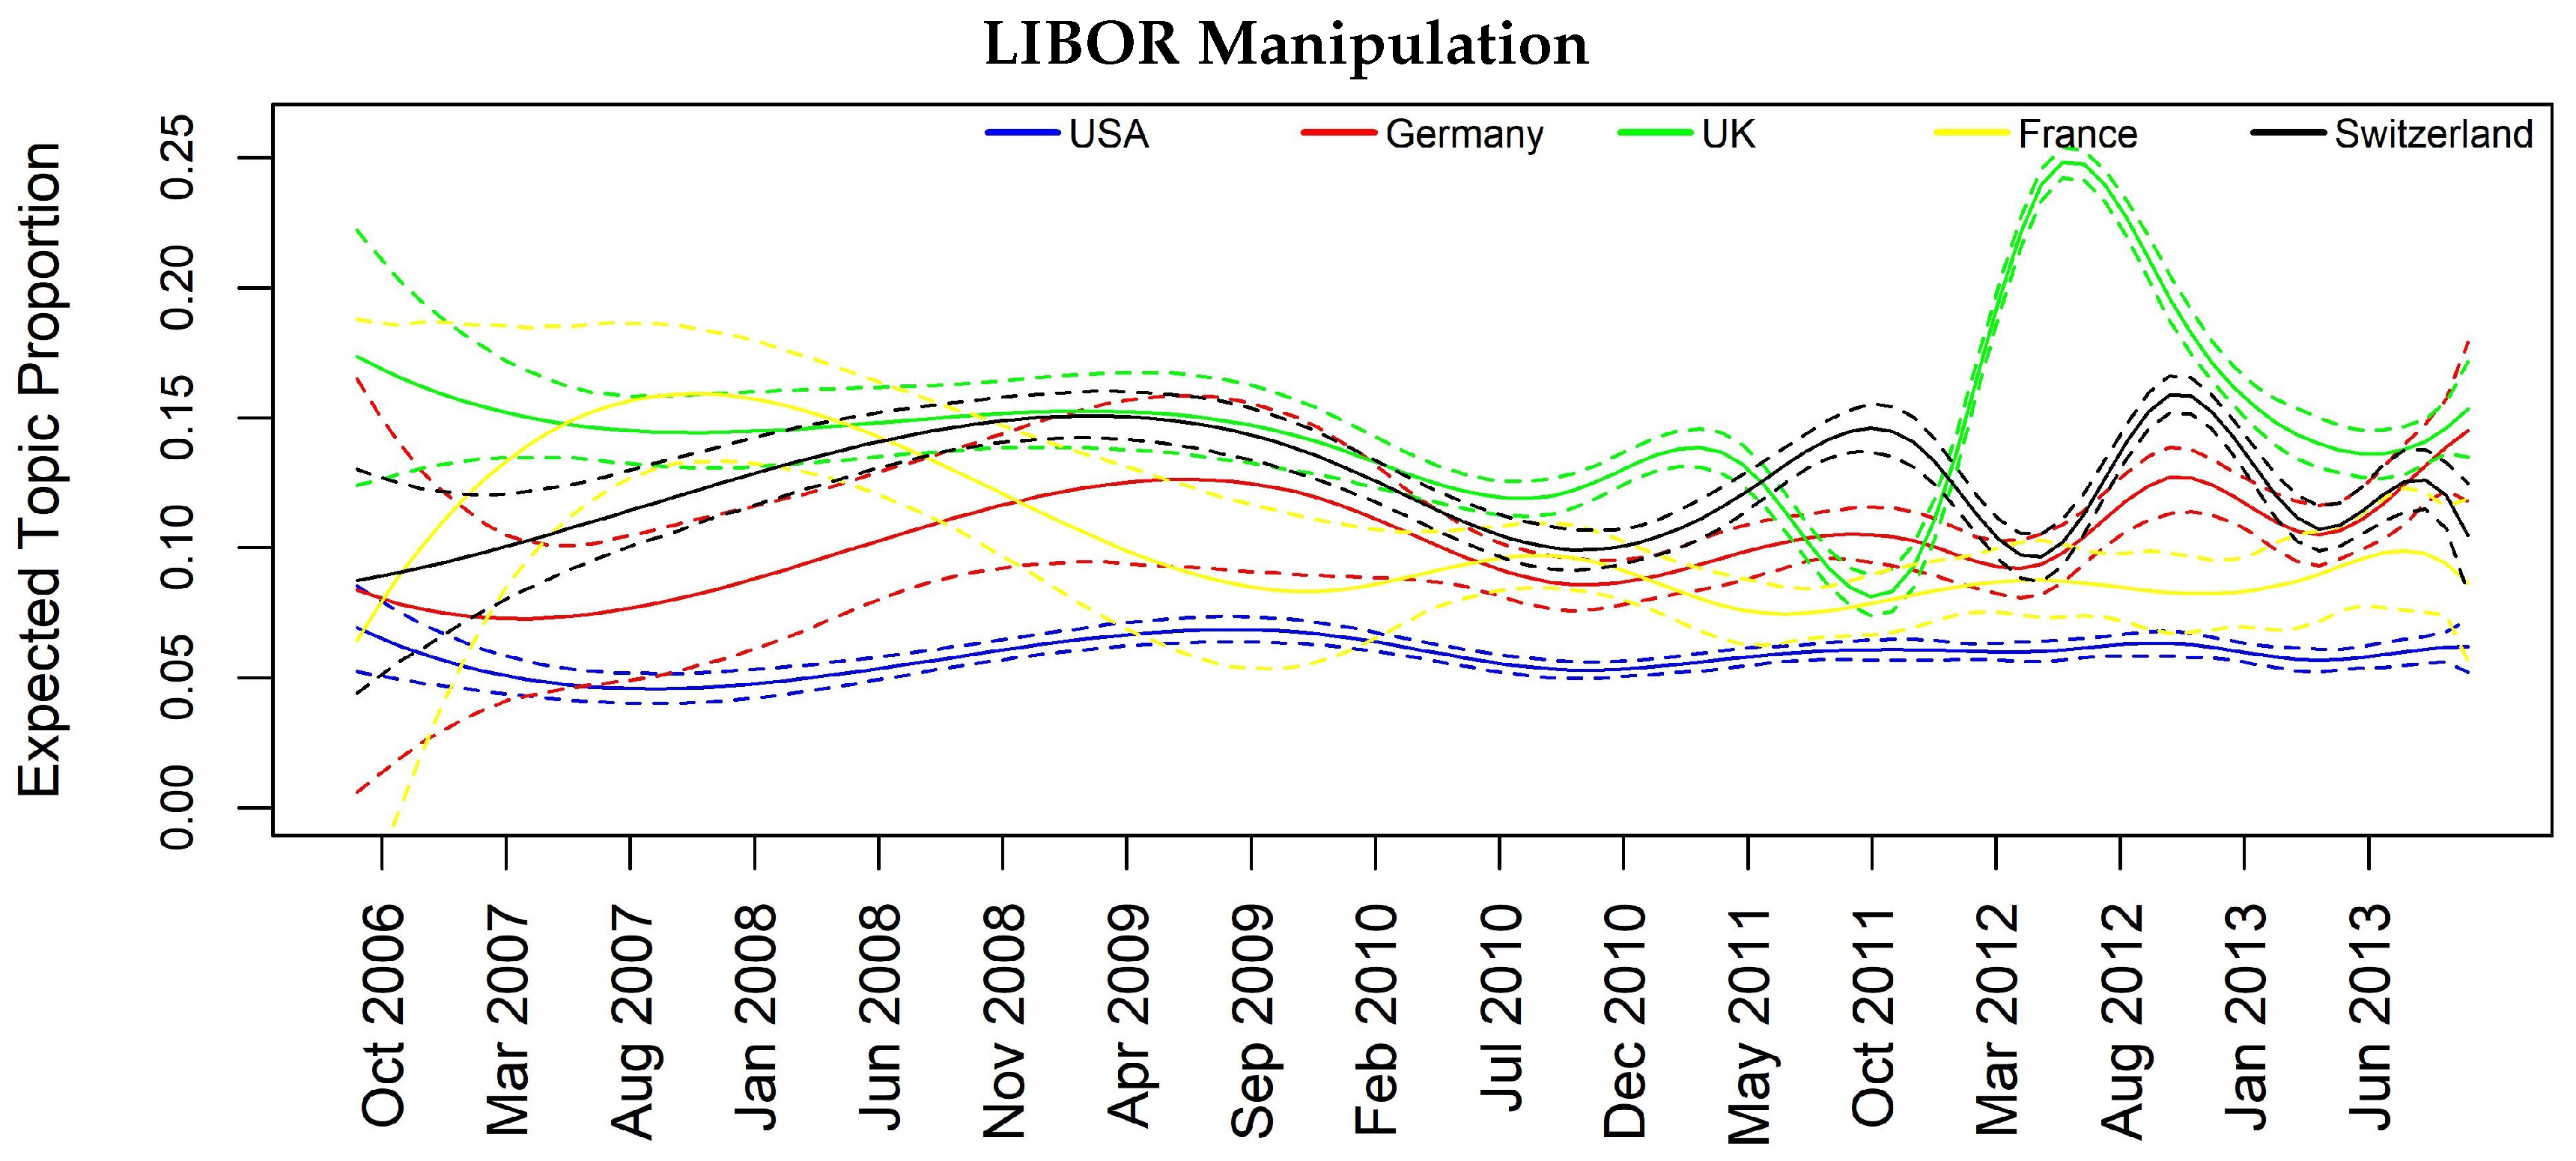
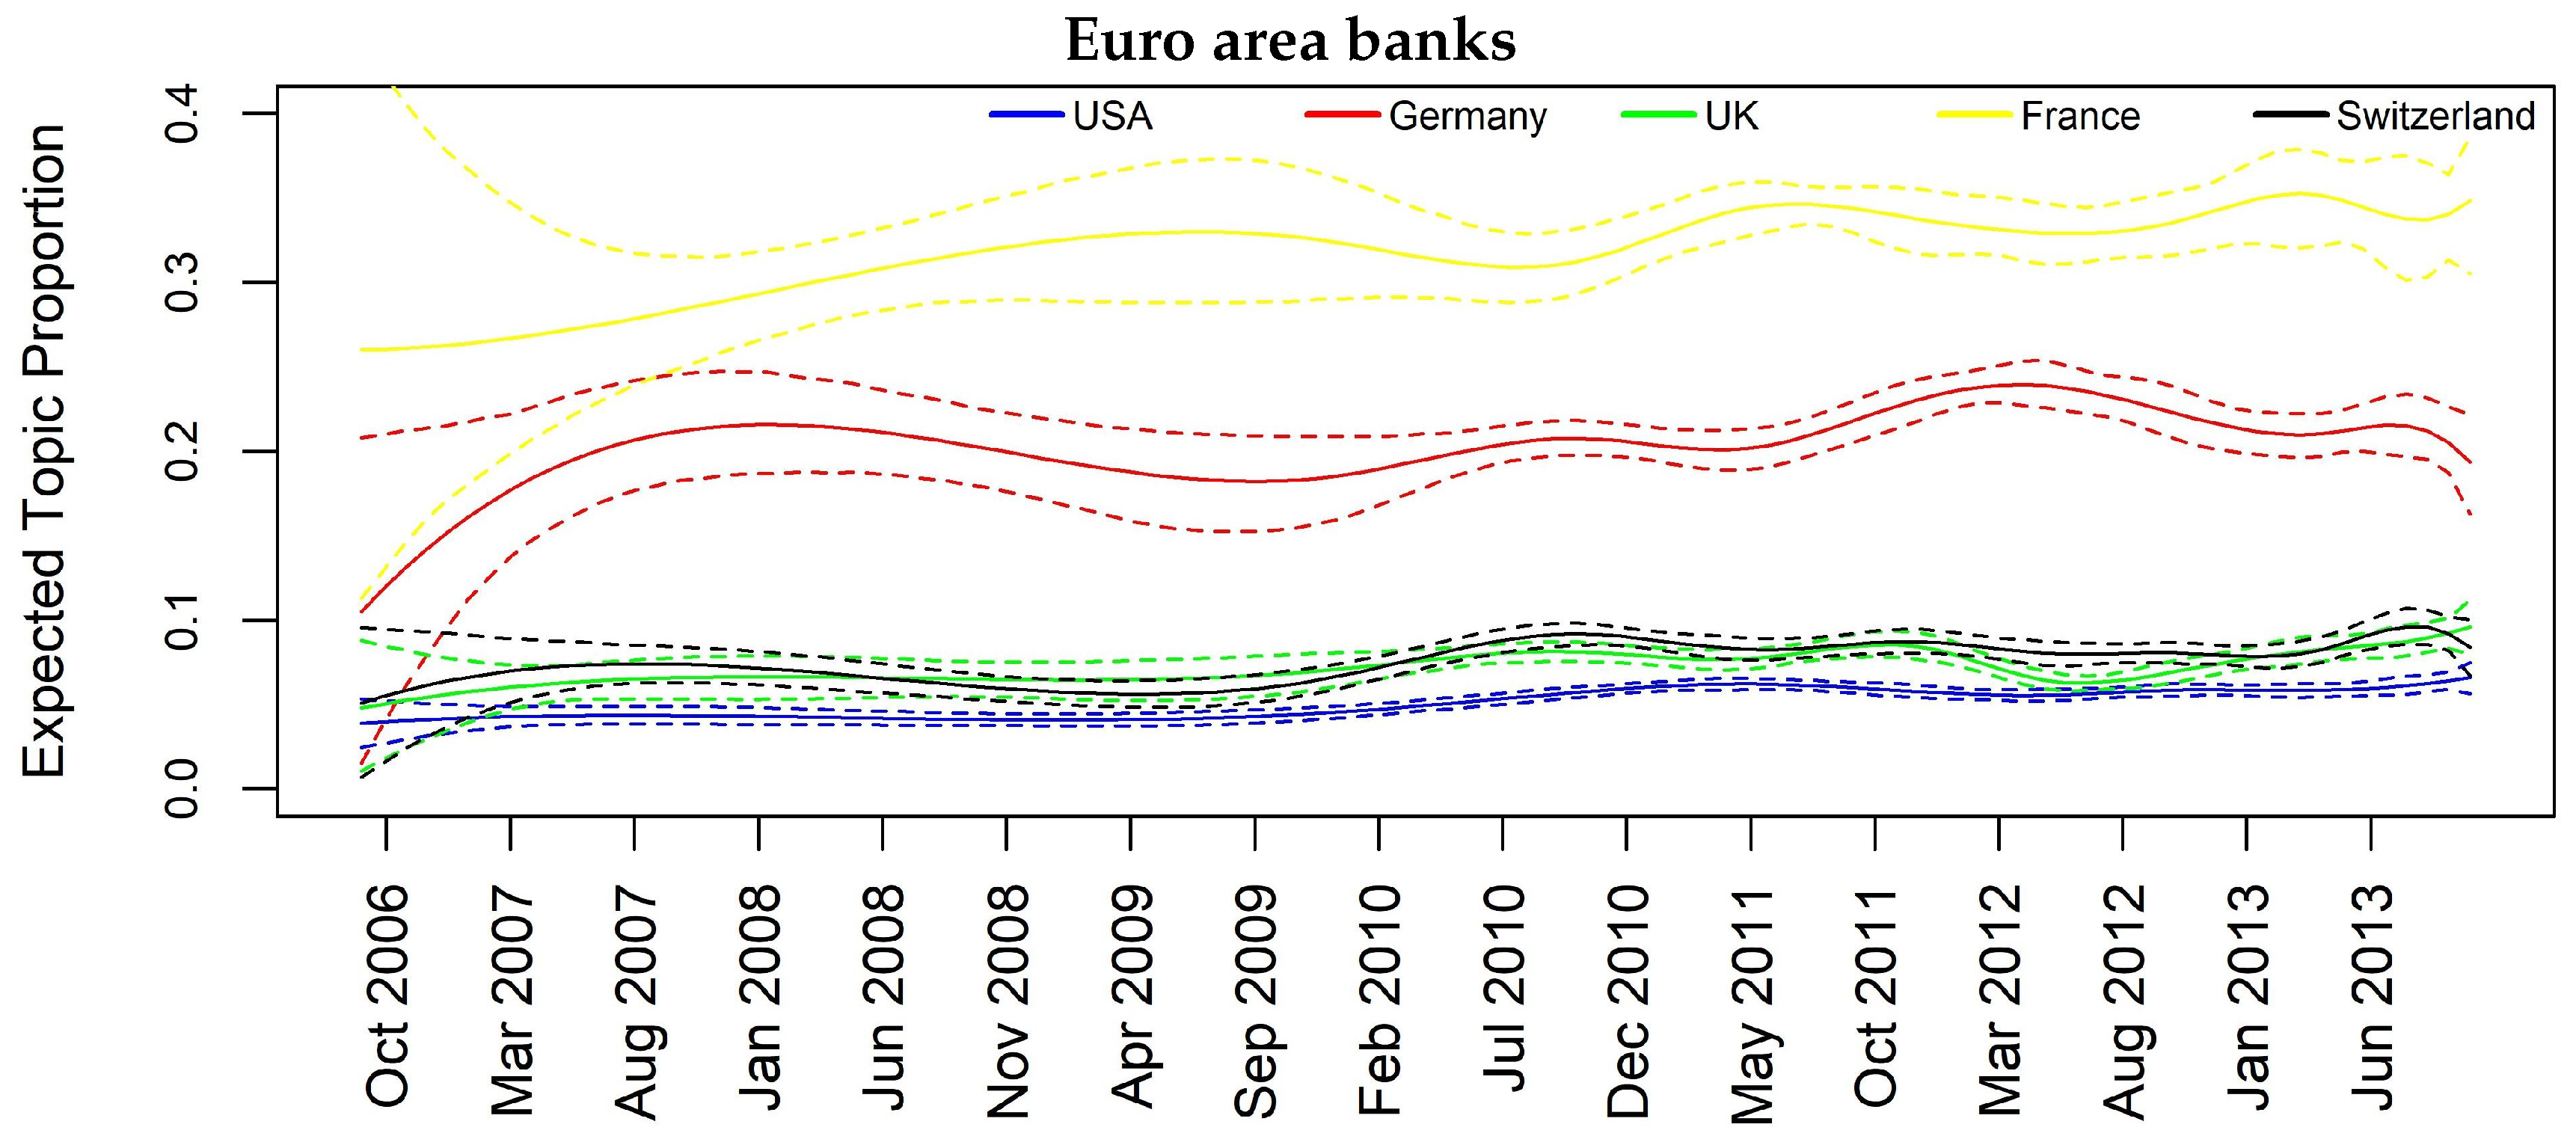
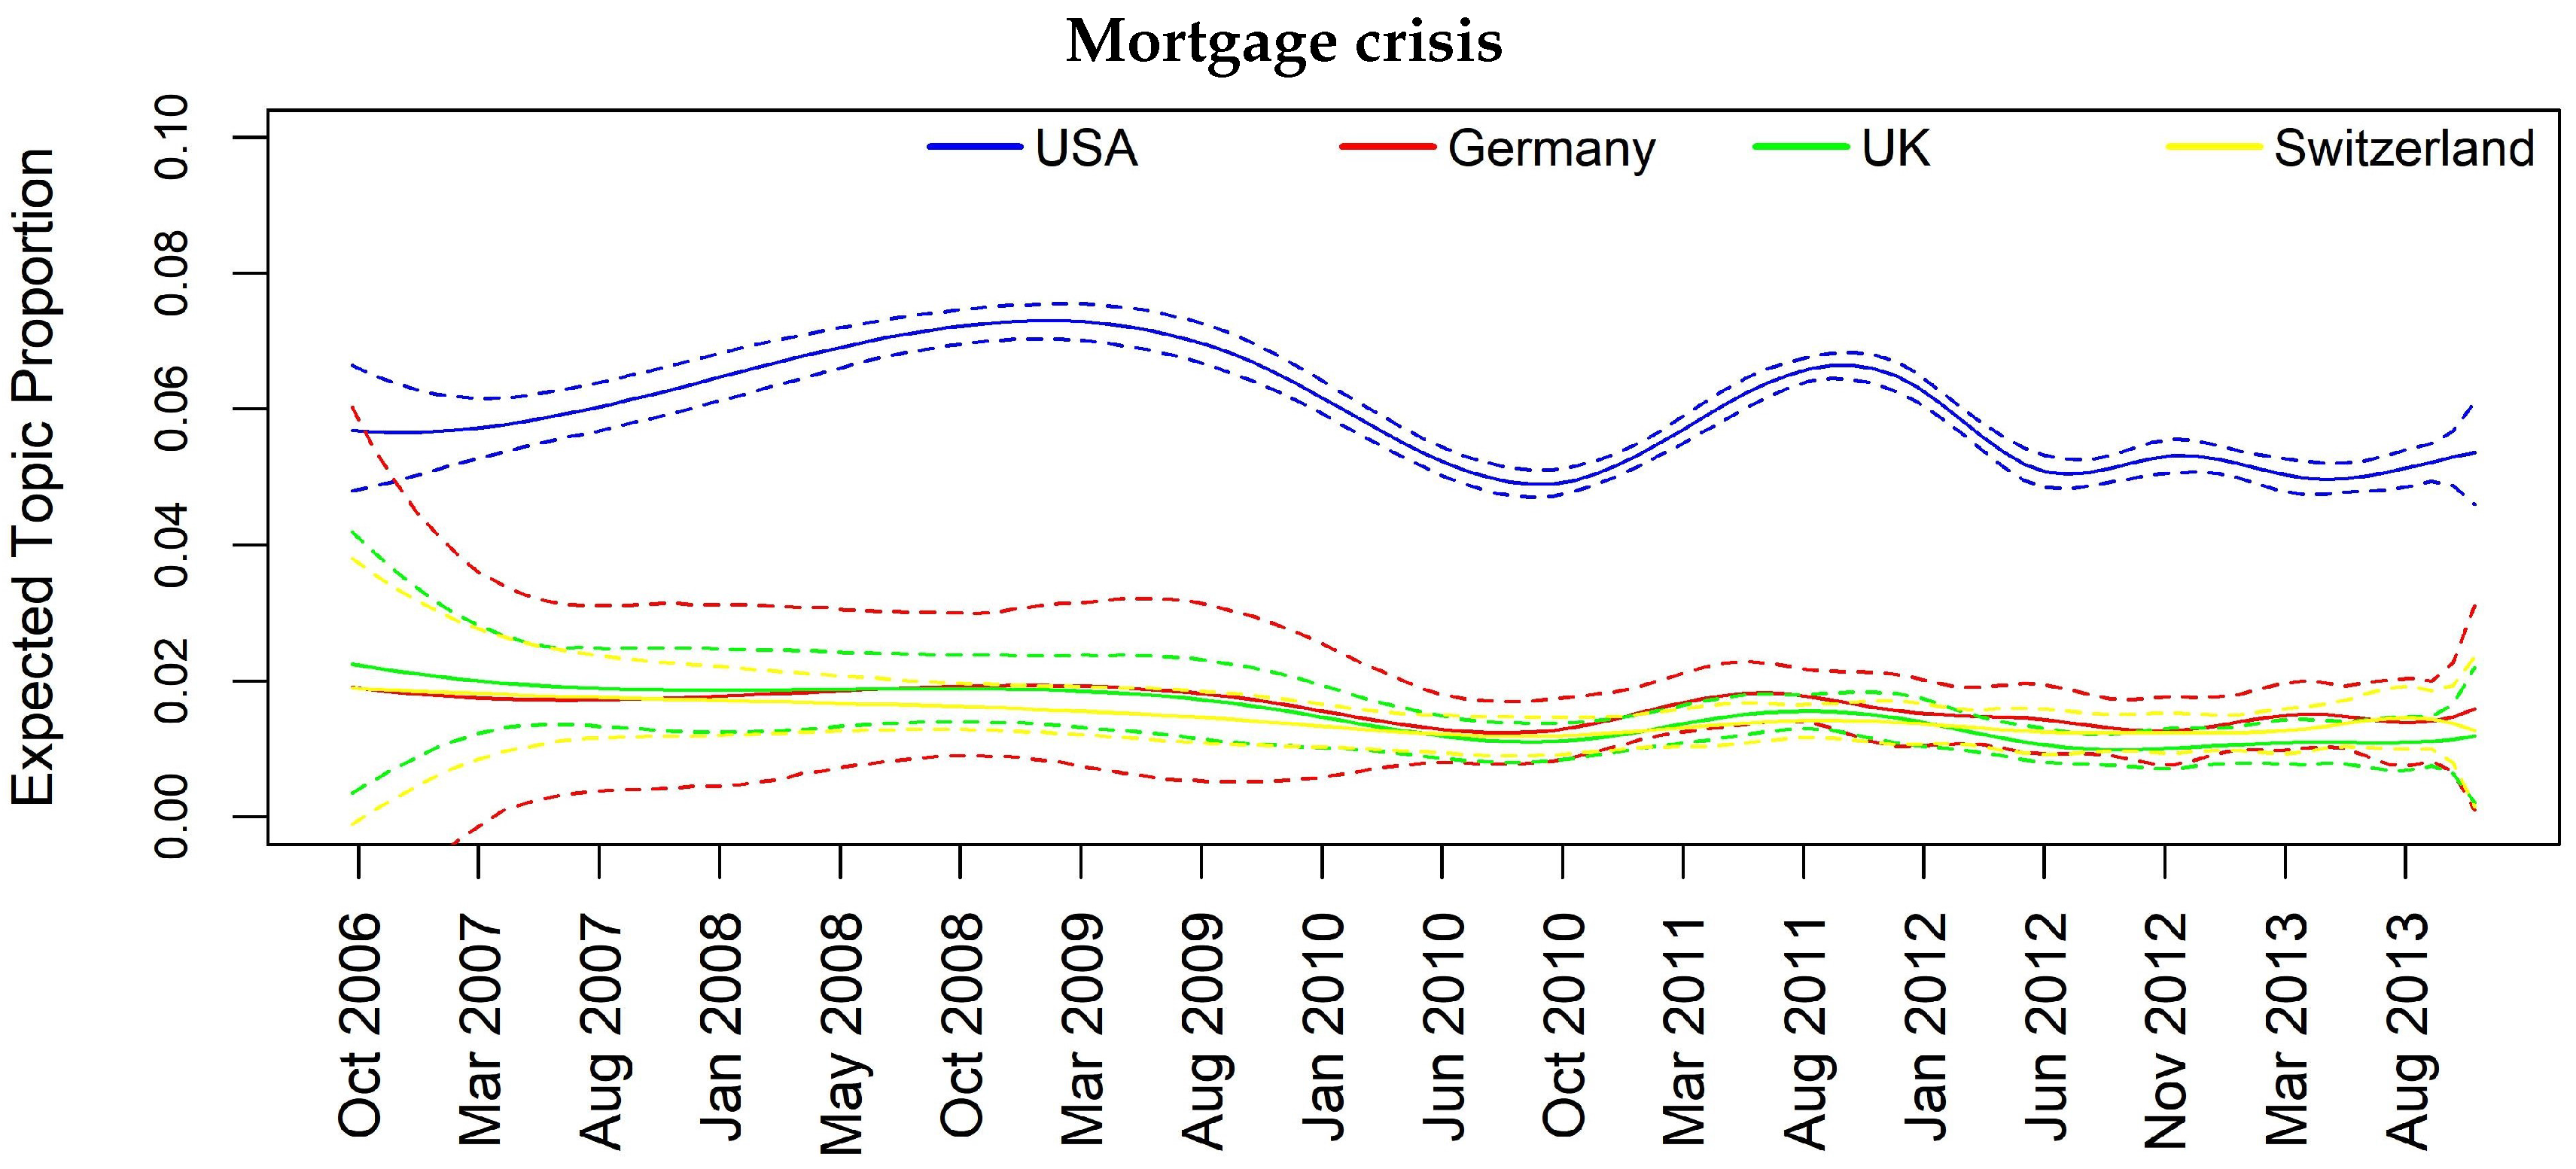
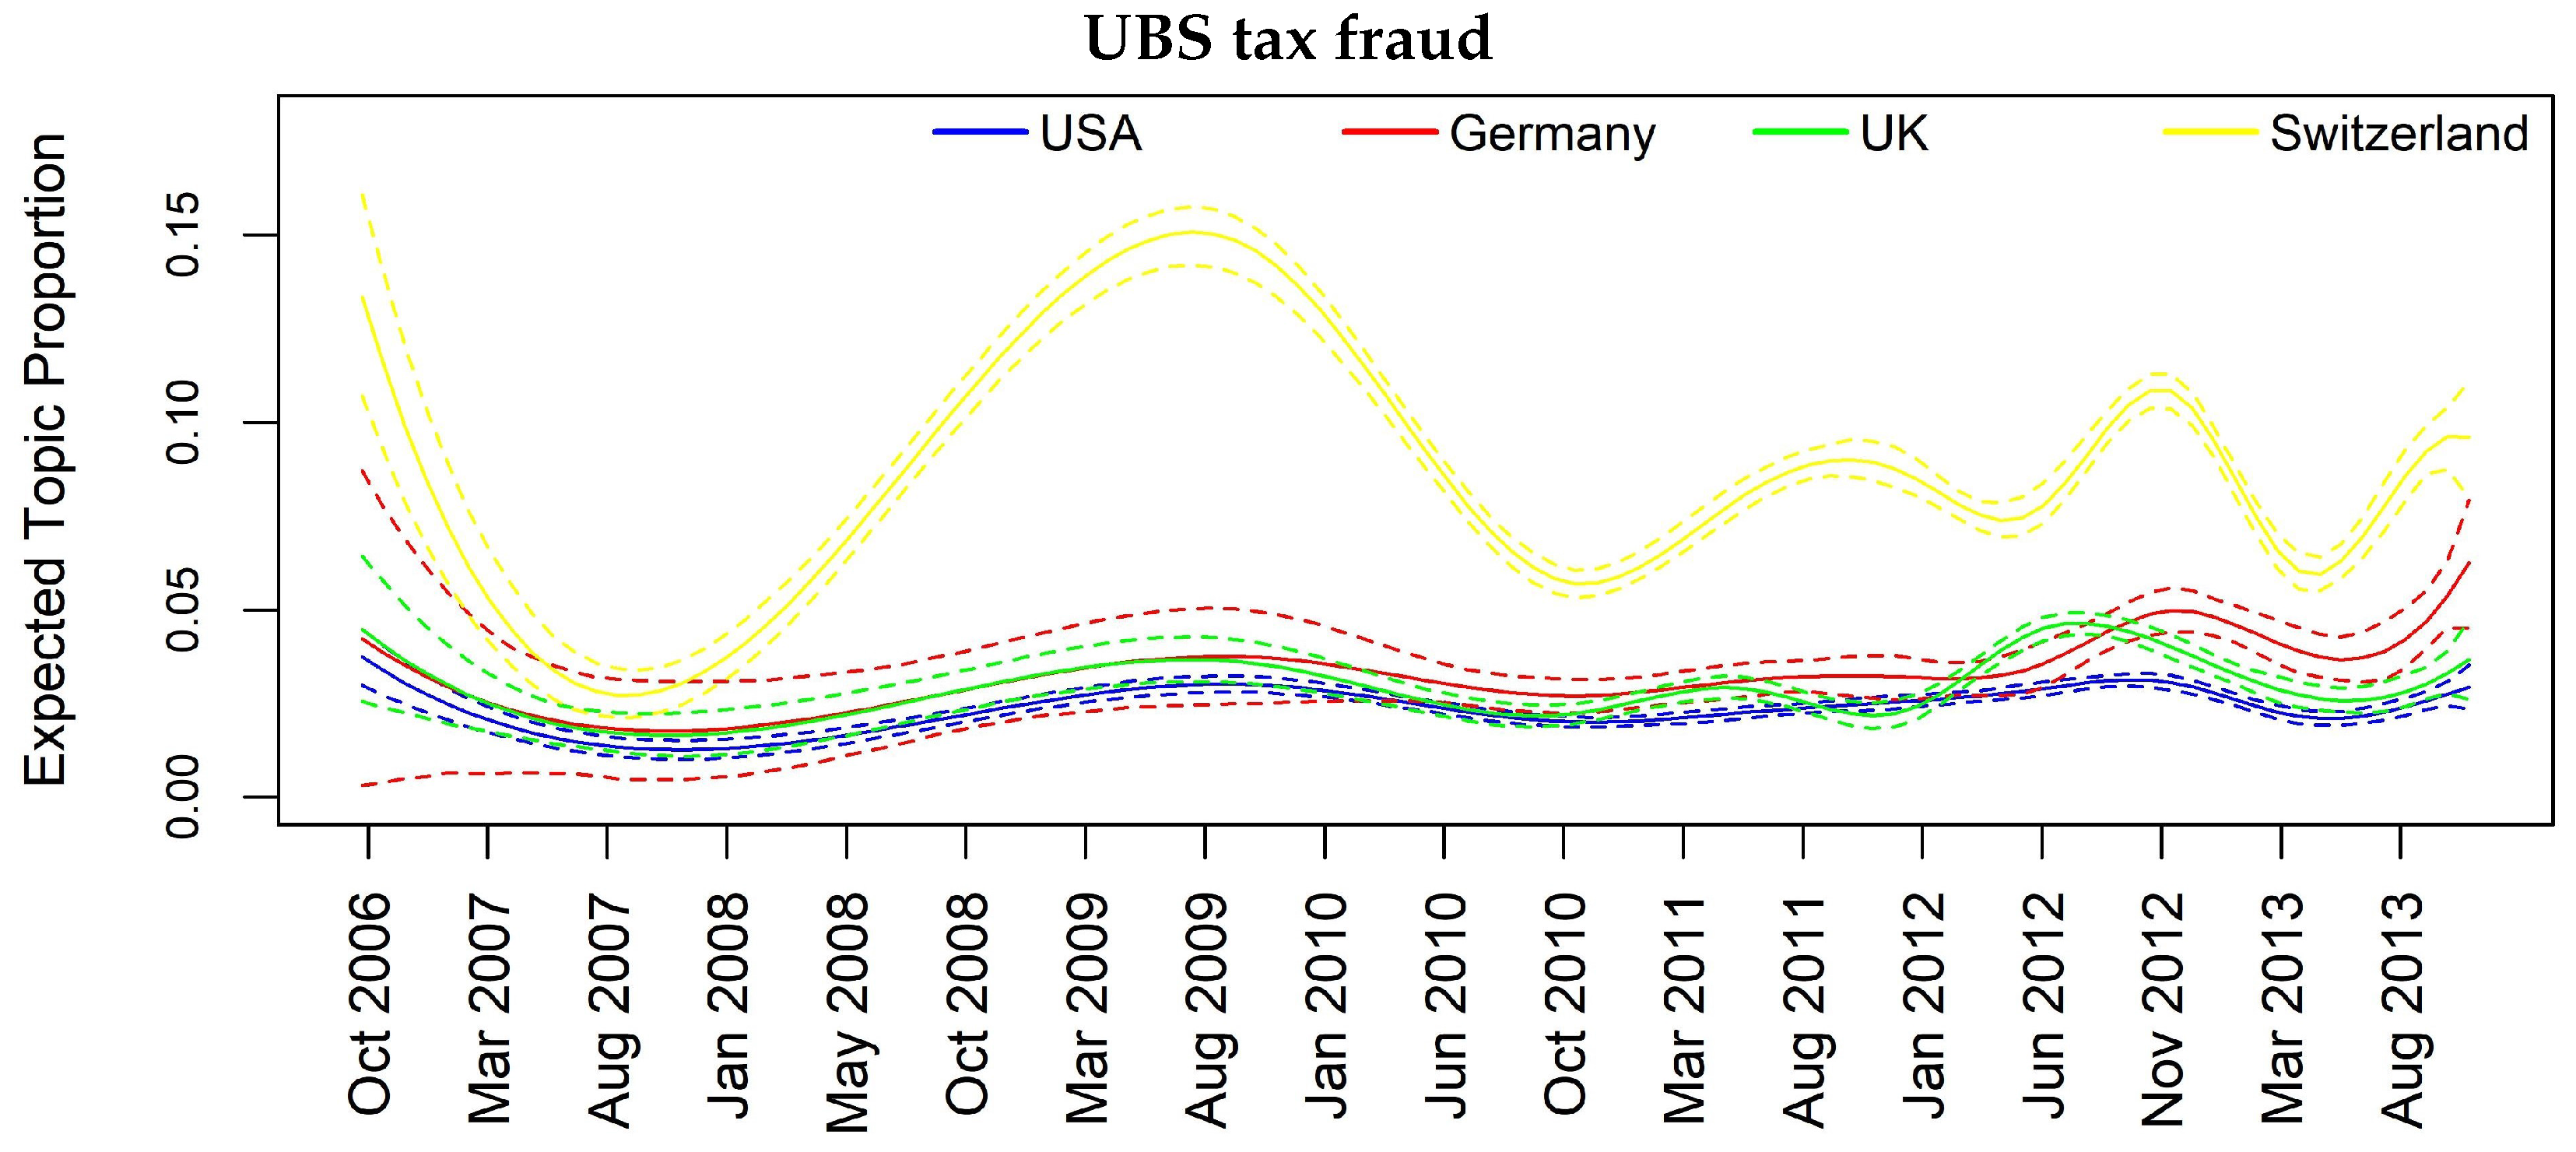
In Figure 3, Figure 4, Figure 5, Figure 6, Figure 7, Figure 8, Figure 9, Figure 10 and Figure 11, we show how the two introduced covariates impact on the different topics in the two proposed scenarios (monthly and weekly based analysis).
Insofar, we can analyze either separately or in combination how the topics evolve through space and time. In Table 7, we map jointly the considered country and the most interesting topics. Such analysis allows highlighting the specific country dependence of some topics such as the “UBS tax fraud scandal” upon Switzerland, the “Chinese companies news” upon China or the “Mortgage crisis” upon USA and UK. On the other hand, we can see topics more diffused among the countries revealing a possible contagion/diffusion effect such as for “Madoff fraud scandal”, “Barclays and Deutsche Bank Libor manipulation” and “Citigroup bailout”.
To consider jointly the temporal and spatial effect, we focus specifically on some interesting topics such as Topic 12 “Barclays and Deutsche Bank Libor manipulation”, Topic 10 “Euro area banks”, Topic 11 “Madoff fraud scandal” and Topic 14 “Mortgage crisis” that appear to be more diffused among the analyzed countries.
In Figure 3, Figure 4, Figure 5 and Figure 6, we can have insights about a lag effects on monthly aggregated data in the spikes of the news with regards to the different countries. For example in Figure 3, i.e., Topic 12 about “Libor manipulation”, a misalignment of the peaks specifically for UK, Switzerland and Germany clearly appears, suggesting to further investigate through inferential tools. Similar considerations can be drawn for the other plots, for example, in Figure 5 for Topic 11 “Madoff scandal”, where the misalignment is evident for USA, Switzerland, Germany and France.
In Figure 7, Figure 8, Figure 9, Figure 10 and Figure 11, we report the same plot analysis referred to the same topics now obtained through STM applied on weekly data. However, due to the constrain regarding the need of enough data for the weekly based analysis to obtain reliable results, we are left with four instead of five countries. Once again, we can observe different dynamics in the evolution of topics, particularly evident for “Madoff scandal” (Figure 8) and “UBS tax fraud” (Figure 11). At the same time, in Figure 7, regarding “Libor manipulation”, we can observe a different pattern compared to Figure 3: the whole topic depends upon UK with particular turbulence during the weeks between March 2011 and March 2013.
Beyond the usefulness of a graphical inspection, we need an inferential tool, namely the Granger causality test, to possibly confirm our main research hypothesis: a given topic prevalent at time t in country c is also prevalent at time in country p according to a Granger causation influence.
Among the 15 discovered topics in the two analysis, we focus specifically on six arguments that we consider more important from a contagion point of view: “UBS fraud scandal (1)”, “Citigroup bailout (7)”, “Euro area banks (10)”, “Madoff fraud scandal (11)”, “Barclays and Deutsche Bank Libor Manipulation (12)” and “Mortgage crisis (14)”. In Table 8, we report only results significant at for the topics listed above in the monthly based analysis, where 1L stands for one-month lag and similarly 2L for two-month lag. The reader can easily observe that there are several significant Granger causalities both at one- and two-month lag. As one would expect, the Granger causation is both within European countries and between USA and European countries, stressing the strict interconnection among countries from a financial perspective. We have excluded China and Japan from this analysis due to a limited number of available documents that can bias results (see Table 2).
As examples, let us focus on results for Topic 11 (Madoff scandal) and Topic 14 (Mortgage crisis). Regarding the former, we can see that the influencing countries at one- and two-month lag are UK and CH whose banks had a high exposition towards the fraud, in particular HSBC, RBS and UBS. The importance of these two countries in the topic is justified from the fact that we are considering only banks’ related news focusing primarily on the relation between banks and the fraud, and thus on the most exposed banks. In the Mortgage crisis, we can see how the information contagion is transmitted from USA to some European countries at one-month lag, namely FR, DE and CH (CH and FR also at two-month lag), and this is a plausible result as this specific financial crisis had origin in the United States. It is also interesting to give attention to Topic 10 regarding Euro area banks. All the interactions are significant at both one- and two-month lag, and France seems to play a key role in spreading the topic among all the other European countries and also in the case of USA.
Similarly, in Table 9, we report results significant at for the topics analysis based on weekly data, where 1L stands for one-week lag and similarly 2L for two-week lag.
Once again, we can see several significant results, rather similar to those in Table 8, although with some differences due to the different granularity of the data. If we look at “Madoff scandal”, we can confirm the influence of UK and CH onto USA at both one- and two-week lag and we further see a prominent role of UK in diffusing the topic. For the “Mortgage crisis”, we have less evidence but we can confirm the contagion from USA to CH and then CH conveys to UK. For robustness check, we also report a topic for which there is no evidence of granger causality: “management changes” topic does not show any impact across space and time. In Table 9, we can infer that even on more granular data, specifically weekly data, although we can use less banks because of lack of coverage, we obtain several signs of causality for the most important and influential topics.
5. Concluding Remarks
In this work, we have presented a fully data-driven methodology for the evaluation of news contagion through space and time. We focused on SIFIs related news taken from two public dataset from Reuters News and Bloomberg News containing in total 553,666 documents spanning a period from October 2006 to November 2013. The aim of this study is to propose an approach for assessing the spread of news contagious among countries along the considered time horizon. To this purpose, we have employed a model for topic modeling, called STM, able to fit the best topic distribution on the basis of useful covariates that can be chosen by the analyst. The introduction of time and country specific variables has allowed us to add temporal and spatial dimensions to the analysis. This information have been exploited to investigate the dynamic of news spread among countries.
In particular, we have used the Granger causality test to demonstrate a contagion/causation dynamic in the diffusion of the news employing times series counts extrapolated from the STM approach. Such analysis has been conducted considering two different data granularities: news aggregated on a monthly basis or on a weekly basis. According to the two different time references, it is necessary to reduce the list of considered banks (and associated countries) to have enough data coverage for fitting reliably the STM model. Whilst we have analyzed weekly data, for some country/bank combinations, we are left with a insufficient data coverage, possibly producing a bias in the results that should be taken into account while comparing with the monthly based analysis.
Results are promising; we have found several significant causal relations in the diffusion of the news, stimulating further development in a future work. In particular, we shall investigate a correlation structure in the news diffusion taking into account country or bank level with correlation network models. Moreover, the analysis should be conducted with a more populated dataset, ideally the full Reuters and Bloomberg corpus from to 2007 to 2015 to increase the list of considered banks, and thus producing even more detailed and insightful results.
Author Contributions
Both authors contributed equally to the paper.
Conflicts of Interest
There is no conflict of interest.
References
- Bholat, David, Stephen Hansen, Pedro Santos, and Cheryl Schonhardt-Bailey. 2015. Text mining for central banks. In Centre for Central Banking Studies Handbook. London: Bank of England, vol. 33. [Google Scholar]
- Blei, David M., and John D. Lafferty. 2006. Correlated Topic Models. Advances in Neural Information Processing Systems 18: 1–47. [Google Scholar]
- Blei, David M., Andrew Y. Ng, and Michael I. Jordan. 2003. Latent Dirichlet allocation. JMLR 3: 993–1022. [Google Scholar]
- Bollen, Johan, Huina Mao, and Xiao-Jun Zeng. 2011. Twitter mood predicts the stock market. Journal of Computational Science 2: 1–8. [Google Scholar] [CrossRef]
- Brown, Eric D. 2012. Will Twitter make you a better investor? A look at sentiment, user reputation and their effect on the stock market. In Proceedings of the Southern Association for Information Systems Conference. Atlanta: SAIS, pp. 36–42. [Google Scholar]
- Brown, Peter F., Vincent J. Della Pietra, Peter V. deSouza, Jenifer C. Lai, and Robert L. Mercer. 1992. Class-based n-gram models of natural language. Computational Linguistics 18: 467–79. [Google Scholar]
- Cerchiello, Paola, and Paolo Giudici. 2016. How to measure the quality of financial tweets. Quality and Quantity 50: 1695–713. [Google Scholar] [CrossRef]
- Cerchiello, Paola, Giancarlo Nicola, Samuel Ronnqvist, and Peter Sarlin. 2017a. Deep Learning Bank Distress from News and Numerical Financial Data. DEM Working paper. Available online: https://arxiv.org/abs/1706.09627 (accessed on 12 Dec 2017).
- Cerchiello, Paola, Paolo Giudici, and Giancarlo Nicola. 2017b. Twitter data models for bank risk contagion. Neurocomputing 264: 50–6. [Google Scholar] [CrossRef]
- Chawla, Nitesh, Zhi Da, Jian Xu, and Mao Ye. 2016. Information Diffusion on Social Media: Does It Affect Trading, Return, and Liquidity? Working paper. Available online: https://ssrn.com/abstract=2935138 (accessed on 12 Dec 2017).
- Cho, Kyunghyun, Bart van Merrienboer, Caglar Gulcehre, Dzmitry Bahdanau, Fethi Bougares, Holger Schwenk, and Yoshua Bengio. 2014. Learning phrase representations using RNN encoder-decoder for statistical machine translation. Paper presented at the 2014 Conference on Empirical Methods in Natural Language Processing (EMNLP), Doha, Qatar, October 25–29. [Google Scholar]
- Clark, Alexander. 2003. Combining distributional and morphological information for part of speech induction. Paper presented at EACL, Budapest, Hungary, April 12–17. [Google Scholar]
- Collobert, Ronan, Jason Weston, Leon Bottou, Michael Karlen, Koray Kavukcuoglu, and Pavel Kuksa. 2011. Natural Language Processing (Almost) from Scratch. Journal of Machine Learning Research 12: 2493–537. [Google Scholar]
- Deerwester, Scott, Susan T. Dumais, George W. Furnas, Thomas K. Landauer, and Richard Harshman. 1990. Indexing by Latent Semantic Analysis. Journal of the American Society for Information Science 41: 391–407. [Google Scholar] [CrossRef]
- Ding, Xiao, Yue Zhang, Ting Liu, and Junwen Duan. 2015. Deep Learning for Event-Driven Stock Prediction. Paper presented at the Twenty-Fourth International Joint Conference on Artificial Intelligence (IJCAI 2015), Buenos Aires, Argentina, July 25–31. [Google Scholar]
- Eisenstein, Jacob, Amr Ahmed, and Eric P. Xing. 2011. Sparse additive generative models of text. Paper presented at 28th International Conference on Machine Learning, Bellevue, WA, USA, June 28–July 2. [Google Scholar]
- Giannini, Robert C., Paul J. Irvine, and Tao Shu. 2013. Do Local Investors Know More? A Direct Examination of Individual Investors’ Information Set. Working paper. Available online: http://www.utahwfc.org/uploads/ 2014_08_2.pdf (accessed on 12 Dec 2017).
- Granger, C. W. J. 1969. Investigating Causal Relations by Econometric Models and Cross-spectral Methods. Econometrica 37: 424–38. [Google Scholar] [CrossRef]
- Girolami, Mark, and Ata Kaban. 2003. On an Equivalence between PLSI and LDA. Paper presented at 26th annual international ACM SIGIR conference on Research and development in informaion retrieval, Toronto, Canada, July 28–August 1; pp. 433–4. [Google Scholar]
- Hochreiter, Sepp, and Jurgen Schmidhuber. 1997. Long Short-Term Memory. Neural Computation 9: 1735–80. [Google Scholar] [CrossRef] [PubMed]
- Hofmann, Thomas. 1999. Probabilistic Latent Semantic Indexing. Paper presented at 22nd Annual International ACM SIGIR Conference on Research and Development in Information Retrieval, Berkeley, CA, USA, August 11–19; pp. 50–7. [Google Scholar]
- Hokkanen, Jyry, Tor Jacobson, Cecilia Skingsley, and Markus Tibblin. 2015. The Riksbanks future information supply in light of Big Data. In Economic Commentaries. Stockholm: Sveriges Riksbank, vol. 17. [Google Scholar]
- Kalchbrenner, Nal Kalchbrenner, Edward Grefenstette, and Phil Blunsom. 2014. A Convolutional Neural Network for Modelling Sentences. In Proceedings of the 52nd Annual Meeting of the Association for Computational Linguisti, Baltimore, MD, USA, June 23–25. [Google Scholar]
- Landauer, Thomas K., Peter W. Foltz, and Darrell Laham. 1998. Introduction to Latent Semantic Analysis. Discourse Processes 25: 259–84. [Google Scholar] [CrossRef]
- Malo, Pekka, Ankur Sinha, Pyry Takala, Pekka Korhonen, and Jyrki Wallenius. 2014. Good debt or bad debt: Detecting semantic orientations in economic texts. Journal of the Association for Information Science and Technology 65: 782–96. [Google Scholar] [CrossRef]
- Martin, Sven, Jörg Liermann, and Hermann Ney. 1998. Algorithms for bigram and trigram word clustering. Speech Communication 24: 19–37. [Google Scholar] [CrossRef]
- Mikolov, Tomas, Kai Chen, Greg Corrado, and Jeffrey Dean. 2013. Efficient estimation of word representations in vector space. Paper presented at Workshop at International Conference on Learning Representations, Scottsdale, Arizona, May 2nd-4th. [Google Scholar]
- Mimno, David, and Andrew McCallum. 2008. Topic Models Conditioned on Arbitrary Features with Dirichlet-Multinomial Regression. In Proceedings of the Twenty-Fourth Conference on Uncertainty in Artificial Intelligence (UAI2008), Helsinki, Finland, July 9–12. [Google Scholar]
- Mittal, Anshul, and Arpit Goel. 2012. Stock Prediction Using Twitter Sentiment Analysis. Working Paper. Available online: http://citeseerx.ist.psu.edu/viewdoc/download?doi=10.1.1.375.4517&rep=rep1&type=pdf (accessed on 12 Dec 2017).
- Nann, Stefan, Jonas Krauss, and Detlef Schoder. 2013. Predictive Analytics On Public Data—The Case Of Stock Markets. ECIS 2013 Completed Research. 102. Available online: ttps://aisel.aisnet.org/ecis2013_cr/102 (accessed on 12 Dec 2017).
- Nyman, Rickard, David Gregory, Sujit Kapadia, Paul Ormerod, David Tuckett, and Robert Smith. 2015. News and Narratives in Financial Systems: Exploiting Big Data for Systemic Risk Assessment. Available online: https://www.norges-bank.no/contentassets/49b4dce839a7410b9a7f66578da8cf74/papers/smith.pdf (accessed on 12 Dec 2017).
- Oliveira, Nuno, Paulo Cortez, and Nelson Area. 2013. On the predictability of stock market behaviour using stock twits sentiment and posting volume. In Progress in Artificial Intelligence. EPIA 2013. Lecture Notes in Computer Science. Berlin, Heidelberg: Springer, vol. 8154, pp. 355–65. [Google Scholar]
- Pennington, Jeffrey, Richard Socher, and Christopher D. Manning. 2014. GloVe: Global Vectors for Word Representation. Paper presented at the 2014 Conference on Empirical Methods in Natural Language Processing (EMNLP), Doha, Qatar, October 25–29; pp. 1532–43. [Google Scholar]
- Putthividhya, Duangmanee (Pew), Hagai T. Attias, and Srikantan Nagarajan. 2009. Independent Factor Topic Models. In Proceedings of the 26th Annual International Conference on Machine Learning, Montreal, Quebec, Canada, June 14–18; pp. 833–40. [Google Scholar]
- Rönnqvist, Samuel, and Peter Sarlin. 2017. Bank distress in the news: Describing events through deep learning. Neurocomputing 264: 57–70. [Google Scholar] [CrossRef]
- Ranco, Gabriele, Darko Aleksovski, Guido Caldarelli, Miha Grčar, and Igor Mozetič. 2015. The Effects of Twitter Sentiment on Stock Price Returns. PLoS ONE 10: e0138441. [Google Scholar] [CrossRef] [PubMed]
- Rao, Tushar, and Saket Srivastava. 2012. Twitter sentiment analysis: How to hedge your bets in the stock markets. Available online: https://arxiv.org/abs/1212.1107 (accessed on 12 Dec 2017).
- Roberts, Margaret E., Brandon M. Stewart, and Dustin Tingley. 2016a. Navigating the Local Modes of Big Data: The Case of Topic Models. In Data Analytics in Social Science, Government, and Industry. New York: Cambridge University Press. [Google Scholar]
- Roberts, Margaret E., Brandon M. Stewart, and Edoardo M. Airoldi. 2016b. A model of text for experimentation in the social sciences. Journal of the American Statistical Association 111: 988–1003. [Google Scholar] [CrossRef]
- Sims, Christopher A. 1972. Money, Income and Causality. American Economic Review 62: 540–52. [Google Scholar]
- Socher, Richard, Jeffrey Pennington, Eric H. Huang, Andrew Y. Ng, and Christopher D. Manning. 2011. SemiSupervised Recursive Autoencoders for Predicting Sentiment Distributions. Paper presented at the 2011 Conference on Empirical Methods in Natural Language Processing (EMNLP), Edinburgh, UK, July 27–31. [Google Scholar]
- Socher, Richard, Alex Perelygin, Jean Y. Wu, Jason Chuang, Christopher D. Manning, Andrew Y. Ng, and Christopher Potts. 2013. Recursive deep models for semantic compositionality over a sentiment treebank. Paper presented at Empirical Methods in Natural Language Processing (EMNLP 2013), Seattle, WA, USA, October 18–21; pp. 1631–42. [Google Scholar]
- Soo, Cindy K. 2013. Quantifying Animal Spirits: News Media and Sentiment in the Housing Market. Ross School of Business Paper No. 1200. Available online: https://aisel.aisnet.org/ecis2013_cr/102 (accessed on 12 Dec 2017).
- Sprenger, Timm O., and Isabell M. Welpe. 2010. Tweets and Trades: The Information Content of Stock Microblogs (November 1, 2010). Available online: http://dx.doi.org/10.2139/ssrn.1702854 (accessed on 12 Dec 2017).
| 1 | The datasets are available on the github of Philippe Remy at https://github.com/philipperemy/financial-news-dataset and have been retrieved and appropriately collected using Python. |
Figure 1.
Wordcloud of the 15 topics analysis.
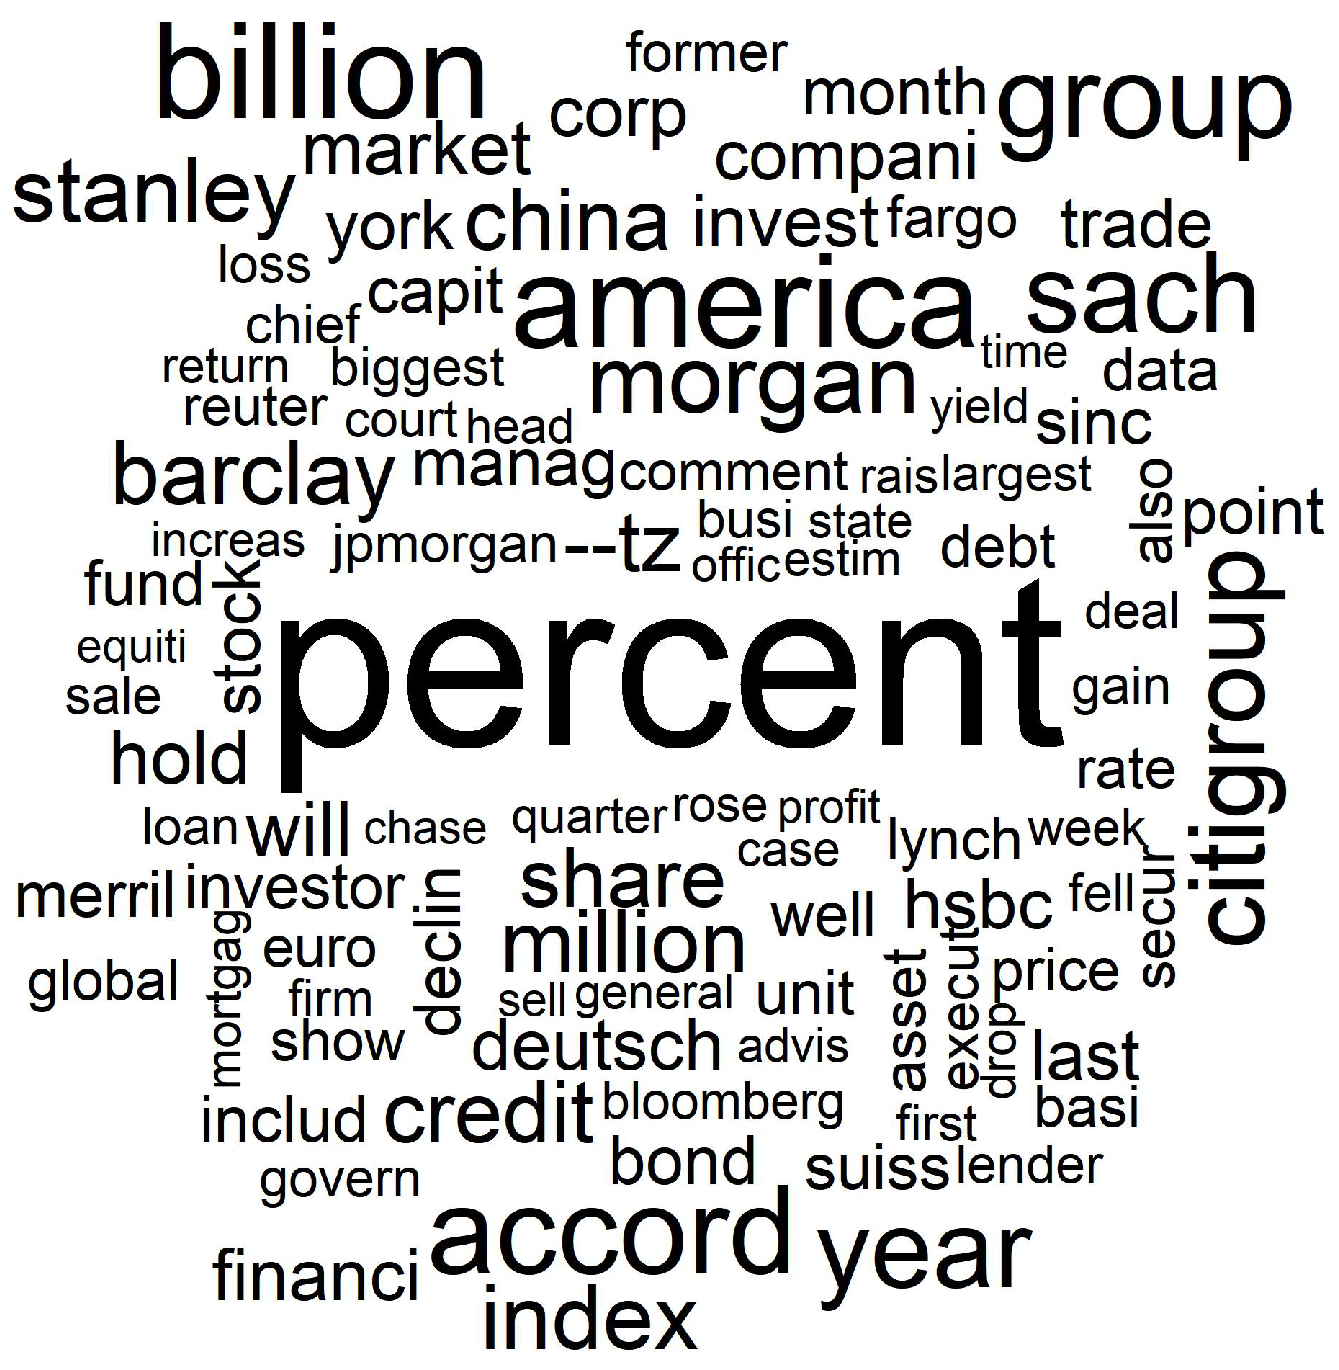
Figure 2.
Topic prevalence the 15 topics analysis.
Figure 3.
Topic prevalence evolution by country with respect to monthly based analysis.
Figure 4.
Topic prevalence evolution by country with respect to monthly based analysis.

Figure 5.
Topic prevalence evolution by country with respect to monthly based analysis.
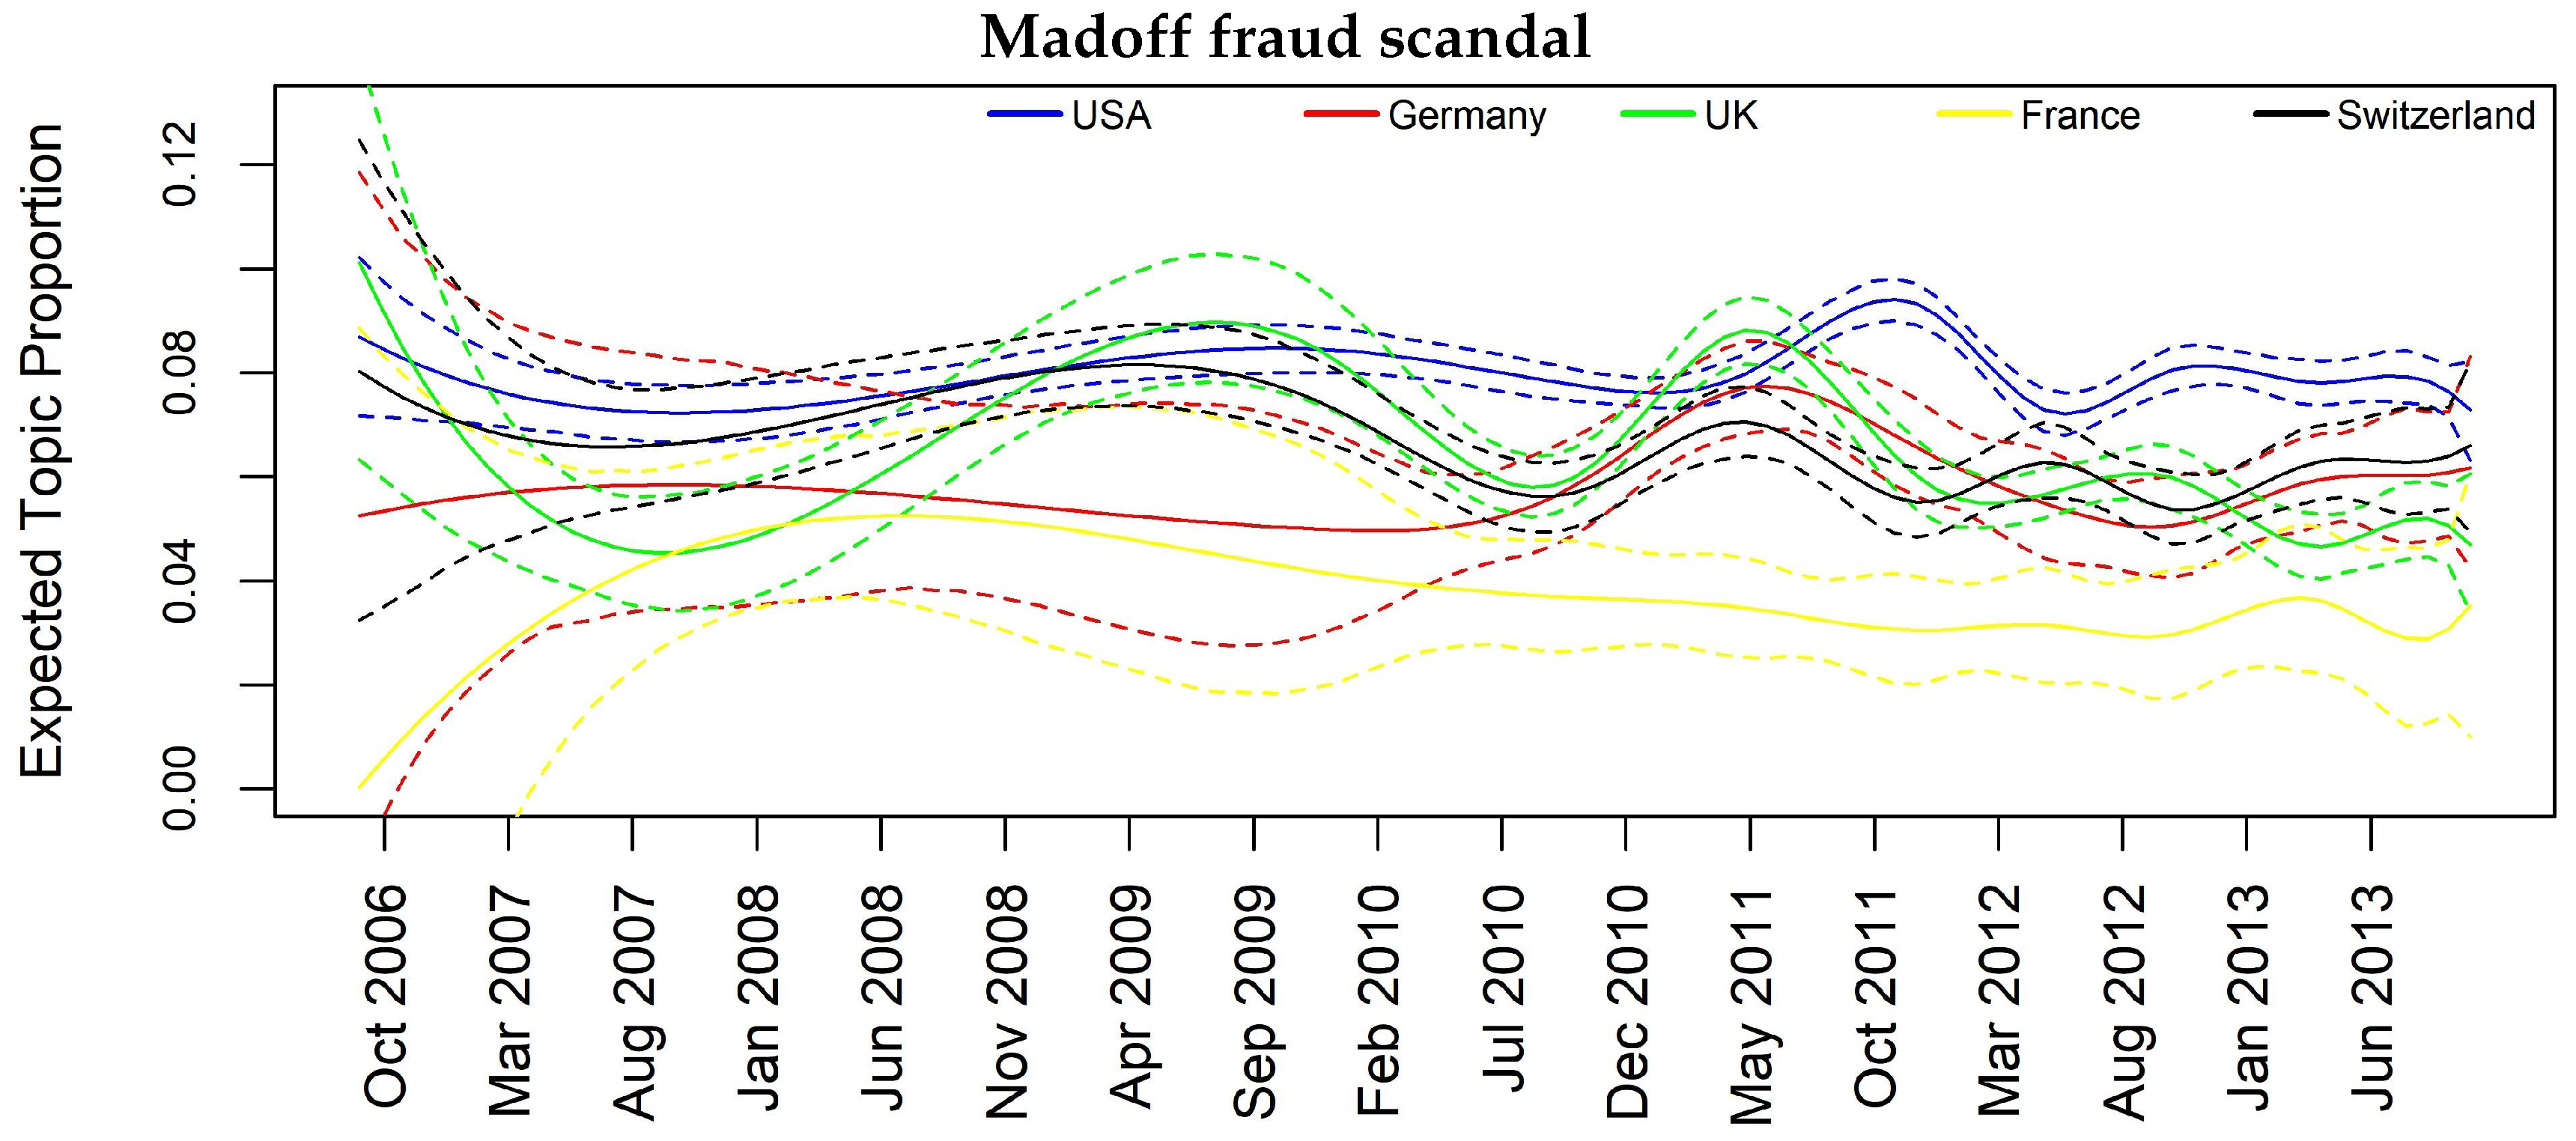
Figure 6.
Topic prevalence evolution by country with respect to monthly based analysis.
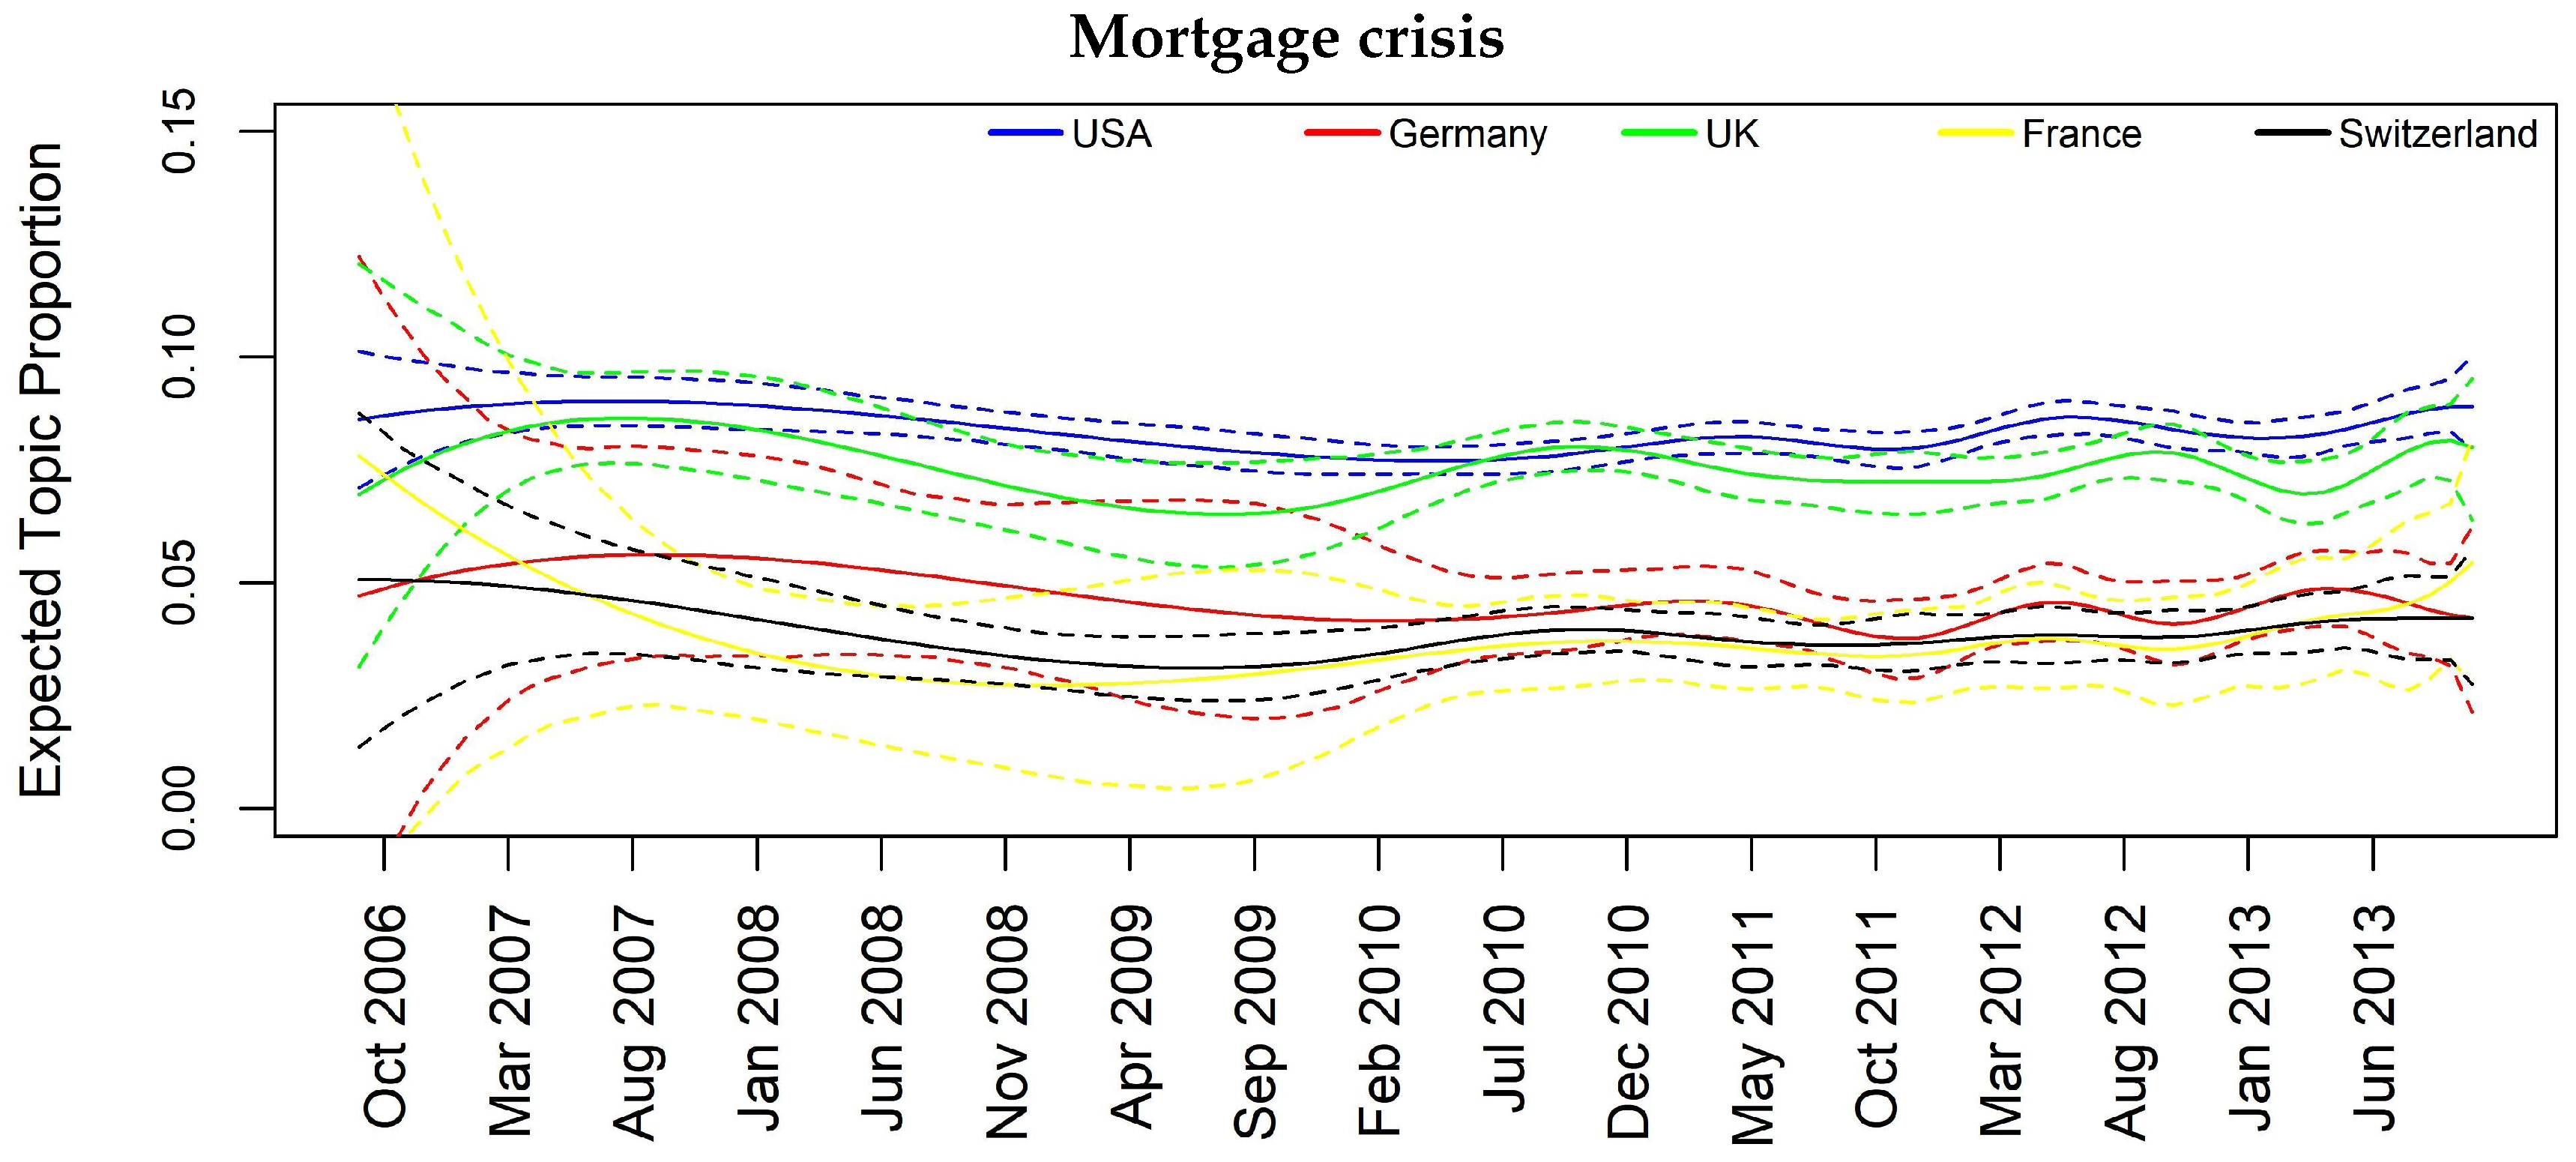
Figure 7.
Topic prevalence evolution by country with respect to weekly based analysis.
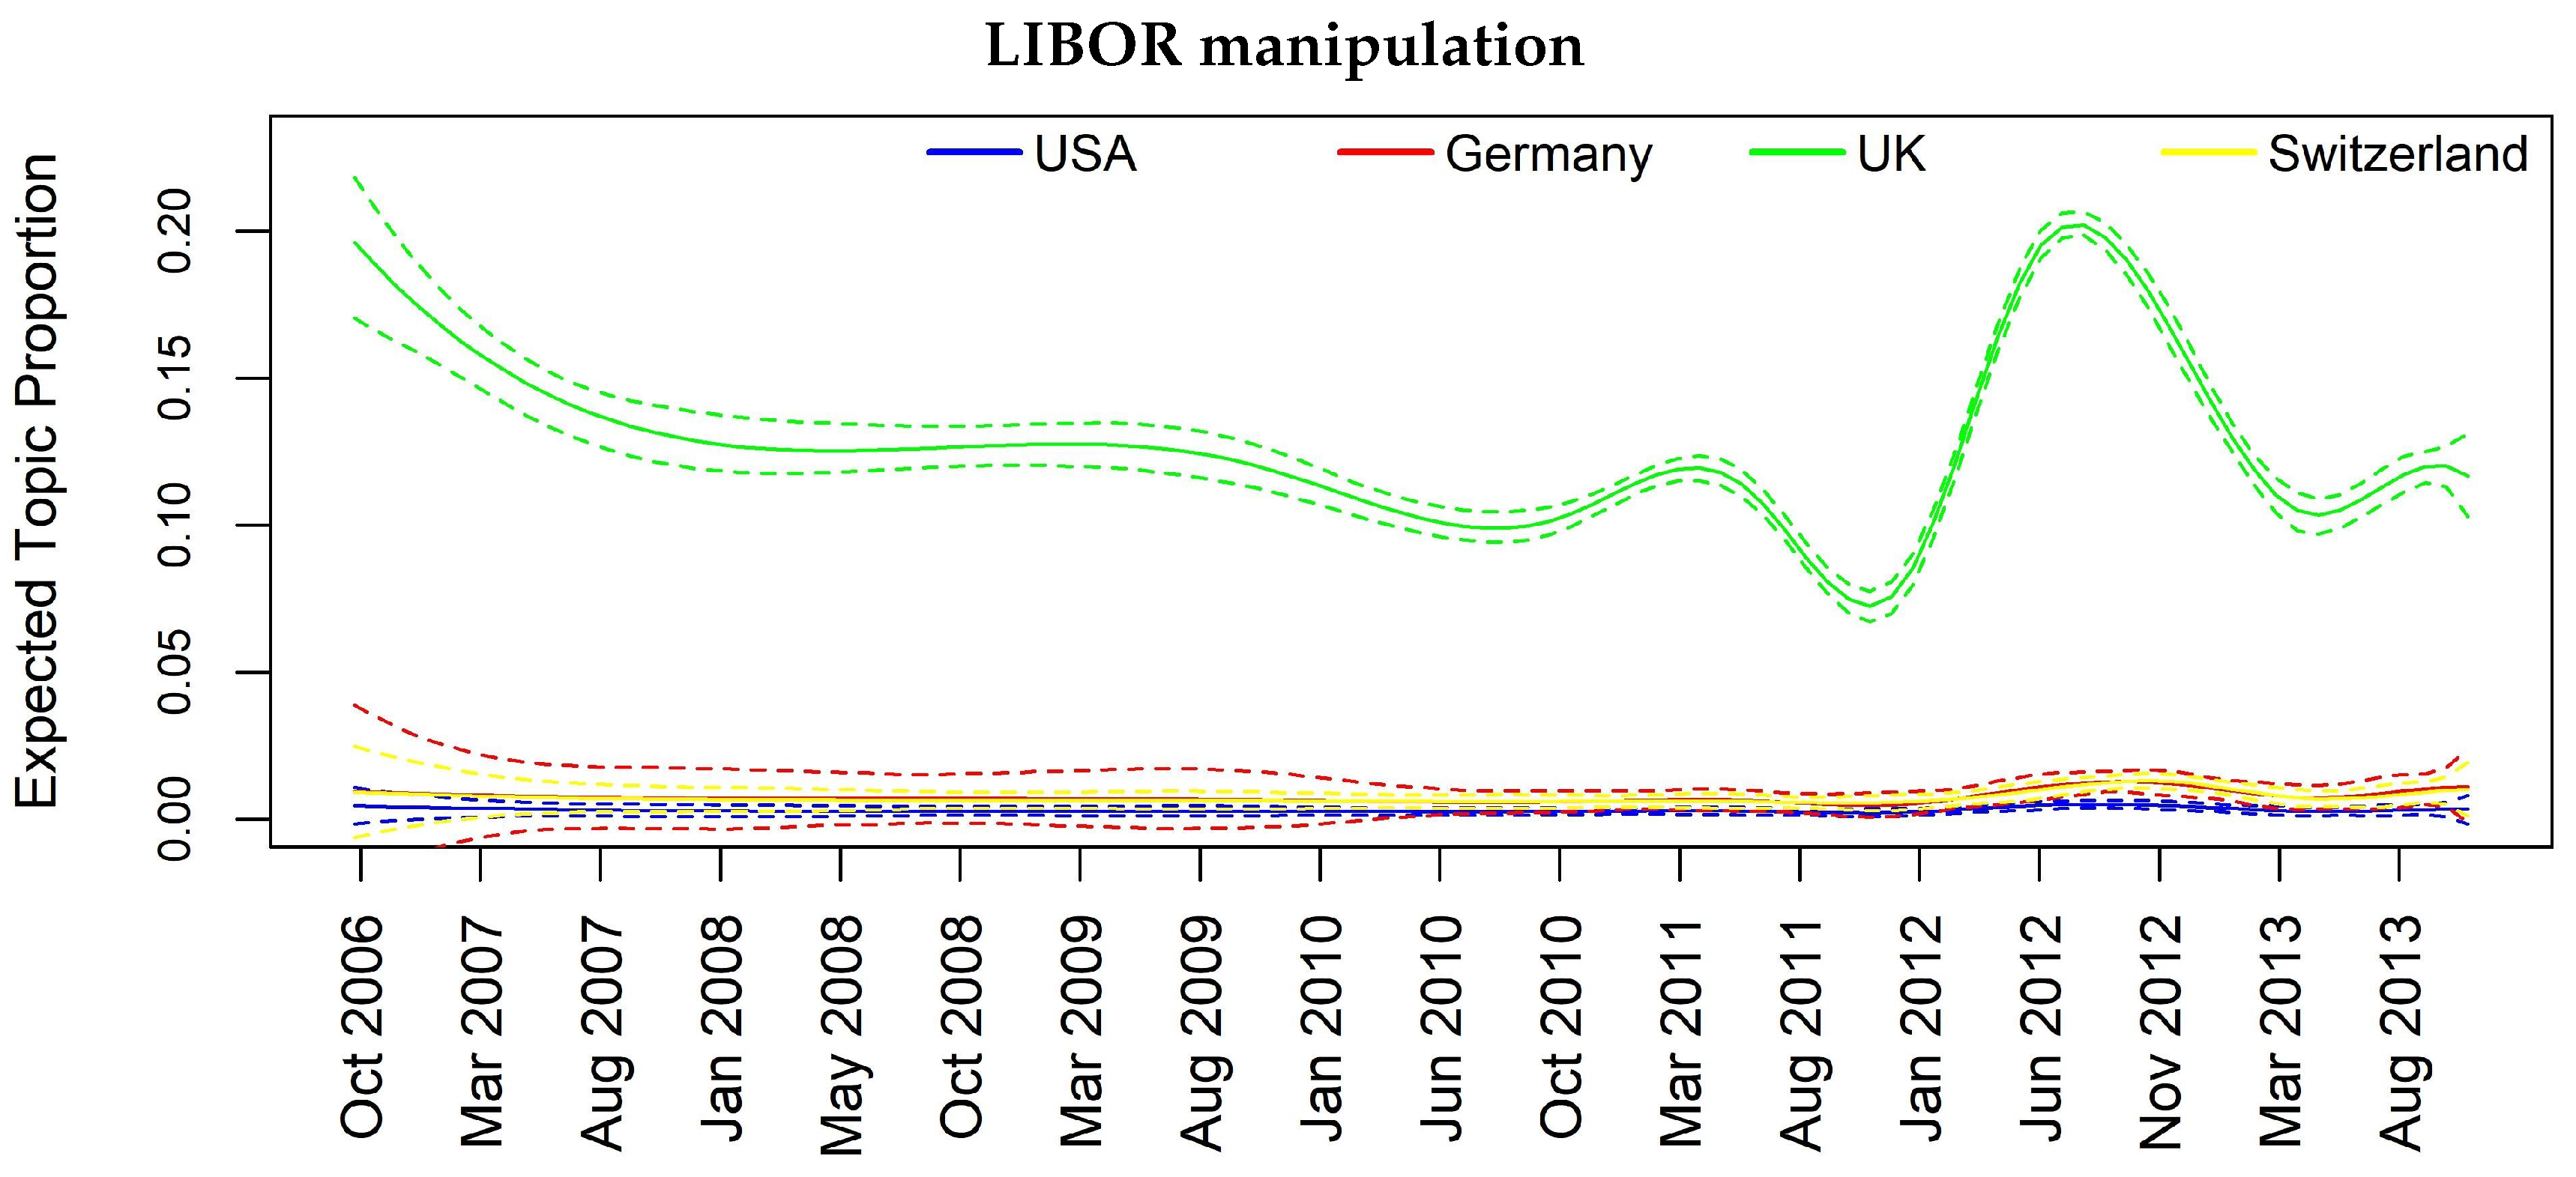
Figure 8.
Topic prevalence evolution by country with respect to weekly based analysis.
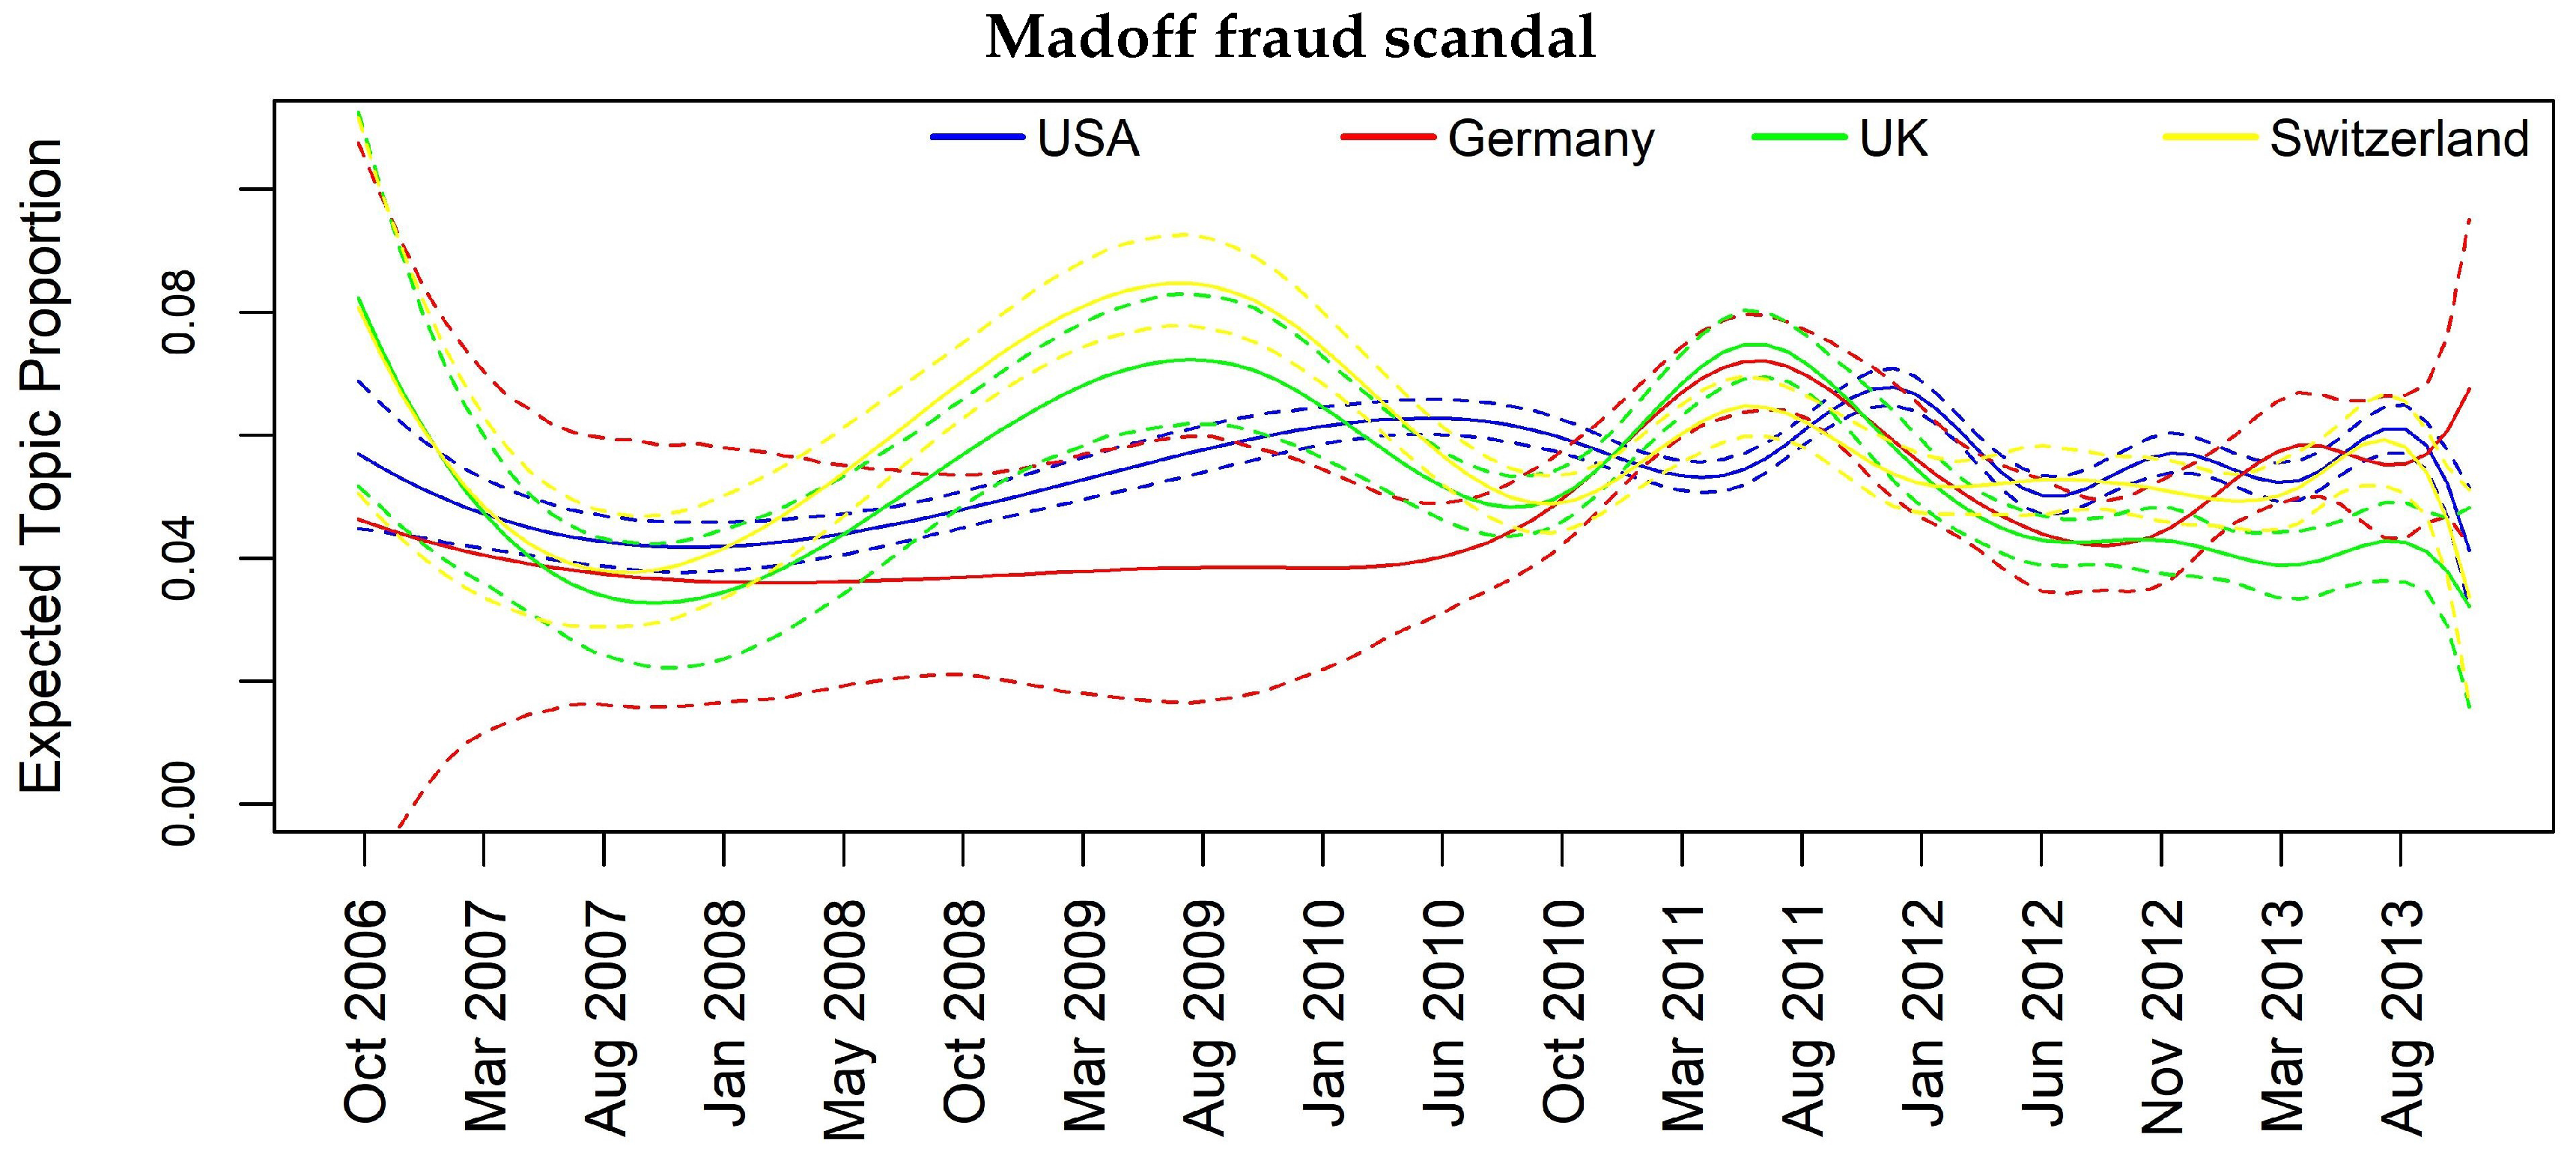
Figure 9.
Topic prevalence evolution by country with respect to weekly based analysis.
Figure 10.
Topic prevalence evolution by country with respect to weekly based analysis.
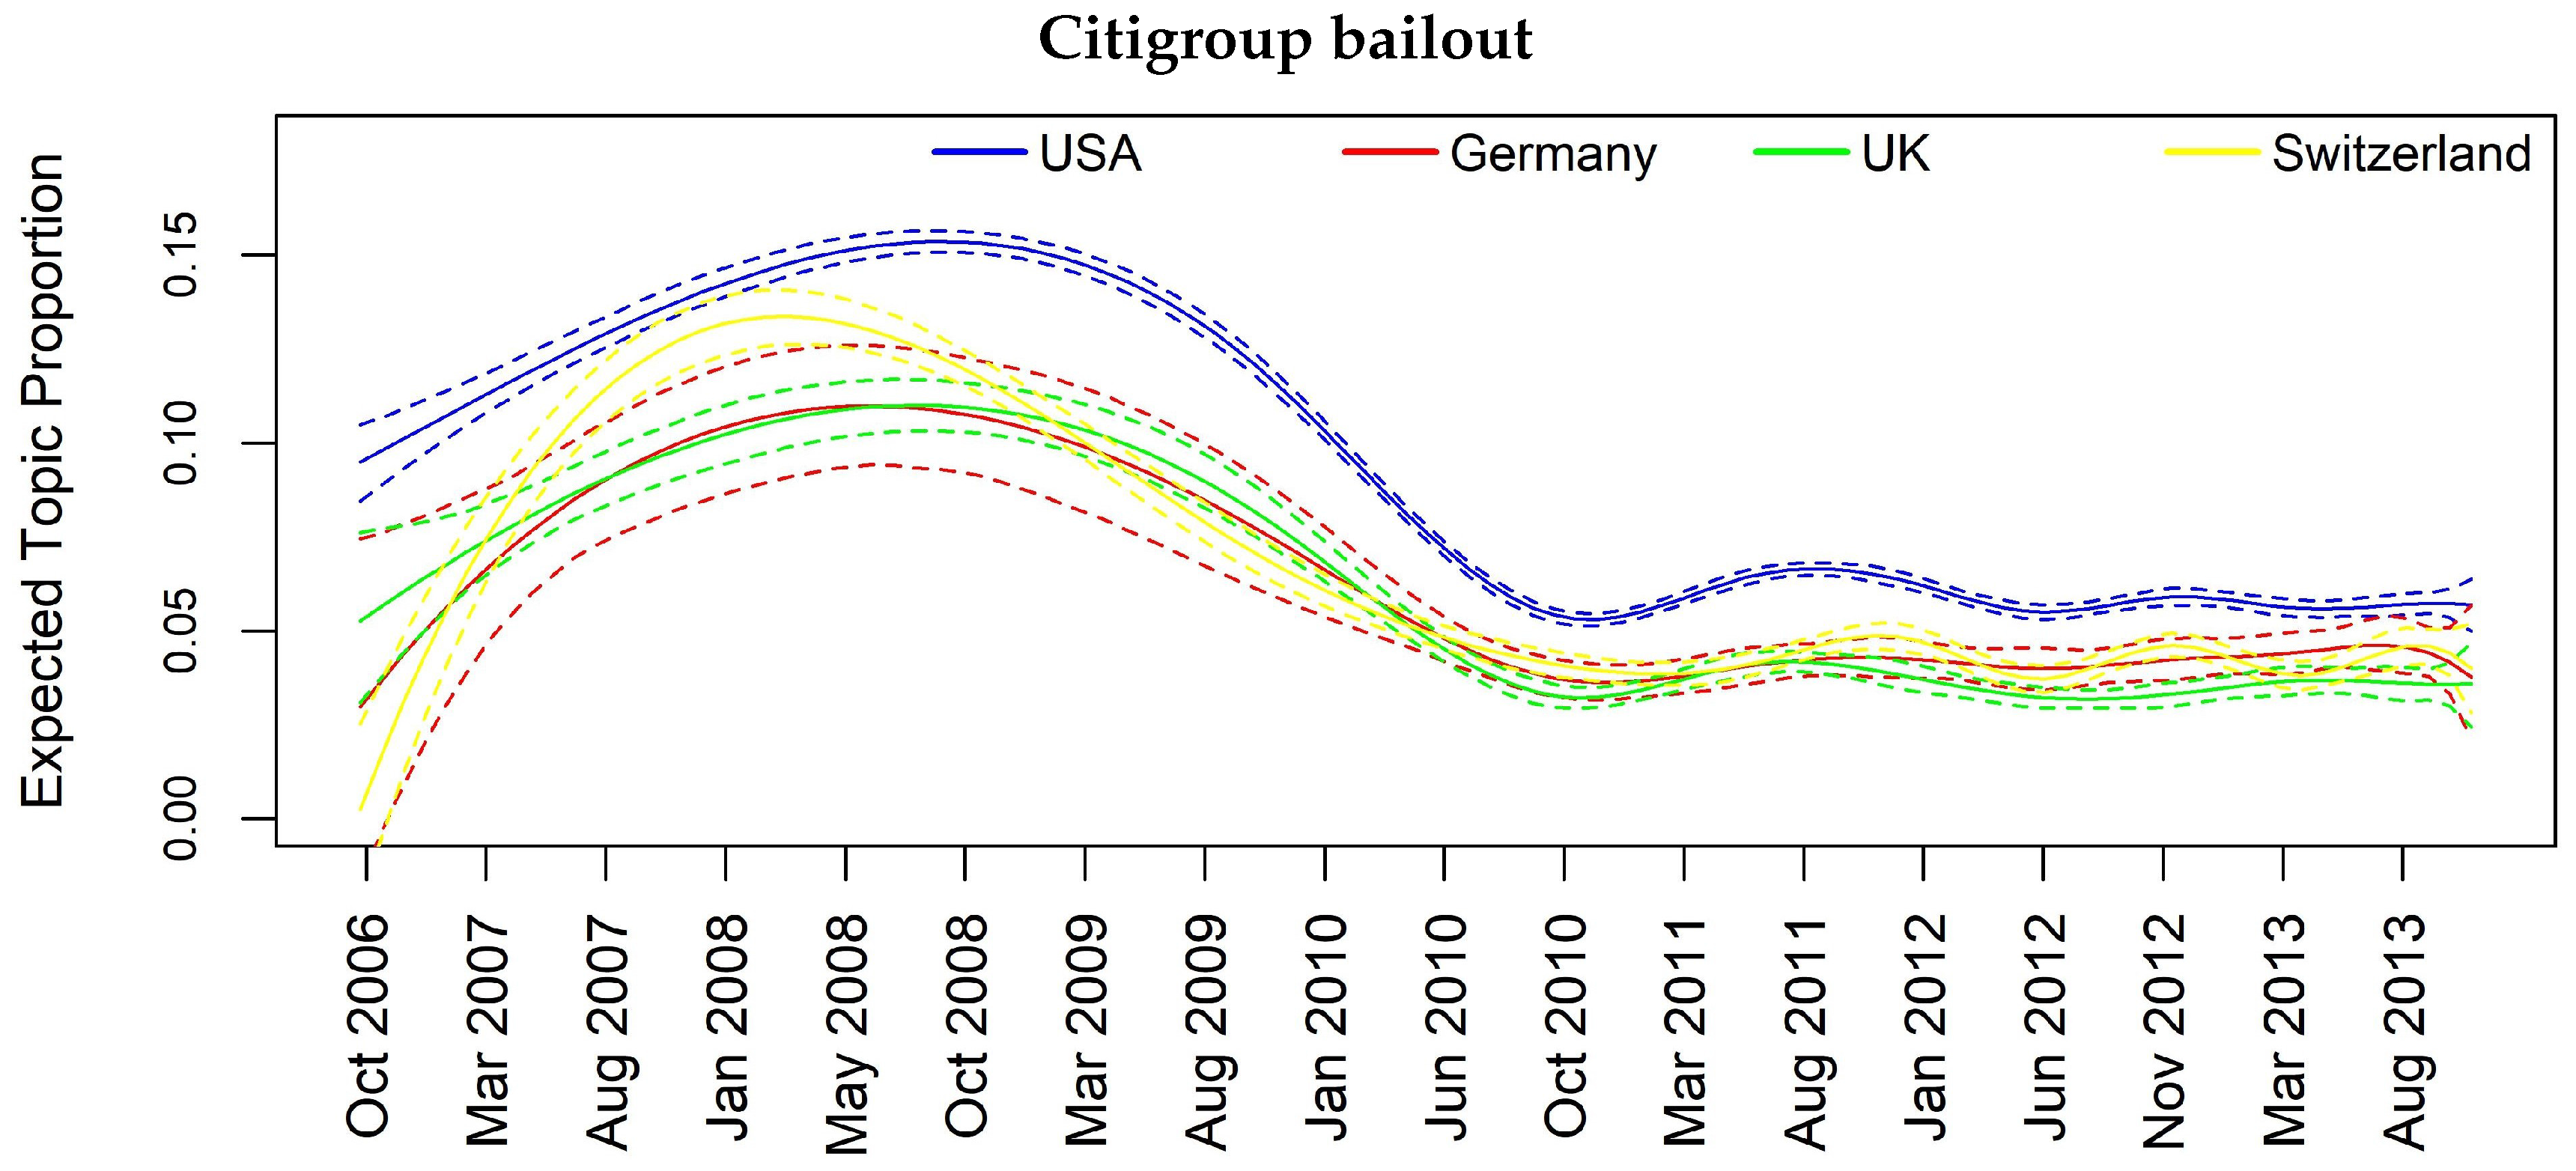
Figure 11.
Topic prevalence evolution by country with respect to weekly based analysis.


Table 1.
List of considered SIFI Banks.
| Bank | # of Sentences | Country |
|---|---|---|
| Bank of America | 19,203 | USA |
| Goldman Sachs | 16,258 | USA |
| Citigroup | 15,446 | USA |
| UBS | 13,414 | Switzerland |
| Barclays | 11,434 | UK |
| Morgan Stanley | 11,162 | USA |
| HSBC | 8693 | UK |
| Deutsche Bank | 7471 | Germany |
| Credit Suisse | 6385 | Switzerland |
| Wells Fargo | 4876 | USA |
| Bank of China | 3416 | China |
| Societe Generale | 2463 | France |
| BNP Paribas | 2012 | France |
| Royal Bank of Scotland | 1943 | UK |
| Standard Chartered | 1813 | UK |
| Commerzbank | 1512 | Germany |
| BNY Mellon | 1427 | USA |
| Credit Agricole | 1195 | France |
| Banco Santander | 1023 | Spain |
| State Street | 926 | USA |
| Sumitomo Mitsui | 900 | Japan |
| JP Morgan | 755 | USA |
| Industrial and Commercial Bank of China | 732 | China |
| BBVA | 718 | Spain |
| Lloyds Bank | 648 | UK |
| China Construction Bank | 387 | China |
| ING Bank | 110 | Netherlands |
| Unicredit | 94 | Italy |
| Dexia Group | 2 | Belgium |
| Total | 136,418 |
Table 2.
Distribution of documents per country.
| Country | # of Sentences |
|---|---|
| USA | 70,053 |
| UK | 24,531 |
| Switzerland | 19,799 |
| Germany | 8983 |
| France | 5670 |
| China | 4535 |
| Spain | 1741 |
| Japan | 900 |
| Netherlands | 110 |
| Italy | 94 |
| Belgium | 2 |
| Total | 136,418 |
Table 3.
Simulation time of the different STM configurations.
| # of Topics | Time (s) |
|---|---|
| 5 | 371 |
| 10 | 522 |
| 12 | 685 |
| 15 | 543 |
| 25 | 1155 |
| 35 | 6667 |
Table 4.
STM configurations comparison on monthly and weekly aggregated data.
| Monthly Aggregation | Weekly Aggregation | |||
|---|---|---|---|---|
| Topic Title | 10 Topics | 12 Topics | 15 Topics | 15 Topics |
| UBS tax fraud scandal | Y | Y | Y | Y |
| Market performance | Y | Y | Y | Y |
| Stock recommendation | Y | Y | Y | Y |
| Chinese companies news | Y | Y | Y | - |
| Hedge Funds, Private Equity and Inv. Banking | Y | Y | Y | Y |
| Press comments and PR | Y | Y | Y | Y |
| Citigroup bailout | Y | Y | Y | Y |
| Advisory | - | - | Y | - |
| Morgan Stanley Investment Banking | Y | Y | Y | Y |
| Euro area banks | Y | Y | Y | - |
| Madoff scandal | - | - | Y | Y |
| Barclays and Deutsche B. LIBOR manipulation | Y | Y | Y | Y |
| Bond, Equity, and CDS markets | - | - | Y | Y |
| Mortgage crisis | - | Y | Y | Y |
| Spanish banks | - | - | Y | - |
| General view on the economy | - | Y | - | - |
| Insider trading investigation | - | - | - | Y |
| Wells Fargo-Wachovia acquisition | - | - | - | Y |
| Bank management changes | - | - | - | Y |
| US banks stocks performance | - | - | - | Y |
Table 5.
List of 15 topics obtained from monthly aggregated data. The associated words are ordered by FREX measure (words are weighted by their overall frequency and how exclusive they are to the topic).
Table 5.
List of 15 topics obtained from monthly aggregated data. The associated words are ordered by FREX measure (words are weighted by their overall frequency and how exclusive they are to the topic).
| Topic | Words |
|---|---|
| Topic 1 | FREX: charg, justic, guilti, account, ubsn, evas, plead, prosecut, crimin, hide, depart, evad, client, indict, california, avoid, wealthi, adoboli, involv, ubsnvx |
| Topic 2 | FREX: gain, percent, cent, cmci, lost, ralli, advanc, drop, materi, sinc, jump, return, slip, tumbl, climb, slid, compil, rose, close, bloomberg |
| Topic 3 | FREX: sumitomo, mitsui, suiss, csgn, scotland, neutral, credit, lloy, spectron, neutral, rbsl, royal, icap, mizuho, csgnvx, maker, suisse , outperform, baer |
| Topic 4 | FREX: elec, cosco, sino, comm, lung, chem, pharm, fook, sang, shougang, yuexiu, sinotran, picc, swire, people , intl, emperor, shui, citic, hang |
| Topic 5 | FREX: sach, goldman, groupinc, blankfein, sachs , gupta, rajaratnam, sachsgroup, corzin, paulson, vice, wall, rajat, tourr, presid, warren, buffett, obama, hathaway, gambl |
| Topic 6 | FREX: spokesman, comment, charlott, spokeswoman, immedi, carolina-bas, tocom, bacn, countrywid, north, avail, lewi, moynihan, confirm, carolina, declin, respond, corp, repres, america |
| Topic 7 | FREX: bailout, citigroup, pandit, sharehold, prefer, receiv, vikram, troubl, citigroup, announc, rescu, common, taxpay, worth, subprim, crisi, dividend, loss, plan, shed |
| Topic 8 | FREX: advis, hire, head, team, familiar, privat, wealth, manag, appoint, deal, equiti, arrang, advisori, co-head, counsel, person, barclay, financ, dbkgnde, advic |
| Topic 9 | FREX: stanley, morgan, stanley , smith, barney, gorman, mack, ventur, facebook, estat, bear, fuel, brokerag, underwrit, real, stearn, crude, commod, brent, healthcar |
| Topic 10 | FREX: societ, pariba, commerzbank, euro, estim, profit, quarter, french, general, forecast, itali, greek, half, predict, germany , technic, germani, greec, socgen, incom |
| Topic 11 | FREX: case, mellon, truste, southern, district, york, suit, bankruptci, mortgage-back, claim, stempel, oblig, collater, file, madoff, lehman, picard, jonathan, rakoff, manhattan |
| Topic 12 | FREX: libor, manipul, diamond, regul, scandal, told, wrote, think, confer, fine, ubss, gruebel, respons, lawmak, event, england, polici, hsbcs, complianc |
| Topic 13 | FREX: basi, point, markit, itraxx, percentag, yield, basispoint, swap, spread, preliminari, manufactur, extra, read, managers , tokyo, demand, releas, bond, econom, narrow |
| Topic 14 | FREX: fargo, charter, chase, well, standard, jpmorgan, jpmn, home, wfcn, build, korea, portfolio, loan, francisco-bas, origin, size, mutual, small, fargo , india |
| Topic 15 | FREX: banco, santand, bbva, bilbao, peso, spain , argentaria, spanish, chile, vizcaya, brazil, latin, mexico, spain, brasil, follow, mover, brazilian, mexican |
Table 6.
List of 15 topics obtained from weekly aggregated data. The associated words are ordered by FREX measure (words are weighted by their overall frequency and how exclusive they are to the topic).
Table 6.
List of 15 topics obtained from weekly aggregated data. The associated words are ordered by FREX measure (words are weighted by their overall frequency and how exclusive they are to the topic).
| Topic | Words |
|---|---|
| Topic 1 | FREX: level, drop, highest, advanc, materi, month, march, sinc, price, measur, gain, builderswel, climb, sector, sentiment, slip, rose, lowest, carri, match |
| Topic 2 | FREX: goldman, sach, sachs, gupta, groupinc, rajaratnam, sachsgroup, street, rajat, blankfein, warren, wall, procter, corzin, tourr, hathaway, ex-goldman, paulson, galleon, inca |
| Topic 3 | FREX: north, countrywid, charlott, bofa, bacn, mortgag, carolina-bas, loan, fanni, merger, moynihan, america, lewi, carolina, freddi, corp, america, brian, repurchas, grayson |
| Topic 4 | FREX: declin, comment, spokesman, spokeswoman, tocom, confirm, duval, mark, e-mail, mari, contact, declinedto, spokesmen, retreat, hasn, york-bas, onth, bloomberg, cohen, interview |
| Topic 5 | FREX: court, district, judg, manhattan, case, dismiss, file, appeal, southern, suit, bankruptci, truste, complaint, claim, -cv-, suprem, rakoff, lawsuit, commiss, mortgage-back |
| Topic 6 | FREX: fargo, well, wachovia, call, avail, repres, wfcn, didn, hour, francisco-bas, bancorp, farg, francisco, respond, request, stumpf, protest, reach, messag, wasn |
| Topic 7 | FREX: bailout, post, billion, announc, result, writedown, troubl, rescu, sheet, book, common, crisi, balanc, prefer, addit, expens, loss, inject, profit, exposur |
| Topic 8 | FREX: execut, chief, chairman, offic, vice, obama, peter, vikram, presid, replac, join, appoint, co-head, left, secretari, univers, board, rubin, pandit, member |
| Topic 9 | FREX: barclay, barc, libor, barclays, barcl, pound, manipul, british, diamond, barclaysplc, brit, britain, absa, plc, penc, fine, interbank, submiss, uk, million-pound |
| Topic 10 | FREX: came, guilti, adoboli, ubss, investig, plead, client, regulatori, indict, requir, arrest, view, complianc, unauthor, banker, hide, desk, ubsnvx, ubs, wealthi |
| Topic 11 | FREX: close, cent, stock, share, afternoon, friday, earli, near, thursday, higher, discount, volum, nyse, tuesday, option, nasdaq, morn, jump, trade, tumbl |
| Topic 12 | FREX: wealth, estat, divis, hedg, manag, focus, oper, invest, busi, fund, investment-bank, unit, privat, main, overse, small, foreign, blackrock, branch, smaller |
| Topic 13 | FREX: point, basi, swap, percentag, tokyo, itraxx, japan, dubai, extra, narrow, spread, sukuk, dollar, hsbcnasdaq, australia, instead, credit-default, basispoint, default, rate |
| Topic 14 | FREX: morgan, stanley, stanl, barney, mitsubishi, gorman, cyclic, smith, facebook, ventur, mack, mufg, appl, underwrit, revenu, brent, joint, healthcar, payor, cargo |
| Topic 15 | FREX: forecast, growth, predict, half, domest, three, second, project, gross, will, economi, almost, slow, spend, earn, fiscal, monetari, expect, deficit, probabl |
Table 7.
Topic prevalence by country.
| Topic | China | France | Germany | Spain | Switzerland | UK | USA |
|---|---|---|---|---|---|---|---|
| UBS tax fraud scandal | 0.01 | 0.03 | 0.04 | 0.01 | 0.13 | 0.03 | 0.03 |
| Market performance | 0.17 | 0.11 | 0.11 | 0.12 | 0.12 | 0.10 | 0.13 |
| Stock recommend. | 0.01 | 0.05 | 0.03 | 0.01 | 0.15 | 0.06 | 0.01 |
| Chinese company news | 0.43 | 0.01 | 0.01 | 0.01 | 0.01 | 0.03 | 0.01 |
| H. Funds, Pr. Eq. and Inv. Bank. | 0.01 | 0.01 | 0.01 | 0.01 | 0.01 | 0.01 | 0.12 |
| Press comments and PR | 0.02 | 0.02 | 0.03 | 0.02 | 0.03 | 0.02 | 0.09 |
| Citigroup bailout | 0.07 | 0.04 | 0.04 | 0.02 | 0.07 | 0.05 | 0.13 |
| Advisory | 0.03 | 0.07 | 0.20 | 0.03 | 0.10 | 0.14 | 0.06 |
| Morgan St. Inv. Banking | 0.00 | 0.01 | 0.01 | 0.00 | 0.01 | 0.01 | 0.07 |
| Euro area banks | 0.07 | 0.40 | 0.24 | 0.08 | 0.08 | 0.07 | 0.05 |
| Madoff scandal | 0.02 | 0.03 | 0.06 | 0.02 | 0.06 | 0.06 | 0.08 |
| Barclays and DB LIBOR manip. | 0.07 | 0.09 | 0.11 | 0.03 | 0.13 | 0.18 | 0.06 |
| Bond, Equity and CDS markets | 0.05 | 0.08 | 0.07 | 0.06 | 0.03 | 0.15 | 0.06 |
| Mortgage crisis | 0.04 | 0.03 | 0.04 | 0.02 | 0.03 | 0.07 | 0.08 |
| Spanish banks | 0.02 | 0.02 | 0.02 | 0.57 | 0.02 | 0.02 | 0.02 |
Table 8.
Results from Granger causality test for Topics 1, 7, 10, 11, 12, and 14 obtained from STM applied on monthly based data.
Table 8.
Results from Granger causality test for Topics 1, 7, 10, 11, 12, and 14 obtained from STM applied on monthly based data.
| UBS Tax Fraud | Significant Lag | Citigroup Bailout | Significant Lag |
| FR → USA | 1L, 2L | FR → USA | 1L, 2L |
| FR → UK | 1L, 2L | CH → UK | 1L, 2L |
| UK → DE | 2L | FR → UK | 1L |
| UK → FR | 2L | USA → CH | 1L, 2L |
| Euro Area Banks | Significant Lag | Madoff Scandal | Significant Lag |
| CH → USA | 1L, 2L | UK → USA | 1L, 2L |
| FR → USA | 1L, 2L | CH → USA | 1L, 2L |
| USA → UK | 1L,2L | DE → UK | 2L |
| CH → UK | 1L,2L | DE → CH | 2L |
| FR → UK | 1L,2L | FRA → CH | 2L |
| FR → CH | 1L,2L | - | - |
| FR → DE | 1L,2L | - | - |
| Libor Manipulation | Significant Lag | Mortgage Crisis | Significant Lag |
| CH → USA | 2L | CH → USA | 2L |
| CH → DE | 1L | FR → UK | 2L |
| - | - | USA → CH | 1L, 2L |
| - | - | FR → CH | 2L |
| - | - | USA → FR | 1L, 2L |
| - | - | USA → DE | 1L |
Table 9.
Results from Granger causality test for Topics 24, 15, 4, 12, 23, and 17 obtained from STM applied on weekly based data.
Table 9.
Results from Granger causality test for Topics 24, 15, 4, 12, 23, and 17 obtained from STM applied on weekly based data.
| UBS Tax Fraud | Significant Lag | Citigroup Bailout | Significant Lag |
| UK → USA | 1L,2L | USA → UK | 1L |
| USA → CH | 1L,2L | USA → CH | 1L, 2L |
| USA → DE | 1L,2L | DE → UK | 1L |
| UK → DE | 2L | UK → USA | 2L |
| - | - | DE → USA | 2L |
| Mortgage Crisis | Significant Lag | Madoff Scandal | Significant Lag |
| UK → CH | 1L, 2L | CH → USA | 1L, 2L |
| CH → UK | 1L, 2L | UK → CH | 1L, 2L |
| USA → CH | 2L | USA → DE | 1L |
| - | - | UK → USA | 2L |
| - | - | DE → USA | 2L |
| - | - | UK → DE | 2L |
| Libor Manipulation | Significant Lag | Mgmt Changes | Significant Lag |
| CH → USA | 1L | - | - |
| USA → UK | 2L | - | - |
| CH → UK | 2L | - | - |
© 2018 by the authors. Licensee MDPI, Basel, Switzerland. This article is an open access article distributed under the terms and conditions of the Creative Commons Attribution (CC BY) license (http://creativecommons.org/licenses/by/4.0/).
Share and Cite
MDPI and ACS Style
Cerchiello, P.; Nicola, G. Assessing News Contagion in Finance. Econometrics 2018, 6, 5. https://doi.org/10.3390/econometrics6010005
AMA Style
Cerchiello P, Nicola G. Assessing News Contagion in Finance. Econometrics. 2018; 6(1):5. https://doi.org/10.3390/econometrics6010005
Chicago/Turabian StyleCerchiello, Paola, and Giancarlo Nicola. 2018. "Assessing News Contagion in Finance" Econometrics 6, no. 1: 5. https://doi.org/10.3390/econometrics6010005
Note that from the first issue of 2016, this journal uses article numbers instead of page numbers. See further details here.