
The Turkish Spatial Wage Curve †


Department of Economics, Syracuse University, 110 Eggers Hall, Syracuse, NY 13244-1020, USA
†
This paper is presented in the 10th Annual Conference of SEA, Rome, Italy, 13–15 June 2016.
Econometrics 2017, 5(3), 37; https://doi.org/10.3390/econometrics5030037
Submission received: 31 January 2017
/
Revised: 25 July 2017
/
Accepted: 17 August 2017
/
Published: 29 August 2017
(This article belongs to the Special Issue Recent developments in Spatial Econometrics, associated with the 10th Annual Conference of the Spatial Econometrics Association, Rome 13-15 June 2016)
Abstract
:The wage curve for Turkey revisited considering the spatial spillovers of the regional unemployment rates using individual level data for a period of 2004–2013 at the 26 NUTS-2 level by employing FE-2SLS models. The unemployment elasticity of real wages is −0.07 without excluding any group of workers unlike previous studies. There is strong evidence on spatial effects of unemployment rate of contiguous regions on wage level, which is larger, in absolute value, than the effect of own-regional unemployment rate, −0.087 and −0.056, respectively. Male workers are slightly more responsive to the own-region unemployment rate than female workers. However, female workers are more responsive to the neighboring regions’ unemployment rate. Furthermore, using group-specific unemployment rates in the estimation of the wage curve for various groups, we find that unemployment elasticity of pay for female workers has become smaller and lost its significance, whereas unemployment elasticity for male workers has changed slightly. However, introducing group-specific unemployment rate results in losing significance in estimates for female workers. The findings in this paper suggest that individual wages are more responsive to the unemployment rates of the proximate regions than that of an individual’s own region. Also, the wage curve estimates are sensitive to the group-specific unemployment rates.
Keywords:
wage curve; spatial spillover; regional labor markets; group-specific regional unemployment; fixed-effectsJEL Classification:
C26; J30; J601. Introduction
The wage curve is an empirical phenomenon featuring the negative relationship between the regional unemployment rate and the real wage level. This relationship has been first discovered by Blanchflower and Oswald (1990, 1994) using microeconomic data for over a dozen countries including the UK and the US. The strength of this relationship was found to be interestingly similar, around −0.10, across countries and time periods. Therefore, it is considered an “empirical law of economics” (Card 1995). This uniformity of the wage elasticity with respect to regional unemployment attracted many other researchers in search of a wage curve for other countries. Nijkamp and Poot (2005) confirmed the existence of the wage curve using a meta-analysis on 208 wage curve estimates. They find a lower elasticity after bias correction which is around −0.07. Moreover, Blanchflower and Oswald (2005) summarize the wage curve estimates from over 40 countries and re-estimate the US wage curve with contemporary data. They conclude that long-term elasticity of wages with respect to regional unemployment is −0.10.
Regional permanent effects are controlled with the inclusion of region fixed effects in the wage curve estimation, assuming that regions are independent units. However, the regions may be interrelated due to labor mobility or contiguous effects of employment conditions between regions. Moreover, the regions used in the wage curve studies are generally administrative regions which do not necessarily represent the true functional labor markets. Therefore, a spatial correlation among the primary units of the wage curve is expected. Hence, neglecting the spatial correlation might result in misspecification of the wage equation and introduce a bias. Studies addressing spatial effects and spillover effects of dependent and/or independent variables have emerged in the last decade for Germany (e.g., Buettner 1999; Longhi et al. 2006; Elhorst et al. 2007), Poland (Baltagi and Rokicki 2014), Spain (Ramos et al. 2015), the UK (Fingleton and Palombi 2013), and Turkey (Baltagi et al. 2015). Longhi et al. (2006) point out that if the wage curve results from worker heterogeneity and the monopsony power of an individual employer, elasticity of labor supply, and in turn, the wage curve will depend on the employment conditions of adjacent labor markets and the cost of mobility between labor markets. Therefore, ignoring the interaction between adjacent economies and spatial spillover effects may lead to misspecification of the wage equation and overestimation of the own-region unemployment elasticity of real wages.
Moreover, Card (1995) points out a possible bias that arises from the use of an overall unemployment rate instead of group-specific unemployment rates in wage curve estimations for various worker groups. A few studies provide wage curve estimates using group-specific unemployment rates for gender, age, or race groups (e.g., Boushey 2002; Konyali 2012; Baltagi and Rokicki 2014). However, a more relevant disaggregation in the labor force—skill groups—has not been used.
The existing wage curve literature on Turkey finds evidence on the existence of the Turkish wage curve for various groups of workers. The overall unemployment elasticity of real wages is found to be in line with international findings, around −0.10 (e.g., Ilkkaracan and Selim 2003; Baltagi et al. 2012, 2013). Ilkkaracan and Selim (2003) provide the first evidence for the Turkish wage curve but fail to control for regional differences as it is a cross-section analysis. Baltagi et al. (2012) is the first economy-wide study on the Turkish wage curve which controls for regional differences and endogeneity of the unemployment rate, using data for 26 NUTS-2 regions over the period 2005–2008. Although, male wage curves show similarity across studies, significant wage curves for female workers have only been found in those studies that exclude agriculture sector, i.e., Baltagi et al. (2012, 2013) and Baltagi et al. (2015). Interestingly, whenever a female wage curve is significant, it is more elastic than male wage curve, except Baltagi et al. (2015). Moreover, Konyali (2012) considers group-specific unemployment rates in her study and finds weak evidence for a wage curve for males with the male unemployment rate. The above studies use data on a boom period in the Turkish economy, such that only one part of the business cycle has been considered in these analyses. Ilkkaracan et al. (2013) use a longer period with regional skill level unemployment rates excluding the public sector workers. They find evidence on a wage curve for males. Furthermore, Baltagi et al. (2015) use a longer period of data that can capture the whole business cycle, investigating the differences in the spatial wage curves of formal and informal workers1. They use regional non-agricultural unemployment rates instead of the overall unemployment rate. Therefore, these estimates may not depict the whole picture of Turkish wage curve.
This study contributes to the literature in several ways. First, the wage curve for Turkey is revisited, providing a broader picture than the existing studies. Baltagi et al. (2012, 2013) and Baltagi et al. (2015) excluded the agricultural sector and use non-agricultural unemployment rate, while Ilkkaracan et al. (2013) excluded public sector workers from their analysis. Unlike previous studies on the Turkish wage curve, we do not exclude those groups, so that we can examine the economy-wide existence and strength of the Turkish wage curve for a longer period; 2004–2013. Second, the spatial spillover effect of regional unemployment on individual wages is accounted for in the Turkish wage curve estimates. Third, we estimate the unemployment elasticity of pay and spatial spillover effects using group-specific unemployment rates. In fact, to our best knowledge, we use skill-specific unemployment rates for the first time in estimating wage curve and spatial spillover effects.
This study corroborates the existence of a wage curve in Turkey with unemployment elasticity of real wages of −0.071 when the endogeneity problem is addressed. We find that unemployment elasticity of real wages is slightly higher for Turkish men than for Turkish women, which contrast with the previous studies on Turkey except Baltagi et al. (2015), but is in line with most of the studies on other countries in the literature. Moreover, more fragile worker groups such as young workers, low-skilled workers, less-experienced workers, etc. have higher elasticities than their counterparts. There is strong evidence on the spatial effects of the unemployment rate of contiguous regions on wage level, which is larger, in absolute value, than the effect of the own region’s unemployment rate. The FE-2SLS results indicate that own region elasticity is −0.056 while spatial spillover unemployment elasticity is −0.087. We find that these results hold for various groups of workers that are defined in terms of gender, age, skill, experience, and sector. Robustness checking for the spatial weight matrix shows that the use of full Euclidean distance matrix averages out the effect of positive correlation between neighboring regions.
Furthermore, using group-specific unemployment rates in the estimation of the wage curve for various groups, we find that unemployment elasticity of pay for female workers become smaller and loses its significance, whereas unemployment elasticity for male workers changes slightly. Moreover, estimations of the wage curve for workers aged 15–24 and workers aged 25 years or above show that the use of group-specific regional unemployment rates, rather than the overall regional unemployment rate, increases the magnitude of unemployment elasticity of young (15–24) workers. However, it leads to a decrease in the magnitude of unemployment elasticity of workers aged 25 or older, in absolute value. More interestingly, disaggregating based on skill level of workers, we show that the most responsive group to the overall unemployment is the low-skilled workers with an elasticity of −0.099, whereas the most responsive group to the group-specific unemployment rates is the medium-skilled workers, with an elasticity of −0.094. In addition, we estimate the spatial model using group-specific unemployment rates. We find that spatial spillover unemployment elasticities of pay are statistically significant and higher in absolute value than unemployment elasticities for all groups except female workers and high-skilled workers. Wages of medium-skilled workers are more responsive to the group-specific unemployment rate of both own and contiguous regions, than that of low-skilled workers. Similarly, both unemployment elasticity of pay and spatial spillovers are higher for young workers than that for old workers.
2. Data
In this study, we use the Turkish Household Labor Force Survey (THLFS) data which is collected and released by Turkish Statistical Institute (TURKSTAT). The THLFS is a micro level annual survey on the whole nation in which around 500,000 individuals are surveyed on their demographic and work-related characteristics. This rich data set has been conducted since 1988 and has had two major changes in 2000 and 2004. Therefore, we used the data for the period 2004–2013.
Demographic characteristics of all individuals surveyed are available in THLFS. However, labor market-related information is available for those who are 15 years old or above. Furthermore, information on income is available only for regular and casual workers. Thus, we exclude individuals younger than 15 years old and employers, self-employed, and unpaid family workers. Also, individuals who started to work in the month of the survey or did not provide their wage information are excluded. Moreover, those individuals with missing information about employment, wage, and individual characteristics are dropped from the sample. After exclusion of those observations, we are left with 821,166 observations of which 192,721 are female. Wages are reported as monthly income after deduction of taxes, compulsory social security, and other life insurance premiums.
Hourly real wages are calculated using monthly wages and usual working hours. All wages are expressed in 2003 liras using the consumer price index (CPI) which is available in NUTS-2 level regions in the TURKSTAT’s webpage. Unemployment rate data is also obtained from TURKSTAT. Regional aggregate unemployment rates—as well as disaggregated unemployment rates by gender, age group, and education level—are publicly available in TURKSTAT’s webpage. Moreover, shape files for the NUTS-2 regions used to create spatial weights are extracted from the shape files available in EUROSTAT for all European countries in all NUTS levels. Summary statistics of our sample for the variables used in our estimations are presented in Table 1.
Table 1 shows that only 23.5% of our sample is female. This is not surprising because labor force statistics of TURKSTAT shows that the labor force participation of women is quite low ranging between 20%–30% in the last two decades. It is also presented in Table 1 that the average working hours per week is 51 hours which is the highest average among the OECD countries. The average years of education of the sample is 9.13. That is higher than the average education for the whole country. This is because the selection into employment is severe for females in Turkey. The average hourly wage in the sample is 2.73 liras.
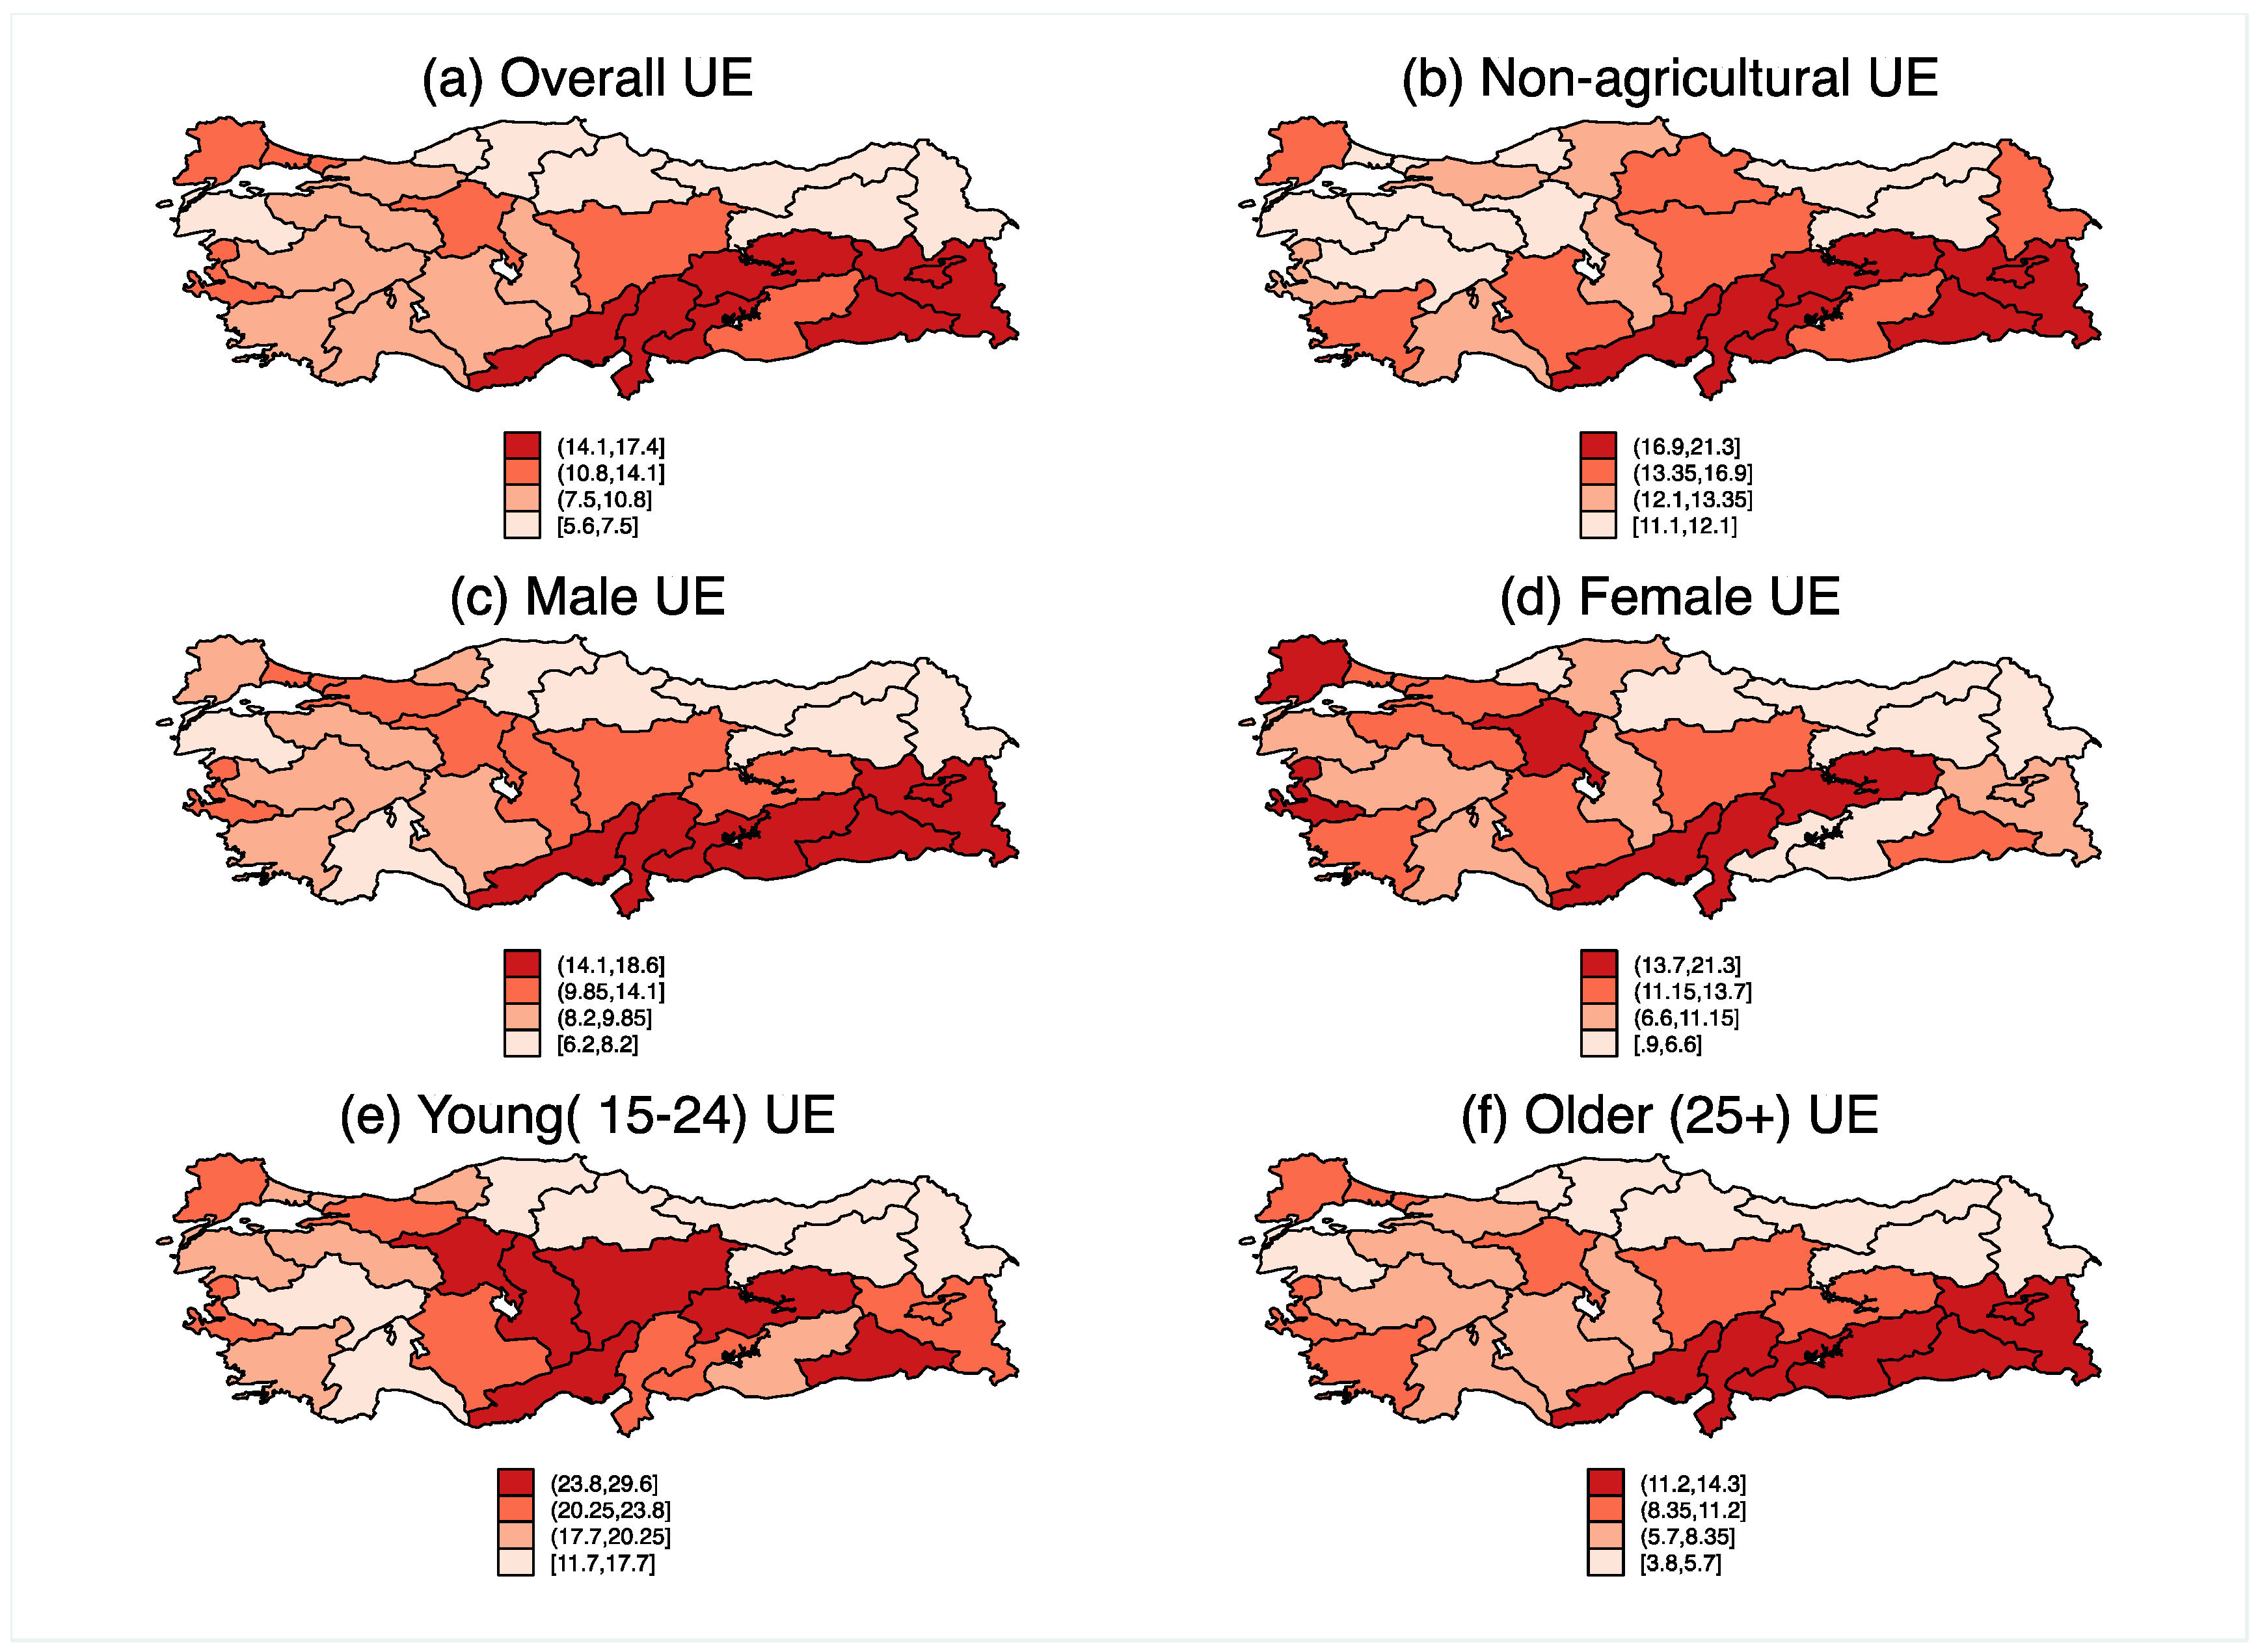
As we are interested in investigating the spatial spillover effects of the unemployment rate on individual wages over 26 NUTS-2 regions of Turkey and the effect of disaggregated unemployment rate for various groups, Figure 1 and Figure 2 show the spatial distribution of unemployment rates for the year 2008. Although we use the overall unemployment rate in our estimation, we also provide estimations using the non-agricultural unemployment rate in order to compare our results with earlier wage curve estimates for Turkey (e.g., Baltagi et al. 2012, 2013). Figure 1 presents the spatial variation of unemployment rate across 26 NUTS-2 level regions of Turkey.
The spatial spillovers seem more pronounced in the male unemployment rate than the female unemployment rate. However, the female workers experience a wider range of unemployment rates than the male workers. Also, the unemployment rate for younger workers, who are between 15 and 24 years old, is higher and span in a wider range, while spatial spillover of the unemployment rate is more apparent for older, who are 25 years old or older. Furthermore, as Card (1995) points out, the responsiveness of wages to the group-specific unemployment rate may be more relevant to the skill levels. TURKSTAT provide unemployment rates for four different education levels, which enable us to map the group-specific unemployment rates in Turkey. Figure 2 shows the spatial variation of group-specific unemployment rates for levels of schooling in the year 2008. It seems that the patterns of the spatial spillovers of unemployment rate vary across skill levels.2 Figure 2 suggests that the spatial patterns are clear in for the low-skilled workers. It is very similar to the spatial distribution of the overall unemployment rate in Figure 1a.
3. The Model
We start our analysis with the standard wage curve equation in which logarithm of individual real wages are regressed on the natural logarithm of the regional unemployment rate and other individual characteristics as well as regional and time fixed effects. Following Blanchflower and Oswald (1990) and Card (1995), we use the following equation;
where is individual real hourly wages and is regional unemployment rate. includes age, age square, tenure at the firm and its square, and dummy variables for gender, marital status, having registered in social security system (formality status), permanency of the job, urban, having an additional job, part-time, private sector; firm size dummies, occupation dummies, and industry dummies.3 Moreover, education is controlled for by including five dummy variables for the completed education levels for those primary school graduates, middle school graduates, general high-school graduates, vocational high-school graduates, and college graduates. Furthermore, some students work in part-time jobs while in school and the open education system allows workers to continue their education without requiring regular attendance. Thus, we include a dummy variable for those who are in school and one dummy variable for those who are in school at which attendance is required. represents the 26 NUTS-2 region dummies which are used to control for the time-invariant region characteristics that might affect the real hourly wages of individuals. represents dummy variables for each survey year which captures the business cycle effects on the individual hourly wages. Blanchflower and Oswald (1990, 1994) use Equation (1) to estimate unemployment elasticity of pay, β, by OLS estimation assuming the unemployment rate is predetermined. They find that elasticity is around −0.10 and robust across countries and time periods as well as various groups disaggregation. This finding arises from the cyclicality of real wages (Card 1995). Later studies point out that the unemployment elasticity of pay differs for different groups of workers using aggregate unemployment rates (e.g., Card 1995; Baltagi et al. 2012). However, the responsiveness of the individual wages might differ depending on whether the unemployment rate is measured as overall regional unemployment or regional group-specific unemployment. It is likely that a worker competes with other workers within groups, such that unemployment rate of skilled workers may not be a threat for unskilled workers (Card 1995). The segmented labor markets based on worker qualifications might be even more pronounced in the developing countries such as Turkey according to Ilkkaracan et al. (2013). If this is the case, using group-specific unemployment rate would be more appropriate in wage curve estimations. On the other hand, it is also possible that worker groups operate in a single labor market. That is women and men can compete for the same jobs. Furthermore, the prevalence of skill mismatching raises the possibility of working in jobs that require lower qualifications. If this is the case, we would expect that overall unemployment would be more appropriate to use in wage curve estimates. Therefore, we compare the wage curve of different type of workers using overall unemployment rates and group-specific unemployment rates.
The data used in the wage curve literature is either individual data or region averages. It has also been realized that the relevant degrees of freedom is not the number of individuals used in the analyses, but the number of regions times the number of periods. Thus, use of individual data may cause serious bias in the standard errors and misleading inference if the number of regions and time periods are small (Card 1995). However, it may not be a serious problem for countries with 200–500 region-year cell observations. Moreover, the use of regional unemployment rates introduces correlation in the regressors and errors across individuals in the same regions. This correlation might induce a downward bias in the standard errors, in turn, lead misleading inference. Assuming independence across regions, this problem can be dealt with clustering standard errors by regions (Card 1995). Following Baltagi et al. (2012), we use individual-level data and the 26 NUTS-2 level regions over 10 years.
Another problem with the estimation of responsiveness of individual wages to the regional unemployment rate is the simultaneity bias due to the endogenous regional unemployment rate. Although this problem has been realized by Blanchflower and Oswald (1990), they fail to find a good instrument. Baltagi and Blien (1998) show that the wage curve estimates are sensitive to the endogeneity. They use a lagged unemployment rate as an instrument for the unemployment rate in a fixed effect 2SLS (FE-2SLS) setting. This procedure has been followed by many other wage curve studies, including the Turkish case (e.g., Baltagi et al. 2012, 2013; Baltagi and Rokicki 2014). We also address the endogeneity of local unemployment rate with instrumenting it with its one-year lagged values.
The efficiency wage and labor turnover costs explanations of the wage curve assume that if unemployment is high in a local labor market, employers have an incentive and opportunity to lower the wages (Longhi et al. 2006). However, if the unemployment rate is low in the adjacent labor markets, and cost of mobility between regions is low, then employers may not be able to lower the wages (Fingleton and Palombi 2013). On the other hand, Longhi et al. (2006) and Morrison et al. (2006) provide another explanation, monopsonistic competition, for wage curve due to Bhaskar and To (1999). In this model, there is a free entry into the market, but firms are constrained by a lump-sum start-up cost and heterogeneous workers face commuting and migration costs which vary depending upon the location of the job, such that an individual firm has a monopsony power over wage setting. Longhi et al. (2006) point out that if the wage curve results from worker heterogeneity and monopsony power of individual employers, the elasticity of labor supply, and in turn, wage curve will depend on the employment conditions of adjacent labor markets and the cost of mobility between labor markets. Therefore, ignoring the interaction between adjacent economies and spatial spillover effects may lead to misspecification of the wage equation and overestimation of the own-region unemployment elasticity of real wages.
There are mainly three different ways of controlling for the spatial effects depending on the source of correlation. The spatial correlation can be due to the common permanent characteristics of regions which are usually taken into account, including region fixed effects in the standard wage curve studies. On the other hand, if some regions are exposed to some common shocks, the spatial correlation occurs in the error terms which is known as spatial autocorrelation residuals (SAR). Buettner (1999) tests for the spatial autocorrelation in German data but could not find evidence in favor of this hypothesis. There might be a spatial correlation between wages, such that the wage level in proximate regions may have a direct effect on the level of wage in one region. This can be controlled for by including spatially lagged dependent variable in explanatory variables. Buettner (1999) finds a significant effect of spatially lagged wages in the German context. However, including spatially lagged wages slightly changes the estimates. Fingleton and Palombi (2013) point out a commonly recognized phenomenon in labor economics such that a region with high unemployment rate is usually found to be surrounded by regions with high unemployment rate or vice versa. This may imply the spatial spillovers of regional unemployment rates. Therefore, the unemployment rates of adjacent regions may have an effect on the wage level, so the omission of this may bias the estimates of unemployment elasticity of pay. Inclusion of spatially weighted unemployment rate is the easiest and most common way to take account of the spatial effects in wage curve estimations (e.g., Buettner 1999; Longhi et al. 2006; Baltagi and Rokicki 2014).
Following Longhi et al. (2006) and Baltagi and Rokicki (2014), we use the following equation to estimate spatial spillovers of unemployment rate in Turkey;
where all variables are the same as described for Equation (1) but here, we include spatially weighted local unemployment rates. The weight matrix W describes the connections among regions which is based on the contiguity of regions. That is, each row of W assigns the neighbor regions with 1 and 0 otherwise. Then each row is normalized. In other words, the average of the unemployment rate of contiguous regions is included as another explanatory variable in our wage equation. We defined two other spatial weight matrices to check the robustness of our specification. First, we checked our results against the spatial weight matrix of which each element is the inverse Euclidean distance between corresponding regions. This matrix is also row normalized. Longhi et al. (2006) speculated that the use of full distance matrix may not be ideal because regions further away may average out the positive dependence between neighboring regions. Therefore, we checked our results with a hybrid weight matrix suggested by Longhi et al. (2006) in which distance between non-contiguous regions are assumed to be infinite. In other words, the inverse Euclidean distance between contiguous regions are kept in the matrix while entries for non-contiguous regions are assumed to be zero, then the matrix is row normalized. Furthermore, we address the endogeneity of own-region unemployment and regional spatial spillovers by instrumenting them with their one-year lagged values in an FE-2SLS setting following Baltagi and Rokicki (2014). The errors in Equation (2) might be spatially autocorrelated. Also, the spatially lagged wages might have an autonomous effect on individual wages. Thus, ignoring spatially lagged wages and the spatially autocorrelated errors can introduce some bias. However, we are interested in the spatial spillover regional unemployment rate controlling for composition effects. Therefore, we use a spatially lagged regional unemployment rate in this paper.
4. Results
4.1. The Standard Turkish Wage Curve Revisited
The existing standard wage curve estimates for Turkey excludes some groups of individuals, such as workers in the agricultural sector (Baltagi et al. 2012, 2013, 2015), and workers in the public sector (Ilkkaracan et al. 2013). We present the standard wage curve estimates for the whole labor force without excluding any group of workers in Table 2 using FE-2SLS in which we take into account the endogeneity of the unemployment rates.
We present only the estimates of the unemployment elasticity of pay, β, for the sake of saving space. Table 2 shows the FE-2SLS estimations results of β for all workers as well as some subgroups. The unemployment rates used in the estimation are the regional overall unemployment rates except for column 2 in which we use non-agricultural unemployment rates. As has been mentioned, the standard errors need to be clustered for regions, because individual wages in the same region would be correlated. However, we assume that the regional unemployment rates are not independent across regions in the spatial wage curve estimates and thus clustering is not feasible. Hence, we present robust (heteroskedasticity-consistent) standard errors to be able to compare our results from the standard wage curve and the spatial wage curve. However, we checked our results clustering for regions. The results are not presented here, but available upon request. We found that the standard errors become higher and some estimates lose their significance. However, the FE-2SLS results for all workers, as well as for males and females remain same.
Column 1 of Table 2 suggests that the unemployment elasticity of pay is −0.071. In the second column, we exclude workers in the agriculture sector and use non-agricultural unemployment rate in the wage curve estimation. The FE-2SLS results for the non-agriculture sectors with non-agricultural regional unemployment rate show that the unemployment elasticity of wages is −0.107. This is very similar to the estimates that found in Baltagi et al. (2012, 2013). The overall unemployment rate for the whole population is used in the estimation of the wage curve of disaggregated samples. The FE-2SLS results show that men are more responsive to the regional unemployment rate than women are; −0.073, −0.063, respectively. This result is in line with the international evidence, in general. However, previous studies on the Turkish wage curve either find a higher unemployment elasticity for women (e.g., Baltagi et al. 2012, 2013) or no statistically significant unemployment elasticity (e.g., Ilkkaracan and Selim 2003; Konyali 2012). The first two studies use regional non-agricultural unemployment rates while the last two use regional unemployment rates. Note that these results can be attributed to the labor force characteristics of women in Turkey. The selection into wage employment for women is severe in Turkey. The female labor force participation is around 30 percent. The probability of labor force participation for women increases by education level. That is, the rate of labor force participation is the highest for women with college education. It is also found that the wages of highly educated people are less responsive to the regional unemployment rates. Hence, it is reasonable to find less elastic wage curve for the female workers.
Furthermore, we test our results for different time periods, i.e., periods 2005–2008 and 2005–2009, to be able to investigate the discrepancy between our results and previous results. Note that the wage curve indicates the cyclicality of the wages. Including time fixed effects in Equation (1), we control for the business cycle in the estimation of the wage curve. However, using data representing one segment of the business cycle will introduce a bias in the wage curve estimation. The years 2005–2008 can be characterized by a boom period of the business cycle (Ilkkaracan et al. 2013). Hence, using the data for the years 2004–2013 can take into account for the complete business cycle and eliminates this bias.
We present the unemployment elasticity of pay for the comparison periods with the overall unemployment rates as well as with non-agricultural unemployment rates in the Appendix Table A1. Panel A of Table A1 suggests that there is no evidence for a wage curve in periods 2005–2008 and 2005–2009, except one case, for the male workers in the 2005–2009 sample, when the overall unemployment rate is used. This is similar to Ilkkaracan et al. (2013) and Konyali (2012). Furthermore, Panel B of Table A1 shows the same comparison but using the non-agricultural unemployment rate. We were able to replicate the fixed effect results of Baltagi et al. (2012, 2013), such that the wage curve for women is more elastic than for men in the periods, 2005–2008 and 2005–2009. However, for the period 2004–2013, women have a lower unemployment elasticity of pay than men, −0.044, and −0.072, respectively. The FE-2SLS results are higher than fixed effects results using a non-agricultural unemployment rate. Comparing the results using the period 2005–2008 and the period 2005–2009 implies that inclusion of the crisis year 2009, at which the unemployment rate was the highest, the wage curve gets more elastic, −0.11 and −0.125, respectively. Consequently, using data for the period 2004–2013, the unemployment elasticity of pay gets closer to −0.10. This indicates that using data which covers a whole business cycle can eliminate the bias. The same patterns emerged for the disaggregated sub-samples. It is also found that female wages are more sensitive to unemployment rates in different segments of the business cycle.
In Table 2, we also present the wage curve estimates for subsamples based on age, skill, and sector disaggregation.4 In columns 5 and 6, the FE-2SLS results indicate that the young workers who are aged 15–24 have a higher elastic wage curve than workers aged 25 and older do, −0.096, and −0.065, respectively. This is an expected result, because workers who are aged 15–24 are more likely work in part-time jobs or the lower end of the job distribution. Thus, the wage of this group of workers is more fragile and sensitive to the fluctuations in the regional unemployment rates relative to those workers who are 25 years old or older. We further disaggregate our sample as workers in the public and private sector.5 The FE-2SLS results suggest that the regional unemployment rates positively affect the individual wages with an elasticity of 0.02. This confirms the expectations that workers in the public sector would not be affected by the fluctuations of regional unemployment rate due to the nationwide bargaining process. Column 8 shows that the wage curve phenomenon is more about the private sector. The unemployment elasticity of pay is −0.098 using the FE-2SLS. Furthermore, we find that the responsiveness of the real wages decreases by skill/education levels. The FE-2SLS results indicate that the less educated/low-skilled workers have a more elastic wage curve than more educated/high-skilled workers do, −0.099 and −0.02, respectively. This corroborates the conclusion of Card (1995) such that the wages of highly educated workers are less responsive to the regional unemployment rates. Appendix Table A2 shows unemployment elasticities for more disaggregated samples. It is found that temporary and less-experienced workers have more elastic wage curves than permanent and more experienced counterparts, respectively. Furthermore, the unemployment elasticity of pay is higher for those who work in the small firms than those who work in the medium-sized or large firms. The general patterns in Table 2 and Appendix Table A2 suggest that the more fragile the worker group, the more elastic the wage curve they have.
The wage curves for the disaggregated samples in Table 2 are estimated using the regional overall unemployment rate. The results show different elasticities for different groups. However, some groups of workers might be more affected by the group-specific unemployment rate rather than the overall unemployment rate (Card 1995). In other words, if the wage curve results in efficiency wage or monopsonistic competition, workers might compete for each other within a group rather than all workers, then the group-specific unemployment rate would be more appropriate. It is likely that workers compete for each other within skill groups. We test this using group-specific regional unemployment rates that are available for gender, education level, and age groups in TURKSTAT’s website. We make use of these disaggregated unemployment rates to estimate wage curves for various group of workers.
Table 3 presents wage curve estimates using group-specific regional unemployment rates of different groups; gender, skill, and age groups. These estimates should be compared to those in Table 2. The second column of Table 3 shows the unemployment elasticity of pay for women using women-specific unemployment rates. The FE-2SLS results show that there is no significant wage curve for women, unlike the highly significant elasticity of −0.063 in Table 2. The third column, on the other hand, shows that the unemployment elasticity of pay for men is very similar in Table 2 and Table 3. These findings indicate that male wages are responsive to the overall and male-specific unemployment rates by around the same magnitude. However, women’s wages are more responsive the overall unemployment rate rather than women-specific unemployment rates. In other words, the significant wage curve for females in Table 2 might result in the different elasticity of female unemployment rate to the overall unemployment rather than the unemployment elasticity of pay.
Columns 4 and 5 show wage curve estimates for workers disaggregated by age using age group-specific regional unemployment rates. The FE-2SLS results indicate that unemployment elasticity of real wages is −0.131 for workers who are aged 15–24, and −0.054 for workers who are aged 25 and above. Comparison of these results with those found in Table 2 indicates that wages young workers are even more sensitive to the youth unemployment rates whereas wages of workers who are 25 years old or older are less sensitive to their group specific unemployment rate. These findings suggest that the use of overall unemployment rate relatively masks the real relationship between wages of younger workers and unemployment rate.
Next, we present, the wage curve estimates for the workers disaggregated by three skill levels using group-specific regional unemployment rates in the last three columns of Table 3. Ilkkaracan et al. (2013) used regional unemployment rates disaggregated by three education/skill level to estimate the wage curve of females and males in the private sector. However, they did not provide wage curve estimates for the skill subsamples. The FE-2SLS estimations result in unemployment elasticities for low-skilled, medium skilled, and high-skilled workers with the magnitudes, −0.054, −0.094, and −0.076, respectively. Comparing wage curve estimates for skill subsamples in Table 2 and Table 3 suggests different conclusions. The wages of the low-skilled workers have the highest responsiveness to the regional overall unemployment rate in Table 2, whereas the high-skilled workers are the least responsive group. However, the FE-2SLS results in Table 3 indicate that the slope of the wage curve is the steepest for the medium-skilled workers. Also, the wages of high-skilled workers are more responsive to the group-specific unemployment rates than that of low-skilled workers. These findings confirm the expectations that the workers are more likely compete within the skill groups. Also, they indicate that the use of the regional overall unemployment rate instead of skill-specific unemployment rates masks the true relationship between unemployment rate and real wages to some extent.
Overall, we find that the wage curve estimates are sensitive to the exclusion of some groups that was the case in the existing wage curve estimates for Turkey. Moreover, the wage curve for Turkey is about −0.07. This corroborates the finding of Nijkamp and Poot (2005) rather than the elasticity of −0.10 that is found in Blanchflower and Oswald (1990, 1994) and other studies. Our findings also corroborate the findings that wages of the more fragile worker groups are more responsive to the fluctuation in regional unemployment rates (e.g., Card 1995; Baltagi et al. 2012, 2013). Furthermore, the use of group-specific unemployment rates in estimation of the wage curves for disaggregated samples suggests that the use of the regional overall unemployment rates might mask the true relationship between wages and unemployment rates of certain groups.
4.2. The Spatial Turkish Wage Curve
The wage curve estimations in which spatially weighted unemployment rate is included as an independent variable are presented in Table 4 and Table 5. We report only unemployment elasticity of pay, β, and spatial spillover unemployment elasticity of real wages, . The standard errors are robust (heteroskedasticity-consistent) standard errors.
Table 4 presents the FE-2SLS estimation results of Equation (2) using the row-normalized contiguity matrix as the spatial weight matrix. Moreover, we take into account the endogeneity of regional unemployment rate and spatially weighted unemployment rate. We use the FE-2SLS method using one-year lagged values of unemployment variables as instruments. The FE-2SLS results show that own-region unemployment elasticity of pay for is −0.056, and spatial spillovers of unemployment elasticity to contiguous regions is −0.087. These results indicate that unemployment rate of contiguous regions has a significant effect on individual wages. This effect is higher than the effect of the own-region unemployment rate on real hourly wages. Comparing FE-2SLS results for the unemployment elasticity of real wages in Table 2 and Table 4, we find that ignoring the spatially weighted unemployment rate introduces a downward bias, such that inclusion of spatially weighted unemployment rate lowers the unemployment elasticity in absolute terms. These findings are in line with Baltagi and Rokicki (2014) for Poland, and Fingleton and Palombi (2013) for the UK. The higher effects of contiguous regions’ unemployment rates might indicate the monopsonistic competition explanation of the wage curve. That is, employers determine the wage offers considering unemployment conditions in the local labor market as well as the adjacent regions’ unemployment rates. In the second column, we estimate the spatial wage curve using the non-agricultural unemployment rate and excluding the workers in the agriculture sector in order to compare our results with those found in Baltagi et al. (2015). The FE-2SLS results show that the wage elasticity with respect to own-region unemployment is higher than spatial spillover unemployment elasticity with magnitudes of −0.084 and −0.162, respectively. The FE-2SLS results of Baltagi et al. (2015) show that the wage elasticity with respect to the local unemployment rate is higher than the spatial spillover unemployment elasticity of the proximate regions. This is contradictory to our results. However, our findings are in line with their estimations, using full inverse distance matrix as a spatial weight matrix. Note that our results are based on the contiguity matrix, and our data covers one additional year, whereas Baltagi et al. (2015) define spatial weight matrix as a function of the inverse distance.
Moreover, columns 3 and 4 present wage elasticities with respect to own-region and contiguous region unemployment rates for females and males, respectively. The FE-2SLS results suggest that wage elasticity with respect to own-region unemployment is −0.051, and elasticity with respect to contiguous region unemployment rate is −0.118 for females. In addition, the unemployment elasticity of pay for males is −0.058 and the spatial spillover unemployment elasticity of adjacent regions is −0.087. These results suggest that the wage elasticity of own-region unemployment for males is slightly higher than females. However, the effect of neighboring regions’ unemployment on real wages of females is larger than that of males. These results are similar to Baltagi and Rokicki (2014) for the Polish case. The higher spatial spillover unemployment elasticity of pay for females might indicate that the wages of the women workers are affected by unemployment rates in a wider labor market. This is also related to the low labor force participation of women and their probability of participation in wage employment is the highest among college graduates. Moreover, most of the college graduates work in public sector jobs. That is, there is a higher percentage of women with college degrees working in the public sector. Moreover, the wages in the public sector are subject to a collective bargaining and are affected by the nationwide unemployment rate, as has shown in Table 2. Therefore, it is reasonable that the wages of females are more responsive to the contiguous regions unemployment rate.
Furthermore, we present the results for several disaggregated samples in Table 4. There are statistically significant spatial spillover effects for all groups. The elasticities for further disaggregated worker groups are presented in Appendix Table A3. We find statistically significant unemployment elasticities for all groups. Also, there is spatial spillover for unemployment elasticity of proximate regions for all groups except for workers who work in large firms.
It is found that workers aged 15–24 are more sensitive to adjacent regions’ unemployment rates than own-region unemployment rates with elasticities of −0.143 and −0.067, respectively. Both of these elasticities are higher than those found for workers aged 25 and older. It suggests that youth wages are depressed by the local and neighboring regions’ unemployment rate to a higher degree.
These findings reveal some interesting results. First, the workers in the public sector are negatively responsive to the unemployment rate in the neighboring regions and positively responsive to the local unemployment rate. Card (1995) points out that public sector wages are expected to be insensitive to the regional unemployment rate. However, the FE-2SLS results show that there is a positive effect of the local unemployment rate. This might result in the fact that the public sector jobs in less-developed regions of Turkey are paid compensating wage premiums (Ilkkaracan et al. 2013). On the other hand, we find that the public sector wages are negatively affected by the proximate regions’ unemployment rates. Since public sector wages are determined by collective bargaining, it is expected that the wages in public sector are affected negatively by the aggregate unemployment rates. Second, we find that the private sector wages are more sensitive to the own-region unemployment rate than those of surrounding regions. These results seem surprising. Note that the spatial spillovers are found to be higher than own-region unemployment elasticity of pay in the FE-2SLS estimations for all groups except private sector workers. This confirms our interpretations for the public workers. Recall that all subsamples include public sector workers, so the effect of the aggregate unemployment rate on public wages might magnify the spillover effect of the unemployment rate.
Furthermore, the FE-2SLS results for the skill groups indicate that hourly wages are sensitive to the proximate regions’ unemployment rate more than own region’s unemployment rate. Results show that the low-skilled workers are the most sensitive skill group to the local unemployment rate and surrounding regions’ unemployment rates with elasticities of −0.075 and −0.132, respectively. Both elasticities get lower by skill level. Unemployment elasticity of real wages is not significant for high-skilled workers while the spatial spillover effect is significant, −0.067. In other words, high-skilled workers are more sensitive to the employment conditions of proximate regions than that of their own region. Again, this might be related to the interpretations about public workers, since a high percentage of high-skilled workers are in the public sector.
Appendix Table A3 present the FE-2SLS results for further disaggregated samples. Results indicate that the spatial spillover unemployment elasticities are higher than own-region unemployment elasticities except for those who works in large firms. Workers with low tenure have higher unemployment elasticity of earnings and spatial spillover effects. Workers in small firms have higher unemployment elasticity of pay and spatial spillover elasticity, in absolute value, than workers in medium or large size firms with fixed effects estimation. The FE-2SLS results suggest that there is no significant spatial spillover unemployment elasticity for workers in the large firms. These results show that workers in large firms are only affected by own region employment conditions, whereas workers in medium-size firms are the most affected group by unemployment rate in neighboring regions. We also find that temporary workers have the highest spatial spillover elasticity of −0.221, among all groups. However, there is no significant own-region unemployment elasticity for this group of workers.
Furthermore, Table 5 presents the FE-2SLS estimates of the unemployment elasticity of pay and spatial spillover unemployment elasticity using group-specific unemployment rates. The FE-2SLS results indicate that there are no significant wage elasticities with respect to own-region and adjacent regions’ unemployment rates for the women workers. Note that the effect of own-region women-specific unemployment rate on the wages of females is similar to that found in Table 3. This can be attributable to the selection into wage employment problem that females face and the lack of spillover effects for the high-skilled workers. These suggest that the significant effects in Table 4 might be driven by the elasticity of female-specific unemployment rate with respect to the overall regional unemployment rate. However, there is significant male wage elasticity with respect to own-region and the neighboring regions’ male-specific unemployment rates with magnitudes of −0.056 and −0.061, respectively.
Columns 4 and 5 show that the spatial spillover effects are higher than own-region unemployment effects for the age groups using group-specific unemployment rates. The FE-2SLS results show that wages of young workers are more responsive to the own-region unemployment rate and contiguous regions’ unemployment rate than their counterparts who are aged 25 and above. The FE-2SLS results are of similar to those found in Table 4.
The last three columns of Table 5 present the elasticities for the skill groups using group-specific unemployment rates. The FE-2SLS results show that, among skill groups, the highest wage elasticities with respect to own-region and proximate regions’ unemployment rates are found for the medium-skilled workers with magnitudes of −0.07 and −0.12, respectively. Moreover, the low-skilled workers are similarly less sensitive to the own-region unemployment rate than that of contiguous regions with elasticities of −0.039 and −0.093, respectively. However, there is no significant spatial spillovers for unemployment elasticity for high-skilled workers. These results indicate that the slope of wage curve and spatial spillovers for the skill groups are sensitive to the use of skill-specific unemployment rates. Assuming that the wage curve results in efficient wages, the wage curve estimates using an overall regional unemployment rate may mask the true relationship.
Overall, we provide evidence that the spatially lagged regional unemployment rate has a significant effect on real wages. We find that the spatial spillover effects are higher than own region’s unemployment rate effect for disaggregated samples. However, this should be taken with caution since the subgroups include public workers and the public sector wages are mainly affected by aggregate unemployment rate rather than regional unemployment rates. Moreover, we show that the slope of wage curve and spatial spillovers are sensitive to the use of group-specific unemployment rate, especially for females. Thus, using the overall regional unemployment rates in the estimation of wage curve for disaggregated samples may mask the true variation in the slope of the wage curve and spatial spillovers.
4.3. Robustness Check for the Spatial Weight Matrix
Having shown significant spatial spillover unemployment rates, we check our result against two other spatial weight matrices. First, we use spatial weight matrix based on the inverse distance between regions that is described in Section 3. The results are presented in Appendix Table A4.
Longhi et al. (2006) pointed out that using full inverse distances between regions may average out the positive spatial dependence between contiguous regions. We compare results in Table A4 with those in Table 4. The FE-2SLS result of own region’s unemployment rate is of higher magnitude using full inverse distance matrix than that found in Table 4. The spatial spillovers become either positive or statistically nonsignificant, except for the public sector workers and medium-skilled workers. The wage elasticity with respect to adjacent regions for the public workers is −0.30. Note that here we take into account spatial correlation among all regions. Thus, this might corroborate our explanation for the public sector workers such that their wages are responsive to the aggregate unemployment rate rather than the regional unemployment rate. The results in Appendix Table A4 confirm the conjecture that is raised by Longhi et al. (2006).
Second, having found spatial spillovers does not matter that much if we use full inverse distance spatial weight matrix, we check our results against a hybrid spatial weight matrix following Longhi et al. (2006). This spatial matrix is also described in Section 3. The wage elasticities with respect to own region’s and proximate regions’ unemployment rate are presented in Table A5. The results are compared with those results in Table 4. We find that own-region unemployment elasticity is −0.053 and spatial spillover is −0.096 for all workers with hybrid spatial weight matrix. These are slightly higher than those found using contiguity matrix. Results are hardly changed in Table A5 compared to Table 4.
Based on our different weight specifications, we can conclude that spatial spillovers of the unemployment rate in contiguous regions matter. This effect is greater than the effect of own-region unemployment rates on real wages. However, using the full inverse distance matrix wipes out this effect as it has been mentioned in Longhi et al. (2006).
5. Conclusions
In this paper, we reexamined the Turkish wage curve considering the endogeneity problem, spatial dependence, and effect of group-specific regional unemployment rates. The data used in this study comes from the THLFS of TURKSTAT over 26 NUTS-2 regions for the period 2004–2013. Unlike the previous literature on the Turkish wage curve, we did not exclude any group of workers in our estimations. Thus, our results draw a broader picture on the wage curve estimates in Turkey. Using the lagged value of unemployment rate as an instrument for the current unemployment rate in FE-2SLS estimation, we find that unemployment elasticity of pay is −0.071 for all workers in Turkey.
Furthermore, disaggregated wage curves indicate that male workers have a more elastic wage curve than female workers with elasticities of −0.073 and −0.063, respectively. We showed that the slope of the wage curve is steeper for the fragile groups of workers than their counterparts. The use of data representing the whole business cycle is found to be important in estimating the wage curve. Unlike the previous literature in the Turkish wage curve in which nonsignificant or more elastic wage curves for women have been shown, we found that Turkish women have a less elastic wage curve which is in line with the majority of international literature.
Moreover, we reconsidered responsiveness of wages of various groups to their group-specific regional unemployment rates rather than overall regional unemployment rates. We found that the use of group-specific unemployment rates has very subtle changes in the wage curve for males, whereas unemployment elasticity of pay for women becomes very small and loses its significance. These results suggest that the wage curve for females should be taken with caution when the overall unemployment rate is used. Because the group-specific unemployment elasticity with respect to overall regional unemployment rate may mask the true relationship between hourly wages and the unemployment rate. Moreover, we tested the slopes of wage curves using skill-specific unemployment rates. We showed that medium-skilled workers have the highest unemployment elasticity. In addition, it is found that low-skilled workers have the lowest elasticity which is a different conclusion than it is with the overall regional unemployment rate.
The effect of the spatial dependence of local labor markets on wage curve estimates has been addressed by introducing a spatially weighted regional unemployment rate as an additional explanatory variable. Instrumenting unemployment rates and spatially weighted unemployment rates with their one-year-lagged values in the FE-2SLS estimation, we found that own-region unemployment elasticity of real wage is −0.056, and spatial spillover unemployment elasticity of pay is −0.087 for all workers. This shows that individual wages are more sensitive to the employment conditions in contiguous regions than in their own region, and ignoring spatial spillovers of unemployment rates biases the wage curve estimates. This might be considered evidence for the monopsonistic competition explanation of the wage curve. We found that wages of females are more sensitive to the unemployment rate of contiguous regions than wages of males with magnitudes, −0.118 and −0.081, respectively. Moreover, our findings showed that there is a positive spatial spillover effect of the proximate regions’ unemployment rates for the public sector workers. This indicates that the wages in the public sector are responsive to the aggregate unemployment rate rather than the regional unemployment rate.
Furthermore, we estimated wage curve using group-specific unemployment rate and including spatially weighted group-specific unemployment rates. The FE-2SLS results suggest that there are no significant wage elasticities with respect to own-region and contiguous regions’ unemployment rates for females. Moreover, there are no spatial spillover effects for high-skilled workers. The highest elasticities with respect to own-region and adjacent regions’ unemployment rates are found for medium-skilled workers among skill groups. Also, workers who are aged 15–24 are more responsive to the unemployment in their own region and proximate regions than those who are 25 years old or older.
Overall, we estimated the spatial wage curve including spatially lagged unemployment rates. We found strong evidence for the spatial spillover of unemployment rates on individual wages. In addition, the use of group-specific unemployment rates changes the corresponding slopes of wage curves. Also, there is evidence on the difference between spatial spillover effects for the public and private sector workers. These findings can be considered as evidence for the efficiency wage curve, labor turnover cost, or monopsonistic competition hypotheses of the wage curve. However, the possibility of spatially correlated errors and the autonomous effect of spatially lagged wages could introduce bias in some degree. Thus, further research is required to examine these issues.
Acknowledgments
The author would like to thank Badi H. Baltagi, the anonymous reviewers, and the participants at the 10th Annual Conference of SEA for their valuable comments.
Conflicts of Interest
The author declares no conflict of interest.
Appendix A

Table A1.
Comparison of different time periods for overall unemployment elasticity of pay.
| 2004–2013 | 2005–2008 | 2005–2009 | |||||||
|---|---|---|---|---|---|---|---|---|---|
| All | Female | Male | All | Female | Male | All | Female | Male | |
| Panel A: Overall Unemployment Rate | |||||||||
| Fixed Effects | |||||||||
| β | −0.048 *** | −0.031 *** | −0.054 *** | 0.012 | 0.006 | 0.011 | −0.010 | −0.007 | −0.014 * |
| (0.003) | (0.008) | (0.004) | (0.008) | (0.019) | (0.009) | (0.007) | (0.016) | (0.008) | |
| Obs. | 821,166 | 192,721 | 628,445 | 302,225 | 67,189 | 235,036 | 380,047 | 85,322 | 294,725 |
| 0.63 | 0.68 | 0.62 | 0.62 | 0.67 | 0.61 | 0.63 | 0.67 | 0.61 | |
| FE−2SLS | |||||||||
| β | −0.071 *** | −0.063 *** | −0.073 *** | −0.009 | −0.011 | −0.008 | −0.014 | −0.029 | −0.012 |
| (0.007) | (0.014) | (0.008) | (0.018) | (0.044) | (0.020) | (0.015) | (0.034) | (0.017) | |
| Obs. | 752,634 | 178,531 | 574,103 | 302,225 | 67,189 | 235,036 | 380,047 | 85,322 | 294,725 |
| 0.64 | 0.69 | 0.63 | 0.62 | 0.67 | 0.61 | 0.63 | 0.67 | 0.61 | |
| Panel B: non-agricultural unemployment rate | |||||||||
| Fixed Effects | |||||||||
| β | −0.067 *** | −0.044 *** | −0.074 *** | −0.022 ** | −0.048 ** | −0.019 * | −0.042 *** | −0.051 *** | −0.043 *** |
| (0.004) | (0.009) | (0.004) | (0.010) | (0.022) | (0.011) | (0.008) | (0.017) | (0.009) | |
| Obs. | 795,563 | 184,141 | 611,422 | 292,086 | 63,663 | 228,423 | 367,726 | 81,055 | 286,671 |
| 0.63 | 0.68 | 0.62 | 0.61 | 0.66 | 0.61 | 0.62 | 0.67 | 0.61 | |
| FE-2SLS | |||||||||
| β | −0.107 *** | −0.086 *** | −0.111 *** | −0.113 *** | −0.221 *** | −0.089 *** | −0.125 *** | −0.186 *** | −0.110 *** |
| (0.008) | (0.015) | (0.009) | (0.022) | (0.054) | (0.024) | (0.019) | (0.040) | (0.021) | |
| Obs. | 729,761 | 170,878 | 558,883 | 292,086 | 63,663 | 228,423 | 367,726 | 81,055 | 286,671 |
| 0.64 | 0.69 | 0.63 | 0.61 | 0.66 | 0.61 | 0.62 | 0.67 | 0.61 | |
Notes: Robust standard errors in parentheses *** p < 0.01, ** p < 0.05, * p < 0.1. All regressions include age, age square, tenure at the firm and its square, and dummy variables for gender, marital status, 6 education levels, ongoing education and if attendance to it required, formality, permanency, urban, extra job, part-time, private sector, 4 firm sizes, 9 occupations, and 10 industry categories as well as time and region (26 NUTS2 level) fixed effects. All regressions are weighted by the sampling weight provided in THLFS.
Table A2.
Unemployment elasticity of pay for disaggregated samples—(FE-2SLS).
| Low Tenure | High Tenure | Small Firm | Medium Firm | Large Firm | Temporary Work | Permanent Work | |
|---|---|---|---|---|---|---|---|
| β | −0.091 *** | −0.045 *** | −0.116 *** | −0.057 *** | −0.039 *** | −0.086 *** | −0.070 *** |
| (0.009) | (0.010) | (0.012) | (0.011) | (0.010) | (0.024) | (0.007) | |
| Obs. | 487,886 | 264,748 | 254,260 | 225,994 | 272,380 | 74,607 | 678,027 |
| 0.56 | 0.66 | 0.44 | 0.65 | 0.64 | 0.33 | 0.66 |
Notes: Robust standard errors in parentheses *** p < 0.01, ** p < 0.05, * p < 0.1. All regressions include age, age square, tenure at the firm and its square, and dummy variables for gender, marital status, 6 education levels, ongoing education and if attendance to it required, formality, permanency, urban, extra job, part-time, private sector, 4 firm sizes, 9 occupations, and 10 industry categories as well as time and region (26 NUTS2 level) fixed effects. All regressions are weighted by the sampling weight provided in THLFS. Low (high) tenure refers those workers who have less (more) than the average year of tenure in the current job. Small, Medium, and Large Firm refers those workers who work in a firm which has less than 10 workers, between 10–49 workers, and more than 49 workers, respectively.
Table A3.
Unemployment elasticity of pay with spatial spillovers for disaggregated samples —contiguity weighted—(FE-2SLS).
Table A3.
Unemployment elasticity of pay with spatial spillovers for disaggregated samples —contiguity weighted—(FE-2SLS).
| Low Tenure | High Tenure | Small Firm | Medium Firm | Large Firm | Temporary Work | Permanent Work | |
|---|---|---|---|---|---|---|---|
| β | −0.072 *** | −0.037 *** | −0.096 *** | −0.028 ** | −0.041 *** | −0.024 | −0.059 *** |
| (0.010) | (0.011) | (0.015) | (0.013) | (0.012) | (0.032) | (0.008) | |
| γ | −0.119 *** | −0.043 * | −0.106 *** | −0.163 *** | 0.008 | −0.221 *** | −0.070 *** |
| (0.020) | (0.023) | (0.028) | (0.026) | (0.022) | (0.056) | (0.015) | |
| Obs. | 487,886 | 264,748 | 254,260 | 225,994 | 272,380 | 74,607 | 678,027 |
| 0.56 | 0.66 | 0.44 | 0.65 | 0.64 | 0.32 | 0.66 |
Notes: Robust standard errors in parentheses *** p < 0.01, ** p < 0.05, * p < 0.1. All regressions include age, age square, tenure at the firm and its square, and dummy variables for gender, marital status, 6 education levels, ongoing education and if attendance to it required, formality, permanency, urban, extra job, part-time, private sector, 4 firm sizes, 9 occupations, and 10 industry categories as well as time and region (26 NUTS2 level) fixed effects. All regressions are weighted by the sampling weight provided in THLFS. Low (high) tenure refers those workers who have less (more) than the average year of tenure in the current job. Small, Medium, and Large Firm refers those workers who work in a firm which has less than 10 workers, between 10–49 workers, and more than 49 workers, respectively.
Table A4.
Unemployment elasticity of pay with spatial spillovers—full inverse distance weighted—(FE-2SLS).
Table A4.
Unemployment elasticity of pay with spatial spillovers—full inverse distance weighted—(FE-2SLS).
| All | All-NAUE | Female | Male | Public | Private | Low-Skilled | Medium-Skilled | High-Skilled | |
|---|---|---|---|---|---|---|---|---|---|
| β | −0.071 *** | −0.109 *** | −0.064 *** | −0.073 *** | 0.030 *** | −0.099 *** | −0.100 *** | −0.049 *** | −0.021 |
| (0.007) | (0.007) | (0.014) | (0.008) | (0.010) | (0.008) | (0.010) | (0.012) | (0.013) | |
| γ | −0.015 | −0.063 | −0.049 | −0.044 | −0.300 *** | 0.210 *** | 0.102 | −0.237 *** | −0.103 |
| (0.047) | (0.064) | (0.113) | (0.052) | (0.063) | (0.063) | (0.069) | (0.082) | (0.097) | |
| Obs. | 752,634 | 729,761 | 178,531 | 574,103 | 195,253 | 557,381 | 371,572 | 194,271 | 176,084 |
| 0.64 | 0.64 | 0.69 | 0.63 | 0.57 | 0.51 | 0.42 | 0.55 | 0.51 |
Notes: Robust standard errors in parentheses *** p < 0.01, ** p < 0.05, * p < 0.1. All regressions include age, age square, tenure at the firm and its square, and dummy variables for gender, marital status, 6 education levels, ongoing education and if attendance to it required, formality, permanency, urban, extra job, part-time, private sector, 4 firm sizes, 9 occupations, and 10 industry categories as well as time and region (26 NUTS2 level) fixed effects. All regressions are weighted by the sampling weight provided in THLFS. Low-skilled refers to those have less than high school education; medium-skilled refers to those have high school education; and, high-skilled refers to those have more than high school education.
Table A5.
Unemployment elasticity of pay with spatial spillovers—contiguous inverse distance (hybrid) weighted—(FE-2SLS).
Table A5.
Unemployment elasticity of pay with spatial spillovers—contiguous inverse distance (hybrid) weighted—(FE-2SLS).
| All | All-NAUE | Female | Male | Public | Private | Low-Skilled | Medium-Skilled | High-Skilled | |
|---|---|---|---|---|---|---|---|---|---|
| β | −0.053 *** | −0.086 *** | −0.050 *** | −0.054 *** | 0.042 *** | −0.084 *** | −0.071 *** | −0.036 ** | −0.012 |
| (0.008) | (0.009) | (0.015) | (0.009) | (0.012) | (0.010) | (0.012) | (0.014) | (0.015) | |
| γ | −0.096 *** | −0.153 *** | −0.114 *** | −0.094 *** | −0.090 *** | −0.092 *** | −0.146 *** | −0.090 *** | −0.063 ** |
| (0.015) | (0.022) | (0.030) | (0.017) | (0.022) | (0.018) | (0.022) | (0.025) | (0.030) | |
| Obs. | 752,634 | 729,761 | 178,531 | 574,103 | 195,253 | 557,381 | 371,572 | 194,271 | 176,084 |
| 0.64 | 0.64 | 0.69 | 0.63 | 0.57 | 0.51 | 0.42 | 0.55 | 0.51 |
Notes: Robust standard errors in parentheses *** p < 0.01, ** p < 0.05, * p < 0.1. All regressions include age, age square, tenure at the firm and its square, and dummy variables for gender, marital status, 6 education levels, ongoing education and if attendance to it required, formality, permanency, urban, extra job, part-time, private sector, 4 firm sizes, 9 occupations, and 10 industry categories as well as time and region (26 NUTS2 level) fixed effects. All regressions are weighted by the sampling weight provided in THLFS. Low-skilled refers to those have less than high school education; medium-skilled refers to those have high school education; and, high-skilled refers to those have more than high school education.
References
- Baltagi, Badi H., and Uwe Blienb. 1998. The German wage curve: Evidence from the IAB employment sample. Economics Letters 61: 135–42. [Google Scholar] [CrossRef]
- Baltagi, Badi H., and Bartlomiej Rokicki. 2014. The spatial Polish wage curve with gender effects: Evidence from the polish labor survey. Regional Science and Urban Economics 49: 36–47. [Google Scholar] [CrossRef]
- Baltagi, Badi H., Yusuf Soner Baskaya, and Timur Hulagu. 2012. The Turkish wage curve: Evidence from the household labor force survey. Economics Letters 114: 128–31. [Google Scholar] [CrossRef]
- Baltagi, Badi H., Yusuf Soner Baskaya, and Timur Hulagu. 2013. How different are the wage curves for formal and informal workers? Evidence from Turkey. Papers in Regional Science 92: 271–83. [Google Scholar] [CrossRef]
- Baltagi, Badi H., Yusuf Soner Başkaya, and Selcuk Gul. 2015. Do spatial wage curves differ along the formality-informality divide? Evidence from Turkey. Unpublished Working Paper. Ankara, Turkey: Central Bank of the Republic of Turkey. [Google Scholar]
- Bhaskar, V., and Ted To. 1999. Minimum wages for Ronald McDonald monopsonies: A theory of monopsonistic competition. The Economic Journal 109: 190–203. [Google Scholar] [CrossRef]
- Blanchflower, David G., and Andrew J. Oswald. 1990. The wage curve. Scandinavian Journal of Economics 92: 215–35. [Google Scholar] [CrossRef]
- Blanchflower, David G., and Andrew J. Oswald. 1994. The Wage Curve. Cambridge: MIT Press Books. [Google Scholar]
- Blanchflower, David G., and Andrew J. Oswald. 2005. The wage curve reloaded. National Bureau of Economic Research Working Paper, No. 11338. Cambridge, MA, USA. [Google Scholar]
- Boushey, Heather. 2005. Reworking the wage curve: Exploring the consistency of the model across time, space and demographic group. Review of Political Economy 14: 293–311. [Google Scholar] [CrossRef]
- Buettner, Thiess. 1999. The effect of unemployment, aggregate wages, and spatial contiguity on local wages: An investigation with German district level data. Papers in Regional Science 78: 47–67. [Google Scholar] [CrossRef]
- Card, David. 1995. The wage curve: A review. Journal of Economic Literature 33: 285–99. [Google Scholar]
- Elhorst, J. Paul, Uwe Blien, and Katja Wolf. 2007. New evidence on the wage curve: A spatial panel approach. International Regional Science Review 30: 173–91. [Google Scholar] [CrossRef]
- Fingleton, Bernard, and Silvia Palombi. 2013. The wage curve reconsidered: Is it truly an ‘Empirical law of economics’. Région et Développement 38: 49–92. [Google Scholar]
- Ilkkaracan, Ipek, and Raziye Selim. 2003. The role of unemployment in wage determination: Further evidence on the wage curve from Turkey. Applied Economics 35: 1589–98. [Google Scholar] [CrossRef]
- Ilkkaracan, Ipek, Haluk Levent, and Sezgin Polat. 2013. Exploring different measures of wage flexibility in a developing economy context: The case for Turkey. International Review of Applied Economics 27: 297–315. [Google Scholar] [CrossRef]
- Konyali, Gonca. 2012. Wage curve evidence from Turkey’s 2007–2009 income and living conditions survey. Investigaciones Regionales 24: 199–210. [Google Scholar]
- Longhi, Simonetta, Peter Nijkamp, and Jacques Poot. 2006. Spatial heterogeneity and the wage curve revisited. Journal of Regional Science 46: 707–31. [Google Scholar] [CrossRef]
- Morrison, Philip S., Kerry L. Papps, and Jacques Poot. 2006. Wages, employment, labour turnover and the accessibility of local labour markets. Labour Economics 13: 639–63. [Google Scholar] [CrossRef]
- Nijkamp, Peter, and Jacques Poot. 2005. The last word on the wage curve? Journal of Economic Surveys 19: 421–50. [Google Scholar] [CrossRef]
- Ramos, Raul, Catia Nicodemo, and Esteve Sanromá. 2015. A spatial panel wage curve for Spain. Letters in Spatial and Resource Sciences 8: 125–39. [Google Scholar] [CrossRef]
| 1 | The first working paper version of this present paper and working paper version of Baltagi, Baskaya, and Gul (Baltagi et al. 2015) are circulated around the same time, without knowing each other’s work. However, both papers investigate spatial wage curve in Turkey, Baltagi et al. (2015) focus on the differences in the wage curves between informal and formal workers with only regional non-agricultural unemployment rates. On the other hand, the present paper depicts a broad picture in Turkish wage curve using regional overall and group-specific unemployment rates. The spatial weight matrices and time period also differ. |
| 2 | “Unskilled” refers to those individuals who are illiterate. “Low-skilled” refers to those who are literate but do not hold any diploma, primary school graduates, and middle school graduates. “Medium-skilled” refers to those who are general high school or vocational high school graduates. “High-skilled” refers to those who are college graduates. |
| 3 | Firm size is defined in four categories; firms with less than 10 workers, firms with 10–24 workers, firms with 25–49 workers, and firms with more than 49 workers. Occupation is categorized in 9 groups based on the ISCO-08 classification. Industry is categorized in 10 groups based on the NACE-Rev 2 classification. |
| 4 | All differences are statistically significant across groups that are considered in tables in main text as well as appendix tables. |
| 5 | The information about whether an individual work in public or private sector or “other” is available in THLFS since 2009. However, following Ilkkaracan et al. (2013), a dummy variable defining the sector of job can be created using “Q35: Type of the workplace” for observations before 2009 surveys, since it is asked only those working in private sector (if Q34 = 1). Therefore, the missing values in Q35 for the employed individuals indicate that individual works in public sector or “other”. We assume that employed individuals who are not in private sector, are in public sector. Because there is no way to distinguish between public and “other” for the surveys before 2009, and “other” sector represent only 0.65% of the employed observations in 2009–2013 period. |
Figure 1.
Spatial distributions of overall and group-specific Unemployment Rates (UE) in year 2008. (a) Spatial distribution of overall UE; (b) Spatial distribution of UE in which agriculture sector is excluded; (c,d) Spatial distributions of male and female-specific UE, respectively; (e,f) Spatial distributions of for young (15–24 years old) UE and older (25 years old and older) UE, respectively.

Figure 2.
Spatial distributions of skill group-specific Unemployment Rates (UE) in year 2008. (a) Spatial distribution of unskilled (illiterate) UE; (b) Spatial distribution of low-skilled (less than high-school education) UE; (c) Spatial distribution of medium-skilled (high school graduates) UE; (d) Spatial distribution of high-skilled (college graduates) UE.
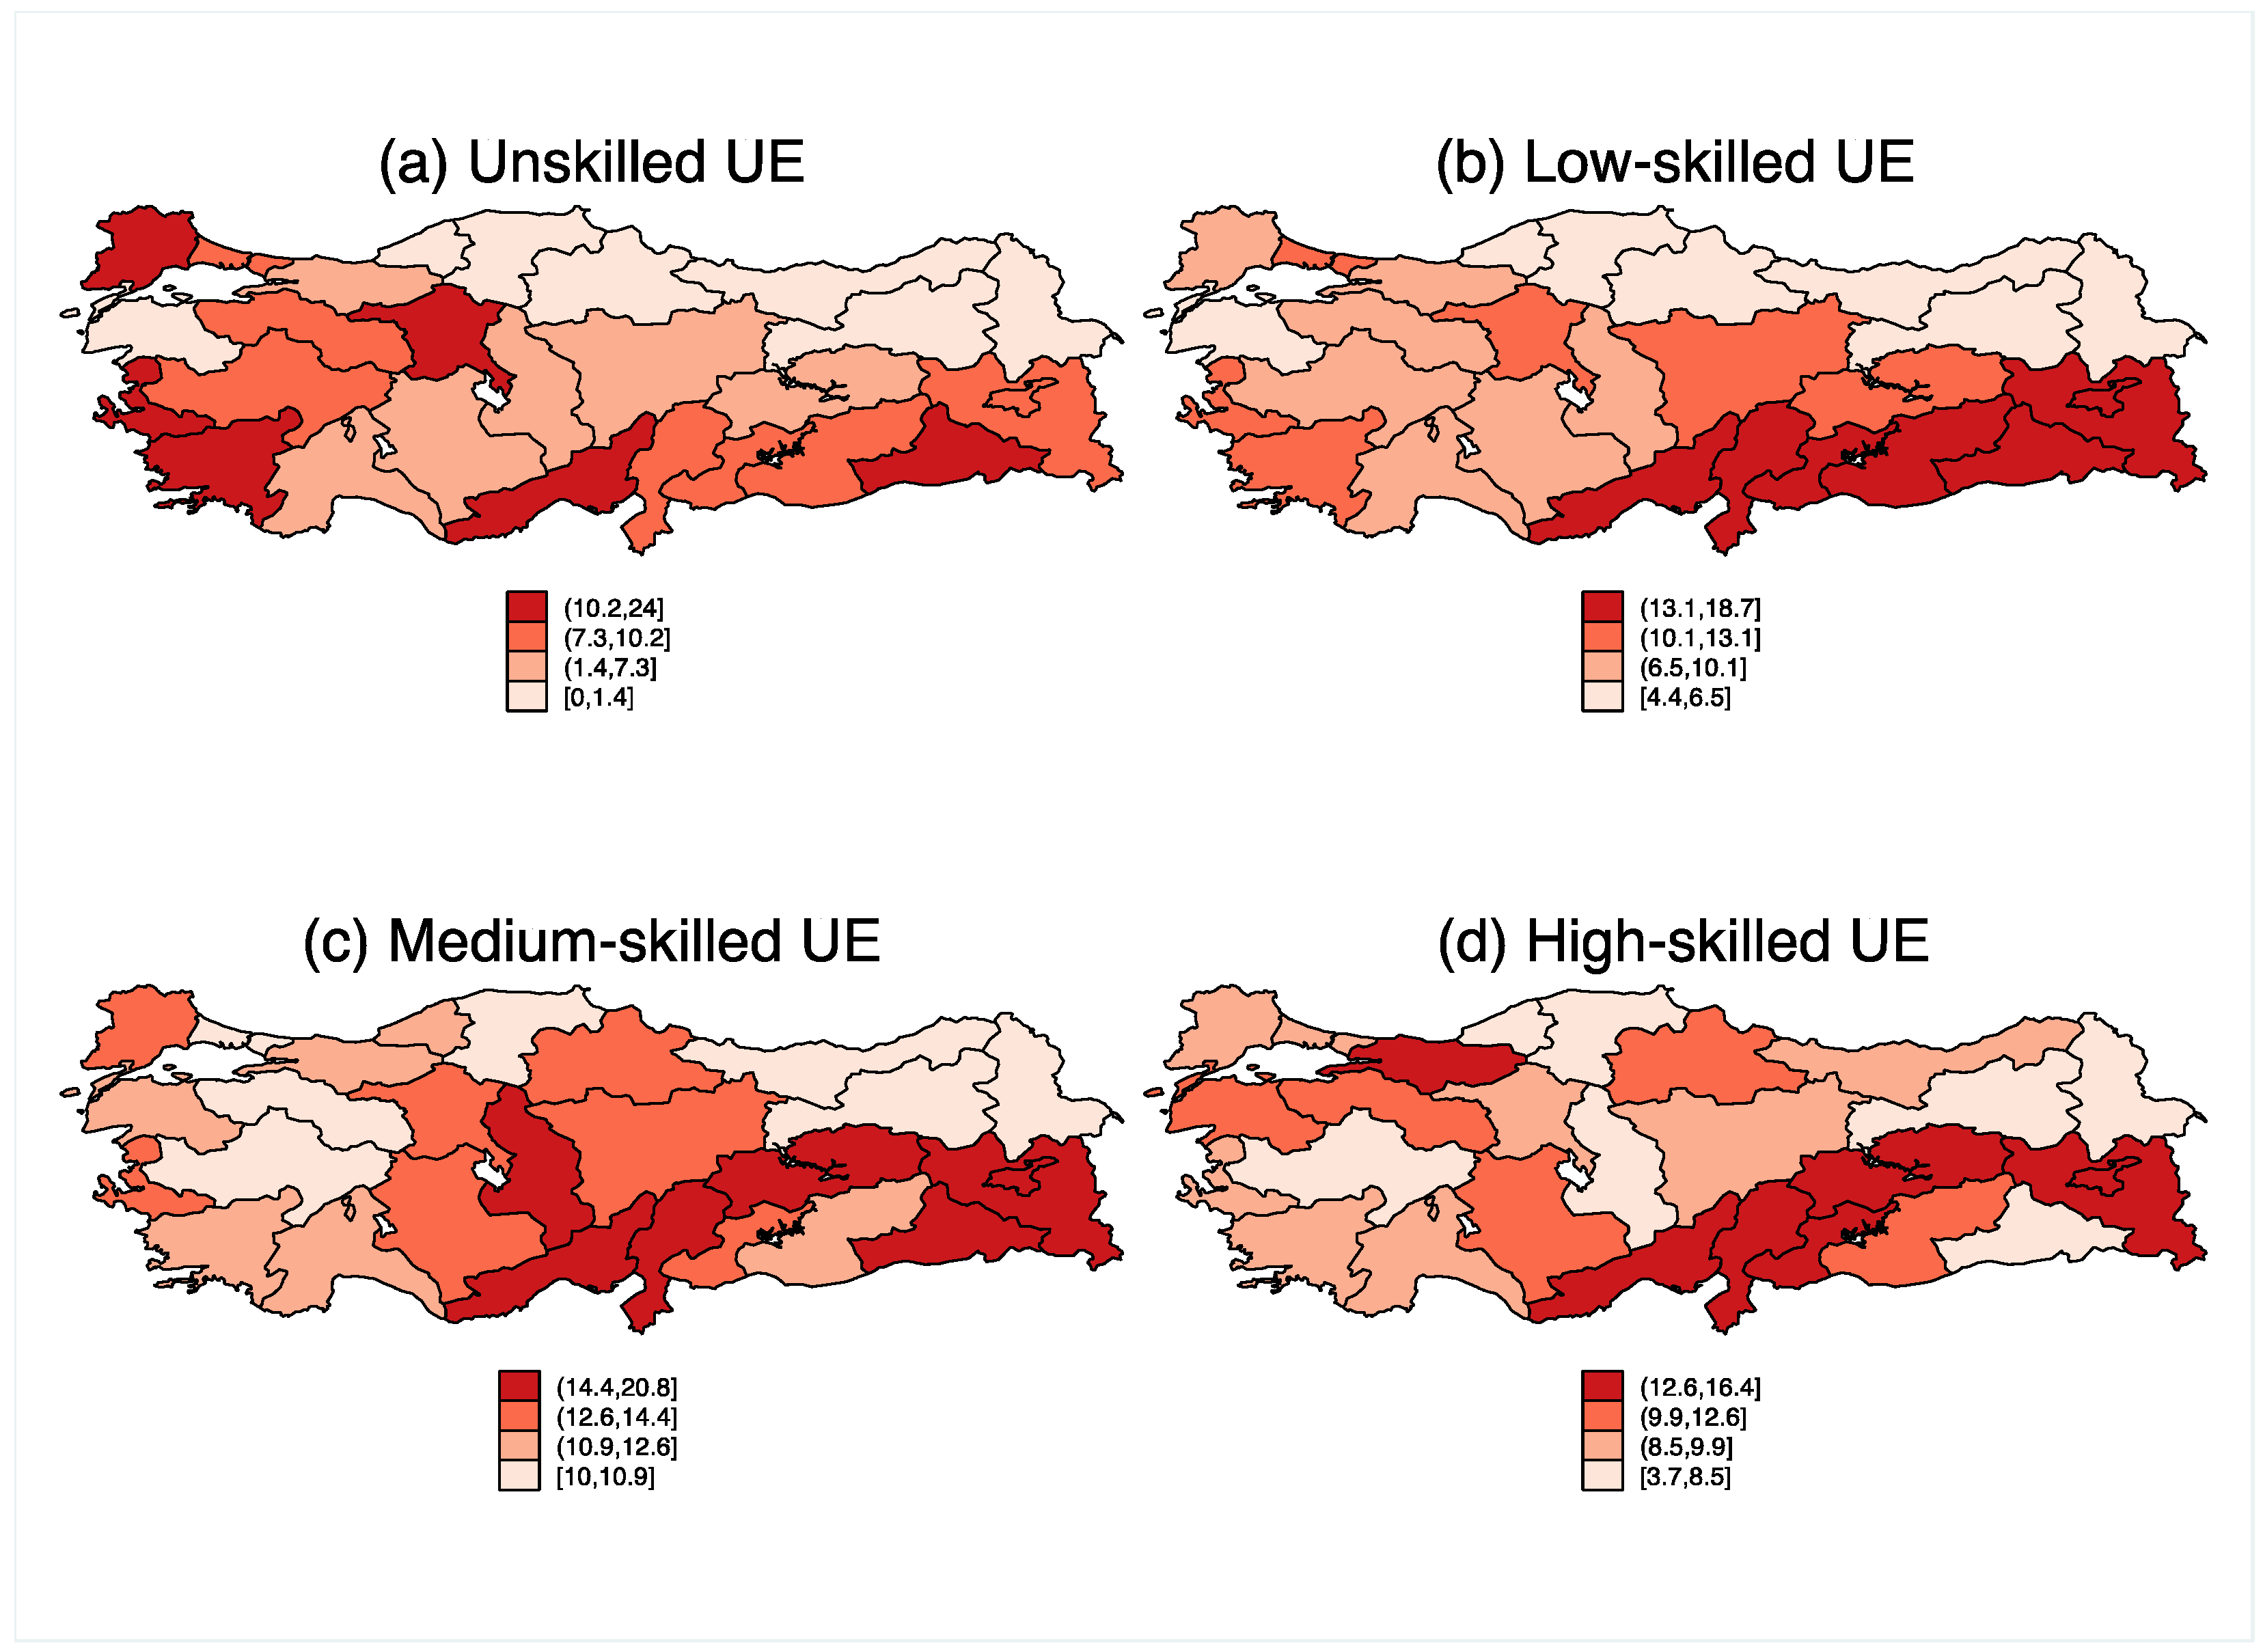
Table 1.
Summary statistics.
| Variables | Mean | Std. Dev. |
|---|---|---|
| Age | 34.63 | 10.39 |
| Having Social Security | 0.755 | 0.430 |
| Permanency of the Job | 0.902 | 0.297 |
| Work Hours per Week | 51.08 | 13.53 |
| Urban Status | 0.820 | 0.384 |
| Overall Unemployment (%) | 10.54 | 3.479 |
| Female | 0.235 | 0.424 |
| Married | 0.704 | 0.457 |
| Years of Education | 9.127 | 4.197 |
| Currently in School | 0.068 | 0.251 |
| Required Attendance in School | 0.953 | 0.213 |
| Education Level | ||
| Illiterate | 0.015 | 0.121 |
| Literate but No Diploma | 0.041 | 0.198 |
| Primary School | 0.306 | 0.461 |
| Middle School | 0.166 | 0.372 |
| High School | 0.128 | 0.334 |
| Vocational High School | 0.130 | 0.337 |
| College | 0.228 | 0.420 |
| Having a Second Job | 0.025 | 0.156 |
| Part-time Job | 0.031 | 0.173 |
| Hourly Wage | 2.732 | 2.872 |
| Tenure in Current job | 6.698 | 7.629 |
| Firm Size | ||
| Firm (less than 10 Workers) | 0.340 | 0.474 |
| Firm (10–24 Workers) | 0.120 | 0.325 |
| Firm (25–49 Workers) | 0.178 | 0.383 |
| Firm (more than 49 Workers) | 0.362 | 0.481 |
| Private Sector | 0.737 | 0.440 |
Source: Authors calculation from TURKSTAT Household Labor Force Surveys (2004–2013).
Table 2.
Unemployment elasticity of pay—(FE-2SLS).
| All | All (NAUE) | Female | Male | Age 15–24 | Age 25+ | Public | Private | Low-Skilled | Medium-Skilled | High-Skilled | |
|---|---|---|---|---|---|---|---|---|---|---|---|
| β | −0.071 *** | −0.107 *** | −0.063 *** | −0.073 *** | −0.096 *** | −0.065 *** | 0.021 ** | −0.098 *** | −0.099 *** | −0.052 *** | −0.022 * |
| (0.007) | (0.008) | (0.014) | (0.008) | (0.016) | (0.007) | (0.010) | (0.008) | (0.010) | (0.012) | (0.013) | |
| Obs. | 752,634 | 729,761 | 178,531 | 574,103 | 133,543 | 619,091 | 195,253 | 557,381 | 371,572 | 194,271 | 176,084 |
| 0.64 | 0.64 | 0.69 | 0.63 | 0.50 | 0.63 | 0.57 | 0.51 | 0.42 | 0.55 | 0.51 |
Notes: Robust standard errors in parentheses *** p < 0.01, ** p < 0.05, * p < 0.1. All regressions include age, age square, tenure at the firm and its square, and dummy variables for gender, marital status, 6 education levels, ongoing education and if attendance to it required, formality, permanency, urban, extra job, part-time, private sector, 4 firm sizes, 9 occupations, and 10 industry categories as well as time and region (26 NUTS2 level) fixed effects. All regressions are weighted by the sampling weight provided in THLFS. Low-skilled refers to those have less than high school education; medium-skilled refers to those have high school education; and, high-skilled refers to those have more than high school education.
Table 3.
Group-specific unemployment elasticity of pay—(FE-2SLS).
| All | Female | Male | Age 15–24 | Age 25+ | Low-Skilled | Medium-Skilled | High-Skilled | |
|---|---|---|---|---|---|---|---|---|
| β | −0.071 *** | −0.024 | −0.068 *** | −0.131 *** | −0.052 *** | −0.054 *** | −0.094 *** | −0.076 ** |
| (0.007) | (0.016) | (0.008) | (0.018) | (0.007) | (0.009) | (0.014) | (0.034) | |
| Obs. | 752,634 | 178,531 | 574,103 | 133,543 | 619,091 | 371,572 | 194,271 | 176,084 |
| 0.64 | 0.69 | 0.63 | 0.50 | 0.63 | 0.42 | 0.55 | 0.51 |
Notes: Robust standard errors in parentheses *** p < 0.01, ** p < 0.05, * p < 0.1. All regressions include age, age square, tenure at the firm and its square, and dummy variables for gender, marital status, 6 education levels, ongoing education and if attendance to it required, formality, permanency, urban, extra job, part-time, private sector, 4 firm sizes, 9 occupations, and 10 industry categories as well as time and region (26 NUTS2 level) fixed effects. All regressions are weighted by the sampling weight provided in THLFS. Low-skilled refers to those have less than high school education; medium-skilled refers to those have high school education; and, high-skilled refers to those have more than high school education.
Table 4.
Unemployment elasticity of pay with spatial spillover effects—contiguity weight—(FE-2SLS).
| All | All (NAUE) | Female | Male | Age 15–24 | Age 25+ | Public | Private | Low-Skilled | Medium-Skilled | High-Skilled | |
|---|---|---|---|---|---|---|---|---|---|---|---|
| β | −0.056 *** | −0.084 *** | −0.051 *** | −0.058 *** | −0.067 *** | −0.051 *** | 0.040 *** | −0.087 *** | −0.075 *** | −0.039 *** | −0.012 |
| (0.008) | (0.009) | (0.015) | (0.009) | (0.020) | (0.008) | (0.012) | (0.009) | (0.011) | (0.014) | (0.015) | |
| γ | −0.087 *** | −0.162 *** | −0.118 *** | −0.081 *** | −0.143 *** | −0.081 *** | −0.086 *** | −0.079 *** | −0.132 *** | −0.079 *** | −0.067 ** |
| (0.015) | (0.022) | (0.030) | (0.017) | (0.038) | (0.016) | (0.023) | (0.018) | (0.022) | (0.026) | (0.030) | |
| Obs. | 752,634 | 729,761 | 178,531 | 574,103 | 133,543 | 619,091 | 195,253 | 557,381 | 371,572 | 194,271 | 176,084 |
| 0.64 | 0.64 | 0.69 | 0.63 | 0.50 | 0.63 | 0.57 | 0.51 | 0.42 | 0.55 | 0.51 |
Notes: Robust standard errors in parentheses *** p < 0.01, ** p < 0.05, * p < 0.1. All regressions include age, age square, tenure at the firm and its square, and dummy variables for gender, marital status, 6 education levels, ongoing education and if attendance to it required, formality, permanency, urban, extra job, part-time, private sector, 4 firm sizes, 9 occupations, and 10 industry categories as well as time and region (26 NUTS2 level) fixed effects. All regressions are weighted by the sampling weight provided in THLFS. Low-skilled refers to those have less than high school education; medium-skilled refers to those have high school education; and, high-skilled refers to those have more than high school education.
Table 5.
Group-specific unemployment elasticity of pay with spatial spillover effects—contiguity weight—(FE-2SLS).
Table 5.
Group-specific unemployment elasticity of pay with spatial spillover effects—contiguity weight—(FE-2SLS).
| All | Female | Male | Age 15–24 | Age 25+ | Low-Skilled | Medium-Skilled | High-Skilled | |
|---|---|---|---|---|---|---|---|---|
| β | −0.056 *** | −0.023 | −0.056 *** | −0.091 *** | −0.041 *** | −0.039 *** | −0.070 *** | −0.188 |
| (0.008) | (0.016) | (0.010) | (0.024) | (0.008) | (0.010) | (0.018) | (0.135) | |
| γ | −0.087 *** | −0.012 | −0.061 *** | −0.138 *** | −0.071 *** | −0.093 *** | −0.112 *** | 0.352 |
| (0.015) | (0.036) | (0.019) | (0.045) | (0.015) | (0.019) | (0.039) | (0.346) | |
| Obs. | 752,634 | 178,531 | 574,103 | 133,543 | 619,091 | 371,572 | 194,271 | 176,084 |
| 0.64 | 0.69 | 0.63 | 0.50 | 0.63 | 0.42 | 0.55 | 0.50 |
Notes: Robust standard errors in parentheses *** p < 0.01, ** p < 0.05, * p < 0.1. All regressions include age, age square, tenure at the firm and its square, and dummy variables for gender, marital status, 6 education levels, ongoing education and if attendance to it required, formality, permanency, urban, extra job, part-time, private sector, 4 firm sizes, 9 occupations, and 10 industry categories as well as time and region (26 NUTS2 level) fixed effects. All regressions are weighted by the sampling weight provided in THLFS. Low-skilled refers to those have less than high school education; medium-skilled refers to those have high school education; and, high-skilled refers to those have more than high school education.
© 2017 by the author. Licensee MDPI, Basel, Switzerland. This article is an open access article distributed under the terms and conditions of the Creative Commons Attribution (CC BY) license (http://creativecommons.org/licenses/by/4.0/).
Share and Cite
MDPI and ACS Style
Karatas, H.M. The Turkish Spatial Wage Curve. Econometrics 2017, 5, 37. https://doi.org/10.3390/econometrics5030037
AMA Style
Karatas HM. The Turkish Spatial Wage Curve. Econometrics. 2017; 5(3):37. https://doi.org/10.3390/econometrics5030037
Chicago/Turabian StyleKaratas, Haci Mevlut. 2017. "The Turkish Spatial Wage Curve" Econometrics 5, no. 3: 37. https://doi.org/10.3390/econometrics5030037
Note that from the first issue of 2016, this journal uses article numbers instead of page numbers. See further details here.