1. Introduction
Recording detailed foot kinetics and pressure point data can be beneficial in performance enhancement applications such as in sports and physiotherapy. Research in post-routine analysis for medical and rehabilitation applications is still lacking an optimal solution that can record gait data to be used for fall prediction, detection and avoidance [
1]. Solutions to this problem are especially imperative for people who have a high risk of serious injuries as a result of falling or tripping [
2].
Nonetheless, many of the validated tools used to collect mobility data (i.e., walkways/gait mats, force plates, cameras) provide excellent data on several gait parameters, but can be expensive to use and involve stationary or in-floor systems that limit the measurement of gait parameters to constrained research environments (laboratory) or in clinical settings (hospital corridors) [
3].
Novel technological advances in IoT, including wireless technology and sensors, allow for the possibility of building low-cost, wearable insoles that can collect continuous measurements. These measurements can be acquired while a given participant is performing an everyday activity in naturalistic conditions (e.g., going up and down stairs, crossing a road, etc.). Furthermore, these advances provide an opportunity for mobility monitoring (over time and in different contexts) and measurement of improvements after rehabilitation within and outside a clinical setting [
4].
A recent review by Muro-de-la-Herran and colleagues [
5] provided an overview of the advantages and disadvantages of wearable versus non-wearable technologies to measure mobility. Each technique has its advantages and disadvantages, and the authors concluded that the choice of technology really depends on the research question and applications [
5]. In the current validation study, we aimed to validate data from lightweight, low-cost, recently engineered wireless shoe insoles against a standard walkway system (Strideway by Tekscan), in order to use these insoles for mobility tasks in naturalistic settings. The gait mat system used in this study costs approximately
$25,000, while each SmartInsole, in its current prototype state, costs less than
$200.
2. Background
Force plates, accelerometers and camera systems have been widely used to quantify gait [
5]. Fixed plantar pressure measurement systems provide very high performance and accurate measurements. The Italian National Institute of Health has been conducting studies that involve the design, validation, implementation and performance testing of plantar Pressure Measurement Devices (PMD) [
6,
7]. A thorough study was also conducted to test five commercial PMDs for accuracy in pressure force measurement, hysteresis, creep and Center of Pressure (CoP) estimation [
8]. They discussed and compared the main characteristics of the five PMDs, the technologies used, calibration, and accuracy through several tests. Wired insoles used for gait analysis have also been used successfully to acquire different parameters of gait for over 30 years [
9,
10]. More recently, in the last 15 years, many have moved away from wired devices to gait mat technology that allows people to walk freely without wearing any technology, but this mat technology is limited to a fixed distance [
11,
12]. Components of the mat technology (i.e., pressure sensors), accelerometers and insole technology have advanced rapidly, allowing for smaller, more robust sensors that can be used with wireless technology in a shoe insole format. The main advantages of the wireless shoe insole format are that they can be used in naturalistic settings, can monitor changes in gait overtime in these settings and can be used in conjunction with other wireless technologies to track an individual in real time.
Different approaches were taken in recent studies to design shoe insoles for gait measurement and analysis: some use pre-fabricated pressure sensors, while some fabricated their own, and some studies added inertial measurement (i.e., accelerometers and gyroscopes) to get more information that could assist in analyzing the users’ gait characteristics. With respect to the development and testing of insoles, Howell et al. [
13,
14] developed an insole with 32 Force-Sensitive Resistor (FSR) sensors to find the most effective number of sensors and their optimum locations in an insole. They derived a 12-sensor insole by analyzing force data acquired by the 32-sensor insole. This 12-sensor insole was then validated by comparing results with an established gait analysis system at the Physical Therapy Department at the University of Utah. Results showed high agreement and correlation between the two systems. Tan et al., on the other hand, developed an insole with piezoelectric transducers to measure and analyze gait and discussed the need for a low-cost wireless solution for that purpose [
15,
16]. They focused on plantar pressure calculation using the designed low-cost system and compared their results with the Kistler Force Plate.
A different approach was taken by Motha et al. [
17], who fabricated a rubber insole with a focus on plantar pressure. They used Interdigitated Capacitors (IDC) as pressure sensors due to their high pressure sensitivity, amongst other reasons, as reported by [
18]. The insole they designed has pressure sensors embedded in three areas: forefoot, midfoot and hind-foot. Their studies demonstrate how different postures present different responses from these three pressure areas. Crea et al. also designed an insole that embeds a grid of 64 pressure sensing elements that use LED and light sensor pairs to measure pressure distribution and center of pressure [
19]. They also explained the possibility for estimating walking speed based on the distribution of detected pressure and the number of detected steps. Barun et al., on the other hand, combined 13 capacitive pressure sensors with a 3D accelerometer [
20] embedded in their insole and recorded data internally in a flash storage, which can then be loaded into a computer for analysis.
Jagos et al. developed the eSHOE, which has all components embedded in the shoe. Components in the eSHOE include a three-axis accelerometer and a three-axis gyroscope, in addition to four FSR sensors [
21]. Their main goal was to validate the eSHOE by comparing acquired gait parameters with the results obtained from the GAITRite walkway [
22], which is a plantar pressure and gait analysis system developed by CIR Systems. The GAITRite is an electronic 6-m mat with embedded pressure sensors capable of measuring spatiotemporal gait characteristics. Results from both systems show high similarity, which signifies the possibility of replacing the gold standard GAITRite with the low-cost eSHOE. The process followed by Jagos et al. [
21] to validate their eSHOE was very thorough and produced noteworthy results.
With the same embedded structure as the eSHOE, Hafidh et al. started the development of the SmartInsole© in 2013, which is a gait measurement insole device with the complete circuit embedded within the insole [
23]. The embedded circuitry includes 12 FSR sensors, an accelerometer, a microcontroller, a Bluetooth modem and a 3.3-Vcell battery. Over the past five years, many versions of the SmartInsole have been designed. The smart insoles used in this study are enhanced versions of Hafidh’s SmartInsole, with modifications in many aspects including the number of sensors, power and communication mechanisms, in addition to using the insoles as smart measurement instruments within a much bigger context.
In this study, we use a Cyber-Physical System (CPS), developed in-house, that performs distributed processing within the instrumented SmartInsoles. These insoles wirelessly transmit gait data to a centralized master machine that performs more processing including parameter calculations, event detection and real-time visualization, in addition to communicating historical data to a cloud database for storage. The SmartInsoles are standalone sensing devices that are interconnected via the developed CPS. Each of them can measure the specified gait parameters by itself. However, we developed the CPS to have most of the processing load happen in a remote machine. This, in fact, helps in achieving a higher data collection rate and allows for more sensory details to be transmitted to the cyber system installed on the centralized master machine. The cyber system will handle all the processing and provide feedback in real time. A CPS setup also allows for multiple SmartInsole devices to stream simultaneously, which can be very helpful in group activity measurements such as sports or physiotherapy. In order to carefully validate this smart insole, we chose to test the data from our system against the data from a Tekscan Strideway gait mat system. As Jagos et al.’s work [
21] is one of the most comprehensive evaluations of new insole technology for gait measurement purposes, we will use a similar approach to compare several gait parameters acquired by the SmartInsole (within our CPS) and the Strideway.
3. Materials and Methods
3.1. SmartInsoles CPS: Wireless Gait Activity Monitoring System
Cyber-physical systems are systems engineered to seamlessly integrate computational components, networking and physical processes in a well-defined context to serve a specific purpose. The implemented system used in this study is a CPS designed for gait activities’ measurement and analysis. It collects sensory data from numerous multi-sensory SmartInsole devices and transmits them to a central system that performs live visualization and data storage operations. The whole operation process including collecting data and streaming sensory information is done over conventional IEEE802.11 WiFi. Using WiFi allows for more user movement freedom and higher transmission range in comparison to Bluetooth. It also allows for multiple devices to communicate concurrently and enables device mobility. These are important characteristics that help subjects perform tests in a realistic and non-confined environment.
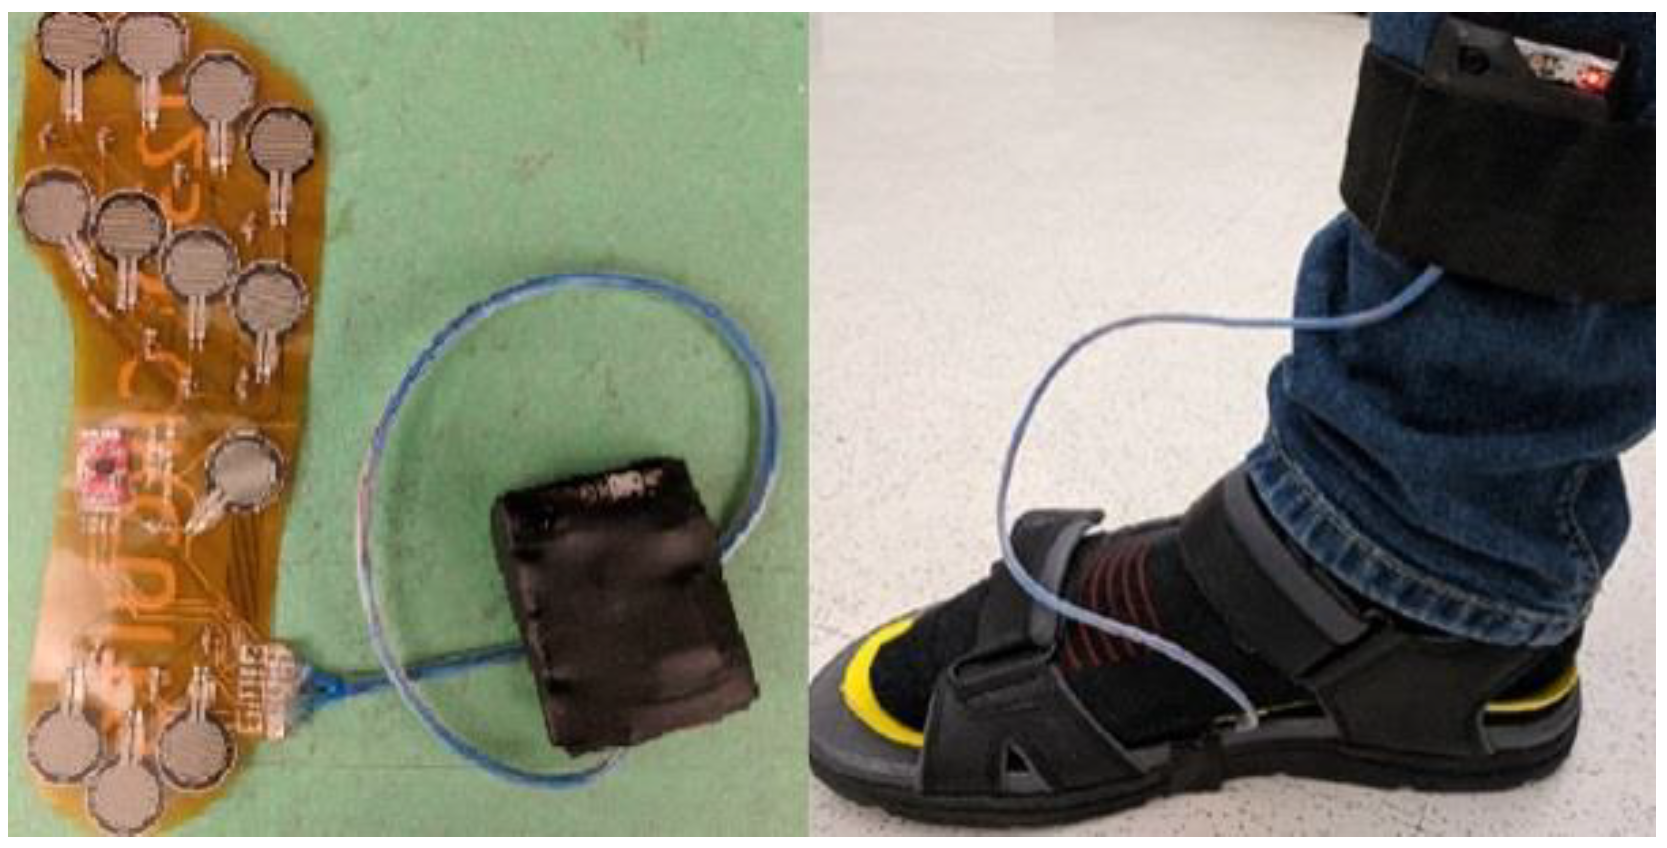
Several pairs of insoles were developed for different shoe sizes and following the exact same design. Each developed insole includes 12 FSR sensors Model FSR-402 from Interlink electronics [
24], as well as an Inertial Measurement Unit (IMU) containing an MPU-9250 chip [
25] that is capable of measuring 3D gyro, 3D accelerometer and 3D compass data. The circuitries are printed on flexible Printed Circuit Boards (PCB) for improved durability and controlled using an ESP-8266 microcontroller breakout board, which has WiFi capabilities [
26,
27]. All sensors are embedded in these insoles following the exact same layout, while the WiFi-enabled microcontroller and the 3.3-VLi-ion battery were placed in an external rubber case. Each flexible PCB is padded with a 2 mm-thick foam sheet and placed inside a size-adjustable sandal (
Figure 1).
An experiment was conducted to evaluate the measuring of pressure force curves over time and how analysis of the sensed pressure and IMU data could be beneficial in detecting gait events and characteristics [
28]. However, this study focused on temporal gait characteristics, and we used pressure sensors in the SmartInsole to detect time-related events to calculate these characteristics.
3.2. Reference System: Tekscan Strideway™
The Tekscan Strideway is a modular human gait analysis system used to analyze detailed spatiotemporal parameters [
29]. The system is packed into a large case and weighs about 40 kg. It mainly consists of six tiles, four of which contain hundreds of embedded force sensors, a tile for gait initiation and a tile for gait inhibition. The assembled system covers an area of approximately 4 m
2 and is wired via a USB cable to a nearby computer containing the Strideway software. This 4-m
2 area is where the subject’s gait data can be collected. Although the full Strideway system was only officially released in 2017, the technology/software used for this system was built based on the one-panel MatScan
® pressure mat, which has produced reliable measures for human gait [
30,
31] and reliable and valid measures of postural stability [
32,
33].
This system is used widely in physiotherapy and rehabilitation applications in many health organizations. The provided software automatically reads from the physical sensors in the mat and performs calculations to derive different gait parameters such as step time, gait time, cadence, velocity and walked distance. It can also automatically detect which foot is right and which is left, which is useful in calculating toe-in/toe-out angles to compare to the subject’s line of progression. During the tests, the software shows a visualization of the performed steps in the form of a heat-map. This display shows the locations of the performed steps on the mat and each step’s pressure intensity. After the test, the Strideway provides detailed analysis in the form of graphs and tables showing calculated spatiotemporal data collected in the test.
3.3. Study Design and Analysis Parameters
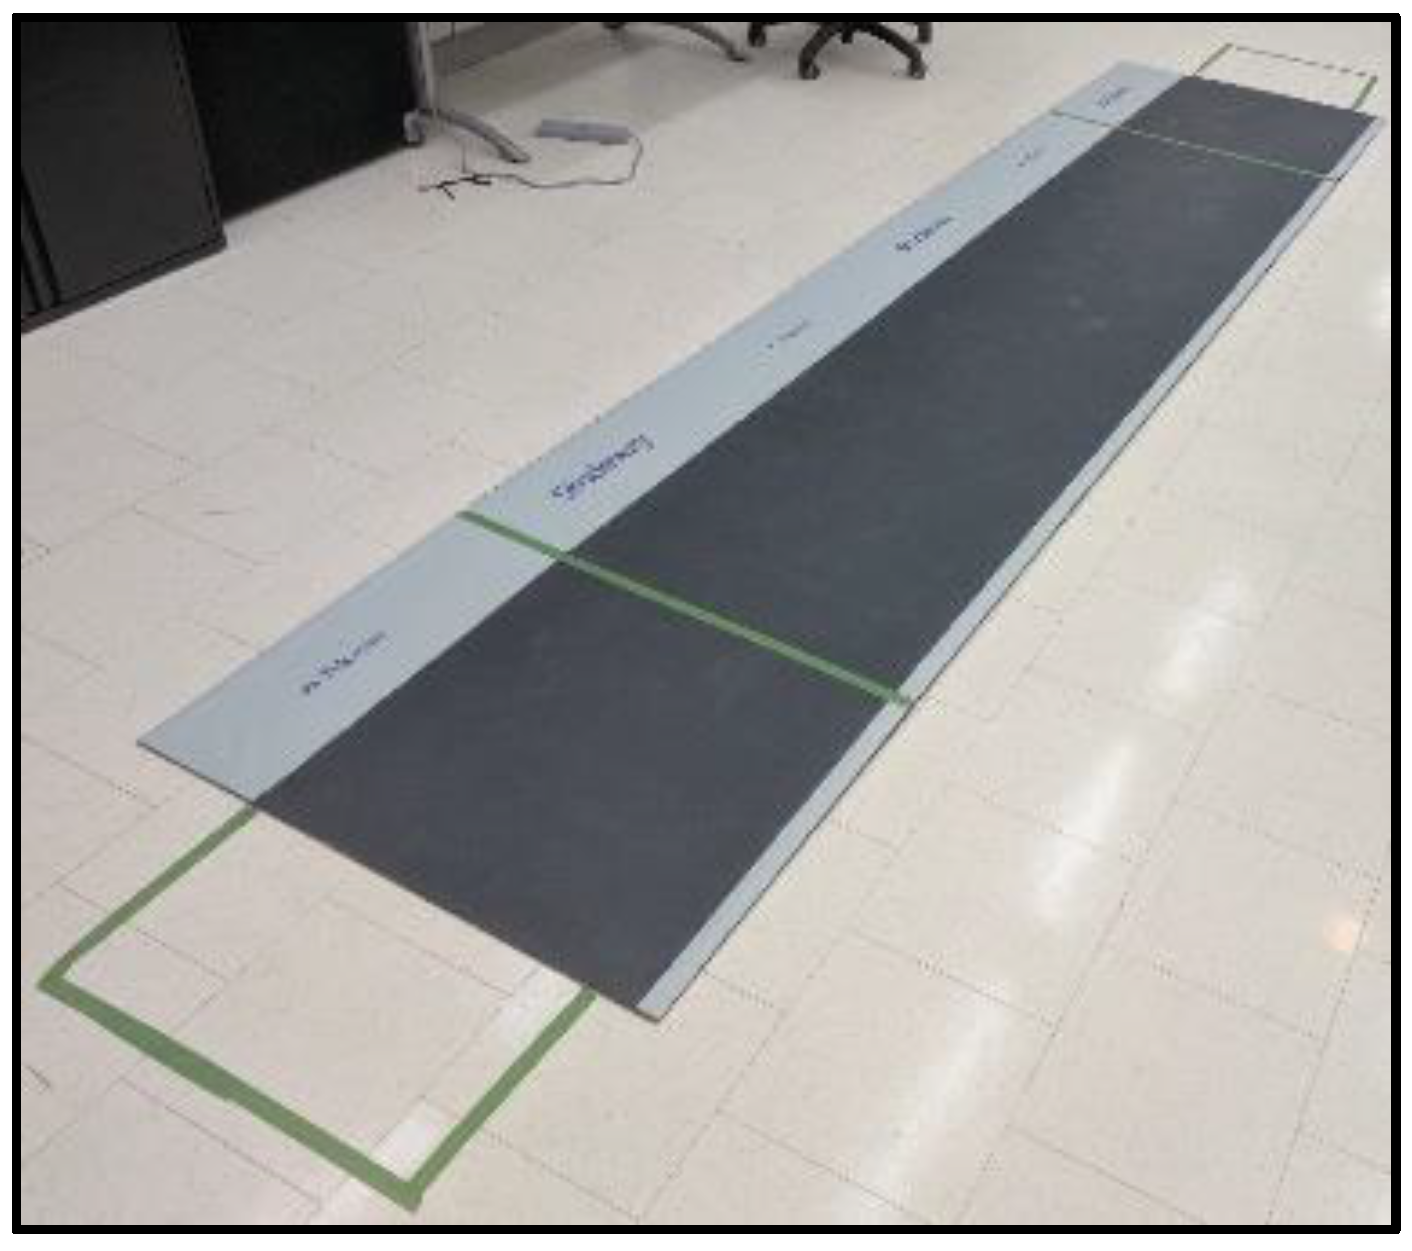
Fifteen subjects were tested in this experiment, 8 females and 7 males, and their ages ranged between 20 and 45 years (average 31 years). The Tekscan Strideway mat was assembled in a spacious area and connected to a laptop that contained the Strideway software. Green tape was used to create a line that marks the start and the end of the actual reading area of the mat, and a video camera was used to record the lower body of test subjects. By referring to the camera footage, we used the green line to identify the first step and synchronize the steps acquired by the two systems. All subjects signed a consent for inclusion before they participated in the study. The study was conducted in accordance with the University of Ottawa Research Ethics Board, and was approved by the Office of Research Ethics and Integrity at the University of Ottawa (H10-17-08).
The goal of this experiment was to allow different subjects to walk at a normal pace, while acquiring their foot pressure data by both systems simultaneously. The outcome we aimed towards in this experiment was having comparable, ideally identical, time-related results for different gait parameters. Having this outcome supports the goal of validating the implemented CPS to be used as a reliable gait monitoring and measurement system.
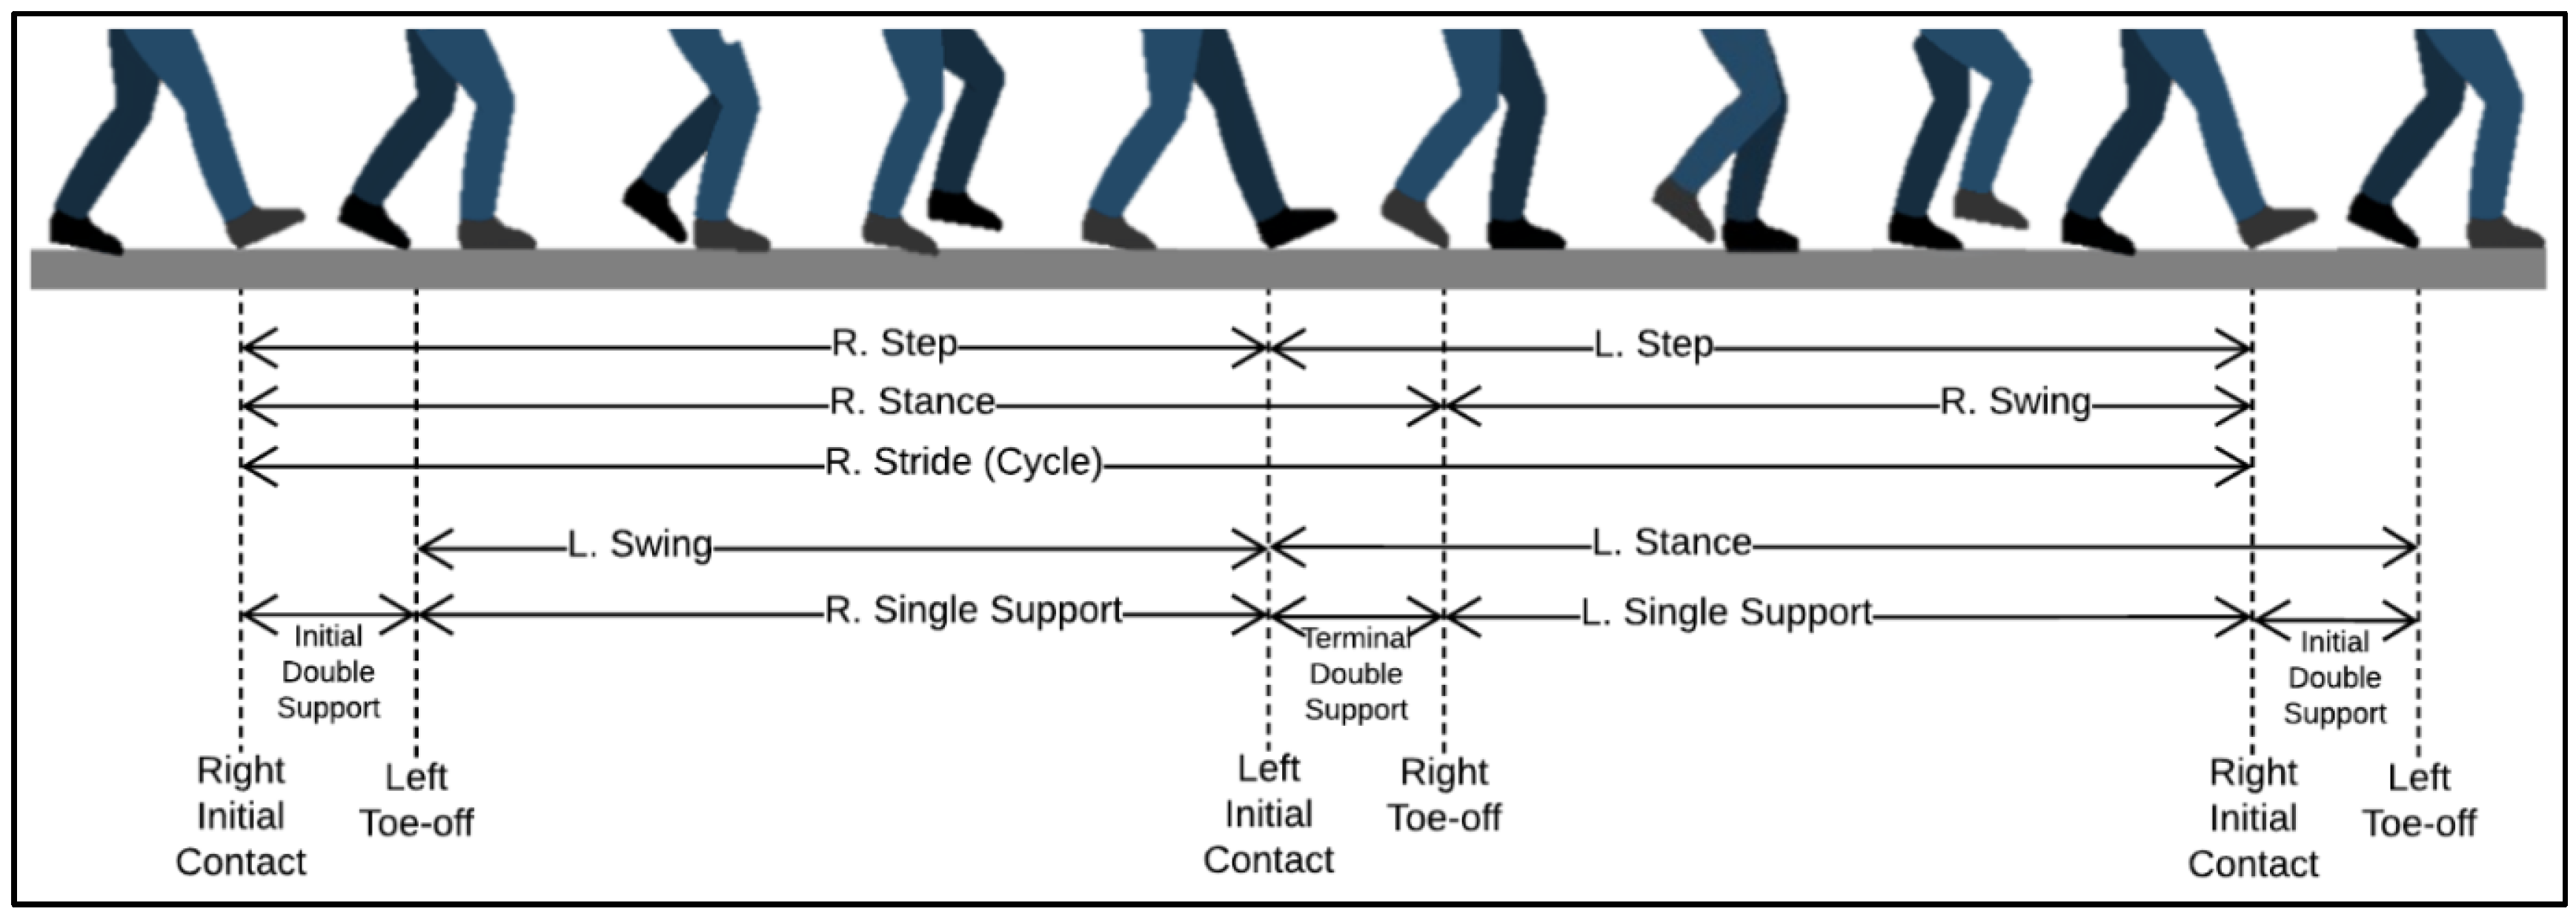
We focussed on seven gait parameters in this study. Assuming the user was always walking forward, the initial contact of the person with the ground was normally at the heel. Therefore, one stride (gait cycle) began with heel contact (initial contact) of one foot with the floor and ended with the next heel contact of that same foot. Consequently, one complete gait cycle consisted of two steps, one of the right foot and one of the left foot [
34]. Each gait cycle was divided into two phases: stance phase and swing phase. Stance phase began with the initial contact of one foot and ended with the toe-off of that same foot. Swing phase began with toe-off of one foot and ended with the subsequent heel contact of that same foot [
35]. Stance phase usually made up about 60% of one gait cycle, and swing phase made up the remaining 40% of that gait cycle [
21].
There were two periods during one gait cycle of normal walking where both feet were in contact with the ground; these were the initial and terminal double support periods. Double support time began with initial contact of one foot and ended with toe-off of the other [
21]. Therefore, considering the right-foot to be the dominant foot, initial double support would start from the initial contact of the right foot and end at toe-off of the left foot. Consequently, terminal double support would start from initial contact of the left foot and end at toe-off of the right foot. For the purpose of this study, we added the average durations of the initial and terminal double support times and reported the average of total double support time for each trial.
The step time was the time duration from the initial contact of one foot to the initial contact of the subsequent step of the other foot. The gait time was the duration between the first contact of the first step and the first contact of the last step in each test. It started from the initial contact of the first step and ended with the toe-off of the last step, regardless of which foot the participant started or ended his/her gait. Cadence is calculated as the number of steps the user performed per minute.
Figure 2 below shows different described gait phases and indicates each parameter’s starting and ending point. In this study, the following components are collected from both systems:
3.4. Measurement Protocol
Multiple pairs of the SmartInsole were developed for different shoe sizes. Each insole was placed in a size-adjustable sandal, and subjects were asked to wear the pair with a size closest to their shoe size.
Before each subject performed a test, the experiment procedure and purpose were explained to them. They were, then, asked to sign a consent form that explained the purpose of the experiment again and indicated that the collected data would be used strictly for research purposes. Identifying information was not collected. Since the first plate in the Strideway did not contain sensors and could not collect data, we used it as the gait initiation stage. Therefore, at the beginning of each walk, subjects were asked to stand on one of the marked boxes (as seen in
Figure 3), walk normally towards the other end of the mat and stop at the final box. After storing data and labeling them for post-experiment analysis, subjects were directed to stand on the starting box again for their next walk. As indicated earlier, each subject was directed to perform 10 rounds of walks.
3.5. Analysis of Agreement
One of the main features of the Tekscan software is its ability to automatically produce spatiotemporal data details for tests performed on the Strideway mat. The results of each test are shown in the form of a video and information tables. The video shows a digital representation of the mat and the location and pressure intensity and distribution, in the form of a heat-map, of each step preformed during the test. In addition to the video, the software provides five tables for five different groups of data. These tables provide rich information on the step-stride times and forces applied, gait cycle times and the overall gait characteristics such as the distance, velocity, cadence, etc. In addition, two more tables are provided to show differential and symmetry characteristics by comparing data acquired from each foot.
The designed CPS, on the other hand, provides accurate force and time details for each of the 12 embedded pressure sensors from all of the connected SmartInsoles. These force values are used to extract timestamps for initial contact and toe-off of all steps that occurred during the operation of the system. After that, these timestamps were used to calculate all of the required gait parameters in this experiment.
Since the designed CPS reads all data coming from the SmartInsoles, some steps may not be read by the mat. Therefore, video footage was required to determine the number of first steps that occurred on the reading area of the Strideway. This process was needed to match/synchronize the correct step data acquired from each system.
Since it is almost impossible to get identical values acquired by two different systems, the amount of difference that was likely to occur between them was investigated, and an accuracy indicator was derived based on the results. The agreement accuracy was calculated for the results of this experiment using two methods. The first method, overall accuracy, looks at the overall values produced by both systems and derives the accuracy percentage based on the summations of values. The second method, average accuracy, looks at individual measures and calculates the accuracy for each pair of results from the two systems. Then, it is calculated as the average of all accuracy values derived from each pair of values (from the Strideway and the insole system). Overall accuracy and average accuracy were calculated using Equations (1) and (2), respectively.
where:
| is the trial/test number |
| is the total number of trials/tests |
| , | are the gait parameter values derived from the Strideway and the insole systems, respectively. |
4. Results
Ten walks were performed by each of the 15 participants on the Strideway while wearing the smart insoles. Spatiotemporal data for over 450 unique steps were collected and recorded. Each step collected by the SmartInsoles was analyzed carefully and compared to its counterpart from the Strideway. In this section, we present the results of this experiment, where SW represents the results acquired by the Strideway system, and IN represents the results acquired by the implemented Insoles’ CPS.
Each of the 12 FSR sensors embedded in the SmartInsoles produced its own force value between zero and 100 Newtons. The values acquired from all tests that were performed in this experiment were analyzed to retrieve each step’s heel-contact and toe-off timestamps. These timestamps were then used to calculate the gait parameters as described in
Figure 2.
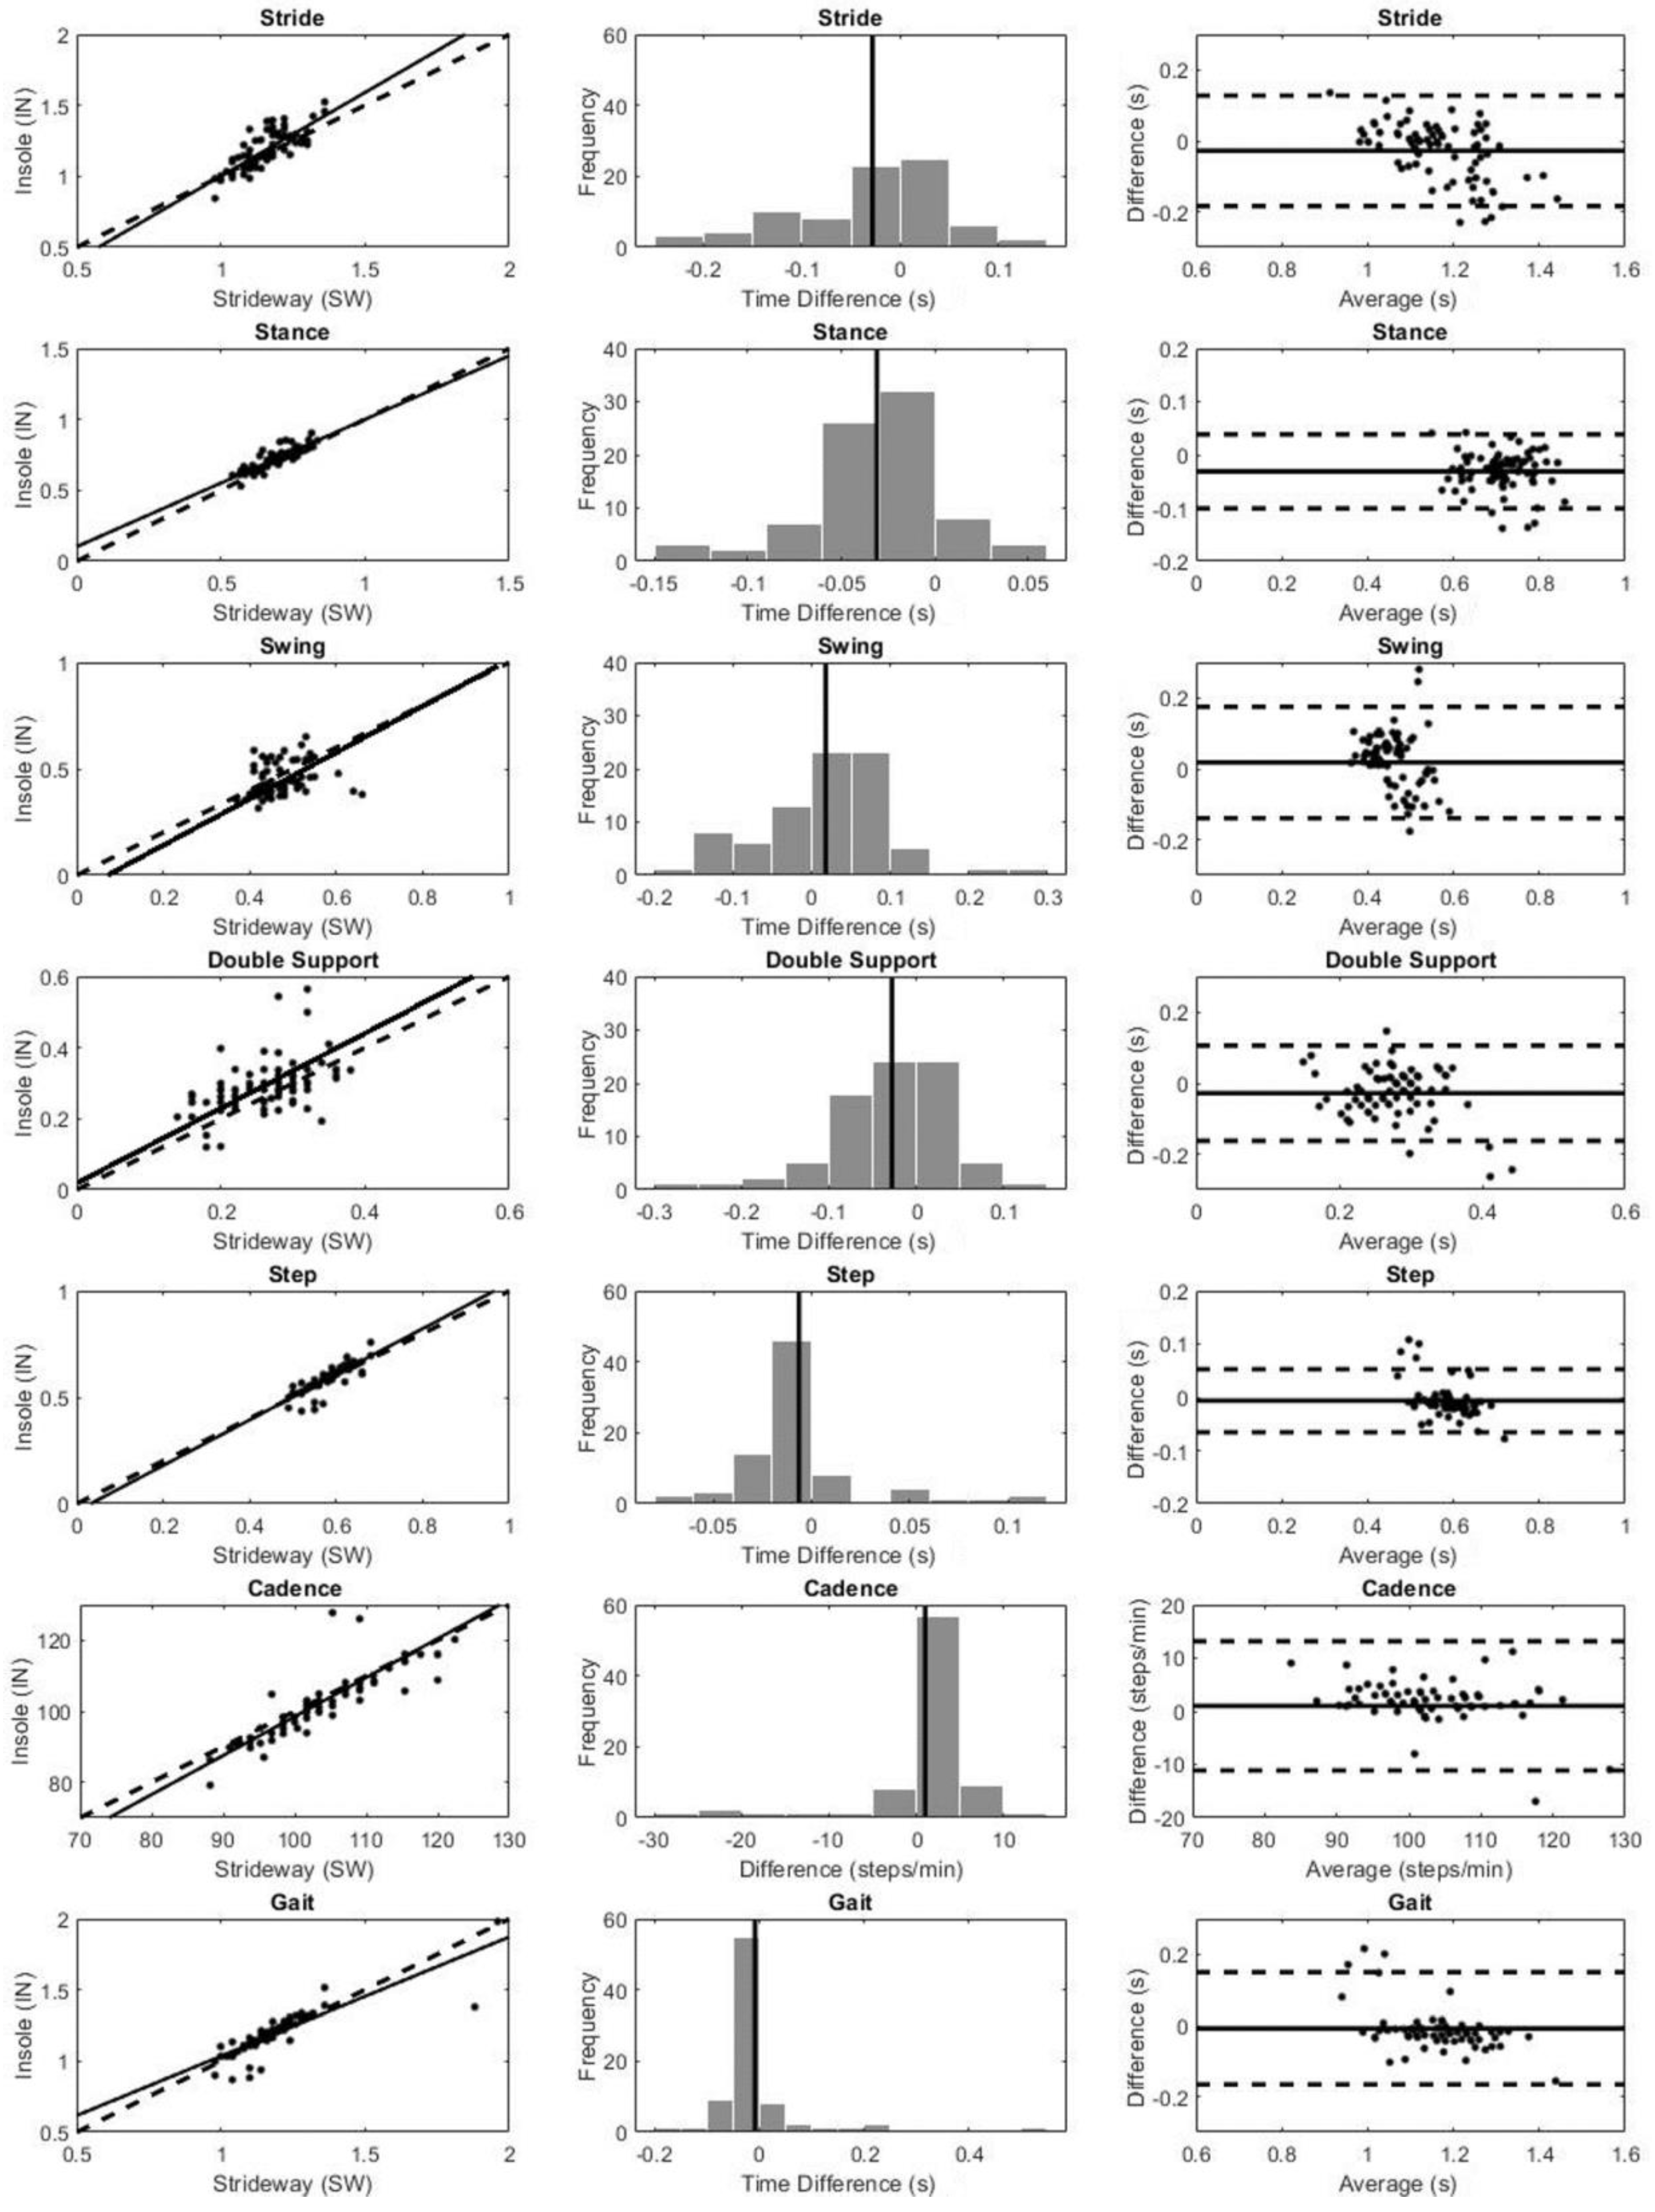
The data used to plot the graphs in
Figure 4 were the results produced after averaging left and right foot data for each of the seven analyzed gait parameters. This way, a single value was produced for each trial by each system. MATLAB (R2018) was used for all statistical analysis and to generate all graphs in
Figure 4. In some cases, during the experiment, one of the systems could fail to deliver results for a specific test. Data from both systems were eliminated in such cases, and their results are not reported here. The final used sample, based on which all the results and graphs were derived, included 81 pairs of successful tests, which was 54% of all the performed tests.
Three types of graphs were generated for each gait parameter in this study: a scatterplot, a histogram and a Bland–Altman graph.
Scatterplots were used to find a correlation between two sets of data. In this case, we were comparing data from two systems: Strideway data (x-axis) and the insoles’ CPS (y-axis). A trend line (or a line of best fit) on a scatterplot was used to represent the trend of the data and indicated the likelihood of results if other data were present. In each parameter’s scatterplot shown in
Figure 4, a trend line is shown as a continuous straight line. Since this was a comparison between the results of two systems measuring the same information, the trend line should ideally fall exactly on the 45-degree reference line (
y =
x), which is shown as a straight dashed line. This would mean that the data from both systems were identical. Therefore, a trend line that was close to the reference line indicated a trending agreement between the two systems’ results.
Histograms show the number of occurrences of a value in a specific range. The values shown in the histograms in
Figure 4 represent the time difference between the Strideway data and the insoles’ data for each of the analyzed parameters. The width of each bar (bin) represents the range of error, and the y-axis shows how many times an error falls within this bin’s range during our experiment. A straight line is also shown in all histograms and indicates the average difference between the values read by each system. The ideal case is when this line stands on the x-axis’ zero mark. In these histograms, values should follow a bell-shaped normal distribution, and the peak y-axis value should be around the zero x-axis value.
A Bland–Altman graph is another way to analyze the agreement between datasets acquired by two systems. The y-axis represents the difference between the two values, while the x-axis represents the average of these two values. Furthermore, three horizontal lines can provide more information on the acquired data in a Bland–Altman graph. The solid straight line represents the average difference between the values read by each system (also called the bias line), which has the same value of the vertical line in histograms, and the two dashed lines are the Limits of Agreement (LoA). The upper and lower LoA lines were calculated as the average value ±1.96 standard deviations. If the differences were normally distributed, 95% of the values would be between these two limit lines [
36].
Table 1 shows a numerical analysis and a summary of the data in
Figure 4. The first column represents the analyzed parameters, and the mean difference is shown in the second column. The mean difference in this validation experiment is ideally aimed to be close to zero. As can be seen from this summary, the mean difference for time-related parameters (measured in seconds) ranged between −0.03 s and 0.02 s. This means that the average error between the acquisitions of both systems did not exceed 30 milliseconds. For cadence, however, the mean difference was measured at 1.01 steps per minute, which is also considered an insignificant error. The “Inside LoA%” shows the percentage of data that had a difference between the lower and upper LoA values. For example, data showed that 95.06% of the acquired cadence data had an error between −11.13 steps/min and 13.16 steps/min. The lower and upper LoA values in Bland–Altman graphs should wrap approximately 95% of the data, and a smaller range between the lower and upper LoA values meant higher agreement between the two sets of data.
Table 2 shows the results of the five parameters analyzed in this study and compares the values acquired by both systems. The unit of measurement for all time-related parameters is seconds, and the unit for cadence values is steps per minute. Each row in
Table 2 shows a calculated result that went through two stages. The first stage was averaging the left and right foot data for each parameter, and the second stage was averaging the first stage data for all 10 walks. Equations (3) and (4) below show how these values were calculated.
where:
| represents the subject/participant |
| represents the gait parameter |
| is the trial number |
| are the left and right average values acquired by the SmartInsoles CPS |
| are the left and right average values acquired by the Strideway |
| is the two-stage value for subject s parameter p acquired by the SmartInsoles CPS |
| is the two-stage value for subject s parameter p acquired by the Strideway |
This two-stage calculated value produces a single value for each subject and parameter, by each system, which makes them easily comparable. The last two rows in
Table 2 show the overall accuracy and the average accuracy as described earlier using Equations (1) and (2).
5. Discussion
5.1. Comparison to Other Validation Studies
The current study is similar to Jagos et al. [
21] in that the insoles were compared to a walkway pressure-sensitive system (Strideway by Tekscan). While it is certain that there will always be certain measurement differences due to the number of sensors in the insole versus the number of sensors in the gait mat, this study clearly demonstrates a high agreement between the Strideway and the insoles system. Jagos et al. revealed in their validation study that, for the healthy group, the average difference between the eSHOE and GAITRite acquisitions ranged between −0.029 and 0.029 s. The average difference in this study, as shown in
Table 1, is between −0.03 and 0.02 s, which is very close to Jagos’ results. However, it is worth mentioning that their subjects consisted of older adults (age 40.8 ± 9.1 years), while our sample’s average age was 31 years, which makes it difficult to make a direct comparison.
In comparison to other validation studies [
13,
14,
16], this study has the advantage of a large sample of steps (450 unique steps) with which to compare several gait parameters. In addition, based on previous research, the proposed SmartInsoles cyber-physical system was constructed to have the optimal number of sensors for sensitivity to gait parameters without unnecessarily increasing cost. Further, although many of the fabricated systems are wireless, this was one of the few systems that used WiFi for real-time viewing of data from multiple devices simultaneously rather than Bluetooth [
15] or integrated internal storage [
20,
37].
As mentioned in the Background Section, the validation study conducted by the Italian National Institute of Health showcased different error margins for the five tested PMDs [
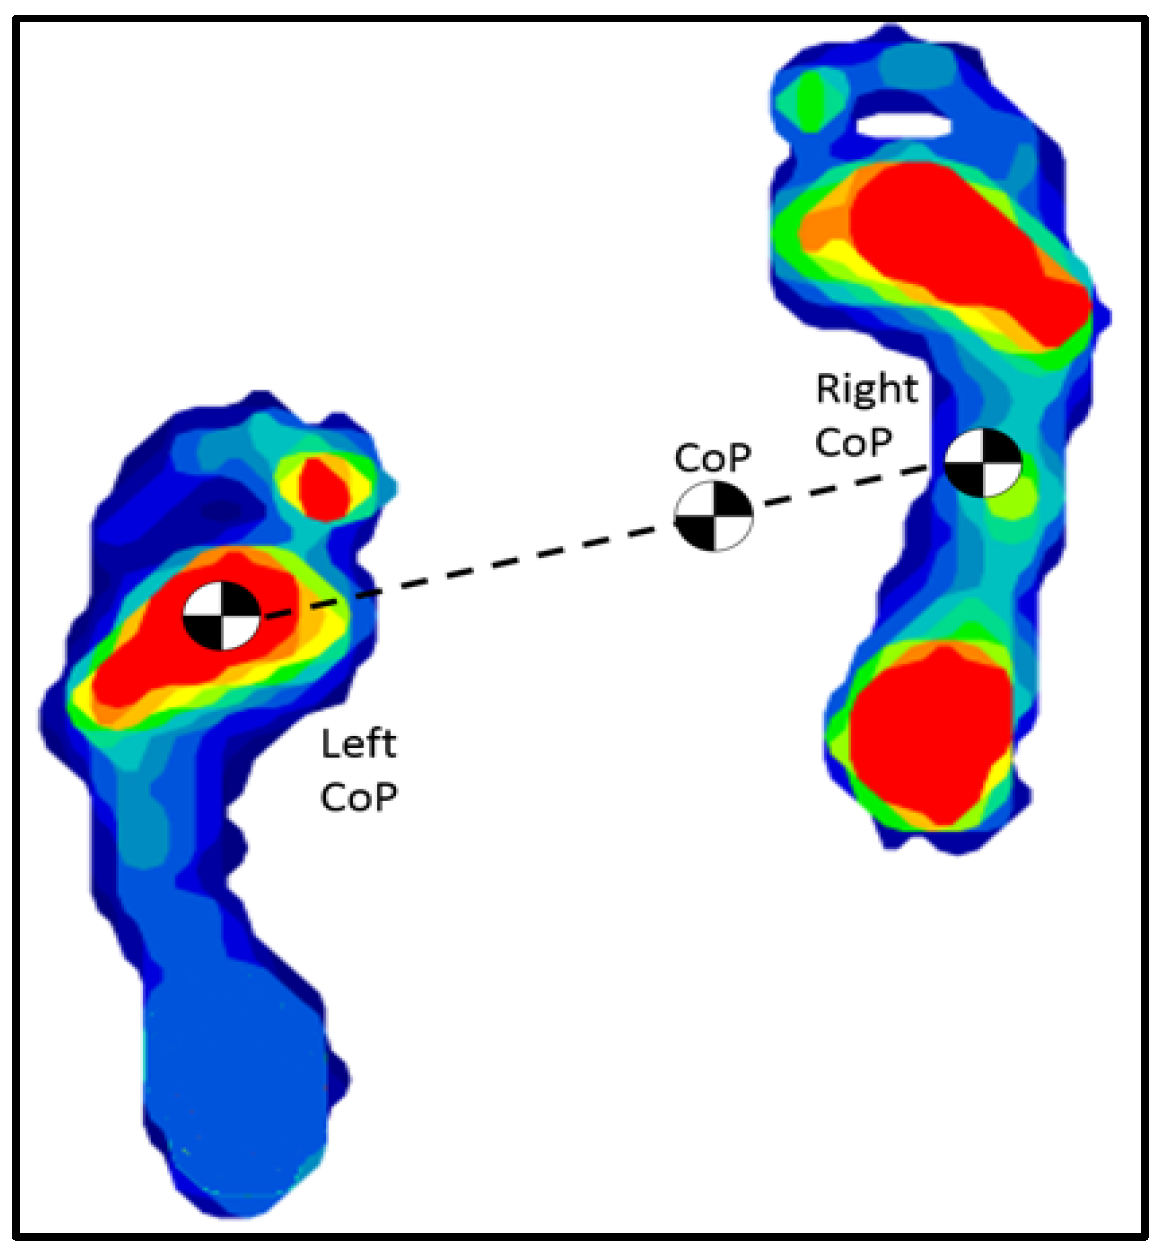
8]. One of the main points of comparison in this study is the accuracy of the calculated Center of Pressure (CoP). In our implementation, however, CoP can be estimated using the average pressure in each insole and the locations of each sensor. This method estimates a relative location in-between the two feet, but cannot approximate a distance since the distance between the two feet is unknown (see
Figure 5). In other words, CoP displacement for a wireless solution, such as our system, cannot be calculated on a compound basis, but rather as two separate measures where each insole calculates its own CoP (i.e., left foot CoP and right foot CoP).
5.2. Study Limitations
Previous work has examined the reliability of insole devices with different motor movements [
37], as well as different populations that may have a more variable gait [
13,
14]. It would be important to follow up with this validation work with different movements, contexts and populations in order to ensure the greatest usability and generalizability of these insoles.
To test for the validity of the wearable SmartInsoles system, participants were required to wear sandals. This may have interfered with the results collected by the Strideway gait mat because it functions best when subjects are barefoot. We tried controlling this by ensuring that all participants wore the same type of sandal, allowing for standardized conditions and limited effects on the measured Strideway data. The gait mat has embedded pressure sensors and can measure footfalls even while using sandals. In gait acquisitions with the mat, participants typically wear their own footwear and do not walk barefoot across the mat. Although the mat may provide more information about pressure when a participant walks barefoot, this is not ecological, as people walk with shoes. In addition, the embedded pressure sensors provide accurate timestamps even with footwear, which leads to high-accuracy time-related parameters such as heel strike time and toe-off time, which are necessary measures to calculate several gait parameters (i.e., stride time). However, the limitation is related to the value/intensity of the pressure force, since the sandals add some padding and can weaken the measured pressure by the mat, not eliminate it. To overcome this limitation, our lab is experimenting with designing SmartSocks, which have the same sensors and circuitry as in the SmartInsole. This way, the padding problem can be minimized, and pressure force values can then be compared between the two systems.
Of the 15 participants included in our study, three participants (11, 14 and 15) performed a fewer number of steps on average due to their taller height. This affected the number of gait cycles they completed, with some having less than one. Data for these participants were still included, as they are still useful for validation purposes.
5.3. Future Work
One of the items that the Strideway calculates is the toe-in and toe-out angles in comparison to the subject’s line of progression. These data provide information on how the subject’s feet are tilted inwards or outwards, which has a direct effect on the subject’s knee adduction according to [
38]. For future work, we plan to calculate the toe-in and toe-off angles by using the information collected from the IMU sensor, which is already embedded in each SmartInsole.
The SmartInsoles can work by connecting them to a nearby smartphone device via Bluetooth. This opens the door for future experiments where people would wear these insoles and go on with their daily lives. The system would then be able to collect more realistic data that can be uploaded into a cloud database that physicians can access to monitor and analyze gait trends of their patients continuously without any location restrictions.
In our study, we evaluated young healthy subjects only. Future studies should include patients with conditions that can affect their gait such as diabetes [
39], Parkinson’s [
40] or patients with Multiple Sclerosis (MS) disease [
41]. Several studies have also confirmed a relationship between gait variability and age progression [
42,
43,
44]. With this being a pilot study, our inclusion criteria consisted solely of young adults. For future studies, data from older individuals acquired with the wearable SmartInsoles and the Strideway gait mat should be evaluated, as there is typically more variability in collected data from older adults.
Therefore, collecting gait data for patients or long periods and away from the restrictions of a laboratory setting can provide rich information that can help physicians monitor the development of symptoms and the progression of disease for such cases.
6. Conclusions
Many studies in healthcare technologies and mHealth are moving towards facilitating remote patient monitoring [
45,
46,
47], which can reduce costs and improve quality of care [
48]. The objective of this study is to provide a reliable sensor network that provides the necessary information in a smart city where patients can live their normal lives and have their activities monitored by their caretakers and physicians. The developed system performs gait analysis by transmitting compressed and encoded sensory information wirelessly to a cloud server, which in turn, performs historical data collection, as well as the required analysis to extract gait parameters. This solution provides an alternative to the current high-cost and non-mobile solutions that have existed for decades. To validate the implemented system, a pilot study was performed in collaboration with the Interdisciplinary School of Health Sciences at the University of Ottawa. The performed experiment collected gait information of several subjects by using two systems simultaneously: the Tekscan Strideway gait mat and the SmartInsoles CPS. Comparison of the acquired data shows high agreement between the two datasets for the seven gait parameters analyzed in this study: stride time, stance, time, swing time, double support time, step time, cadence and gait time. At a fraction of the cost of the commonly-used gait measurement method in healthcare organizations, the in-house designed and implemented SmartInsoles CPS proves that it can reliably provide most of this information with high accuracy.
For the cost of the gait mat used in this study, at least 50 pairs of SmartInsoles, with different sizes, can be maintained. However, while the gait mat is not limited by shoe size, the main advantage of the SmartInsoles CPS is enabling continuous outdoor and home monitoring, away from a clinic or a lab setting. Therefore, the cost of having a custom insole for each shoe size, or each user, is tolerable considering the advantages it brings.

 ,
, 
