Abstract
Aster spathulifolius, a common ornamental and medicinal plant, is widely distributed in Korea and Japan, and is genetically classified into mainland and island types. Here, we sequenced the whole chloroplast genome of mainland A. spathulifolius and compared it with those of the island type and other Aster species. The chloroplast genome of mainland A. spathulifolius is 152,732 bp with a conserved quadripartite structure, has 37.28% guanine-cytosine (GC) content, and contains 114 non-redundant genes. Comparison of the chloroplast genomes between the two A. spathulifolius lines and the other Aster species revealed that their sequences, GC contents, gene contents and orders, and exon-intron structure were well conserved; however, differences were observed in their lengths, repeat sequences, and the contraction and expansion of the inverted repeats. The variations were mostly in the single-copy regions and non-coding regions, which, together with the detected simple sequence repeats, could be used for the development of molecular markers to distinguish between these plants. All Aster species clustered into a monophyletic group, but the chloroplast genome of mainland A. spathulifolius was more similar to the other Aster species than to that of the island A. spathulifolius. The accD and ndhF genes were detected to be under positive selection within the Aster lineage compared to other related taxa. The complete chloroplast genome of mainland A. spathulifolius presented in this study will be helpful for species identification and the analysis of the genetic diversity, evolution, and phylogenetic relationships in the Aster genus and the Asteraceae.
1. Introduction
Aster spathulifolius (Asteraceae) is an economically important perennial herb. It is traditionally used for ornamental purposes, but the aerial part of the plant is also consumed as an edible vegetable or used as herbal medicine to treat several diseases, including asthma, obesity, and diuresis [1,2]. A. spathulifolius is native to East Asia, and is specifically distributed along the coastal regions of the Korean Peninsula and Japan [3,4,5]. It thrives in the rocky seashore environment; however, its occurrence in grasslands has also been reported [3,4,5].
Understanding genetic diversity, defined as any quantitative metric of genetic variation within a population, is important in many fields of research, including ecology, evolution, genetics, and systematics, as well as for biodiversity conservation and agriculture [6]. In the past, genetic diversity in a wide range of species was estimated by analyzing protein variants known as allozymes [4]. In addition, researchers have scanned the genetic diversity of DNA by utilizing marker information such as amplified fragment length polymorphisms, restriction fragment length polymorphisms, simple sequence repeats (SSRs), and single nucleotide polymorphisms in a single or several genomic loci [4]. The current availability of easy, quick, and cost-efficient technologies such as next-generation sequencing has enabled whole-genome sequencing for the nuclei, mitochondria, and chloroplasts (cp) in many plant species, facilitating the detection of genetic diversity on a genome-wide scale. In particular, cp genomes, due to their highly conserved and stable nature, have been widely used as a comprehensive tool for investigating genetic diversity, evolutionary relationships, molecular phylogenetics, and climatic adaptation, as well as assisting the conservation of rare species and delimiting individuals at the infra-specific level [7,8,9].
The genetic diversity, phylogenetic relationships, and geographic distributions of A. spathulifolius populations were previously evaluated using allozymes and inter-SSR (ISSR) markers [4,5]. These populations were genetically differentiated into two distinct groups, mainland and island types, which were consistent with their geographic distributions [5]. The mainland populations showed higher levels of genetic diversity, while island A. spathulifolius populations exhibited lower diversity, probably due to their geographic isolation by hundreds of kilometers of ocean and the resulting genetic drift [5]. The complete cp genome for island A. spathulifolius was previously sequenced [3,10] and shows relatively high divergence from Aster altaicus and Aster tataricus [3,10]. Molecular phylogeny methods were also applied to study the wider Aster genus, including the analysis of Eurasian Aster species using short DNA sequences (ITS, ETS, trnL-F), from which A. spathulifolius was excluded [11]. The cp genome of mainland A. spathulifolius has not yet been reported, however.
Here, we sequenced the complete cp genome of mainland A. spathulifolius and compared it with those of the island A. spathulifolius and other available Aster species, to explore their molecular identities, genetic divergence, and phylogenetic relationships. This comprehensive and comparative analysis of the cp genomes provides valuable information for conducting a species delimitation, developing molecular markers, and reconstructing the events of Aster and A. spathulifolius evolution.
2. Results and Discussion
2.1. Features of the Cp Genome of Mainland A. Spathulifolius
2.1.1. General Structure and Gene Contents
Mainland A. spathulifolius had a typical angiosperm cp genome structure and organization (Figure 1). The cp genome was 152,732 bp and was divided into four regions; a pair of inverted repeat (IR) regions (IRa and IRb; 24,956 bp each) separated by two single-copy regions, one large (LSC; 84,552 bp) and one small (SSC; 18,268 bp) (Table 1). The GC contents of the whole cp, LSC, SSC, and IR regions were 37.28%, 35.15%, 31.32%, and 43.06%, respectively (Table 1). The obtained cp genome of mainland A. spathulifolius was within the size range (149 to 153 kb) and GC content (37.12 to 37.82%) of the other available cp genomes of the Asteraceae species [12]. Due to the presence of GC-rich ribosomal RNA (rRNA) genes and transfer RNA (tRNA) genes in the IR regions, these genomic sections showed comparatively higher GC contents than the LSC and SSC regions [13]. Indeed, the cp rRNA genes in mainland A. spathulifolius had GC contents as high as 55%, and occupied 18.1% of the IR regions.
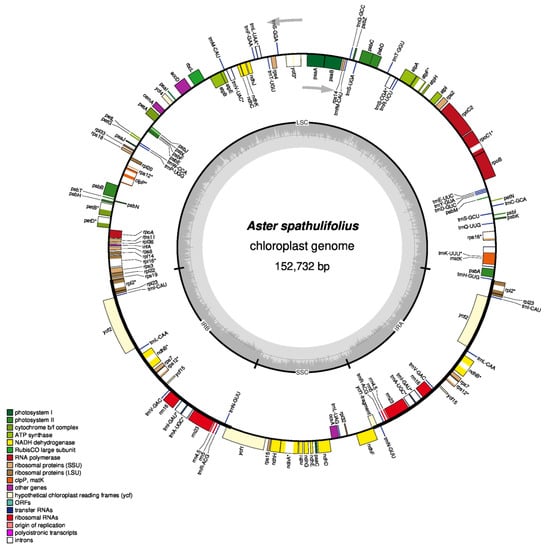
Figure 1.
Gene map of the mainland Aster spathulifolius chloroplast genome. Thick lines indicate the extent of the inverted repeat regions (IRa and IRb), which separate the genome into the small (SSC) and large (LSC) single-copy regions. Genes drawn inside the circle are transcribed clockwise, while those marked outside the circle are transcribed counterclockwise. Genes belonging to different functional groups are color coded. The dark gray in the inner circle corresponds to the GC content, while the light gray corresponds to the adenine-thymine (AT) content. Genes containing introns are marked with an asterisk. The map was drawn using OGDRAW.

Table 1.
Base composition and length of regions of the mainland Aster spathulifolius chloroplast genome.
The cp genome of mainland A. spathulifolius contained 114 non-redundant genes, including four rRNA genes, 30 tRNA genes, and 80 protein-coding genes (Figure 1, Table 2). The LSC region contained 22 tRNA genes and 61 protein-coding genes, whereas the SSC region comprised one tRNA gene and 12 protein-coding genes. Among all these genes, 18 (four rRNA genes, seven tRNA genes, and seven protein-coding genes) were located in the IR regions, and were therefore duplicated.
Table 2.
List of genes in the mainland Aster spathulifolius chloroplast genome.
A total of 16 genes contained introns, including 14 genes with a single intron and two genes (clpP and ycf3) with double introns (Table 2). The clpP gene encodes a protease involved in translation and post-translational modification processes, while ycf3 plays an important role in photosynthesis, by regulating the accumulation of the photosystem I complex [14,15]. One gene, rps12, encoding small ribosomal protein 12, was trans-spliced; its first 5′-end exon was located in the LSC region, while the second exon (3′-end exon) was located in the IRb region and therefore duplicated in IRa. The occurrence of trans-spliced genes, especially rps12, is very common among plant cp genomes [8,16]. We also detected seven gene pairs with partially overlapping sequences; trnK-UUU/matK, psbD/psbC, atpE/atpB, rpoA/rps11, rps3/rpl22, ndhA/rps12, and ndhF/Ψycf1 (Ψ indicates pseudogene). All these pairs had the same gene orientation, with the exception of ndhF/Ψycf1, which displayed a reversed orientation.
2.1.2. Codon Usage and Prediction of RNA-Editing Sites
Protein-coding regions (CDS) comprised 51.50% of the mainland A. spathulifolius cp genome, and had an average AT content of 61.98% (Table 1). In the 26,218 codons in the protein-coding genes, the AT contents of the first, second, and third bases were 54.33%, 61.89%, and 69.71%, respectively (Table 1). The bias toward a higher AT representation at the third position of the codons has commonly been reported in plant cp genomes, and is believed to distinguish cp DNA from nuclear and mitochondrial DNA [7,8,9].
Based on the sequences of the protein-coding genes and tRNA genes, we deduced the amino acid frequency, codon usage, and relative synonymous codon usage (RSCU) in the mainland A. spathulifolius cp genome (Table 3). In the cp-encoded proteins, leucine (2815 residues; 10.74%) and cysteine (293 residues; 1.12%) were the most and least prevalent amino acids, respectively. The most and least used codons were AUU (1074 instances; 4.10%; encoding isoleucine) and UGA (15 instances; 0.06%; encoding translational stop), respectively (Table 3). A total of 30 preferred (RSCU > 1) and 32 non-preferred (RSCU < 1) synonymous codons were identified. In general, A- and U-ending codons were the preferred synonymous codons, while the non-preferred codons more commonly ended in C and G, although minor exceptions were observed. No codons were categorized as rare (RSCU < 0.1) in the mainland A. spathulifolius cp genome.
Table 3.
Relative synonymous codon usage (RSCU), following the codon frequency in the protein-coding sequences of the mainland Aster spathulifolius chloroplast genome.
We predicted 45 RNA-editing sites in 19 genes (Figure 2 and Table S1). All these sites accounted for C-to-U RNA editing, including 36 (80%) editing events in the second position of the codon and 9 (20%) in the first position (Table S1). The highest number of editing sites were detected in ndhB (eight events), followed by ndhD (seven events) and accD (five events). The rest of the genes were predicted to contain 0 to three editing events. No correlation was observed between the gene length and the number of the RNA-editing sites (Figure 2). More than 60% of these RNA-editing events would result in either a serine-to-leucine (17 events; 37.78%) or proline-to-leucine (10 events; 22.22%) conversion (Table S1). No editing events resulted in a stop codon. RNA-editing events occur as a post-transcriptional process to change mRNAs to be translated by generating start codon or removing stop codon and to change the sequences of the proteins (well reviewed in [17]). The RNA folding structure is also changed, which can influence RNA splicing and stability [17]. In plants, the cp genomes have fewer (< 100) RNA-editing sites than the mitochondrial genomes (usually 400–500 events, depending on the size and number of genes) [18]. Our results were consistent with previous studies, in which over 40 RNA-editing sites were reported in the cp genomes [18,19,20].
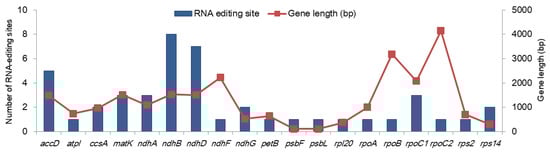
Figure 2.
Predicted RNA-editing sites in the protein-coding genes in the mainland Aster spathulifolius chloroplast genome. Genes without RNA-editing sites are not plotted.
Among the 80 protein-coding genes, only rps19 employed an alternative start codon (GUG). The genome-encoded ACG for at the start of ndhD and psbL CDS was predicted to undergo the C-to-U RNA editing to generate the AUG start codon (Table S1). This phenomenon was observed in diverse plant taxa according to the Plant Editosome Database [21]. The protein-coding genes of eukaryotes typically exploit AUG as the start codon; however, in some cases, codons such as AUA, AUC, AUU, and UUG are also used as alternative start codons [8]. This pattern of using alternative start codons is unusual in plants, but has been reported in some species. The rps19, psbC, and ycf15 genes use GUG in tobacco (Nicotiana tabacum), while rps19 and psbL use ACG as a start codon in rice (Oryza sativa) [7,22]. The ndhD was also reported to use ACG as a translation initiator in higher plant plastids [23].
2.2. Comparative Analysis of the Cp Genomes in the Aster Genus
2.2.1. General Features of the Aster Cp Genomes
The cp genomes of two A. spathulifolius populations from different geographic areas (mainland and island) and four other Aster species were compared, to elucidate their genomic variation (Table 4). The lengths of these cp genomes varied from 149,473 bp (island A. spathulifolius) to 152,992 bp (A. tataricus), with mainland A. spathulifolius having the third largest cp genome. The island A. spathulifolius possessed the smallest cp genome among all 211 sequenced cp or plastid genomes from the Asteraceae [12]. The total number of non-redundant genes was conserved among the Aster species. Exceptionally, the atpB gene of island A. spathulifolius had a 4-bp duplication (AATT) after the first three codons, which prevented the proper annotation of atpB in the original database. Given that the atpB gene is essential for photosynthesis and the deletion of one duplicate resulted in the atpB CDS identical to those in other Aster species, atpB was not excluded from the cp gene set in this study and was subjected for all comparative analyses.
Table 4.
Summary of the complete chloroplast genomes of the six Aster species used in this study.
The Aster cp genomes commonly possessed 18 intron-containing genes (six tRNA genes and 12 protein-coding genes) (Table 5). However, the Aster species showed variation in the intron size, except for rpl2, rps12, and trnV-UAC. The rps16 gene showed the largest size difference of 127 bp, which was followed by petB of 95 bp and petD of 85 bp. The introns in cp genomes ranged from 423 bp to 2539 bp in length. The longest intron (2502–2542 bp) was observed in trnK-UUU, and accommodated matK within it.
Table 5.
Comparison of intron lengths in the mainland Aster spathulifolius chloroplast genome with those of other related species.
2.2.2. Cp Genome Sequence Conservation and Divergence
A pairwise alignment of the cp genomes revealed a large-scale inversion of the entire SSC region in A. altaicus and A. tataricus, as shown in the altered gene positions at the two SSC/IR junctions (Figure 3). This is a common event in the cp genome, and is consistent with the hypothesis that cp DNA can exist in two orientations at the SSC region [24].
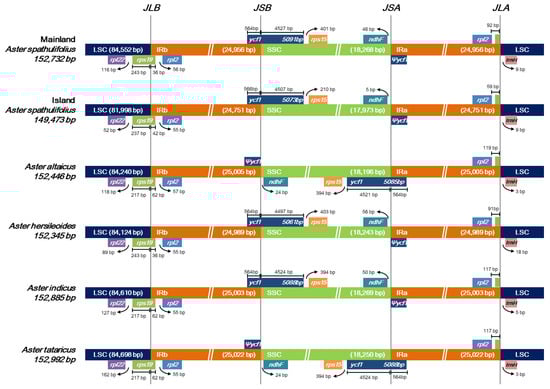
Figure 3.
Comparison of large single-copy regions (LSC), inverted repeat (IR), and small single-copy regions (SSC) junction positions among six Aster chloroplast genomes. Ψ indicates a pseudogene. Genes above the longer box are transcribed in rightward direction and genes below the longer box are transcribed in leftward direction.
A comparison of the cp genomes was used to explore their DNA sequence conservation and synteny (the gene order across the genomes). For this, the SSC sequences for A. altaicus and A. tataricus were reoriented. A BLAST-based CGView Comparison Tool (CCT) analysis showed that the mainland A. spathulifolius cp genome shared high levels of sequence similarity (> 90%) with all the Aster species analyzed (Figure S1). The mVISTA analysis indicated that the IR regions were more conserved than the single-copy regions (Figure 4). Genetic variability was more prevalent in the intergenic or non-coding regions than in the coding regions. The highly divergent regions included rps16_rpoB, atpI_atpF, atpA_psbD, psbZ_rps14, ycf3_ndhJ, ndhK_atpE, accD_psaI, ycf4_cemA, petA_petJ, psbE_rpl20, psbH_petB, petB_petD, rpl16_rps19, ycf1_rps15, ndhI_ndhD, and ccsA_ndhF. In comparison to mainland A. spathulifolius, island A. spathulifolius contained more regions showing divergence than the other Aster species did; however, our intra-genus comparison revealed less divergence than was reported in a previous analysis, comparing the island A. spathulifolius cp genome with the more distant members of the Asteraceae family [3].
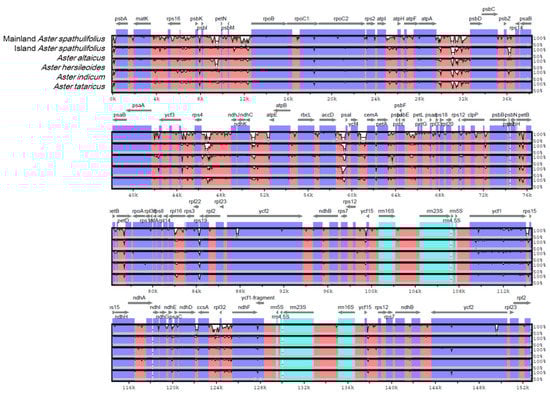
Figure 4.
Comparison of the chloroplast genome of mainland Aster spathulifolius with those of other related species. SSC region in A. altaicus and A. tataricus was reoriented for comparison. Gray arrows above the alignment indicate the orientation of genes. Dark blue bars represent protein-coding genes, pale blue bars represent rRNA genes, and red bars represent conserved non-coding sequences. A cut-off of a 70% identity was used for the plots. The y-scale axis represents the percentage identity (50–100%). mVISTA was used to perform the comparison.
We compared the nucleotide diversity in the complete Aster cp genomes, as well as the LSC, SSC, and IR regions (Table S2). Although the sequence alignment revealed a high sequence similarity, 2289 variable sites (1.55%) were detected in the complete cp genomes, 224 (9.78%) of which were parsimony-informative sites. The nucleotide diversity in the complete cp genome was 0.00563. Consistent with the above sequence alignment (Figure 4), the LSC and SSC regions (0.00776 and 0.00884, respectively) had a 10-fold greater nucleotide diversity than the IR regions (0.00077) (Table S2). In accordance with this, the single-copy regions exhibited a higher number of mutations and InDels than the IR regions.
2.2.3. Gene-By-Gene Sequence Divergence
The pairwise sequence divergence between the mainland A. spathulifolius and other Aster plants was calculated for the 80 common protein-coding genes (Figure 5). Many genes were well conserved, while others showed clear sequence differences. The ten most divergent genes were petL, ycf1, psaI, psbL, ndhF, matK, atpH, ndhG, rps3, and atpB (in decreasing order). With the exception of ycf1, which was located in both IR and SSC, all the divergent genes were located in the LSC and SSC regions, and displayed a trend toward more rapid evolution [7].
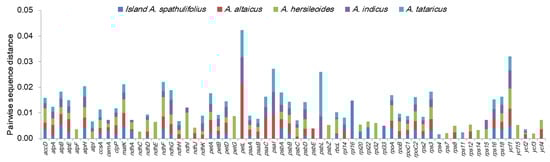
Figure 5.
Pairwise sequence distances of the protein-coding genes in the chloroplast genomes of mainland Aster spathulifolius and related species. The mainland A. spathulifolius chloroplast genome was compared with those of the island A. spathulifolius, A. altaicus, A. hersileoides, A. indicus, and A. tataricus. Of the 80 protein-coding genes analyzed, the 64 showing noticeable divergences are displayed here. Genes with zero divergence were omitted.
The selection pressure was also examined by calculating the nonsynonymous (Ka) and synonymous (Ks) substitution rates and the Ka/Ks ratio between the mainland A. spathulifolius and the other Aster plants (Figure 6, Table S3). In all comparisons, the Ka values ranged from 0 to 0.0150 and the Ks values ranged from 0 to 0.0441 (Table S3). Overall, atpA, atpB, atpH, ccsA, cemA, ndhD, psaA, psbD, rpoC1 and rps3 had high levels of synonymous substitutions, while atpH, matK, petB, petL, rbcL, rpl16, rps12, rps16, rps3, and ycf1 had high levels of nonsynonymous changes. Several genes such as infA, ndhB, petN, psaJ, psbF, psbH, psbI, psbJ, psbK, psbM, psbN, psbT, rpl2, rpl23, rpl36, rps7, rps18, rps19, and ycf15 were not observed to have any synonymous or nonsynonymous changes. Most of the Ka/Ks ratios were less than 1, indicating that the cp genes were under purifying selection (Figure 6, Table S3). Only matK and rbcL in A. tataricus and rbcL in A. hersileoides were under positive selection, as shown by their Ka/Ks values greater than 1. From a less stringent perspective, five genes (clpP, petB, rpoC1, rps3, and ycf1) in the several comparison pairs had Ka/Ks values ranging from 0.5 to 1, indicating a mild positive selection. Between the two A. spathulifolius populations, all of the Ka/Ks ratios were less than 0.5, except for petB (0.5426). The genes under positive selection were generally located in the LSC region, except for ycf1 located in the IR and SSC region. Among the genes under positive selection, two genes (matK and ycf1) were previously reported to experience this type of selection in other taxonomic groups, with matK being reported to be under positive selection in more than 30 groups [25,26].
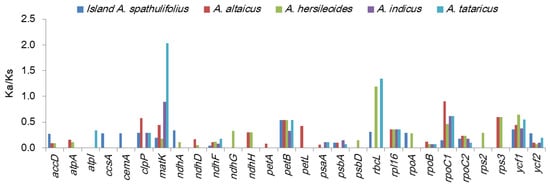
Figure 6.
Ka/Ks values of protein-coding genes in the Aster species. Mainland A. spathulifolius was compared with island A. spathulifolius, A. altaicus, A. hersileoides, A. indicus, and A. tataricus. Genes with zero Ka/Ks value in all comparisons were omitted.
2.2.4. Contraction and Expansion of the IR Region
The expansion and contraction of the IR region are major evolutionary events that influence the lengths of cp genomes [27]. To examine these processes in the Aster species, we dissected the LSC/IRb, IRb/SSC, SSC/IRa, and IRa/LSC junctions for all six Aster sequences (Figure 3). In all cases, rps19 was shared by the LSC and IRb regions. The length of rps19 was quite conserved at 279 bp; however, a shift of this gene towards the LSC region was observed in certain species. In A. altaicus, A. indicus, and A. tataricus, 62 bp of rps19 was shared by the IR region, whereas in both the mainland and island A. spathulifolius lines, this was reduced to 36 and 42 bp, respectively, and thus the gene tended to move towards the LSC region. Since A. altaicus and A. tataricus exhibited an inversion of the SSC region, the genes at the IRb/SSC and SSC/IRa junctions were affected in these species. The IRb/SSC junction was shared by the functional ycf1 gene in mainland A. spathulifolius, island A. spathulifolius, A. hersileoides, and A. indicus, compared with the shorter ycf1 pseudogene detected in A. altaicus and A. tataricus. At the SSC/IRa junction, ndhF and Ψycf1 were identified in mainland A. spathulifolius, island A. spathulifolius, A. hersileoides, and A. indicus, whereas A. altaicus and A. tataricus possessed the functional copy of ycf1. Finally, rpl2 and trnH-GUG were commonly located at the IRa/LSC boundary, with variable gap lengths observed in the six Aster cp genomes.
Pseudogenes are nonfunctional copies of genes generated through loss-of-function mutations, such as frameshift mutations, premature stop codons, or distortions of regulatory sequences [28]. In some cases, pseudogenes arise through the inadequate duplication of parental genes [29]. Similar mutations were observed in the Aster cp genomes, in which three pseudogenes (rps19, ycf1, and ycf68) were identified. The rps19 and ycf1 genes shared the LSC/IRb and SSC/IRb boundaries, respectively (Figure 3), and the duplication of the IR region resulted in the formation of partial copies of these genes (Ψrps19, Ψycf1). In the mainland and island A. spathulifolius, A. hersileoides, and A. indicus cp genomes, the 5’ region of the ycf1 gene, including the start codon, was located in the IRb region, while the remaining 3’ region, covering around 90% of the complete ycf1, extended into SSC, causing a duplication of the 5′ portion of ycf1 in IRa. Consequently, a ~-567bp Ψycf1 sequence was observed in IRb, instead of the ~5,094-bp functional copy. The pseudogenization of ycf68 occurred in the six Aster cp genomes, due to the presence of several premature stop codons in its coding sequence, which was consistent with a pattern of pseudogene formation reported in other studies [3,10]. Pseudogenes usually evolve neutrally; however, some studies revealed that they can be transformed into another gene with a different function, after experiencing strong purifying selection pressure [30].
2.2.5. Repeat Sequence Analysis
Microsatellites, commonly known as SSRs, are short (1–6 nucleotides) tandem unit sequences. They exhibit polymorphisms in their copy numbers and therefore lengths due to replication slippage, and have frequently been used as molecular markers in plant evolution studies [9]. Our SSR analysis detected 55, 36, 58, 54, 61, and 70 SSRs in the mainland A. spathulifolius, island A. spathulifolius, A. altaicus, A. hersileoides, A. indicus, and A. tataricus cp genomes, respectively (Table S4). The cp SSRs showed conservation and variation among the Aster species. In terms of the unit size, a mononucleotide repetition was the most frequent SSR in the analyzed species, followed by tri- and pentanucleotide SSRs (Figure 7A). In mainland A. spathulifolius, 56.4% of SSRs were formed of mononucleotide units, varying from 10 to 17 nucleotide iterations and with adenine or thymine representing the most frequent base (Figure 7B). The SSRs were largely distributed in the intergenic spacers (IGS) (67.3%–74.3% of total SSRs) and LSC regions (74.3%–80.6%) (Figure 7C,D). Our results were consistent with the hypothesis that cpSSRs are generally composed of short polyadenine or polythymine repeats and rarely contain tandem guanine or cytosine repeats [7]; thereby contributing to the AT richness of the cp genome. Variation in the number and type of cpSSRs is common between species [10,31] and could be used to detect polymorphisms between species.
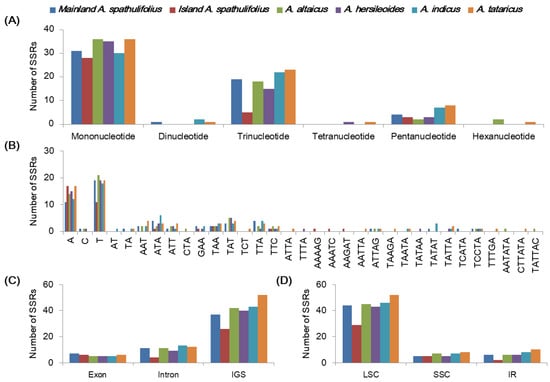
Figure 7.
Analyses of the simple sequence repeats (SSRs) in the Aster chloroplast genomes. (A) The frequency of simple sequence repeats (SSRs) by unit length in six Aster chloroplast genomes. (B) The frequency of SSRs per sequence type. (C) Frequency of SSRs in exon, intron, and intergenic spacer (IGS). (D) Frequency of SSRs in large single copy (LSC), small single copy (SSC), and inverted repeat (IR) regions.
Longer dispersed repeats (LDRs) were detected and classified into four categories, forward, reverse, complement, and palindromic repeats, with a motif length of 30–60 bp in the Aster cp genomes using the REPuter program (Table S5) [32]. The Aster cp genomes showed differences in the number of total LDRs, the frequencies of each class, their lengths, and distribution. In total, 26, 16, 21, 26, 44, and 41 LDRs were detected in the mainland A. spathulifolius, island A. spathulifolius, A. altaicus, A. hersileoides, A. indicus, and A. tataricus cp genomes, respectively. The cp genomes contained more forward and palindromic repeats than reverse and complement repeats (Figure 8A). In the mainland A. spathulifolius cp genome, we identified 10 forward, 1 reverse, 2 complement, and 22 palindromic repeats. In addition, repeats with 30–34 bp in length were the most common in the Aster species (Figure 8B). Most of these LDRs were present in the IGS, but several were observed within the CDS regions and introns (Figure 8C). The ndhF, psaB, psbN, ycf2, trnS-UGA, trnS-GCU genes contained LDRs. The LDRs were also detected more in LSC than in SSC and IR regions (Figure 8D). The overall distribution of LDRs was similar in both copies (Figure 8C,D). Our results are supported by previous findings that the LDRs were more prevalent in the non-coding regions than the coding regions [10,33,34].
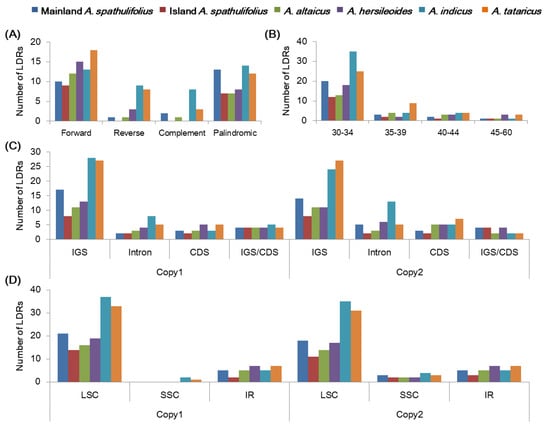
Figure 8.
Analyses of the long-dispersed repeats (LDRs) in the Aster chloroplast genomes. (A) Frequency of four LDR types. (B) Frequency of LDRs by length. (C) Frequency of LDRs in intergenic spacer (IGS), coding region (CDS), and intron. IGS/CDS represents repeats shared in IGS and CDS. (D) Frequency of LDRs in large single copy (LSC), small single copy (SSC), and inverted repeat (IR) regions. The frequency in (C,D) was determined for the first copy and second copy separately.
2.2.6. Phylogenetic Studies
The maximum likelihood (ML) phylogenetic tree was constructed using the whole cp sequences from 23 species in the subfamily Asteroideae (Asteraceae), using lettuce (Lactuca sativa; Cichorioideae, Asteraceae) as an outgroup (Figure 9, Table S6). The Asteroideae species formed a monophyletic group and were separated into several clusters, each of which represented the tribes Astereae, Anthemideae, Gnaphalieae, Inuleae, and the Heliantheae alliance. The mainland A. spathulifolius sequence was clustered together with the other Aster species, including island A. spathulifolius, supported by a 100% bootstrap value. In the previous analysis with cp genomes, island A. spathulifolius cp genome was clustered with non-Aster species, Conyza bonariensis and Lagenophora cuchumatanica, while A. altaicus and A. tataricus were clustered into a monophyletic group [10].
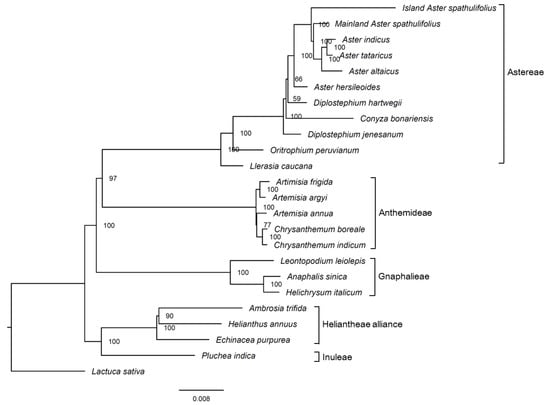
Figure 9.
Phylogenetic tree of the complete chloroplast genomes of various Asteraceae members, generated using the maximum likelihood method. Numbers at nodes indicate bootstrap values (1000 repeats). The scale bar represents the expected number of nucleotide substitutions per site. Lactuca sativa was used as the outgroup.
A pairwise sequence divergence analysis of the complete cp genomes revealed that mainland A. spathulifolius was more distant from island A. spathulifolius (0.01214) than it was from the other Aster species, including A. tataricus (0.00287), A. indicus (0.00296), A. altaicus (0.00388), and A. hersileoides (0.00434) (Table S7). This is consistent with the result from phylogenetic analysis. To correctly delimit this species, we need to examine whether the geographical isolation of A. spathulifolius resulted in its reproductive isolation. In addition, the genetic distance and molecular phylogeny should be further addressed, using more markers in the nucleus and larger sample sizes.
In addition to cp genome, the nuclear ribosomal internal transcribed spacer regions (nrITS) have been extensively used as molecular markers for species identification and phylogenetic analysis. We revealed the nrITS sequence using the same procedure for cp genome and conducted phylogenetic analysis with the available nrITS sequences of A. spathulifolius populations and other Aster species (Figure S2). It was found that seven A. spathulifolius lines, including the mainland line, formed a monophyletic group and classified into two clades. Our mainland line was clustered with four A. spathulifolius lines, three of which were collected from three different locales in mainland [35] and one from unknown region. Another clade included two A. spathulifolius lines and Aster oharai. Two nrITS sequences in another clade were deposited in NCBI by that which characterized the cp genome of island line addressed here. Interestingly, A. oharai is distributed only in Dokdo island, the collection site of island A. spathulifolius, and its neighboring Ulleungdo island, and resembles A. spathulifolius [35]. The taxonomical position of A. oharai is not clear: it is regarded as the synonym of A. spathulifolius [36] or as a variety of A. spathulifolius [37]. Although the taxonomical status of A. spathulifolius and A. oharai needs to be further examined, our comparative and phylogenetic analyses suggest that the island line is more likely to be classified into A. oharai rather than A. spathulifolius.
2.2.7. Positive Selected Analysis
The protein-coding genes under positive selection within the Aster species compared to non-Aster species were identified based an optimized branch-site model [38] and Bayesian Empirical Bayes (BEB) methods [39]. No significant positive selection (p-value > 0.05) was observed in any genes (Table S8). However, two genes (accD and ndhF) showed significant posterior probabilities indicating positively selected sites according to the BEB test (Table S8). The Aster lineage specifically possessed proline at the amino acid position 17 of accD and isoleucine at 529 and leucine at 674 of ndhF (Figure 10). The positive selection on accD and ndhF was detected within the other plant lineages, including Cardamine [40] and Cucurbitaceae [41]. The accD gene encodes the β-carboxylase subunit of acetyl-CoA carboxylase and is responsible for catalysis of the first and rate-limiting step of lipid biosynthesis [42]. The accD gene was previously reported to influence leaf development and seed yield [43,44]. The ndhF gene encodes one subunit of NAD(P)H dehydrogenase (NDH) complex, and is responsible for electron transport chain to generate ATP in the photosynthesis process [45,46]. The ndhF gene was characterized to be under positive selection in the Australian lineage of Citrus and to contribute the adaptation to the hot and dry climate [47]. Although two genes showed significant mark of positive selection, the adaptive evolution and divergence of the Aster species in the specific ecological environment needs to be further addressed by molecular, physiological and ecological studies.
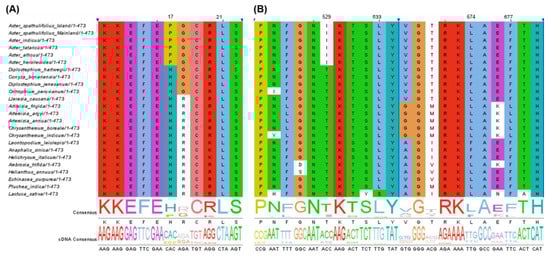
Figure 10.
The partial alignment of positively selected genes in the Aster species. Two genes were determined by branch-site model and Bayesian Empirical Bayes test. (A) The partial alignment of amino acid sequences of accD. (B) The partial alignment of amino acid sequences of ndhF.
3. Materials and Methods
3.1. Ethics Statement
The plant sample used in this study is neither endangered nor protected, and was collected from an area that was not privately owned or protected in any way. No specific permits were required to conduct this study.
3.2. Sample Collection and Sequencing
A. spathulifolius was collected from Yeoju-si, Gyeonggi-do, Republic of Korea (37°14′18′′ N, 127°41′10′′ E) and deposited in the National Agrobiodiversity Center, Rural Development Administration, under the accession number IT317814. Since the obtained plant was collected from the Korean peninsula, it is referred to as “mainland A. spathulifolius” throughout this manuscript, to distinguish it from the previously reported cp genome of A. spathulifolius native to Dokdo island, Republic of Korea [3].
Genomic DNA was extracted from fresh leaves as previously described [48]. The quantity and integrity of the DNA were checked using a spectrophotometer (NanoDrop 2000; Thermo Fisher Scientific, Waltham, MA, USA), gel electrophoresis on a 0.8% agarose gel, and a PicoGreen assay (Thermo Fisher Scientific, Waltham, MA USA). Using high-quality DNA, a 350-bp paired-end library was prepared using a TruSeq DNA PCR-Free kit (Illumina, San Diego, CA USA), after which it was sequenced at Macrogen (Republic of Korea) using an Illumina HiSeq4000 (Illumina, San Diego, CA, USA) with a 101-bp read length, following the manufacturer’s protocol.
3.3. Cp Genome Assembly, Annotation, and Sequence Analysis
The complete cp genome was determined using the dnaLCW (de novo assembly of low coverage whole-genome shotgun sequences) procedure [33]. Briefly, raw genomic reads were pre-processed using a Trimmomatic program [49], assembled using clc_assembler in CLC Genomics Workbench v6.0 (CLC Bio, Denmark) and gap-filled using GapCloser [50]. Cp-encoding contigs were BLASTn-searched against the cp genome of another Asteraceae species, Chrysanthemum boreale (NCBI ID MG913594) [51], and circularized by comparing the end sequences.
The cp sequences were annotated using Dual Organellar GenoMe Annotator (DOGMA), cpGAVAS v2.0, GeSeq and BLAST searches, and the start and stop codons were further checked and manually corrected if needed [52,53]. The tRNAscan-SE 2.0 (URL: http://lowelab.ucsc.edu/tRNAscan-SE/) was used with default settings, to predict and verify the tRNA structure [54]. OGDRAW v1.2 was used to generate a circular genome map with structural features [55]. The obtained cp genome was deposited in the National Center for Biotechnology Information (NCBI), under the accession number MN539621.
The codon usage bias was calculated using MEGA X [56]. For the protein-coding genes, the possible RNA-editing sites were predicted using the Predictive RNA Editor for Plant cp genes (PREP-Cp), with a cut-off score of 0.8 [57,58].
3.4. Comparative Genomic Analysis and Evaluation of highly Divergent Regions
The following complete cp genomes of five Aster species were downloaded from the NCBI database: island A. spathulifolius (KF279514), A. altaicus (NC_034996.1), A. hersileoides (MK290823), A. indicus (NC_040126.1), and A. tataricus (MH669275). After comparing gene sets between species, the genes that did not exist in the original annotation were searched by BLAST analysis.
The nucleotide diversities, sequence polymorphisms, and genome divergence among six Aster genomes were analyzed using DnaSP v6 [59]. The Ka and Ks substitutions, as well as the Ka/Ks ratio, were analyzed for each protein-coding gene pair between the mainland A. spathulifolius and other Aster sequences using DnaSP v6. Furthermore, the mainland A. spathulifolius cp genome was compared with the other cp genomes using the CCT [60]. Briefly, the cp genomes were compared using BLAST, then aligned and plotted as a circular map. GC distributions were measured on the basis of the GC skew, using the following equation: GC skew = (G − C)/(G + C). The pairwise sequence divergence of complete cp genome and protein-coding genes was calculated using MEGA X [56]. The mVISTA program was used in the Shuffle-LAGAN mode, to compare these cp genomes with the annotated mainland A. spathulifolius sequence [61].
3.5. Characterization of Repeat Sequences
SSRs were discovered using the online web tool MISA (http://pgrc.ipk-gatersleben.de/misa/) with the following parameters: ten for mononucleotide motifs, eight for di-nucleotide, four for tri- and tetra-nucleotide, and three for penta- and hexa-nucleotide motifs [62]. The REPuter program was used to identify the four different types of repeats (forward, reverse, complement, and palindromic repeats), using a minimum repeat size of 30 bp, a sequence identity > 90%, and Hamming distance of three [32]. To avoid redundancy, one copy of IR regions (IRa) was removed prior to LDR analysis.
3.6. Phylogenetic Analysis
The complete cp genomes of 23 species from the Asteraceae family were downloaded from the NCBI database and compared with the cp genome of the mainland A. spathulifolius plant, using BLASTn to check the orientation of the SSC sequences. For species with reversed SSC regions, the SSC sequences were reoriented. All the cp genomes were aligned using the Clustal Omega program [63] and subjected to a ML analysis using the IQ-TREE web server, with the model of TVM + F + I + G4 and 1000 bootstrap replicates.
3.7. Positive Selected Analysis
To identify the selection pressure on cp genes, an optimized branch-site model [38] and BEB methods [39] were used. The CDS sequences of all taxa were aligned using MUSCLE, with the option of codon alignment in MEGA X program [56] and exported into phylip format without gap sequences. The selection pressure was calculated with codeml in PAML v4.8 package [64]. The branch-site model was implemented by defining the Aster genus as foreground branch. The selection pressure was calculated into the Ka/Ks ratio named as ω. The value ω > 1, ω = 1, ω < 1 represents positive selection, neutral evolution, and purifying selection, respectively [65]. The log-likelihood values were calculated and tested [66]. The posterior probabilities of amino acid were calculated by the BEB method, to identify specific position under positive selection [39]. The gene with a significant test p-value < 0.05 or with positively selected sites was considered to be under positive selection. The amino acid sequences of positively selected genes were visualized with Jalview v.2.11 [67].
Supplementary Materials
The following are available online at https://www.mdpi.com/2223-7747/9/5/568/s1, Table S1. Predicted RNA-editing sites in the protein-coding genes of the mainland Aster spathulifolius chloroplast genome. Table S2. Analyses of the variable sites in the Aster chloroplast genomes. Table S3. Ka, Ks, and Ka/Ks values of 80 protein-coding genes from comparisons between mainland A. spathulifolius and five other Aster chloroplast genomes. Table S4. Number of simple sequence repeats and their positions in each Aster species. Table S5. Distribution of longer dispersed repeats in the six Aster chloroplast genome sequences. Table S6. Accession numbers of all the species used for the phylogenetic analysis and positive selected analysis. Table S7. Pairwise sequence divergence of the Aster chloroplast genomes. Table S8. The potential positive selection test based on the branch-site model. Figure S1. Comparison of the mainland Aster spathulifolius chloroplast genome with those of other Aster species using a CGView Comparison Tool analysis. From the outer ring: Ring 1: genes transcribed clockwise; Ring 2: genes transcribed counterclockwise; Ring 3: BLAST comparison of mainland A. spathulifolius and mainland A. spathulifolius; Ring 4: BLAST comparison of mainland A. spathulifolius and A. tataricus; Ring 5: BLAST comparison of mainland A. spathulifolius and A. indicus; Ring 6: BLAST comparison of mainland A. spathulifolius and A. altaicus; Ring 7: BLAST comparison of mainland A. spathulifolius and A. hersileoides; Ring 8: BLAST comparison of mainland A. spathulifolius and island A. spathulifolius; Ring 9: GC content; Ring 10: GCskew+; and Ring 11: GC skew–. Figure S2. Phylogenetic tree of nrITS sequences of various Aster species, generated using the maximum likelihood method. Numbers at nodes indicate bootstrap values (1000 repeats). The scale bar represents the expected number of nucleotide substitutions per site. Two Diplostephium species were used as the outgroup. The NCBI ID of sequences was shown next to species.
Author Contributions
S.T., J.-A.J., and S.Y.W. conceived and designed the experiments. J.-A.J. and S.Y.W. performed the experiments. J.-A.J., J.S.K., and S.Y.W. contributed reagents/materials/analysis tools. S.T. and S.Y.W. analyzed the data and wrote the manuscript. All authors revised the manuscript and approved the final manuscript.
Funding
This work was supported by the Cooperative Research Program for Agriculture Science and Technology Development (PJ01035802) and a grant from the National Institute of Agricultural Sciences (PJ01335301), Rural Development Administration, Republic of Korea.
Conflicts of Interest
The authors do not declare any conflicts of interest.
References
- Cho, I.J.; Choung, S.Y.; Hwang, Y.C.; Ahn, K.J.; Chung, H.Y.; Jeong, I.K. Aster spathulifolius Maxim extract reduces body weight and fat mass in obese humans. Nutr. Res. 2016, 36, 671–678. [Google Scholar] [CrossRef]
- Kim, S.J.; Choung, S.Y. Inhibitory effects of Aster spathulifolius extract on adipogenesis and lipid accumulation in 3T3-L1 preadipocytes. J. Pharm. Pharmacol. 2016, 68, 107–118. [Google Scholar] [CrossRef]
- Choi, K.S.; Park, S. The complete chloroplast genome sequence of Aster spathulifolius (Asteraceae); genomic features and relationship with Asteraceae. Gene 2015, 572, 214–221. [Google Scholar] [CrossRef]
- Maki, M.; Morita, H. Genetic diversity in island and mainland populations of Aster spathulifolius (Asteraceae). Int. J. Plant Sci. 1998, 159, 148–152. [Google Scholar] [CrossRef]
- Nguyen, H.T.T.; Choi, K.S.; Park, S. Genetic diversity and differentiation of a narrowly distributed and endemic species, Aster spathulifolius maxim (Asteraceae), revealed with inter simple sequence repeat markers. J. Korean Soc. Appl. Biol. Chem. 2013, 56, 255–262. [Google Scholar] [CrossRef]
- Petit, R.J.; Excoffier, L. Gene flow and species delimitation. Trends Ecol. Evol. 2009, 24, 386–393. [Google Scholar] [CrossRef] [PubMed]
- Asaf, S.; Waqas, M.; Khan, A.L.; Khan, M.A.; Kang, S.M.; Imran, Q.M.; Shahzad, R.; Bilal, S.; Yun, B.W.; Lee, I.J. The Complete Chloroplast Genome of Wild Rice (Oryza minuta) and Its Comparison to Related Species. Front. Plant Sci. 2017, 8, 304. [Google Scholar] [CrossRef] [PubMed]
- Menezes, A.P.A.; Resende-Moreira, L.C.; Buzatti, R.S.O.; Nazareno, A.G.; Carlsen, M.; Lobo, F.P.; Kalapothakis, E.; Lovato, M.B. Chloroplast genomes of Byrsonima species (Malpighiaceae): Comparative analysis and screening of high divergence sequences. Sci. Rep. 2018, 8, 2210. [Google Scholar] [CrossRef] [PubMed]
- Song, Y.; Chen, Y.; Lv, J.Z.; Xu, J.; Zhu, S.F.; Li, M.F. Comparative Chloroplast Genomes of Sorghum Species: Sequence Divergence and Phylogenetic Relationships. Biomed. Res. Int 2019, Artn 5046958. [Google Scholar] [CrossRef]
- Shen, X.F.; Guo, S.; Yin, Y.; Zhang, J.J.; Yin, X.M.; Liang, C.L.; Wang, Z.W.; Huang, B.F.; Liu, Y.H.; Xiao, S.M.; et al. Complete Chloroplast Genome Sequence and Phylogenetic Analysis of Aster tataricus. Molecules 2018, 23, 2426. [Google Scholar] [CrossRef]
- Li, W.P.; Yang, F.S.; Jivkova, T.; Yin, G.S. Phylogenetic relationships and generic delimitation of Eurasian Aster (Asteraceae: Astereae) inferred from ITS, ETS and trnL-F sequence data. Ann. Bot. 2012, 109, 1341–1357. [Google Scholar] [CrossRef] [PubMed]
- Geer, L.Y.; Marchler-Bauer, A.; Geer, R.C.; Han, L.; He, J.; He, S.; Liu, C.; Shi, W.; Bryant, S.H. The NCBI BioSystems database. Nucleic Acids Res. 2010, 38, D492–D496. [Google Scholar] [CrossRef] [PubMed]
- Nam, S.J.; Kim, J.-M.; Kim, Y.; Ku, J.-J.; Jung, S.-Y.; Lee, Y.-M.; Kim, S.-K.; Xi, H.; Song, J.-Y.; Park, J. The complete chloroplast genome of Korean endemic species, Cirsium rhinoceros (H.Lév. & vaniot) Nakai (Asteraceae). Mitochondrial DNA Part. B 2019, 4, 2351–2352. [Google Scholar] [CrossRef]
- Kikuchi, S.; Bedard, J.; Hirano, M.; Hirabayashi, Y.; Oishi, M.; Imai, M.; Takase, M.; Ide, T.; Nakai, M. Uncovering the Protein Translocon at the Chloroplast Inner Envelope Membrane. Science 2013, 339, 571–574. [Google Scholar] [CrossRef] [PubMed]
- Dong, W.P.; Xu, C.; Li, C.H.; Sun, J.H.; Zuo, Y.J.; Shi, S.; Cheng, T.; Guo, J.J.; Zhou, S.L. ycf1, the most promising plastid DNA barcode of land plants. Sci. Rep. 2015, 5. [Google Scholar] [CrossRef]
- Yang, Z.; Zhao, T.; Ma, Q.; Liang, L.; Wang, G. Comparative Genomics and Phylogenetic Analysis Revealed the Chloroplast Genome Variation and Interspecific Relationships of Corylus (Betulaceae) Species. Front. Plant Sci. 2018, 9, 927. [Google Scholar] [CrossRef]
- Small, I.D.; Schallenberg-Rüdinger, M.; Takenaka, M.; Mireau, H.; Ostersetzer-Biran, O. Plant organellar RNA editing: What 30 years of research has revealed. Plant J. 2020, 101, 1040–1056. [Google Scholar] [CrossRef]
- Raman, G.; Park, S. Analysis of the Complete Chloroplast Genome of a Medicinal Plant, Dianthus superbus var. longicalyncinus, from a Comparative Genomics Perspective. PLoS ONE 2015, 10, e0141329. [Google Scholar] [CrossRef]
- Raman, G.; Park, S.; Lee, E.M.; Park, S. Evidence of mitochondrial DNA in the chloroplast genome of Convallaria keiskei and its subsequent evolution in the Asparagales. Sci. Rep. 2019, 9, 5028. [Google Scholar] [CrossRef]
- Rawal, H.C.; Kumar, P.M.; Bera, B.; Singh, N.K.; Mondal, T.K. Decoding and analysis of organelle genomes of Indian tea (Camellia assamica) for phylogenetic confirmation. Genomics 2019. [Google Scholar] [CrossRef]
- Li, M.; Xia, L.; Zhang, Y.; Niu, G.; Li, M.; Wang, P.; Zhang, Y.; Sang, J.; Zou, D.; Hu, S.; et al. Plant editosome database: A curated database of RNA editosome in plants. Nucleic Acids Res. 2018, 47, D170–D174. [Google Scholar] [CrossRef] [PubMed]
- Sugiura, M.; Hirose, T.; Sugita, M. Evolution and mechanism of translation in chloroplasts. Annu. Rev. Genet. 1998, 32, 437–459. [Google Scholar] [CrossRef] [PubMed]
- Zandueta-Criado, A.; Bock, R. Surprising features of plastid ndhD transcripts: Addition of non-encoded nucleotides and polysome association of mRNAs with an unedited start codon. Nucleic Acids Res. 2004, 32, 542–550. [Google Scholar] [CrossRef] [PubMed]
- Doyle, J.J.; Davis, J.I.; Soreng, R.J.; Garvin, D.; Anderson, M.J. Chloroplast DNA Inversions and the Origin of the Grass Family (Poaceae). Proc. Natl. Acad. Sci. USA 1992, 89, 7722–7726. [Google Scholar] [CrossRef] [PubMed]
- Daniell, H.; Lin, C.S.; Yu, M.; Chang, W.J. Chloroplast genomes: Diversity, evolution, and applications in genetic engineering. Genome Biol. 2016, 17, 134. [Google Scholar] [CrossRef]
- Hao, D.C.; Chen, S.L.; Xiao, P.G.J.J.o.P.R. Molecular evolution and positive Darwinian selection of the chloroplast maturase matK. J. Plant Res. 2010, 123, 241–247. [Google Scholar] [CrossRef]
- Liu, X.; Chang, E.-M.; Liu, J.-F.; Huang, Y.-N.; Wang, Y.; Yao, N.; Jiang, Z.-P. Complete Chloroplast Genome Sequence and Phylogenetic Analysis of Quercus bawanglingensis Huang, Li et Xing, a Vulnerable Oak Tree in China. Forests 2019, 10, 587. [Google Scholar] [CrossRef]
- Van der Burgt, A.; Karimi Jashni, M.; Bahkali, A.H.; de Wit, P.J. Pseudogenization in pathogenic fungi with different host plants and lifestyles might reflect their evolutionary past. Mol. Plant Pathol. 2014, 15, 133–144. [Google Scholar] [CrossRef]
- Xie, J.; Chen, S.; Xu, W.; Zhao, Y.; Zhang, D. Origination and Function of Plant Pseudogenes. Plant Signal. Behav. 2019, 14, 1625698. [Google Scholar] [CrossRef]
- Mahmudi, O.; Sennblad, B.; Arvestad, L.; Nowick, K.; Lagergren, J. Gene-pseudogene evolution: A probabilistic approach. BMC Genom. 2015, 16 (Suppl. S10), S12. [Google Scholar] [CrossRef]
- Pauwels, M.; Vekemans, X.; Gode, C.; Frerot, H.; Castric, V.; Saumitou-Laprade, P. Nuclear and chloroplast DNA phylogeography reveals vicariance among European populations of the model species for the study of metal tolerance, Arabidopsis halleri (Brassicaceae). New Phytol. 2012, 193, 916–928. [Google Scholar] [CrossRef] [PubMed]
- Kurtz, S.; Choudhuri, J.V.; Ohlebusch, E.; Schleiermacher, C.; Stoye, J.; Giegerich, R. REPuter: The manifold applications of repeat analysis on a genomic scale. Nucleic Acids Res. 2001, 29, 4633–4642. [Google Scholar] [CrossRef] [PubMed]
- Kim, K.; Lee, S.C.; Lee, J.; Yu, Y.; Yang, K.; Choi, B.S.; Koh, H.J.; Waminal, N.E.; Choi, H.I.; Kim, N.H.; et al. Complete chloroplast and ribosomal sequences for 30 accessions elucidate evolution of Oryza AA genome species. Sci. Rep. 2015, 5, 15655. [Google Scholar] [CrossRef] [PubMed]
- Meng, D.; Xiaomei, Z.; Wenzhen, K.; Xu, Z. Detecting useful genetic markers and reconstructing the phylogeny of an important medicinal resource plant, Artemisia selengensis, based on chloroplast genomics. PLoS ONE 2019, 14, e0211340. [Google Scholar] [CrossRef] [PubMed]
- Shin, H.; Oh, S.-H.; Lim, Y.; Hyun, C.-W.; Cho, S.-H.; Kim, Y.-I.; Kim, Y.-D. Molecular evidence for hybrid origin of Aster chusanensis, an endemic species of Ulleungdo, Korea. J. Plant Biol. 2014, 57, 174–185. [Google Scholar] [CrossRef]
- Ohwi, J. Flora of Japan (rev. ed.); Shibundo: Tokyo, Japan, 1975. [Google Scholar]
- Lee, Y.N. New taxa on Korean flora (6). Korean J. Plant Taxon. 1998, 28, 25–39. [Google Scholar] [CrossRef]
- Yang, Z.; Dos Reis, M. Statistical properties of the branch-site test of positive selection. Mol. Biol. Evol. 2010, 28, 1217–1228. [Google Scholar] [CrossRef]
- Yang, Z.; Wong, W.S.; Nielsen, R. Bayes empirical Bayes inference of amino acid sites under positive selection. Mol. Biol. Evol. 2005, 22, 1107–1118. [Google Scholar] [CrossRef]
- Hu, S.; Sablok, G.; Wang, B.; Qu, D.; Barbaro, E.; Viola, R.; Li, M.; Varotto, C. Plastome organization and evolution of chloroplast genes in Cardamine species adapted to contrasting habitats. BMC Genom. 2015, 16, 306. [Google Scholar] [CrossRef]
- Shi, H.; Yang, M.; Mo, C.; Xie, W.; Liu, C.; Wu, B.; Ma, X. Complete chloroplast genomes of two Siraitia Merrill species: Comparative analysis, positive selection and novel molecular marker development. PLoS ONE 2019, 14, e0226865. [Google Scholar] [CrossRef]
- Salie, M.J.; Thelen, J. Regulation and structure of the heteromeric acetyl-CoA carboxylase. Biochim. Biophys. Acta -Mol. Cell Biol. Lipids 2016, 1861, 1207–1213. [Google Scholar] [CrossRef] [PubMed]
- Madoka, Y.; Tomizawa, K.-I.; Mizoi, J.; Nishida, I.; Nagano, Y.; Sasaki, Y. Chloroplast Transformation with Modified accD Operon Increases Acetyl-CoA Carboxylase and Causes Extension of Leaf Longevity and Increase in Seed Yield in Tobacco. Plant Cell Physiol. 2002, 43, 1518–1525. [Google Scholar] [CrossRef] [PubMed]
- Kode, V.; Mudd, E.A.; Iamtham, S.; Day, A. The tobacco plastid accD gene is essential and is required for leaf development. Plant J. 2005, 44, 237–244. [Google Scholar] [CrossRef]
- Weiss, H.; Friedrich, T.; Hofhaus, G.; Preis, D. The respiratory-chain NADH dehydrogenase (complex I) of mitochondria. In EJB Reviews 1991; Springer: Berlin, Germany, 1991; pp. 55–68. [Google Scholar]
- Peng, L.; Yamamoto, H.; Shikanai, T. Structure and biogenesis of the chloroplast NAD (P) H dehydrogenase complex. Biochim. Biophys. Acta -Bioenerg. 2011, 1807, 945–953. [Google Scholar] [CrossRef] [PubMed]
- Carbonell-Caballero, J.; Alonso, R.; Ibañez, V.; Terol, J.; Talon, M.; Dopazo, J. A Phylogenetic Analysis of 34 Chloroplast Genomes Elucidates the Relationships between Wild and Domestic Species within the Genus Citrus. Mol. Biol. Evol. 2015, 32, 2015–2035. [Google Scholar] [CrossRef]
- Kim, J.S.; Chung, T.Y.; King, G.J.; Jin, M.; Yang, T.-J.; Jin, Y.-M.; Kim, H.-I.; Park, B.-S. A sequence-tagged linkage map of Brassica rapa. Genetics 2006, 174, 29–39. [Google Scholar] [CrossRef]
- Bolger, A.M.; Lohse, M.; Usadel, B. Trimmomatic: A flexible trimmer for Illumina sequence data. Bioinformatics (Oxford, England) 2014, 30, 2114–2120. [Google Scholar] [CrossRef]
- Luo, R.; Liu, B.; Xie, Y.; Li, Z.; Huang, W.; Yuan, J.; He, G.; Chen, Y.; Pan, Q.; Liu, Y.; et al. SOAPdenovo2: An empirically improved memory-efficient short-read de novo assembler. Gigascience 2012, 1, 18. [Google Scholar] [CrossRef]
- Won, S.Y.; Jung, J.A.; Kim, J.S. The complete chloroplast genome of Chrysanthemum boreale (Asteraceae). Mitochondrial DNA B 2018, 3, 549–550. [Google Scholar] [CrossRef]
- Shi, L.; Chen, H.; Jiang, M.; Wang, L.; Wu, X.; Huang, L.; Liu, C. CPGAVAS2, an integrated plastome sequence annotator and analyzer. Nucleic Acids Res. 2019, 47, W65–W73. [Google Scholar] [CrossRef]
- Wyman, S.K.; Jansen, R.K.; Boore, J.L. Automatic annotation of organellar genomes with DOGMA. Bioinformatics 2004, 20, 3252–3255. [Google Scholar] [CrossRef] [PubMed]
- Schattner, P.; Brooks, A.N.; Lowe, T.M. The tRNAscan-SE, snoscan and snoGPS web servers for the detection of tRNAs and snoRNAs. Nucleic Acids Res. 2005, 33, W686–W689. [Google Scholar] [CrossRef] [PubMed]
- Lohse, M.; Drechsel, O.; Kahlau, S.; Bock, R. OrganellarGenomeDRAW--a suite of tools for generating physical maps of plastid and mitochondrial genomes and visualizing expression data sets. Nucleic Acids Res. 2013, 41, W575–W581. [Google Scholar] [CrossRef] [PubMed]
- Kumar, S.; Stecher, G.; Li, M.; Knyaz, C.; Tamura, K. MEGA X: Molecular Evolutionary Genetics Analysis across Computing Platforms. Mol. Biol. Evol. 2018, 35, 1547–1549. [Google Scholar] [CrossRef] [PubMed]
- Mower, J.P. The PREP suite: Predictive RNA editors for plant mitochondrial genes, chloroplast genes and user-defined alignments. Nucleic Acids Res. 2009, 37, W253–W259. [Google Scholar] [CrossRef] [PubMed]
- Wang, M.X.; Liu, H.; Ge, L.Q.; Xing, G.W.; Wang, M.; Song, W.N.; Nie, X.J. Identification and Analysis of RNA Editing Sites in the Chloroplast Transcripts of Aegilops tauschii L. Genes-Basel 2017, 8, 13. [Google Scholar] [CrossRef]
- Rozas, J.; Ferrer-Mata, A.; Sanchez-DelBarrio, J.C.; Guirao-Rico, S.; Librado, P.; Ramos-Onsins, S.E.; Sanchez-Gracia, A. DnaSP 6: DNA Sequence Polymorphism Analysis of Large Data Sets. Mol. Biol. Evol. 2017, 34, 3299–3302. [Google Scholar] [CrossRef]
- Grant, J.R.; Stothard, P. The CGView Server: A comparative genomics tool for circular genomes. Nucleic Acids Res. 2008, 36, W181–W184. [Google Scholar] [CrossRef]
- Frazer, K.A.; Pachter, L.; Poliakov, A.; Rubin, E.M.; Dubchak, I. VISTA: Computational tools for comparative genomics. Nucleic Acids Res. 2004, 32, W273–W279. [Google Scholar] [CrossRef]
- Beier, S.; Thiel, T.; Munch, T.; Scholz, U.; Mascher, M. MISA-web: A web server for microsatellite prediction. Bioinformatics 2017, 33, 2583–2585. [Google Scholar] [CrossRef]
- Sievers, F.; Wilm, A.; Dineen, D.; Gibson, T.J.; Karplus, K.; Li, W.; Lopez, R.; McWilliam, H.; Remmert, M.; Soding, J.; et al. Fast, scalable generation of high-quality protein multiple sequence alignments using Clustal Omega. Mol. Syst. Biol. 2011, 7, 539. [Google Scholar] [CrossRef] [PubMed]
- Yang, Z. PAML 4: Phylogenetic analysis by maximum likelihood. Mol. Biol. Evol. 2007, 24, 1586–1591. [Google Scholar] [CrossRef] [PubMed]
- Yang, Z.; Nielsen, R. Codon-substitution models for detecting molecular adaptation at individual sites along specific lineages. Mol. Biol. Evol. 2002, 19, 908–917. [Google Scholar] [CrossRef]
- Lan, Y.; Sun, J.; Tian, R.; Bartlett, D.H.; Li, R.; Wong, Y.H.; Zhang, W.; Qiu, J.W.; Xu, T.; He, L.S.J.M. Molecular adaptation in the world’s deepest-living animal: Insights from transcriptome sequencing of the hadal amphipod Hirondellea gigas. Mol. Ecol. 2017, 26, 3732–3743. [Google Scholar] [CrossRef] [PubMed]
- Waterhouse, A.M.; Procter, J.B.; Martin, D.M.; Clamp, M.; Barton, G. Jalview Version 2—A multiple sequence alignment editor and analysis workbench. Bioinformatics 2009, 25, 1189–1191. [Google Scholar] [CrossRef] [PubMed]
© 2020 by the authors. Licensee MDPI, Basel, Switzerland. This article is an open access article distributed under the terms and conditions of the Creative Commons Attribution (CC BY) license (http://creativecommons.org/licenses/by/4.0/).