Proteome Profiling of the Mutagen-Induced Morphological and Yield Macro-Mutant Lines of Nigella sativa L.


 and
and
Abstract
:1. Introduction
2. Results
2.1. Standardization of Protein Isolation Methods
2.2. Proteome Profiling of Macro-Mutant Lines
2.2.1. Number of Differentially Expressed Proteins in the Leaves of the Mutant Lines of Nigella sativa
2.2.2. Identification and Expression Patterns of Differentially Expressed Proteins of Mutant lines
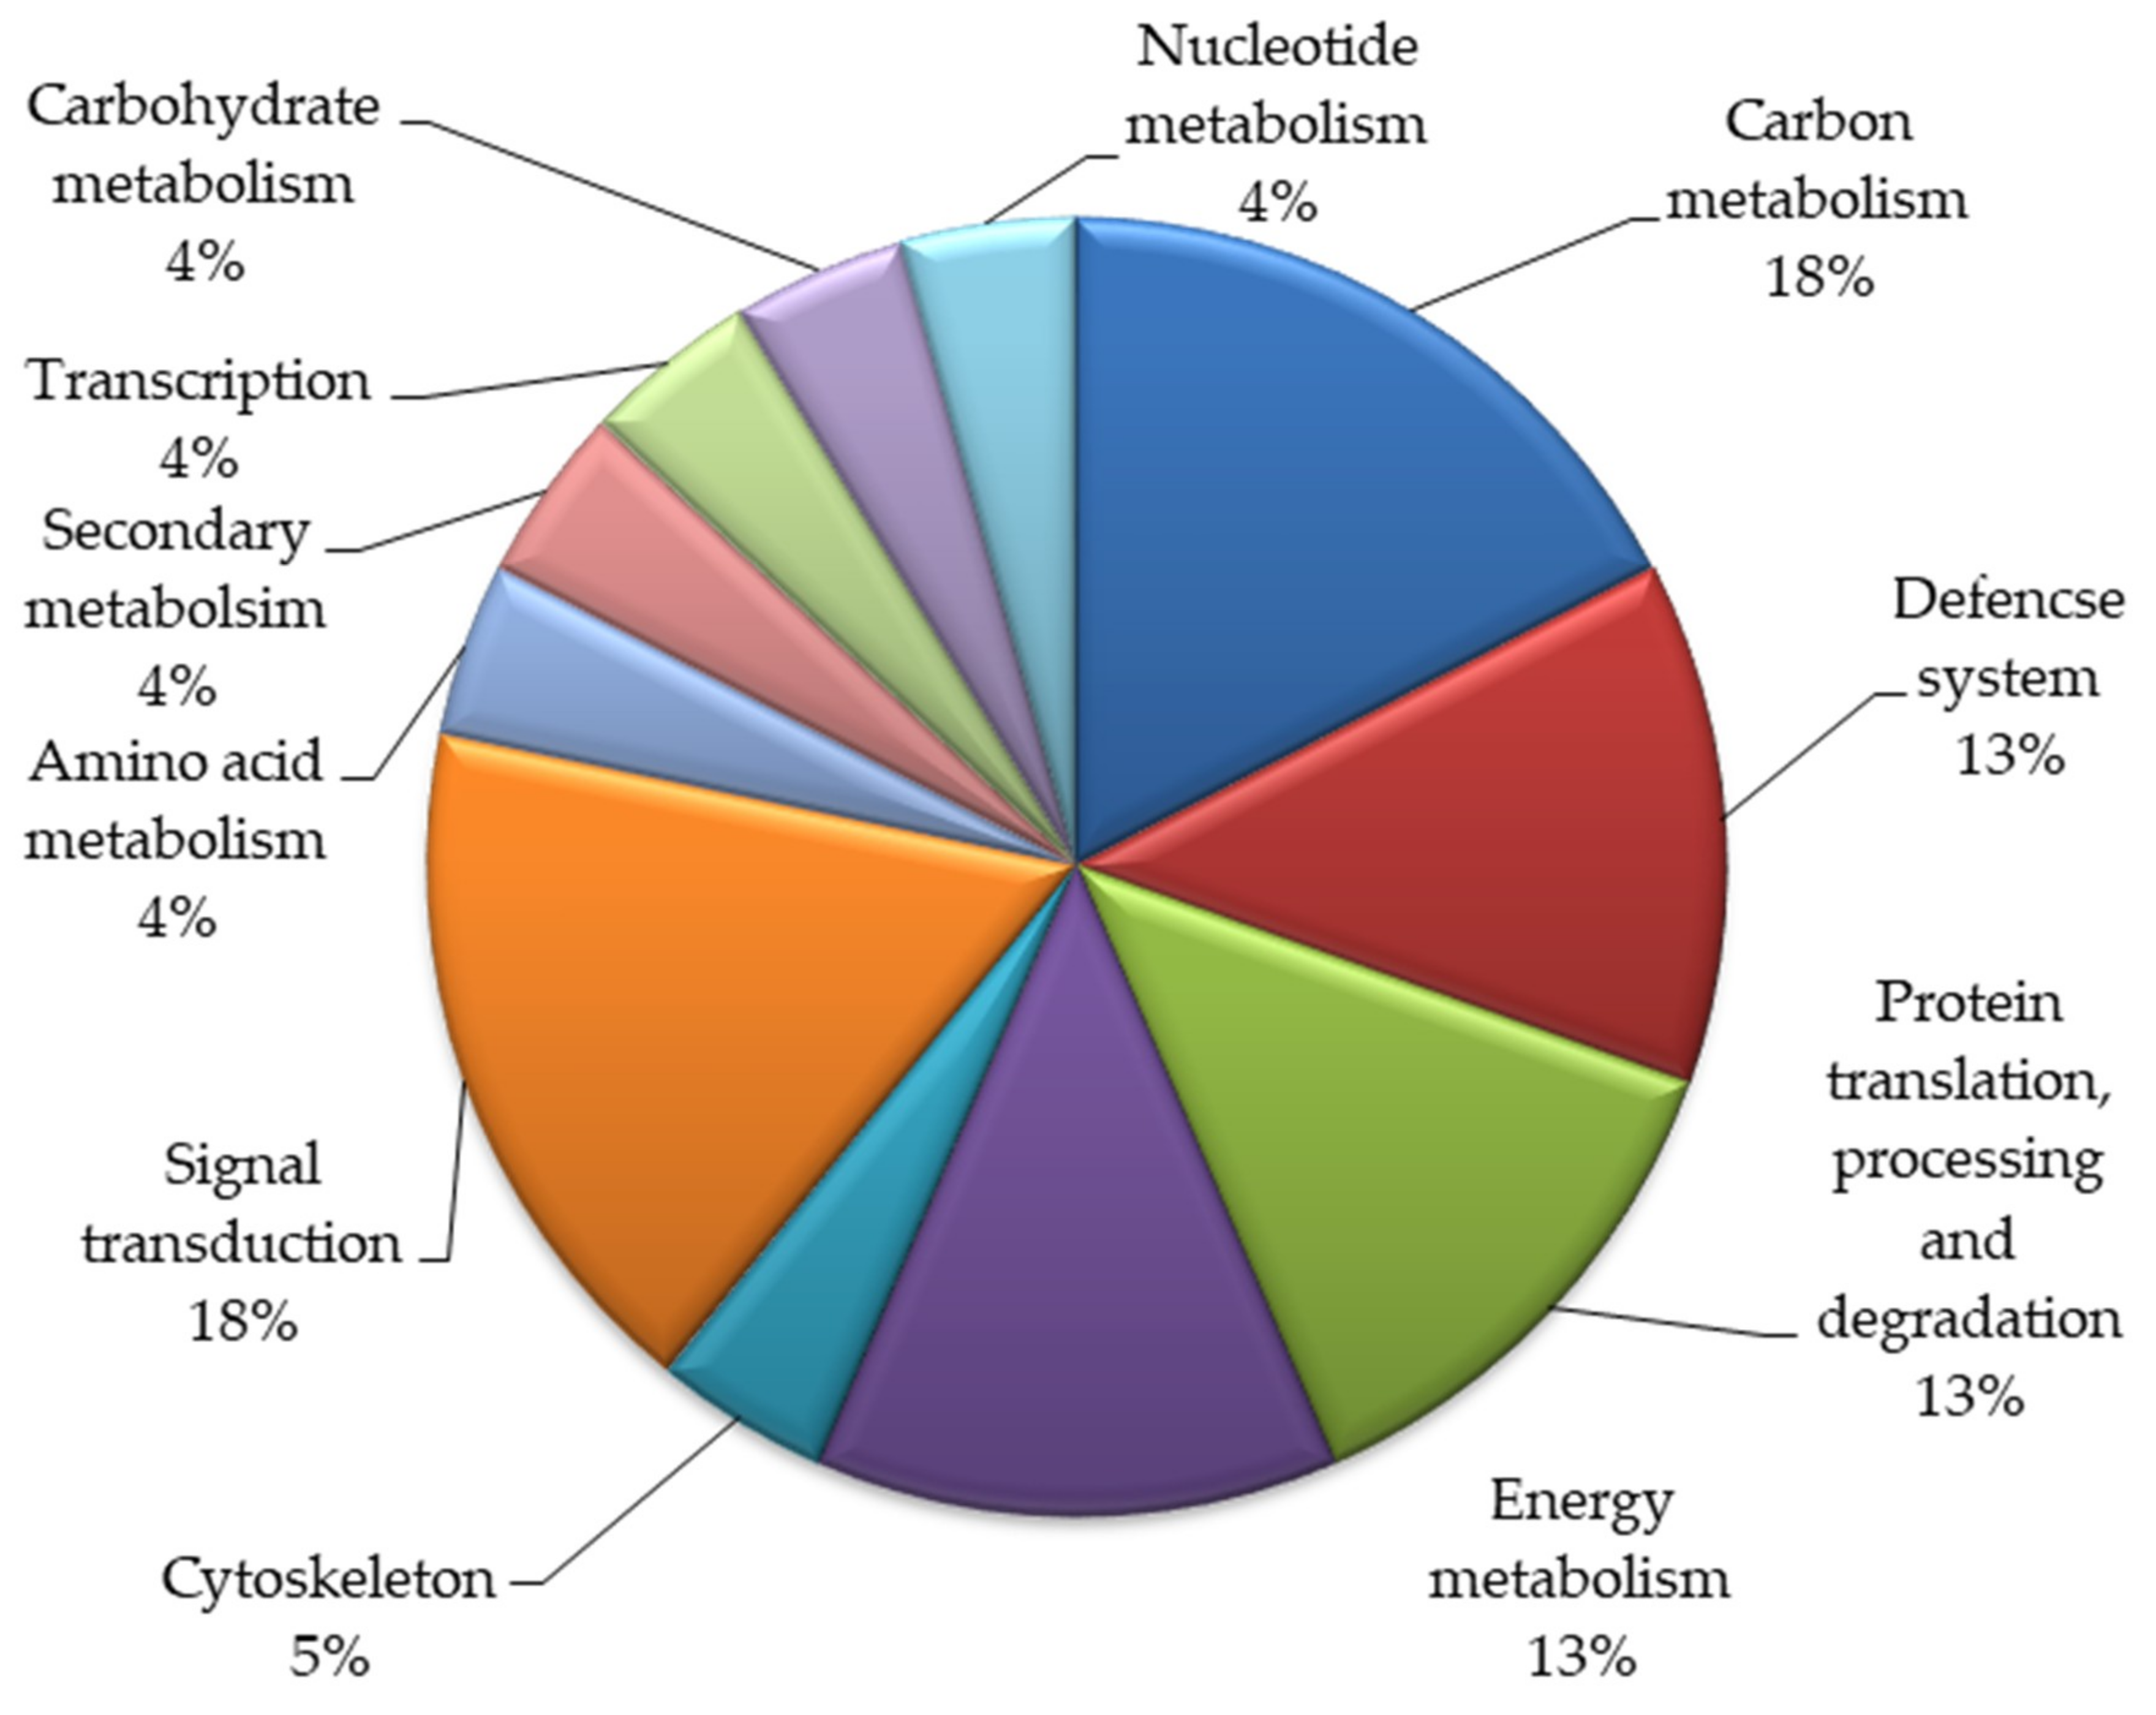
2.2.3. Functional Categorization of Differentially Expressed Proteins
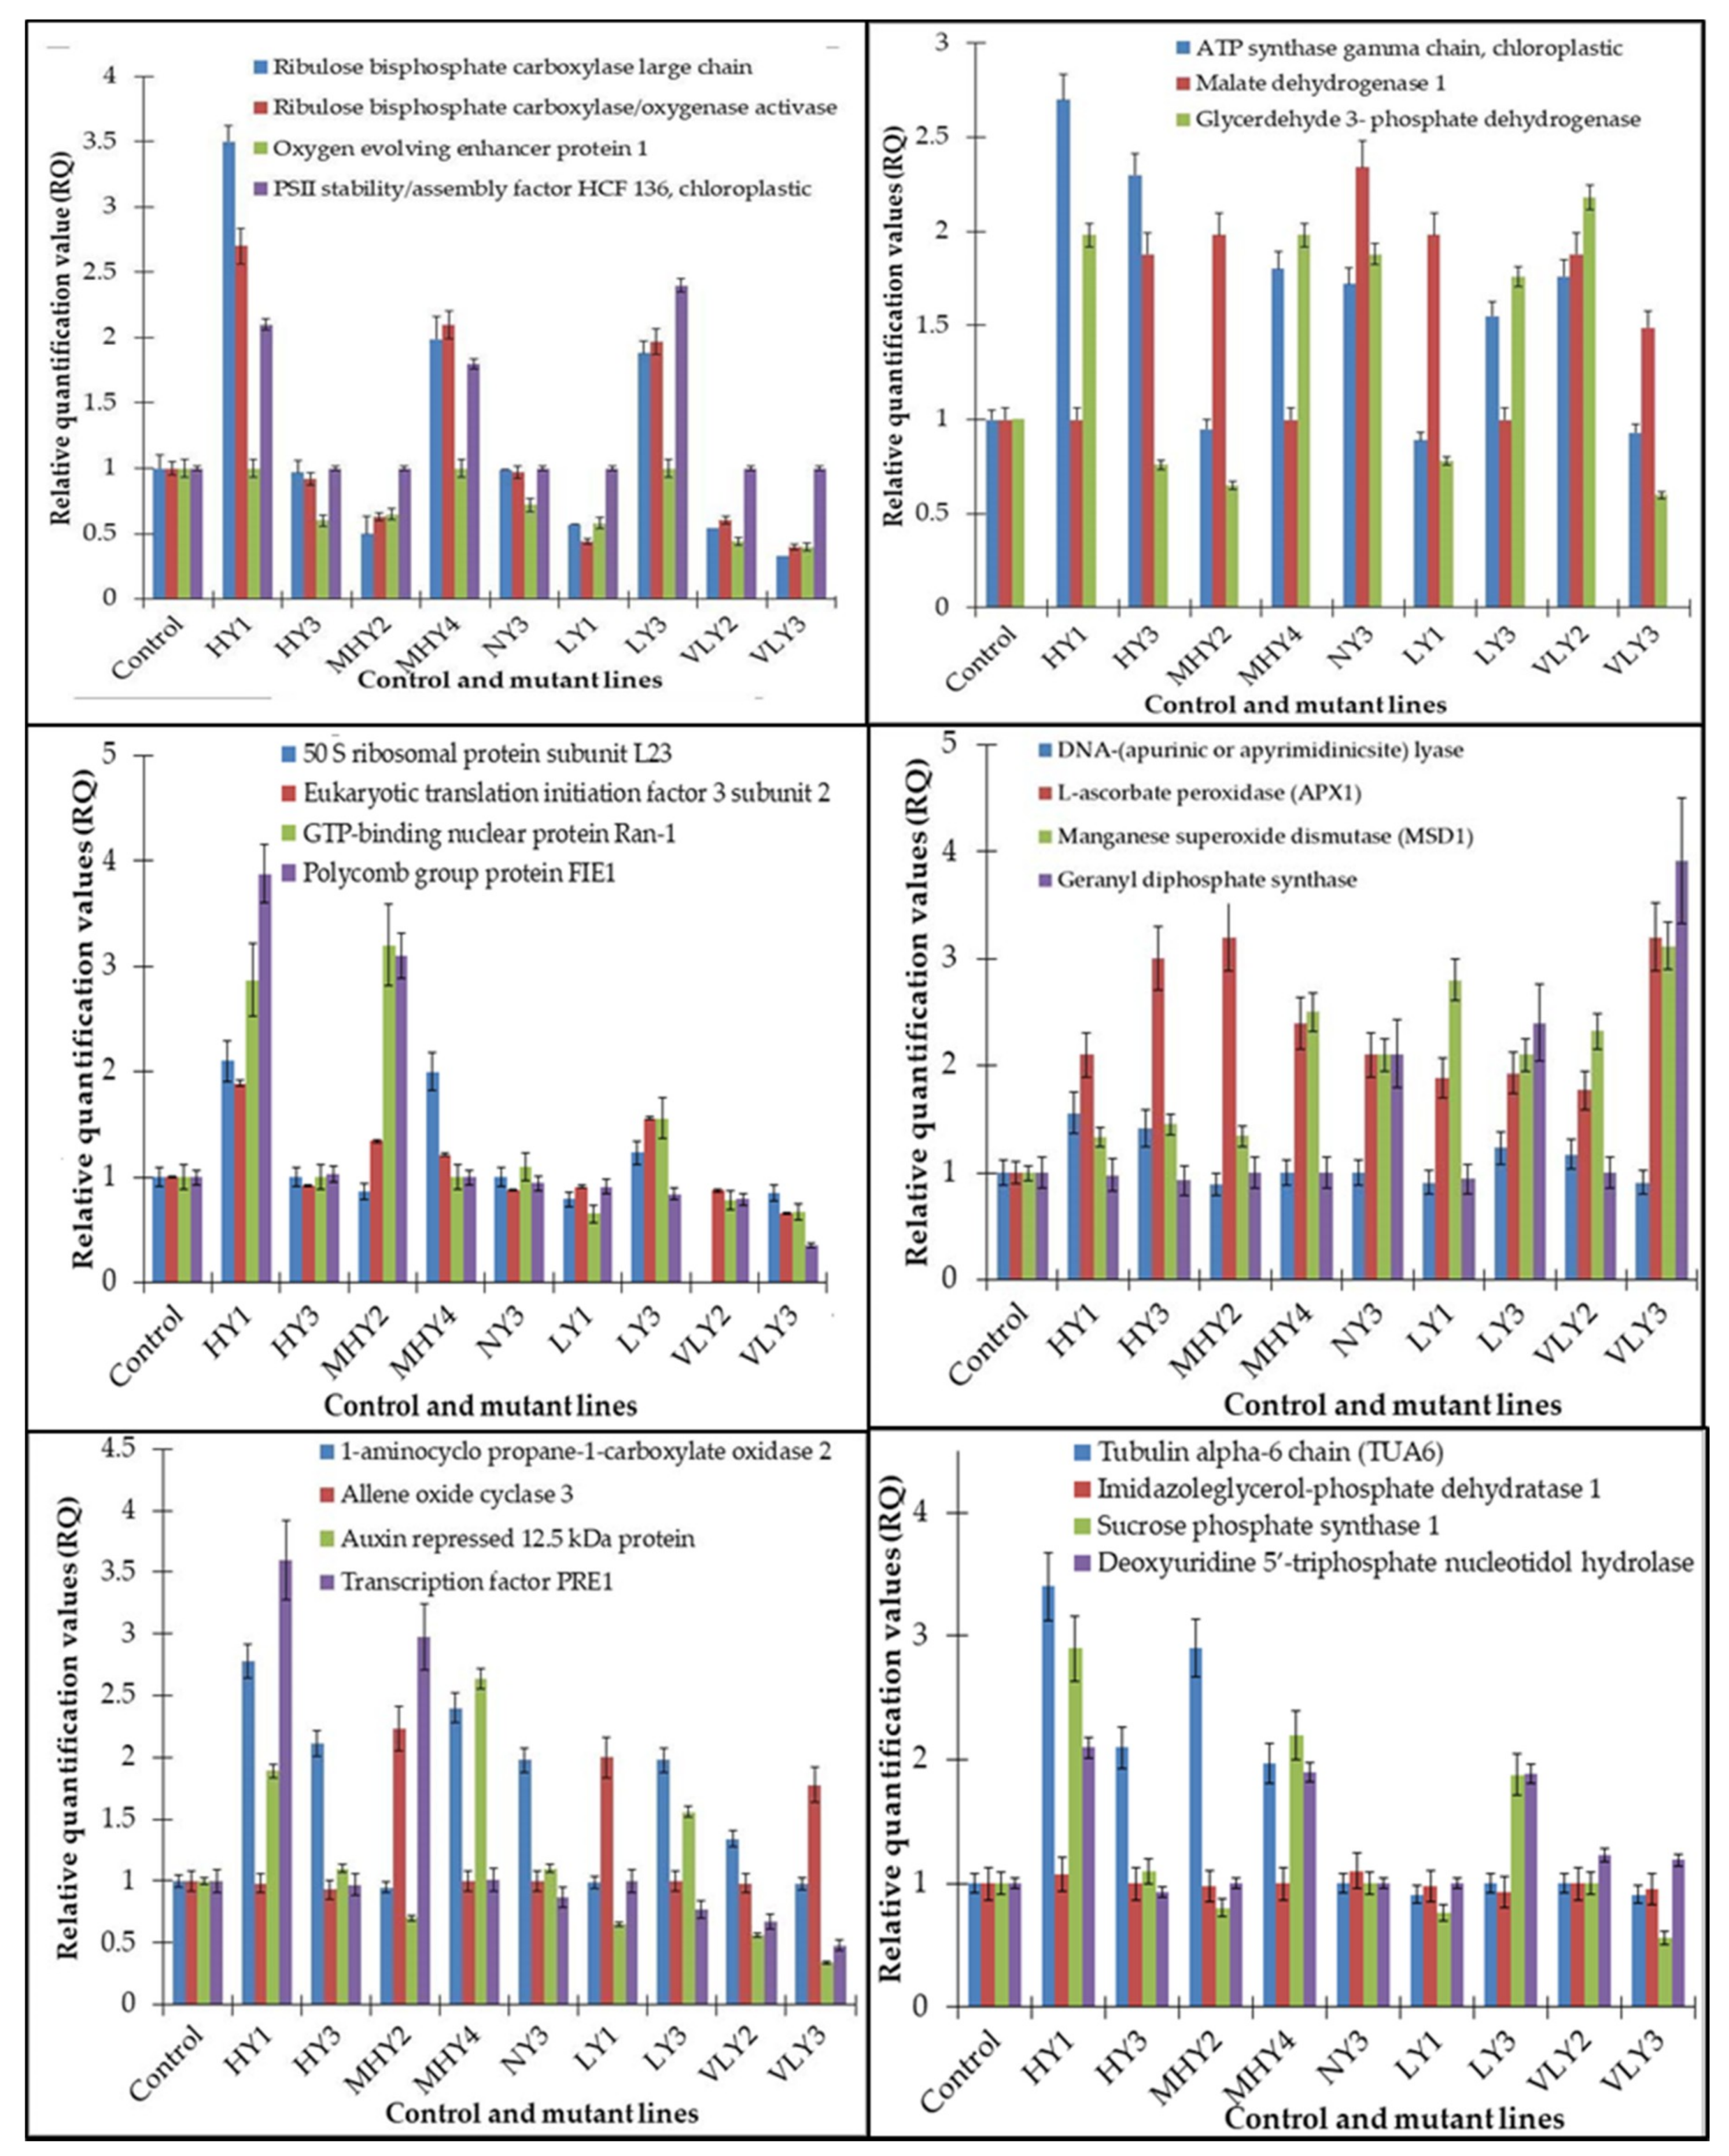
2.2.4. Expression of the Genes Encoding Differentially Expressed Proteins
3. Discussion
4. Materials and Methods
4.1. The Macro-Mutant Lines of Nigella sativa L.
4.2. Analysis of the Proteome Profile of the Macro-Mutant Lines
4.2.1. Standardization of Protocols for Protein Isolation
4.2.2. Quantification of Isolated Protein
4.2.3. Two-Dimensional Gel Electrophoresis
4.2.4. Gel Imaging and Statistical Analysis
4.2.5. In-Gel Reduction
4.2.6. Identification and Functional Categorization of Differentially Expressed Proteins
4.3. Gene-Specific qRT-PCR
4.4. Statistical Analyses
5. Conclusions
Supplementary Materials
Author Contributions
Funding
Acknowledgments
Conflicts of Interest
Abbreviations
| EMS | Ethyl methyl sulfonate |
| 2DE | Two dimensional gel electrophoresis |
| MALDI-TOF | Matrix assisted laser desorption/ionization-time of flight |
| CBB | Coomassie Brilliant Blue |
| RT-PCR | Real-time PCR |
References
- Davidson-Hunt, I. Ecological ethnobotany: Stumbling toward new practices and paradigms. MASA J. 2000, 16, 1–13. [Google Scholar]
- Joshi, N.B.; Shankar, M.B. Global market analysis of herbal drug formulations. Int. J. Ayurveda Pharm. Chem. 2015, 4, 59–65. [Google Scholar]
- Kolakar, S.S.; Sadashiv, N.; Shridevi, A.J.; Lakshmana, D.; Hanumanthappa, M.; Gangaprasad, S. Role of mutation breeding in improvement of medicinal and aromatic crops: Review. J. Pharmacog. Phytochem. 2018, SP3, 425–429. [Google Scholar]
- Adamu, A.K.; Aliyu, H. Morphological effects of sodium azide on tomato (Lycopersicon esculentum Mill.). Sci. World J. 2007, 2, 9–12. [Google Scholar]
- Mostafa, G.G. Effect of sodium azide on the growth and variability induction in Helianthus annuus L. Int. J. Plant Breed. Genet. 2011, 5, 76–85. [Google Scholar] [CrossRef]
- Kozgar, M.I.; Khan, S.; Wani, M.R. Variability and correlations studies for total iron and manganese contents of chickpea (Cicer arietinum L.) high yielding mutants. Am. J. Food Technol. 2012, 7, 437–444. [Google Scholar] [CrossRef]
- Gilani, A.; Jabeen, Q.; Ullahkhan, M. A review of medicinal uses and pharmacological activities of Nigella sativa. Pak. J. Biol. Sci. 2004, 7, 441–451. [Google Scholar]
- Rajsekhar, S.; Kuldeep, B. Pharmacognosy and pharmacology of Nigella sativa—A review. Int. Res. J. Pharm. 2011, 2, 36–39. [Google Scholar]
- Ziaee, T.; Moharreri, N.; Hosseinzadeh, H. Review of pharmacological and toxicological effects of Nigella sativa and its active constituents. J. Med. Plants 2012, 11, 16–42. [Google Scholar]
- Razavi, B.M.; Hosseinzadeh, H. A review of the effects of Nigella sativa L. and its constituent, thymoquinone, in metabolic syndrome. J. Endocrinol. Investig. 2014, 37, 1031–1040. [Google Scholar] [CrossRef]
- Mazaheri, Y.; Torbati, M.; Azadmard-Damirchi, S.; Savage, G.P. A comprehensive review of the physicochemical, quality and nutritional properties of Nigella sativa oil. Food Rev. Int. 2019. [Google Scholar] [CrossRef]
- Ahuja, K.; Singh, S. Black Seed Oil Market Size, Price Trend, Competitive Market Share and Forecast; Global Market Insights, Inc.: Selbyville, DE, USA, 2019. [Google Scholar]
- Mirzaei, K.; Mirzaghaderi, G. Genetic diversity analysis of Iranian Nigella sativa L. landraces using SCoT markers and evaluation of adjusted polymorphism information content. Plant Genet. Resour. Charact. Util. 2017, 15, 64–71. [Google Scholar] [CrossRef]
- Sawarkar, S.; Kumarappan, A.; Malakar, J.; Verma, H.N. Genetic diversity of Nigella sativa from different geographies using RAPD markers. Am. J. Life Sci. 2016, 4, 175. [Google Scholar]
- Asif, A.; Ansari, M.Y.K. Generation of mutant lines of Nigella sativa L. by induced mutagenesis for improved seed yield. Ind. Crops Prod. 2019, 139, 111552. [Google Scholar] [CrossRef]
- Asif, A.; Ansari, M.Y.K. Effect of ethyl methane sulphonate on the chromosomal behaviour of Nigella sativa. Int. J. Biol. Sci. 2018, 10, 10–15. [Google Scholar]
- Sharma, J.R.; Lal, R.K.; Gupta, A.P.; Misra, H.O.; Pant, V.; Singh, N.K.; Pandey, V. Development of non-narcotic (opiumless and alkaloid-free) opium poppy, Papaver somniferum. Plant Breed. 2008, 118, 449–452. [Google Scholar] [CrossRef]
- Kumar, S.; Rai, S.P.; Kumar, S.R.; Singh, D.; Srivastava, S.; Mishra, R.K. Plant Variety of Catharanthus Roseus Named ‘lli’. U.S. Patent USPP18315P3, 18 December 2007. [Google Scholar]
- Baskaran, K.; Srinivas, K.V.N.S.; Kulkarni, R.N. Two induced macro-mutants of periwinkle with enhanced contents of leaf and root alkaloids and their inheritance. Ind. Crops Prod. 2013, 43, 701–703. [Google Scholar] [CrossRef]
- Ahloowalia, B.S.; Maluszynski, M.; Nichterlein, K. Global impact of mutation-derived varieties. Euphytica 2004, 135, 187–204. [Google Scholar] [CrossRef]
- Floria, F.; Ichim, M.C. High yielding opium poppy (Papaver somniferum L.) mutant lines. Plant Mutat. Rep. 2006, 1, 28. [Google Scholar]
- Lee, B.; Choi, G.; Choi, Y.; Sung, M.; Park, M.S.; Yang, J. Enhancement of lipid productivity by ethyl methane sulfonate-mediated random mutagenesis and proteomic analysis in Chlamydomonas reinhardtii. Korean J. Chem. Eng. 2014, 31, 1036–1042. [Google Scholar] [CrossRef]
- Faurobert, M.; Pelpoir, E.; Chaib, J. Phenol extraction of proteins for proteomic studies of recalcitrant plant tissues. Methods Mol. Biol. 2007, 355, 9–14. [Google Scholar] [PubMed]
- Görg, A.; Obermaier, C.; Boguth, G.; Weiss, W. Recent developments in two-dimensional gel electrophoresis with immobilized pH gradients: Wide pH gradients up to pH 12, longer separation distances and simplified procedures. Electrophoresis 1999, 20, 712–717. [Google Scholar] [CrossRef]
- Wen, L.; Liu, G.; Zhang, Z.-J.; Tao, J.; Wan, C.-X.; Zhu, Y.-G. Preliminary proteomics analysis of the total proteins of HL Type cytoplasmic male sterility rice anther. Yi Chuan 2006, 28, 311–316. [Google Scholar] [PubMed]
- Ogren, W.L.; Bowes, G. Ribulose diphosphate carboxylase regulates soybean photorespiration. Nat. New Biol. 1971, 230, 159–160. [Google Scholar] [CrossRef] [PubMed]
- Farquhar, G.V.; von Caemmerer, S.V.; Berry, J.A. A biochemical model of photosynthetic CO2 assimilation in leaves of C3 species. Planta 1980, 149, 78–90. [Google Scholar] [CrossRef] [PubMed]
- Makino, A.; Sakashita, H.; Hidema, J.; Mae, T.; Ojima, K.; Osmond, B. Distinctive responses of ribulose-1, 5-bisphosphate carboxylase and carbonic anhydrase in wheat leaves to nitrogen nutrition and their possible relationships to CO2-transfer resistance. Plant Physiol. 1992, 100, 1737–1743. [Google Scholar] [CrossRef] [PubMed]
- Fischer, R.A.; Rees, D.; Sayre, K.D.; Lu, Z.M.; Condon, A.G.; Saavedra, A.L. Wheat yield progress associated with higher stomatal conductance and photosynthetic rate and cooler canopies. Crop Sci. 1998, 38, 1467–1475. [Google Scholar] [CrossRef]
- Ainsworth, E.A.; Long, S.P. What have we learned from 15 years of free-air CO2 enrichment (FACE)? A meta-analytic review of the responses of photosynthesis, canopy properties and plant production to rising CO2. New Phytol. 2005, 165, 351–372. [Google Scholar] [CrossRef] [PubMed]
- Portis, A.R. Rubisco activase–Rubisco’s catalytic chaperone. Photosynth. Res. 2003, 75, 11–27. [Google Scholar] [CrossRef] [PubMed]
- Wang, Z.Y.; Snyder, G.W.; Esau, B.D.; Portis, A.R.; Ogren, W.L. Species-dependent variation in the interaction of substrate-bound ribulose-1, 5-bisphosphate carboxylase/oxygenase (Rubisco) and Rubisco activase. Plant Physiol. 1992, 100, 1858–1862. [Google Scholar] [CrossRef]
- Bjorkman, O.; Demmig, B.; Andrews, T. Mangrove photosynthesis response to high-irradiance stress. Funct. Plant Biol. 1988, 15, 43–61. [Google Scholar] [CrossRef]
- Hou, D.Y.; Xu, H.; Du, G.Y.; Lin, J.T.; Duan, M.; Guo, A.G. Proteome analysis of chloroplast proteins in stage albinism line of winter wheat (Triticum aestivum) FA85. BMB Rep. 2009, 42, 450–455. [Google Scholar] [CrossRef] [PubMed]
- Andjelkovic, V.; Ignjatovic-Micic, D. ESTs analysis in maize developing kernels exposed to single and combined water and heat stresses. Sci. Agric. 2011, 68, 353–360. [Google Scholar] [CrossRef] [Green Version]
- Meurer, J.; Plücken, H.; Kowallik, K.V.; Westhoff, P. A nuclear-encoded protein of prokaryotic origin is essential for the stability of photosystem II in Arabidopsis thaliana. EMBO J. 1998, 17, 5286–5297. [Google Scholar] [CrossRef] [PubMed]
- Plücken, H.; Müller, B.; Grohmann, D.; Westhoff, P.; Eichacker, L.A. The HCF136 protein is essential for assembly of the photosystem II reaction center in Arabidopsis Thaliana. FEBS Lett. 2002, 532, 85–90. [Google Scholar] [CrossRef]
- Jeong, M.J.; Park, S.C.; Byun, M.O. Improvement of salt tolerance in transgenic potato plants by glyceraldehyde-3 phosphate dehydrogenase gene transfer. Mol. Cell. 2001, 12, 185–189. [Google Scholar]
- Lu, S.; Li, T.; Jiang, J. Effects of salinity on sucrose metabolism during tomato fruit development. Afr. J. Biotechnol. 2010, 9, 842–849. [Google Scholar]
- Abdelmohsen, K.; Srikantan, S.; Tominaga, K.; Kang, M.J.; Yaniv, Y.; Martindale, J.L. Growth inhibition by miR-519 via multiple p21-inducing pathways. Mol. Cell Biol. 2012, 32, 2530–2548. [Google Scholar] [CrossRef]
- Yasar, F.; Ellialtioglu, S.; Yildiz, K. Effect of salt stress on antioxidant defense systems, lipid peroxidation, and chlorophyll content in green bean. Russ. J. Plant Physiol. 2008, 55, 782–786. [Google Scholar] [CrossRef]
- Lu, X.; Zhang, F.; Shen, Q.; Jiang, W.; Pan, Q.; Lv, Z. Overexpression of allene oxide cyclase improves the biosynthesis of artemisinin in Artemisia annua L. PLoS ONE 2014, 9, e91741. [Google Scholar] [CrossRef]
- Browse, J. Jasmonate passes muster: A receptor and targets for the defense hormone. Annu. Rev. Plant Biol. 2009, 60, 183–205. [Google Scholar] [CrossRef] [PubMed]
- Vijayan, P.; Shockey, J.; Lévesque, C.A.; Cook, R.J. A role for jasmonate in pathogen defense of Arabidopsis. Proc. Natl. Acad. Sci. USA 1998, 95, 7209–7214. [Google Scholar] [CrossRef] [PubMed]
- van der Fits, L.; Memelink, J. ORCA3, a jasmonate-responsive transcriptional regulator of plant primary and secondary metabolism. Science 2000, 289, 295–297. [Google Scholar] [CrossRef] [PubMed]
- Jiang, K.; Pi, Y.; Hou, R.; Jiang, L.; Sun, X.; Tang, K. Promotion of nicotine biosynthesis in transgenic tobacco by overexpressing allene oxide cyclase from Hyoscyamus niger. Planta 2009, 229, 1057–1063. [Google Scholar] [CrossRef] [PubMed]
- Gu, X.C.; Chen, J.F.; Xiao, Y.; Di, P.; Xuan, H.J.; Zhou, X. Overexpression of allene oxide cyclase promoted tanshinone/phenolic acid production in Salvia miltiorrhiza. Plant Cell Rep. 2012, 31, 2247–2259. [Google Scholar] [CrossRef] [PubMed]
- Bao, Y.; Kost, B.; Chua, N.H. Reduced expression of α-tubulin genes in Arabidopsis thaliana specifically affects root growth and morphology, root hair development and root gravitropism. Plant J. 2001, 28, 145–157. [Google Scholar] [CrossRef] [PubMed]
- Shi, H.Y.; Zhang, Y.X.; Chen, L. Two pear auxin-repressed protein genes, PpARP1 and PpARP2, are predominantly expressed in fruit and involved in response to salicylic acid signaling. Plant Cell Tissue Organ 2013, 114, 279–286. [Google Scholar] [CrossRef]
- Lee, J.; Han, C.T.; Hur, Y. Molecular characterization of the Brassica rapa auxin-repressed, superfamily genes, BrARP1 and BrDRM1. Mol. Biol. Rep. 2013, 40, 197–209. [Google Scholar] [CrossRef]
- Ikeda, M.; Fujiwara, S.; Mitsuda, N.; Ohme-Takagi, M. A triantagonistic basic helix-loop-helix system regulates cell elongation in Arabidopsis. Plant Cell 2012, 24, 4483–4497. [Google Scholar] [CrossRef] [PubMed]
- Liu, X.; Wei, X.; Sheng, Z.; Jiao, G.; Tang, S.; Luo, J. Polycomb protein OsFIE2 affects plant height and grain yield in rice. PLoS ONE 2016, 11, e0164748. [Google Scholar] [CrossRef] [PubMed]
- Kahila, M.M.H.; Najy, A.M.; Rahaie, M.; Mir-Derikvand, M. Effect of nanoparticle treatment on expression of a key gene involved in thymoquinone biosynthetic pathway in Nigella sativa L. Nat. Prod. Res. 2018, 32, 15. [Google Scholar] [CrossRef] [PubMed]
- Granier, F. Extraction of plant proteins for two-dimensional electrophoresis. Electrophoresis 1988, 9, 712–718. [Google Scholar] [CrossRef] [PubMed]
- Isaacson, T.; Damasceno, C.M.; Saravanan, R.S.; He, Y.; Catalá, C.; Saladié, M. Sample extraction techniques for enhanced proteomic analysis of plant tissues. Nat. Protoc. 2006, 1, 769–774. [Google Scholar] [CrossRef] [PubMed]
- Damerval, C.; De Vienne, D.; Zivy, M.; Thiellement, H. Technical improvements in two-dimensional electrophoresis increase the level of genetic variation detected in wheat-seedling proteins. Electrophoresis 1986, 7, 52–54. [Google Scholar] [CrossRef]
- Bradford, M.M. A rapid and sensitive method for the quantitation of microgram quantities of protein utilizing the principle of protein-dye binding. Anal. Biochem. 1976, 72, 248–254. [Google Scholar] [CrossRef]
- O’Farrell, P.H. High resolution two-dimensional electrophoresis of proteins. J. Biol. Chem. 1975, 250, 4007–4021. [Google Scholar] [PubMed]
- Webster, J.; Oxley, D. Protein identification by peptide mass fingerprinting using MALDI-TOF Mass spectrometry. Methods Mol. Biol. 2005, 310, 227–240. [Google Scholar] [PubMed]
- Yousuf, P.Y.; Abd_Allah, E.F.; Nauman, M.; Asif, A.; Hashem, A.; Alqarawi, A.A.; Ahmad, A. Responsive proteins in wheat cultivars with contrasting nitrogen efficiencies under the combined stress of high temperature and low nitrogen. Genes 2017, 8, 356. [Google Scholar] [CrossRef]
- Yousuf, P.Y.; Ahmad, A.; Ganie, A.H.; Iqbal, M. Salt stress-induced modulations in the shoot proteome of Brassica juncea genotypes. Environ. Sci. Pollut. Res. 2016, 23, 2391–2401. [Google Scholar] [CrossRef]


| Protein Isolation Method | Quantity of Protein (mg g−1 FW) | Number of Protein Spots |
|---|---|---|
| Phenol-based method | 3.86 ± 0.113a | 259 ± 10a |
| Tris-buffer-based method | 2.94 ± 0.216c | 211 ± 13b |
| TCA-acetone based method | 3.38 ± 0.142b | 214 ± 17b |
| S.N. | Control/Mutants * | Number of Protein Spots |
|---|---|---|
| 1. | Control | 241 |
| 2. | HY1 | 258 |
| 3. | HY3 | 238 |
| 4. | MHY2 | 222 |
| 5. | MHY4 | 260 |
| 6. | NY3 | 249 |
| 7. | LY1 | 219 |
| 8. | LY3 | 255 |
| 9. | VLY2 | 251 |
| 10. | VLY3 | 220 |
| Patterns of Expression | Mutants Lines of Nigella sativa L. | ||||||||
|---|---|---|---|---|---|---|---|---|---|
| HY1 | HY3 | MHY2 | MHY4 | NY3 | LY1 | LY3 | VLY2 | VLY3 | |
| Down-regulated | 8 | 12 | 14 | 10 | 12 | 12 | 12 | 11 | 12 |
| Up-regulated | 13 | 8 | 7 | 14 | 8 | 9 | 13 | 8 | 9 |
| Appearance of a new protein | 3 | 2 | 1 | ||||||
| Spot No. | Protein View | MASCOT Score | Nominal Mass (Da) | pI | Sequence Match (%) | Protein Name | Protein Function | Sub-Cellular Location | Pathway/Biological Process | Accession No. |
|---|---|---|---|---|---|---|---|---|---|---|
| 1011 | RBL_ERYCG | 148 | 50841 | 6.22 | 65 | Ribulose bisphosphate carboxylase large chain | Carboxylation of D-ribulose 1,5-bisphosphate | Chloroplast | Photosynthesis | Q33438 |
| 3401 | RCA_MAIZE | 119 | 48079 | 6.20 | 53 | Ribulose bisphosphate carboxylase/oxygenase activase | Activation of Rubisco | Chloroplast stroma | Photosynthesis | Q9ZT00 |
| 4201 | ATPG_TOBAC | 90 | 41706 | 8.1 | 38 | ATP synthase gamma chain, chloroplastic | Produces ATP from ADP in the presence of a proton gradient across the membrane. | Chloroplast thylakoid membrane | ATP synthesis, hydrogen ion transport | P29790 |
| 1201 | PSBO_SPIOL | 50 | 35377 | 5.5 | 30 | Oxygen evolving enhancer protein 1, chloroplastic | It stabilizes the manganese cluster, which is the primary site of water splitting. | Chloroplast thylakoid membrane | Photosynthesis | P12359 |
| 4301 | P2SAF_ORYSJ | 50 | 45498 | 9.0 | 24 | PSII stability/assembly factor HCF 136, chloroplastic | Essential for PS II biogenesis, required for assembly of an early intermediate in PSII assembly | Chloroplast thylakoid membrane, peripheral membrane protein | Photosynthesis | Q5Z5A8 |
| 2101 | HIS7A_ARATH | 74 | 29264 | 7.2 | 51 | Imidazole glycerol- phosphate dehydratase 1 | It catalyzes D-erythro-1-(imidazole-4-yl) glycerol 3 phosphate to 3-(imidazole-4-yl)-2-oxopropylphosphate releasing water. | Chloroplast | Amino acid biosynthesis, L-Histidine biosynthesis | Isoform 1: P34047-1 Isoform 2: P34047-2 |
| 4401 | MDHC1_ARATH | 37 | 35570 | 6.11 | 24 | Malate dehydrogenase 1 | It catalyzes a reversible NAD-dependent dehydrogenase reaction involved in central metabolism and redox homeostasis | Cytoplasm | Carbohydrate metabolic process | P93819 |
| 4601 | SPSA1_CRAPL | 312 | 119743 | 6.0 | 87 | Sucrose phosphate synthase 1 | It has a role in photosynthetic sucrose synthesis by catalyzing the rate limiting step of sucrose biosynthesis from UDP glucose and fructose-6- phosphate. | Chloroplast thylakoid membrane | Glycan biosynthesis, sucrose biosynthesis | O04932 |
| 6301 | RK23_CHLUV | 82 | 10046 | 10.2 | 63 | 50S ribosomal protein subunit L23 | Binds to 23S rRNA | Chloroplast | Translation | P56368 |
| 6801 | 12KD_FRAAN | 77 | 12408 | 9.1 | 64 | Auxin repressed 12.5 kDa protein | Auxin-activated signaling pathway | Auxin signaling pathway | Q05349 | |
| 6901 | ARP_ARATH | 92 | 60622 | 9.1 | 28 | DNA-(apurinic or apyrimidinic) lyase | It repairs oxidative DNA damages. | Chloroplast | Base-excision repair | P45951 |
| 7704 | ACCO2_ARATH | 89 | 36183 | 4.98 | 49 | 1-aminocyclo propane-1-carboxylate oxidase 2 | It is involved in ethylene biosynthesis. | Cell wall, ER, cytosol | Ethylene biosynthesis | Q41931 |
| 2908 | APX1_ARATH | 123 | 27800 | 5.72 | 68 | L-ascorbate peroxidase (APX1) | It plays a key role in hydrogen peroxide removal. | Cytoplasm | Antioxidant defense system | Q05431 |
| 3658 | SODM1_ARATH | 89 | 25443 | 8.47 | 58 | Manganese superoxide dismutase (MSD1) | It destroys superoxide anion radicals | Mitochondria | Defense response | O81235 |
| 8054 | G3PC1_ARATH | 100 | 36914 | 6.62 | 45 | Glyceraldehyde 3- phosphate dehydrogenase | It catalyzes the first step of the pathway by converting D-glyceraldehyde 3-phosphate into 3-phospho D-glyceroyl phosphate | Cytoplasm | Glycolytic process | P25858 |
| 1268 | TBA6_ARATH | 115 | 49537 | 4.93 | 56 | Tubulin alpha-6 chain (TUA6) | Structural constituent of cytoskeleton | Cytoskeleton | Microtubule cytoskeleton organization | P29511 |
| 7315 | EIF3I_ARATH | 125 | 36388 | 6.50 | 58 | Eukaryotic translation initiation factor 3 subunit 2(eIF3I1/TRIP-1) | Component of eukaryotic initiation factor 3 (eIF-3) | Cytoplasm | Protein synthesis | Q38884 |
| 2401 | AOC3_ARATH | 66 | 28015 | 9.19 | 43 | Allene oxide cyclase 3 | It is involved in the production of 12-oxo-phytodienoic acid, a precursor of jasmonic acid. | Chloroplast | Jasmonic acid biosynthesis process | Q9LS01 |
| 3001 | DUT_ARATH | 70 | 17603 | 5.3 | 51 | Deoxyuridine 5′-triphosphate nucleotidol hydrolase | It produces dUMP, the immediate precursor of thymidine nucleotides and decreases the intracellular concentration of Dutp | Cytoplasm | Nucleotide metabolism (pyrimidine metabolism) | Q9STG6 |
| 3909 | RAN1_ORYS1 | 120 | 25275 | 6.38 | 56 | GTP-binding nuclear protein Ran-1 | It is involved in nucleocyto- plasmic transport. | Nucleus | Protein import into nucleus | P41916 |
| 4006 | FIE1_ORYSJ | 99 | 52,100 | 7.55 | 44 | Polycomb group protein FIE1 | It is involved in cell differentiation, endosperm development, and seed development. | Nucleus | Differentiation, Transcription, Transcription regulation | Q6ZJW8 |
| 4518 | PRE1_ARATH | 120 | 10,560 | 9.00 | 79 | Transcription factor PRE1 | It integrates multiple signaling pathways to regulate cell elongation and plant development. | Nucleus | Gibberellic acid mediated signaling pathway | Q9FLE9 |
| 4900 | V5REB1_NIGSA | 51 | 23010 | 5.67 | 72 | Geranyl diphosphate synthase | It is involved in the isoprenoid biosynthetic process | Cytoplasm | Key gene of monotrepene pathway | V5REB1 |
| Protein Name | Expression Pattern of Proteins in Leaves of Control and Mutant Lines of Nigella sativa L. | |||||||||
|---|---|---|---|---|---|---|---|---|---|---|
| Control | HY1 | HY3 | MHY2 | MHY4 | NY3 | LY1 | LY3 | VLY2 | VLY3 | |
| Ribulose bisphosphate carboxylase large chain |  | |||||||||
| Ribulose bisphosphate carboxylase/oxygenase activase |  | |||||||||
| ATP synthase gamma chain |  | |||||||||
| Oxygen evolving enhancer protein 1 |  | |||||||||
| PSII stability/assembly factor HCF 136, chloroplastic | 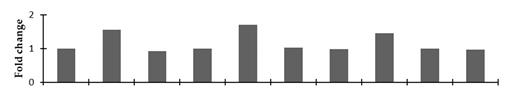 | |||||||||
| Imidazole glycerol-phosphate dehydratase 1 | 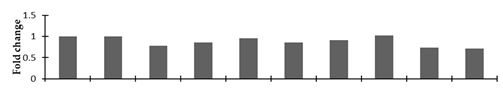 | |||||||||
| Malate dehydrogenase 1 |  | |||||||||
| Sucrose phosphate synthase 1 | 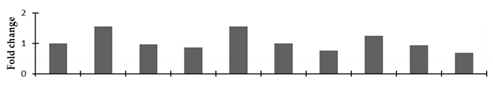 | |||||||||
| 50S ribosomal subunit L23 |  | |||||||||
| Auxin repressed 12.5 kDa protein | 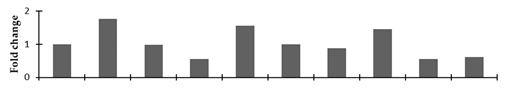 | |||||||||
| DNA-(apurinic or apyrimidinic site) lyase | 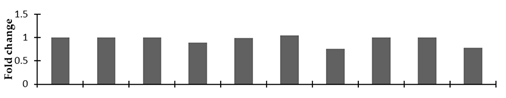 | |||||||||
| 1-aminocyclopropane-1-carboxylate oxidase 2 | 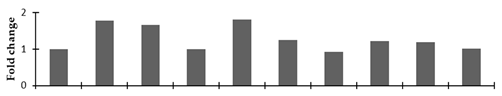 | |||||||||
| L-ascorbate peroxidase (APX1) |  | |||||||||
| Manganese superoxide dismutase (MSD1) | 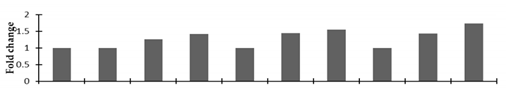 | |||||||||
| Glyceraldehyde 3- phosphate dehydrogenase A | 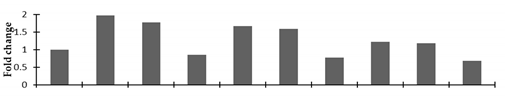 | |||||||||
| Tubulin alpha-6 chain (TUA6) |  | |||||||||
| Eukaryotic translation initiation factor 3 subunit 2 (eIF3I1/TRIP-1) |  | |||||||||
| Allene oxide cyclase 3 | 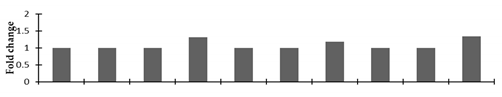 | |||||||||
| Deoxyuridine 5′-triphosphate nucleotidol hydrolase |  | |||||||||
| GTP-binding nuclear protein Ran-1 |  | |||||||||
| Polycomb group protein FIE1 |  | |||||||||
| Transcription factor PRE1 | 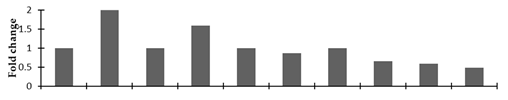 | |||||||||
| Geranyl diphosphate synthase |  | |||||||||
© 2019 by the authors. Licensee MDPI, Basel, Switzerland. This article is an open access article distributed under the terms and conditions of the Creative Commons Attribution (CC BY) license (http://creativecommons.org/licenses/by/4.0/).
Share and Cite
Asif, A.; K. Ansari, M.Y.; Hashem, A.; Tabassum, B.; Abd_Allah, E.F.; Ahmad, A. Proteome Profiling of the Mutagen-Induced Morphological and Yield Macro-Mutant Lines of Nigella sativa L. Plants 2019, 8, 321. https://doi.org/10.3390/plants8090321
Asif A, K. Ansari MY, Hashem A, Tabassum B, Abd_Allah EF, Ahmad A. Proteome Profiling of the Mutagen-Induced Morphological and Yield Macro-Mutant Lines of Nigella sativa L. Plants. 2019; 8(9):321. https://doi.org/10.3390/plants8090321
Chicago/Turabian StyleAsif, Ambreen, Mohammad Yunus K. Ansari, Abeer Hashem, Baby Tabassum, Elsayed Fathi Abd_Allah, and Altaf Ahmad. 2019. "Proteome Profiling of the Mutagen-Induced Morphological and Yield Macro-Mutant Lines of Nigella sativa L." Plants 8, no. 9: 321. https://doi.org/10.3390/plants8090321
APA StyleAsif, A., K. Ansari, M. Y., Hashem, A., Tabassum, B., Abd_Allah, E. F., & Ahmad, A. (2019). Proteome Profiling of the Mutagen-Induced Morphological and Yield Macro-Mutant Lines of Nigella sativa L. Plants, 8(9), 321. https://doi.org/10.3390/plants8090321