Article

Genetic, Morphological, and Biochemical Diversity of Argan Tree (Argania spinosa L.) (Sapotaceae) in Tunisia

1
Université de Tunis El Manar, Laboratoire de Génétique Moléculaire, Immunologie et Biotechnologie, Faculté des Sciences de Tunis, Tunis 2092, Tunisia
2
Faculty of Science, Department of Molecular Biology and Genetics, Istanbul University, 34134 Istanbul, Turkey
*
Author to whom correspondence should be addressed.
Plants 2019, 8(9), 319; https://doi.org/10.3390/plants8090319
Submission received: 25 June 2019 / Revised: 29 July 2019 / Accepted: 23 August 2019 / Published: 1 September 2019
(This article belongs to the Special Issue Molecular Phylogenetics)

Abstract

:
Argan trees are normally endemic to Morocco and Algeria, but hundreds of argan trees exist in Tunisia, some introduced from Morocco and some from unknown origins. The aim of the present study was to evaluate the genetic, morphological, and biochemical diversity of the argan trees in Tunisia. In this study, we used morphometric data collected from vegetative tissue, as well as pomological characteristics related to fruits, stones, and kernels. Genetic variation in 60 trees of Tunisian Argania spinosa L. was estimated using inter-simple sequence repeats (ISSRs). Mutation screening and genotyping by high-resolution melting (HRM) was performed to detect delta-6-desaturase (D6D) variants in the tested individuals, and finally fatty acid analysis of argan leaves with gas chromatography (GC) was performed. The plant materials used in this study originated from four different sites in Tunisia. Analysis of morphological characteristics showed large variability both within and between the studied collections. The analysis of ISSR polymorphisms gave information about the diversity within and between populations. HRM analysis showed that all 60 argan individuals were grouped into 10 different categories. The results of the gas chromatography analysis showed that the presence of omega-3 fatty acids EPA and DHA was noticeable in some argan leaves.

1. Introduction

The argan tree is a thorny evergreen tree and one of the most remarkable species of North Africa, both in part to its botanical and bio-ecological interest as well as its social and medical value. These properties have led, in 1925, to the enactment of a special legislation for this species, which in 1998 was declared a Biosphere Reserve Species by the UNESCO and the Biosphere Program. Argan trees are a multi-purpose tree (oil-agriculture-forestry-pastoral), and oil extracted from argan seeds is rich in unsaturated fatty acids [1]. For this reason, argan is popular for its cosmetic, pharmaceutical, and nutritional uses, and its extraction process provides daily jobs and income for rural population. Additionally, argan trees protect the soil from erosion and help fight desertification, and its woody tissue is hard enough to use for construction and heating purposes. Hundreds of argan trees exist in Tunisia; including those with Moroccan origin as well as others with unknown origin, despite the rarity of the species outside of Morocco. The presence of argan trees in Tunisia is encouraging and even prophetic of long-term economic development. Our research will form part of a program for the characterization, conservation, and enhancement of local forest and fruit resources in Tunisia.
Argania spinosa is a diploid species (2n = 24) [2] belonging to the Sapotaceae family. It is both monoecious and allogamous [3]. Argan trees can be found in different cities in Tunisia [Sousse, Sfax, Tunis, Kairaouen, Nabeul (Korbous)], and each site contains hundreds of individuals. Tunisian argans are unique compared to those found in Morocco, and morphological and biochemical characterizations of its ecotypes must be carried out in order to elucidate the level of genetic diversity and population genetic structure for further management and development of conservation strategies [4,5]. The genetic diversity of argan trees in Morocco is known to be high [6,7]. This study will determine whether the level of genetic diversity is the same or lower in different countries. In Morocco, the argan tree aids in the preservation of its local environment, and maintains a socio-economical equilibrium at argan sites. Argan’s vast genetic diversity has allowed it to develop an exceptional resilience to climatic changes, particularly in dry locations [8]. In contrast, many species with low genetic diversity are unable to survive in a changing environment [9]. This study uses multiple strategies to determine the degree of argan’s diversity based on its morphological, biochemical, and molecular characteristics.
A. spinosa contains oleic acid (OA, C18:1ω3) and alpha-linolenic acid (ALA, C18:3ω3) which have high nutritional and industrial value due to their considerable presence in many essential fatty acids. Delta-6 desaturase is an enzyme that respectively converts linoleic acid (LA, C18:2ω6) and alpha-linolenic acid (ALA, C18:3ω3) to gamma-linolenic acid (GLA, C18:3ω6) and stearidonic acid (SDA, C18:4ω3) [10]. In general terms, the fatty acid content of organisms varies both between and within species. It is believed that this inter-species variation is a direct result of nutrient availability, level of development, weather conditions, and soil characteristics. In addition, minor genetic variations and meta-dependent parameters [trans-methylation and gas chromatography (GC) conditions of fatty acids] can affect fatty acid profiling [11]. The American Heart Foundation emphasized the importance of regulating dietary fats, highlighting in particular the need for monounsaturated and polyunsaturated fatty acids [12]. Polyunsaturated fatty acids (PUFAs) are not synthesized in the human body, and can only be obtained through the consumption of plants and some marine animals [13].
To quantify fatty acid contents within A. spinosa leaf samples were collected from 60 trees and analyzed by GC MS. These results were discussed comparatively with those obtained from ISSR and HRM to assess the industrial usage and taxonomic classification of this species.
The genetic diversity of argan trees in Tunisia has not been investigated so far. In fact, not many studies have looked at the genetic variability of A. spinosa in general. The earliest research into the genetics of this species looked at isozyme markers isolated from chloroplast DNA using Polymerase Chain Reaction- Restriction Fragment Length Polymorphism (PCR-RFLP) [6,7]. Later, a study was published that used Random Amplified Polymorphic DNA (RAPD) [14,15], and Single Sequence Repeats (SSR) [15] as well as Inter-Simple Sequence Repeats ISSR Polymorphism [16,17,18] and Amplified Fragment Length Polymorphism (AFLP) [19], and more recently Inter Retrotransposon Amplified Polymorphism (IRAP) markers [20]. On the aforementioned techniques, ISSR presents the most consistent method of gene mapping, and yields the greatest number of polymorphic fragments per primer. Essentially, this method allows for the identification of a high number of loci while using only a small number of primers [21]. ISSR markers have been proven successful for assessing the genetic diversity of many species, including Argania spinosa [16,17,18], barbary fig (Opuntia ficus indica) [22], Quercus infectoria [23], Cassia fistula L [24], Nothapodytes nimmoniana [25], and Myrciaria tenella [26].
The purpose of the present study was to evaluate the genetic, morphological, and biochemical variability of natural populations of A. spinosa within Tunisia, in order to develop a preservation management program for this species.

2. Results

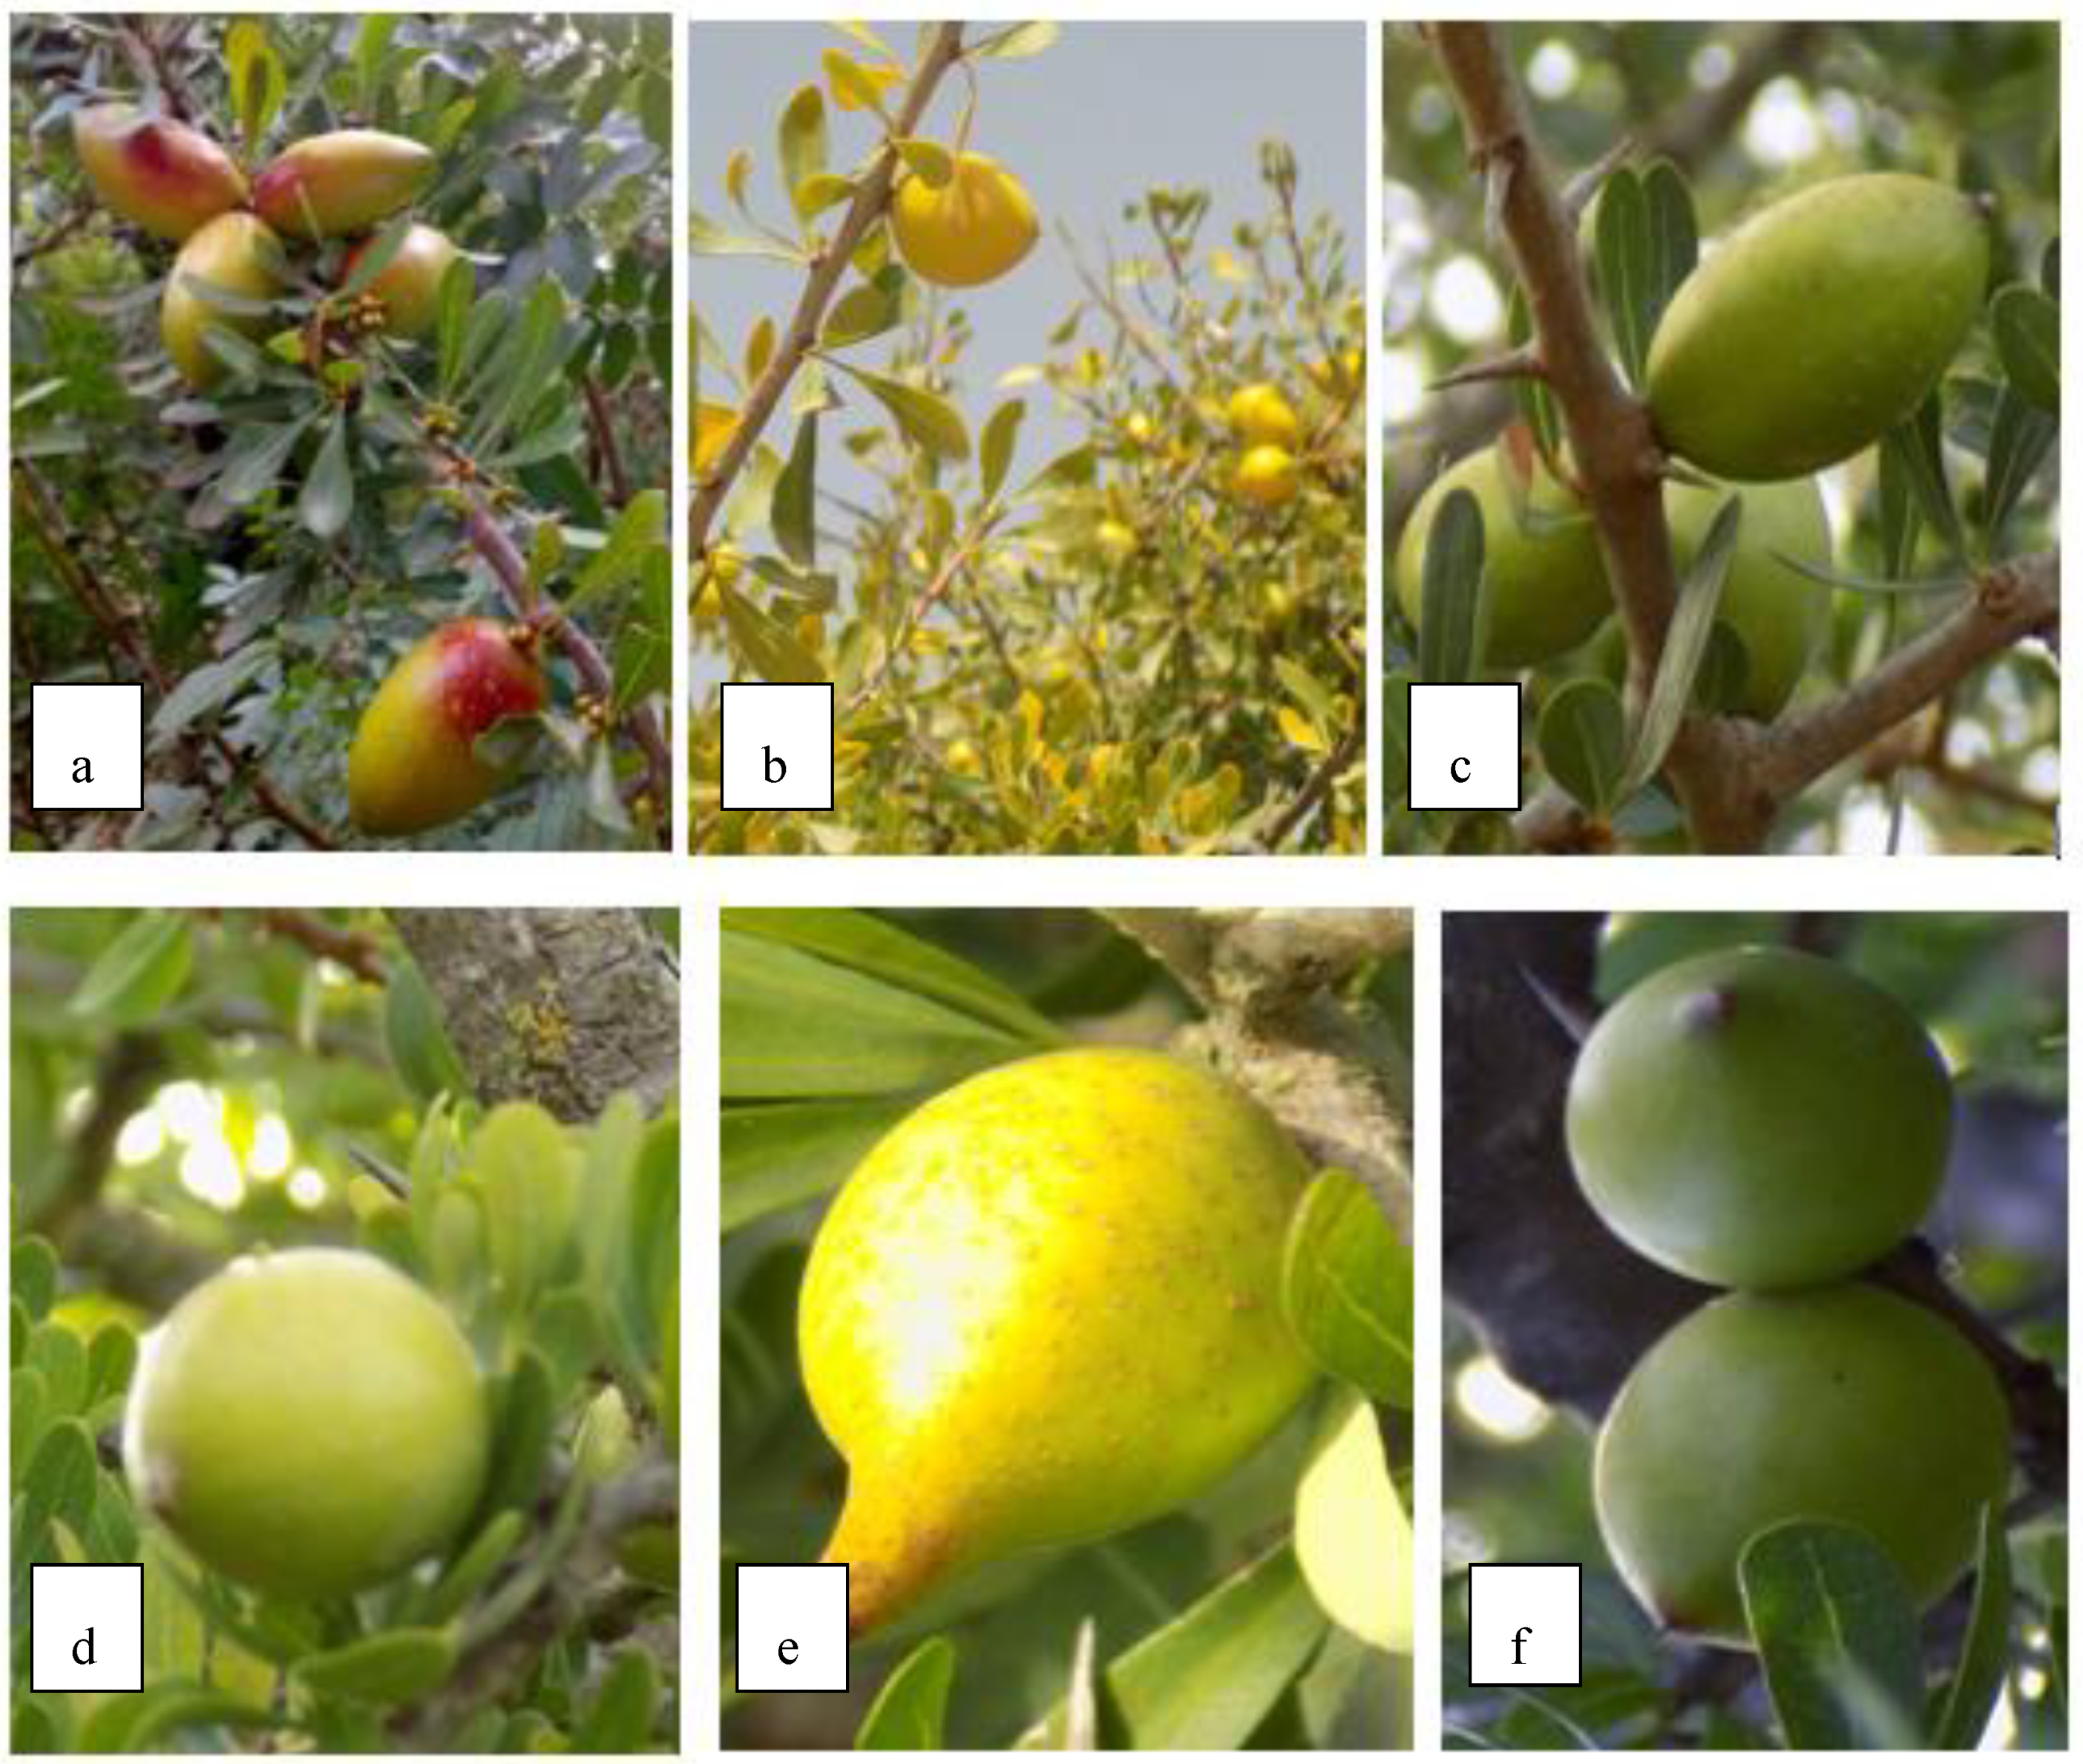
2.1. Morphological Analysis of Trees and Fruits

The principal aim of the morphological analysis was to determine the morphological variability of argan between and within the four sites. In this study, a morphological analysis of both vegetative and reproductive tissues collected from 60 individuals across the different sites was conducted (Table 1). Observation of trees from the four sites revealed a high level of morphological variability. Four crown shapes were observed. The frequency of flowers, flower buds, fruits, spines, ramification of plant limbs, as well as colors and fruit maturity were different from one tree to another (Figure 1).
Leaves were observed to be three shades of green, as well as fruits, which came in three colors (green, yellow, and red) in the same period. In addition, five forms of fruit shapes including oval, apiculate, fusiform, round, and an intermediate form were observed (Figure 1).
An analysis of variance (ANOVA) of quantitative measurements collected from fruits and leaves allows for the determination of which variables best discriminate the groups studied. The ANOVA performed on the 22 morphological parameters made it possible to determine the variables that discriminates best individuals from the four sites studied. Many characters present significant differences between the different sites, (P < 0.001) indicating high morphological variability between individuals involved in this analysis. The morphological parameters displaying the most variability are primarily those related to fruits and seeds. Some parameters related to kernels and leaves are characterized by a value of F higher than variables that have marked values of p > 0.05 and therefore have non-significant differences such as (Lg F, LgG, DG, TG, Nb A, PdA, Lfu, SF) (Table 1).

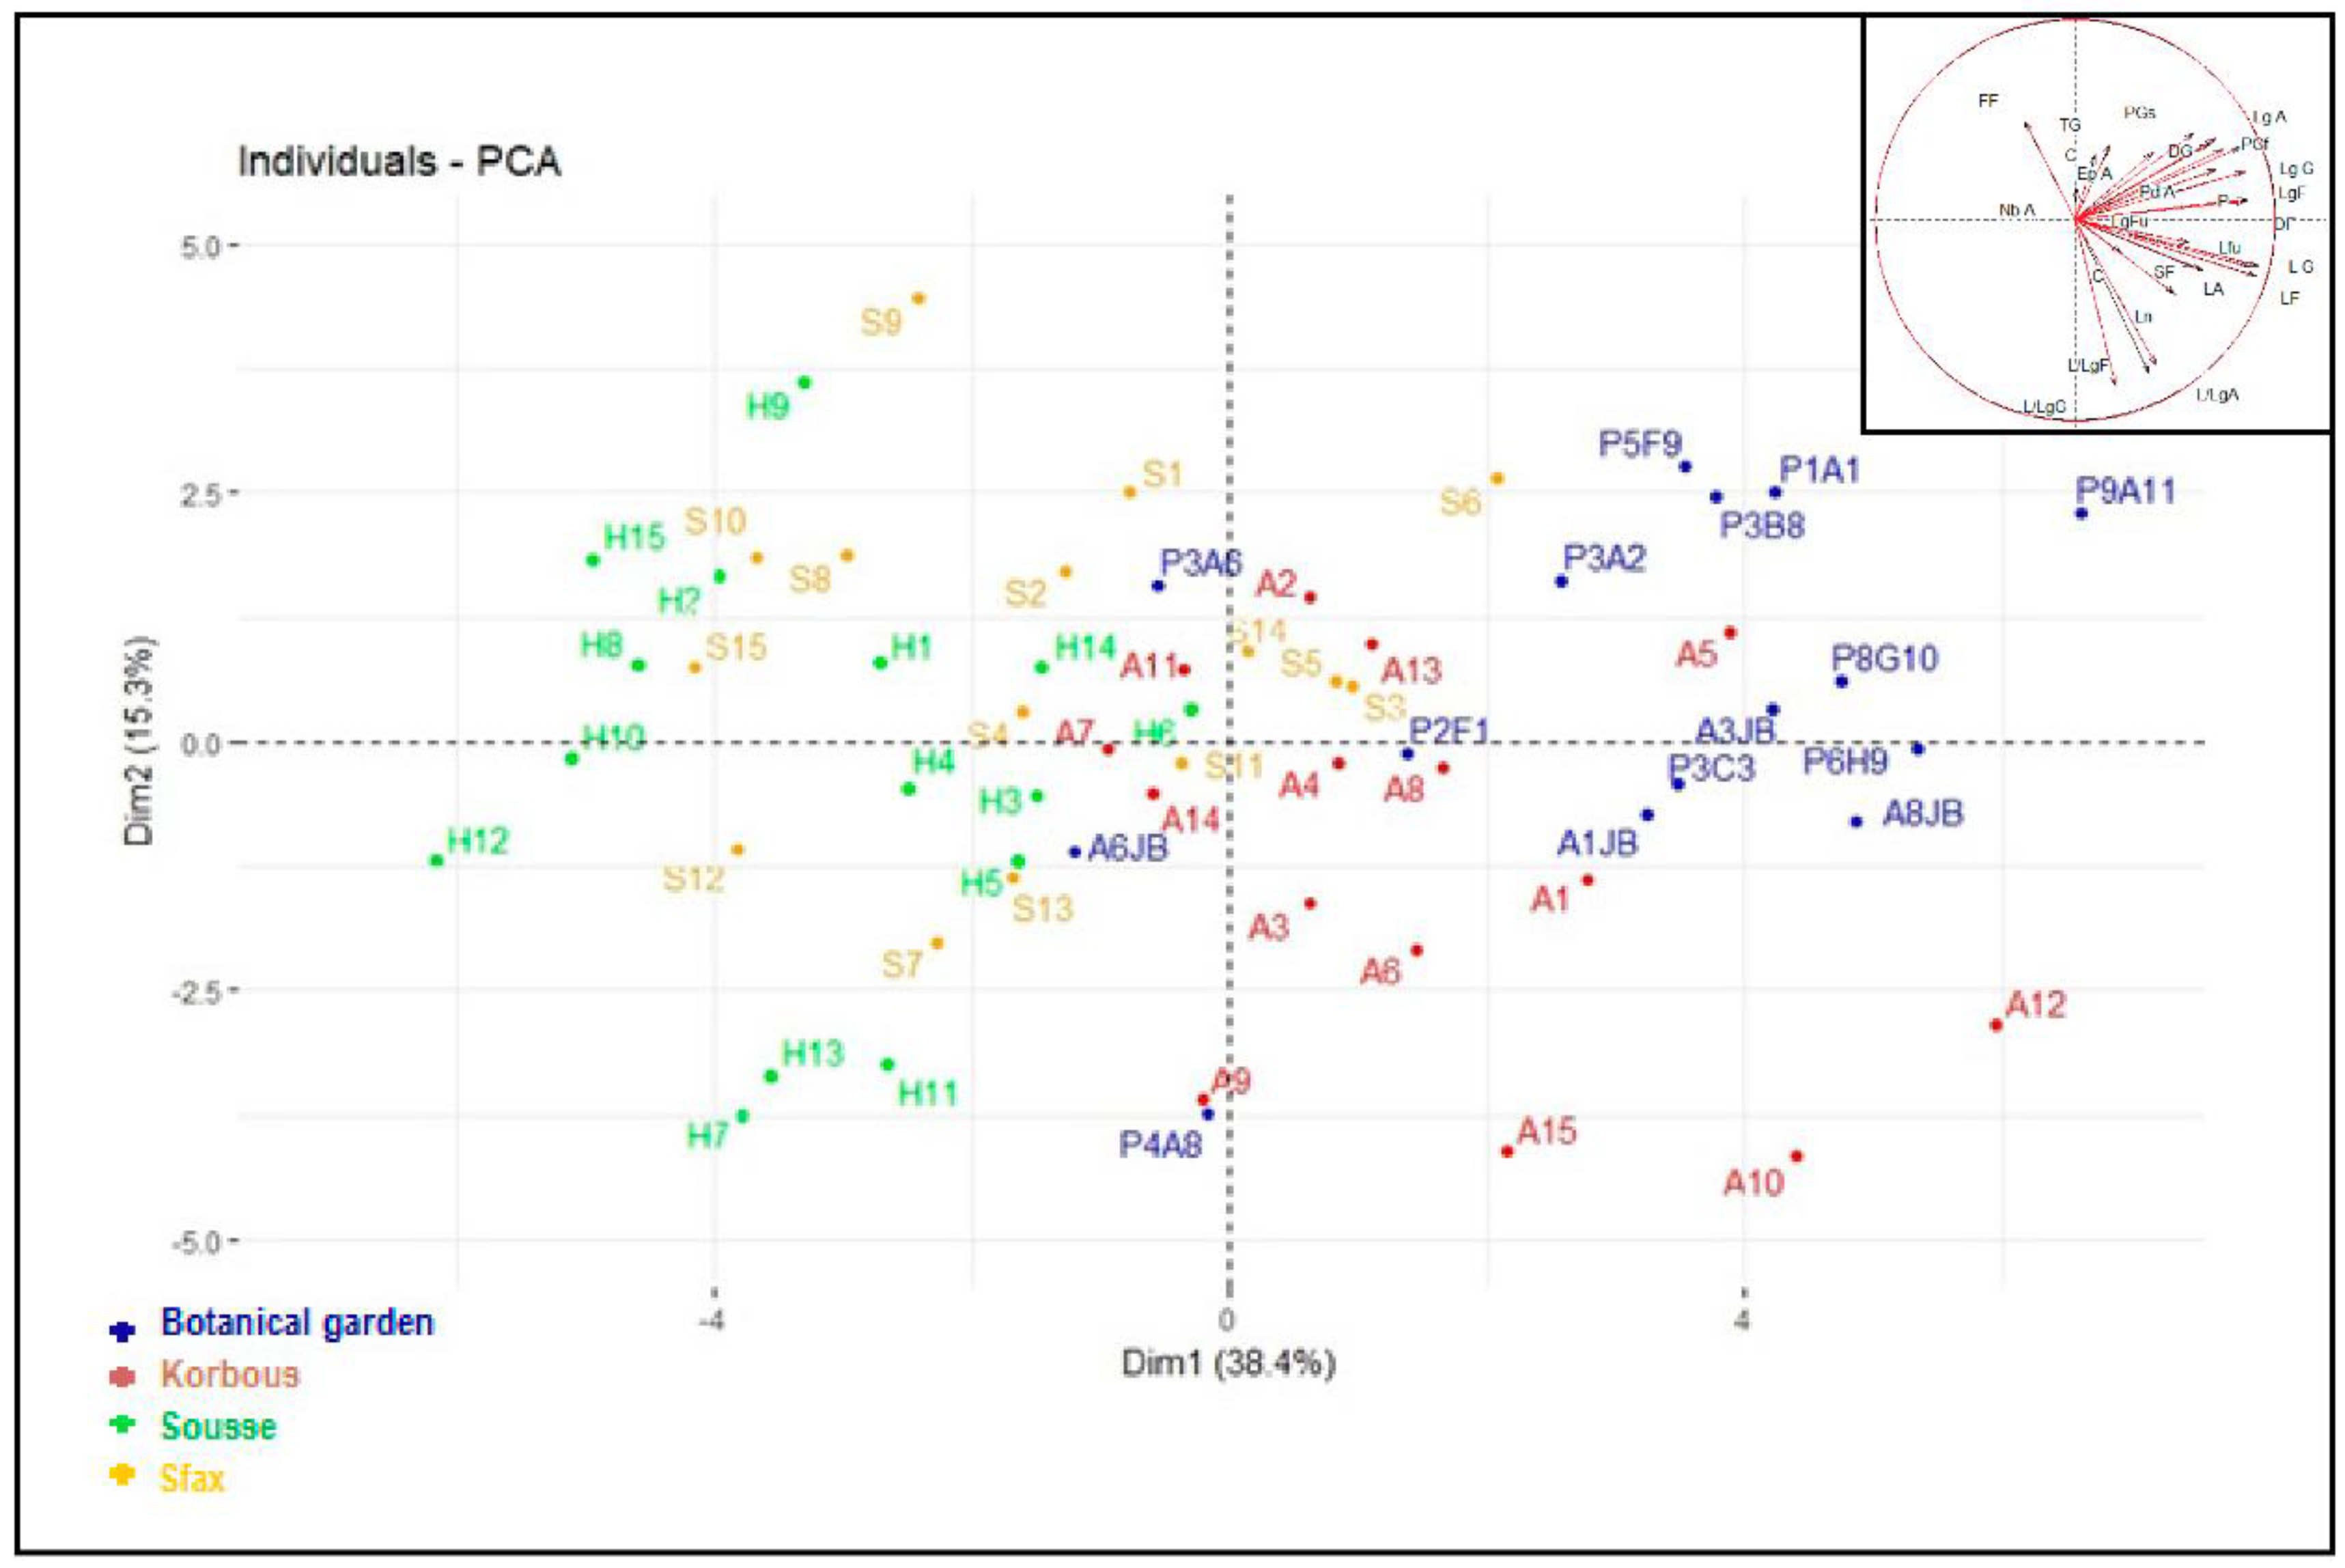
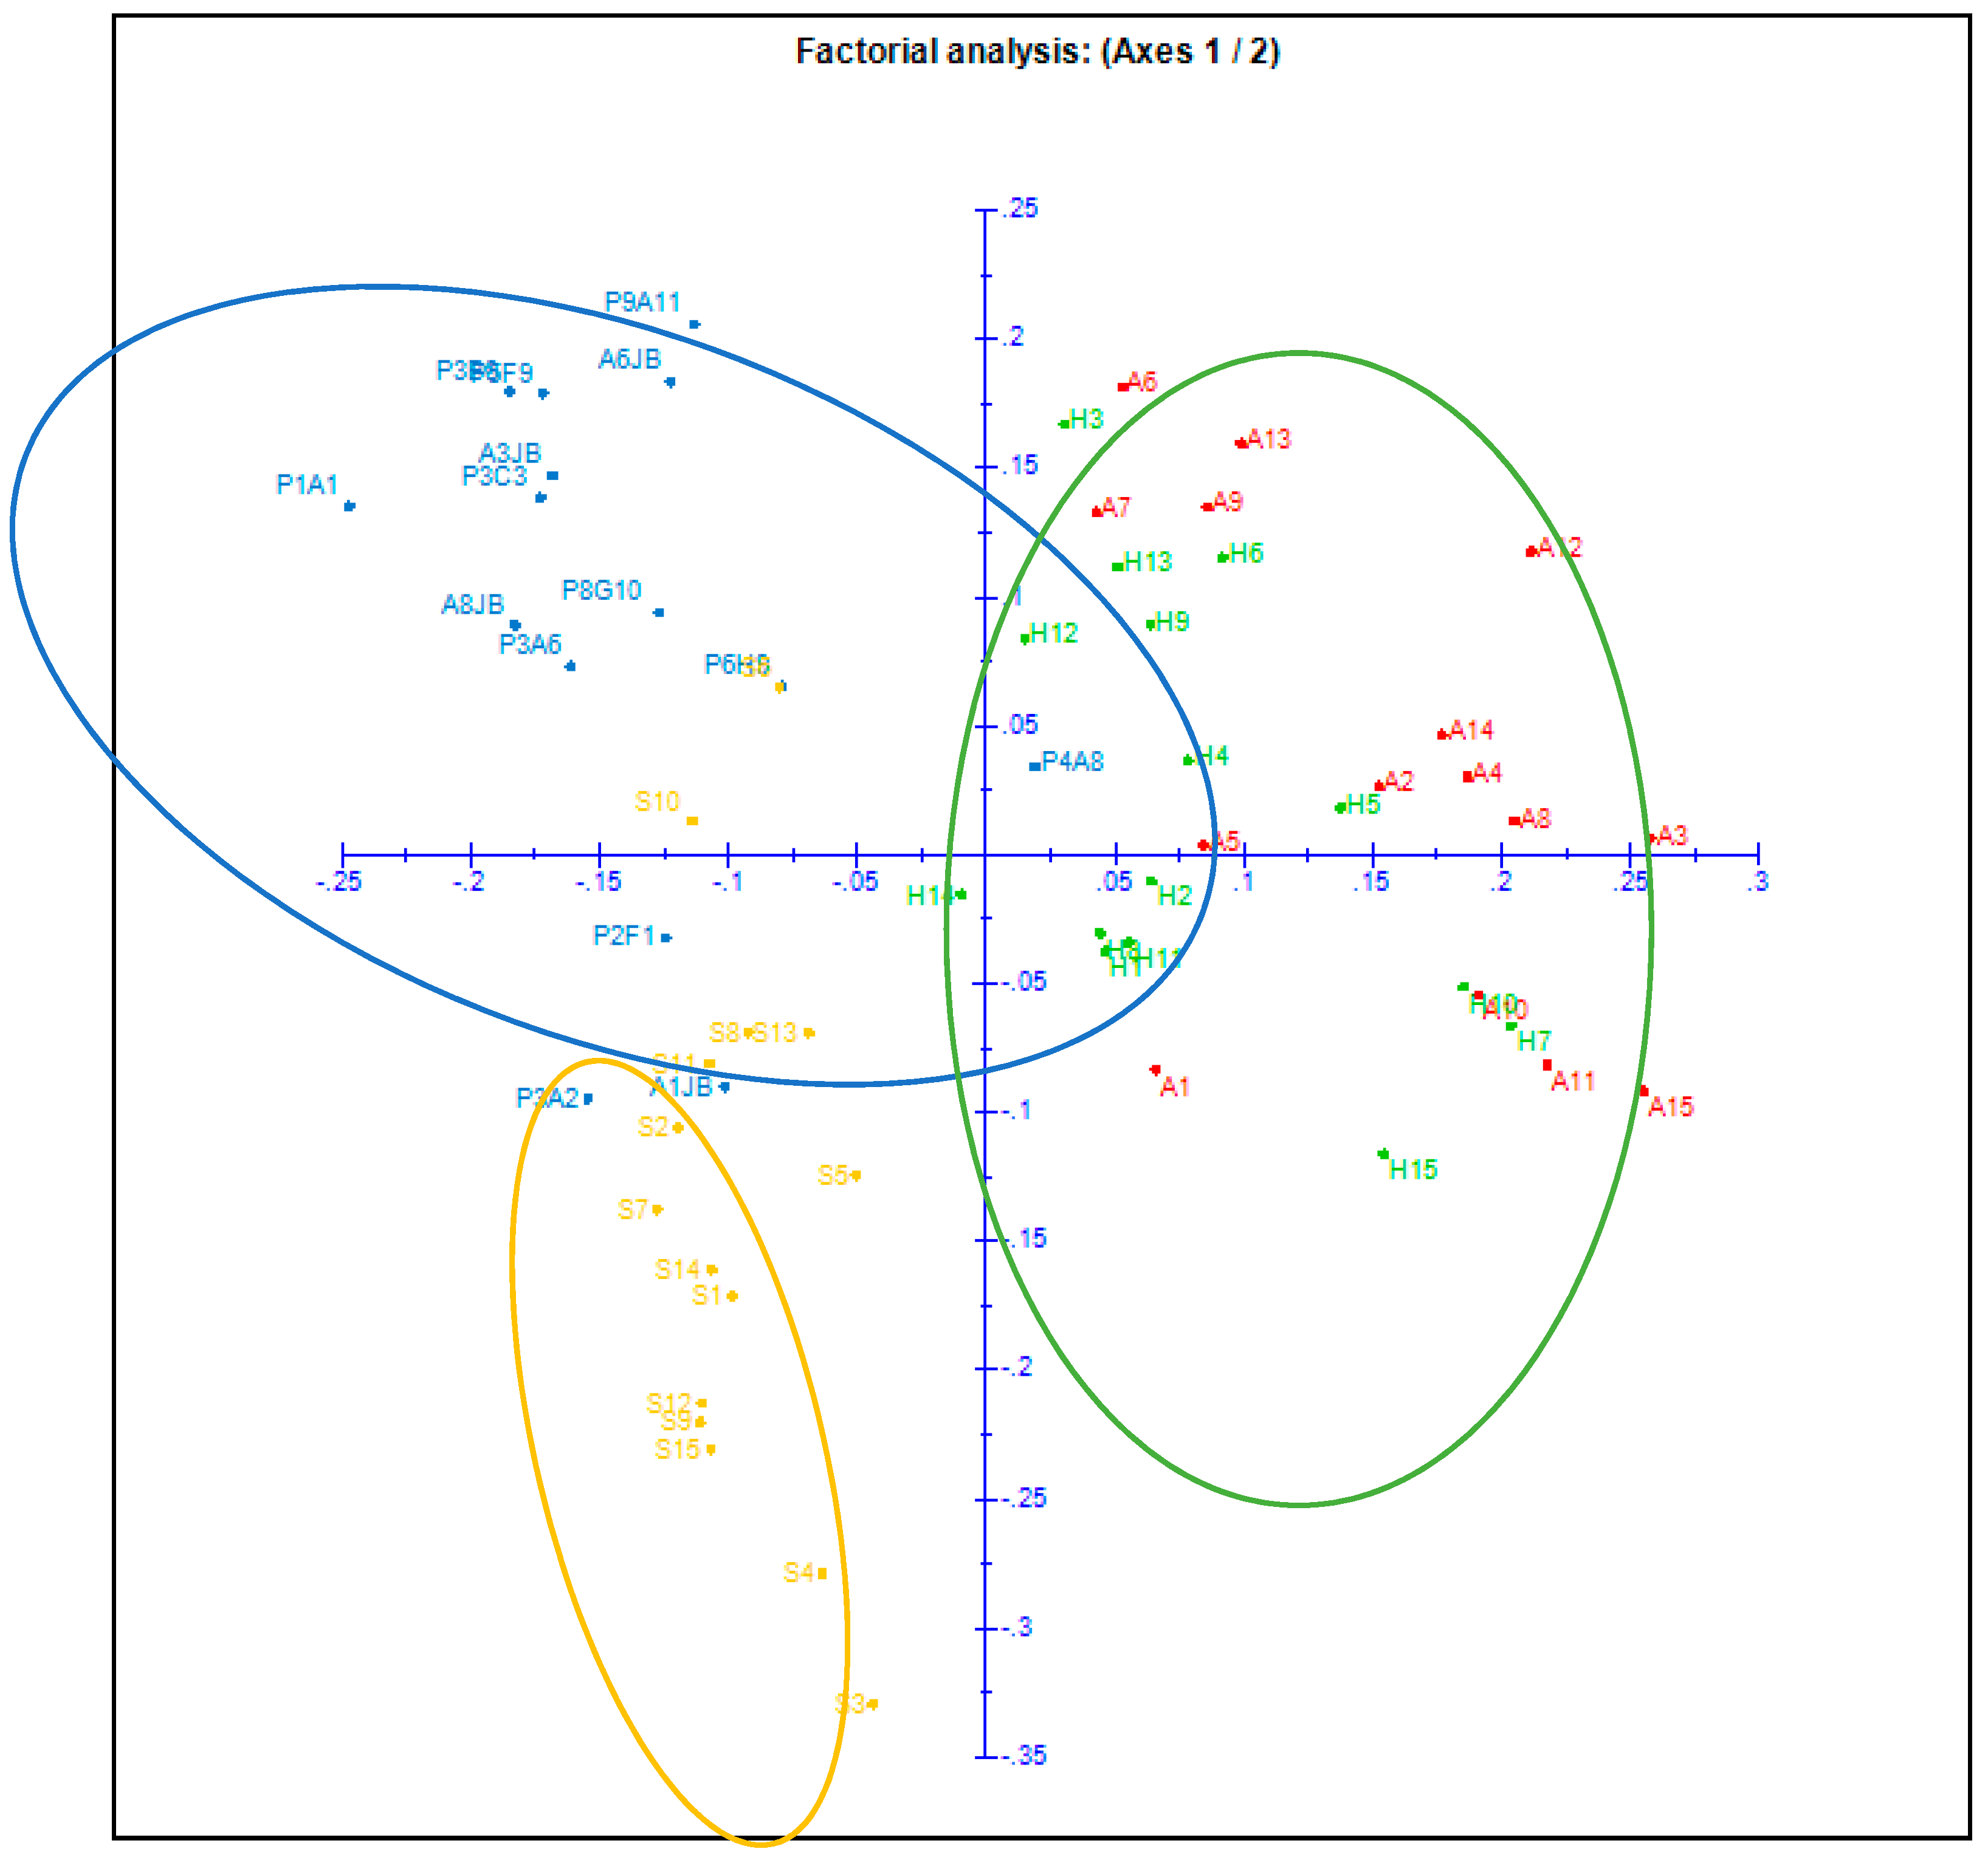
2.2. Principal Component Analysis (PCA)

Principal Component Analysis (PCA) was used to demonstrate the variability in a large number of samples with multiple variables [27]. In order to study the morphological diversity between individual argan trees, the averages were taken from various quantitative parameters measured, and used in a principal component analysis. The first component alone absorbed 38.4% of total inertia. It was found that findings positively correlated with each other, such as fruit length, width, and diameter, as well as seed length and width of fresh and dry seed. The second axis absorbs 15.3% of the total variability. It is negatively correlated with fruit size ratio (L/Lg F), seed size ratio (L/Lg G), and kernel size ratio (L/Lg A), and positively correlated with fruit and seed weight. The dispersion of the individuals in the plan defined by the first two components, which absorbed 53.7% of the global inertia (Figure 2), revealed a strong heterogeneity between individuals. Figure 2 shows a clear grouping of argan trees from the two sites; Botanical garden and Korbous, while the other two sites overlapped. Indeed, most individuals inhabiting the Botanical garden and Korbous sites are grouped on the positive side of the axis 1 of this plan. All the individuals from Sousse and most individuals from Sfax were clustered on the negative side of axis 1.
Concerning axis 2, there is an overlap between individuals from all sites (Figure 2). Individuals located on the positive side of axis 1 are characterized by heavier and longer fruits, seeds, and kernels, if compared with individuals positioned on the negative side of the axis. Individuals located on the positive side of axis 2 are characterized by having larger sized (length/width ratios) fruits, seeds and kernels than those positioned on the negative side (Figure 2). A detachment of the individuals P3A6, A6JB and P4A8 was noticed compared to other individuals of the same site on the negative side of axis 1. These individuals are characterized by having the lowest fruit weights (average = 4.6, 4.08, and 4.8 g), seed (2.4, 2.7, and 2.13 g) and kernel (0.3 g) weight in the same site, in addition to having smaller fruits and seeds, which explains its detachment. Another detachment was observed for the individualsA11, A7, and A14 positioned on the negative side of the two axes. These individuals were also characterized by a lower fruit and seed weight, length, and width. A detachment of individuals S14, S6, S5, and S3 was noted compared to argan trees from the same site on the negative side of axis 1. These individuals were characterized by higher fruit, seed, and kernel weights than individuals from Sfax and Sousse (Figure 2). Fruits and seeds from Sfax and Sousse were considered smaller than those from other sites. In conclusion, we found that the projection of the argan trees studied in the plan defined by the first two axes were mainly carried out according to the weight, length, and width of fruits and seeds. Additional parameters tested only contributed slightly to the dispersion of individuals inhabiting the four sites.

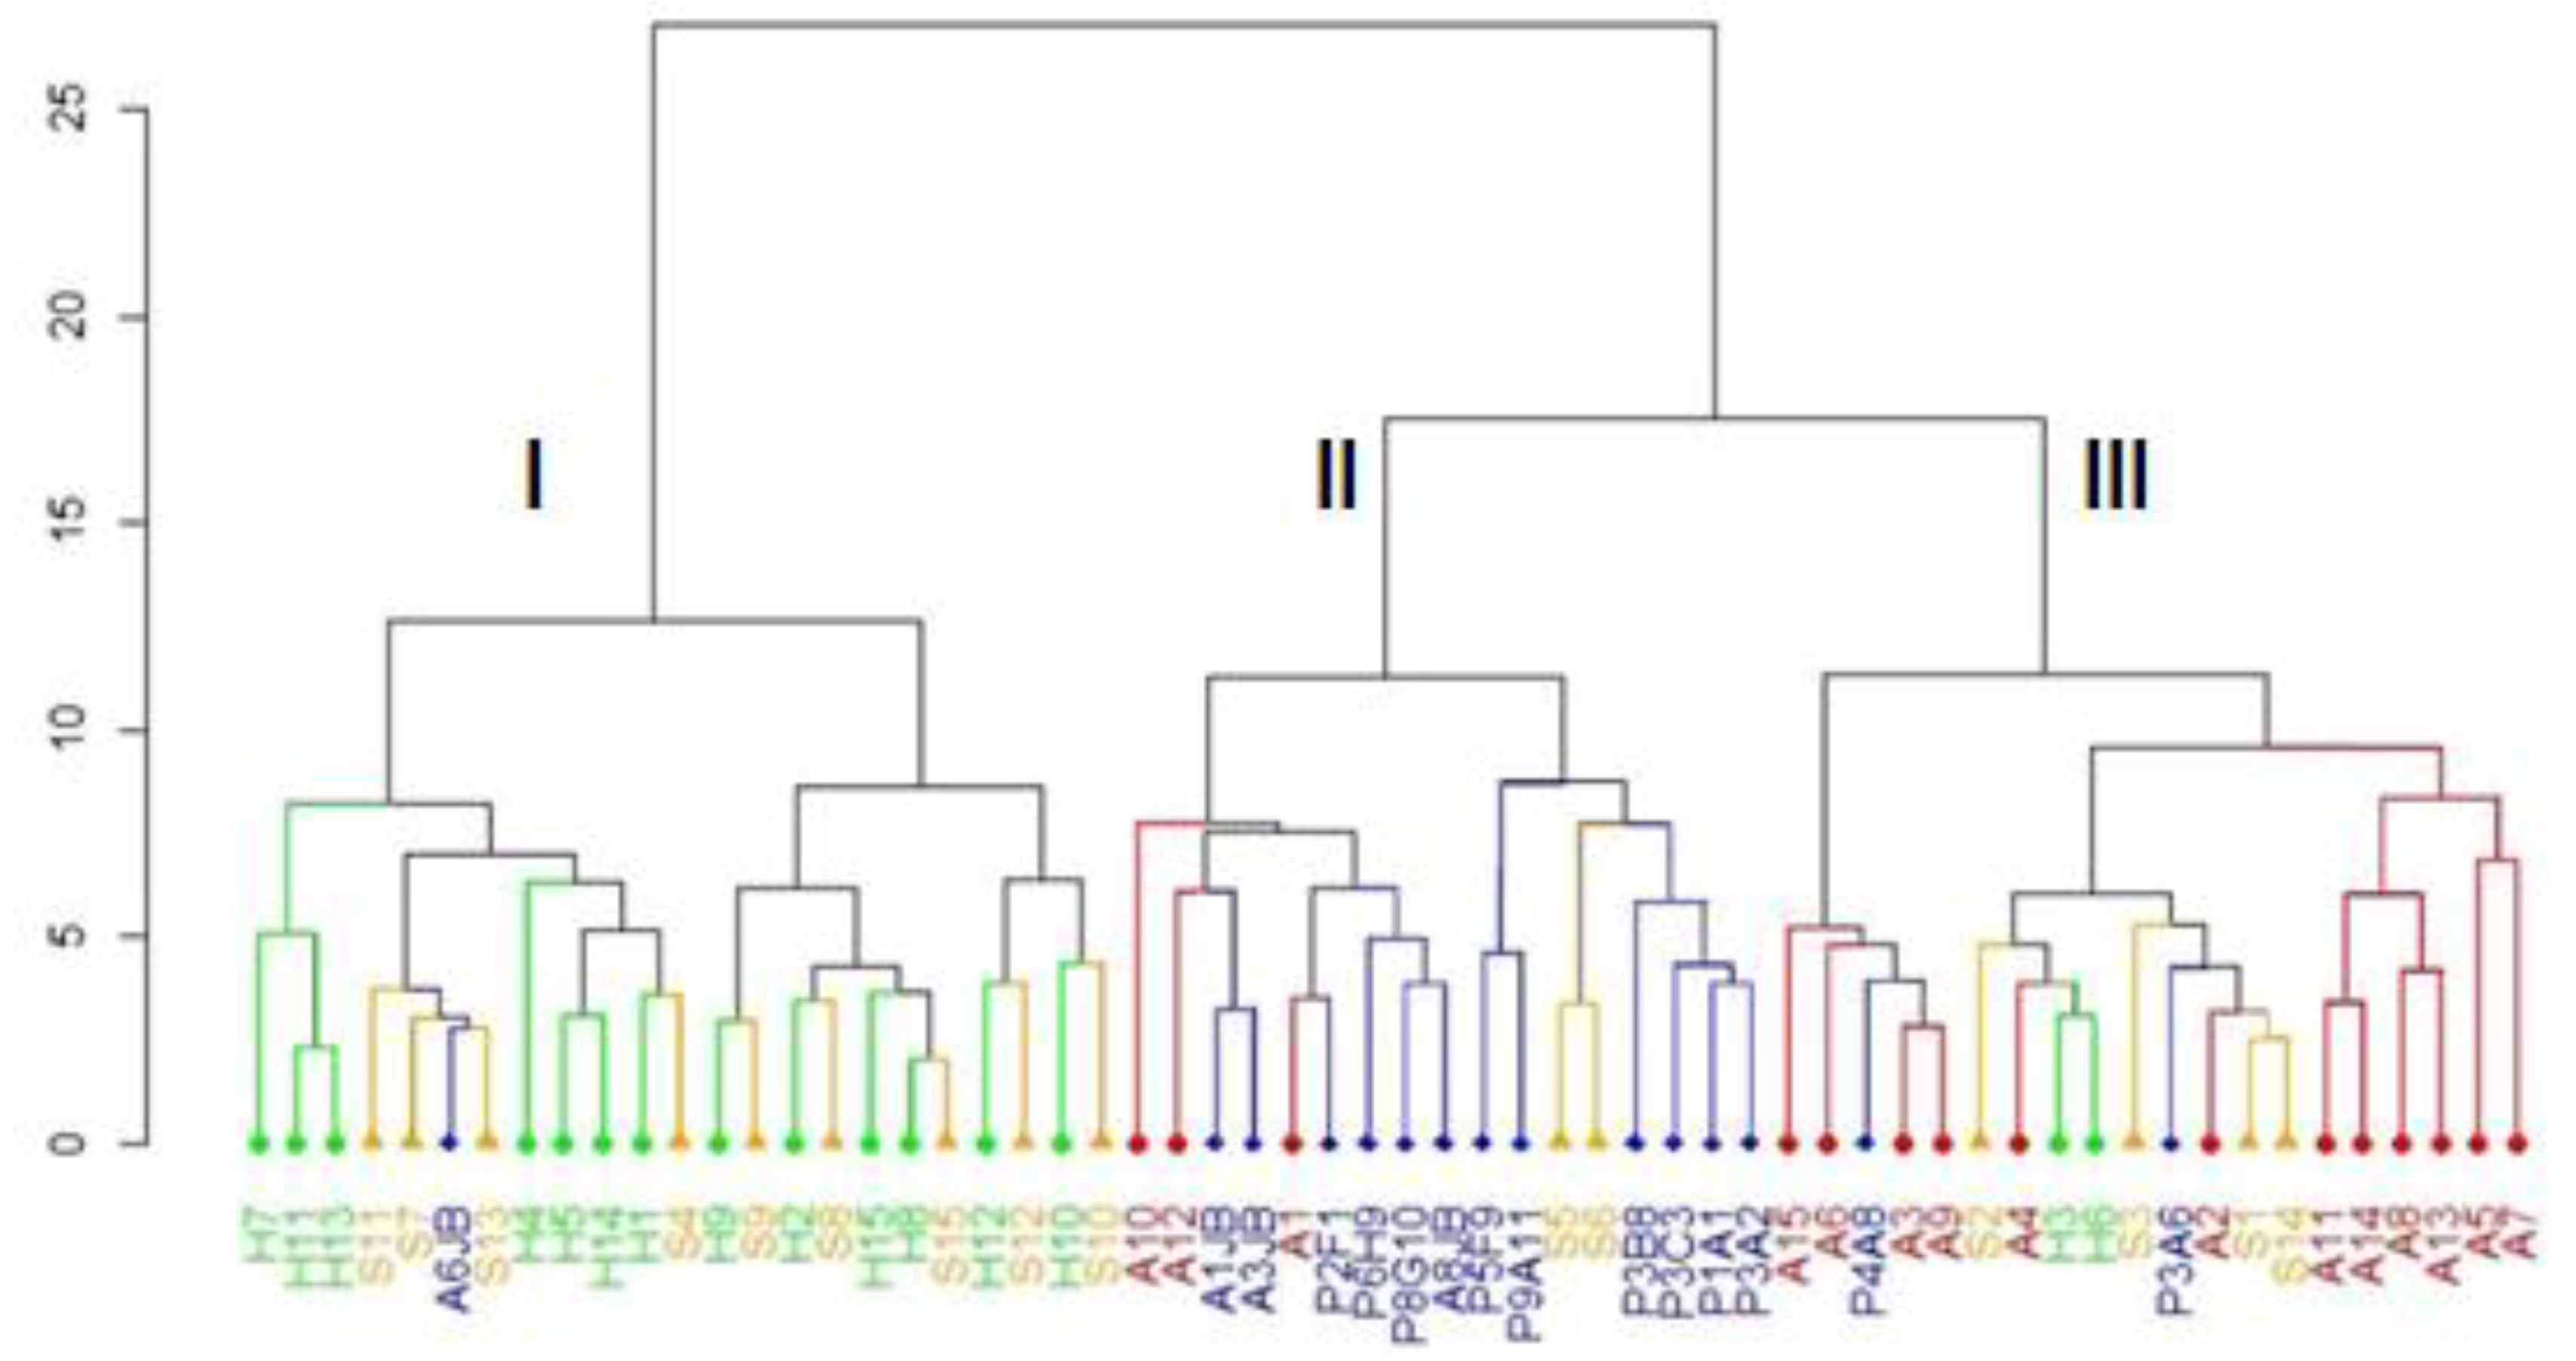
2.3. Cluster Analysis—CA

The Ward dendrogram was established on the basis of Gower distances. This analysis was based mainly on the quantitative characters since the qualitative characters did not contribute affectively in the PCA. The dendrogram (Figure 3) shows the presence of three major groups (I, II, and III). Group I consists mainly of individuals belonging to the sites Sfax and Korbous, as well as a single individual from the Botanical Gardens (P6JB) which is one of the individual detached in PCA. Group II mainly encapsulates argan trees from the Botanical Gardens, but also contains three individuals from Korbous and two individuals from Sfax. These trees were characterized by having larger and heavier fruits and seeds. The third group is composed mainly of individuals from Korbou, but also contains two individuals from the Botanical garden which are detached in the PCA, as well as two individuals from Sousse and three individuals from Sfax (Figure 3). The results obtained by the analysis of this dendrogram confirm the results obtained by the PCA.

2.4. Optimization of the ISSR-PCR Reaction System

In order to optimize the PCR reaction, differentin each primer we played on two variables which are the concentration of magnesium concentrations and the annealing temperatures were tried for each primers. Ten primer pairs were used to produce clear and reproducible fragments. The concentration of magnesium and the annealing temperatures used in this study varied depending on which primers were used (Table 2). Each primer gave a different number of bands that differs from one individual to another. With the number of loci from all individuals we formed a dataset. The 10 primers produced in total 116 bands, in which we obtained 104 polymorphic bands. The percentage of polymorphic loci is 89.66% (Table 3). The size of amplified loci varied from 200 to 2500 bp. Primers ISSR 3/8 and ISSR 807 both showed a lower percentage of polymorphism compared to the other primers (75%) with PIC (Polymorphism Information Content) values respectively 47.6% and 54.6%, while primer ISSR 4/8 showed the highest polymorphism (100%) with a PIC value equal to 66.4% (Table 2).

2.5. Genetic Diversity

Among the four argan provenances, the genetic diversity showed that the number of polymorphic loci extend from 90 to 94, and the percentages of polymorphism loci (PPL) range from 77.59% to 81.03%. The observed numbers of alleles (na) were between 1.81 ± 0.39 to 1.77 ± 0.41. The effective numbers of alleles (ne) ranged from 1.41 ± 0.35 to 1.46 ± 0.35 (Table 3).
The range of Nei’s genetic diversity (h) was between 0.25 ± 0.18 and 0.27 ± 0.18. Shannon’s information indexes (I) ranged between 0.38 ± 0.25 and 0.41 ± 0.25. Among the four populations studied, “A” showed the highest genetic variability (H = 0.27; I = 0.41; PPL = 80.17%), while “H” showed the lowest variability (H = 0.25; I = 0.38; PPB = 77.59%) (Table 4).

2.6. Genetic Differentiation and Gene Flow

Using Analysis of Molecular Variance (AMOVA), highly significant (P < 0.001) genetic differentiation among populations were discovered. Results in Table 5 show that there is 18% genetic differentiation among the provenances, and 82% within the provenances. The Gst coefficient of genetic differentiation was 0.1707. The level of gene flow (Nm) was 2.43, which shows a limited rate of gene exchange among provenances.

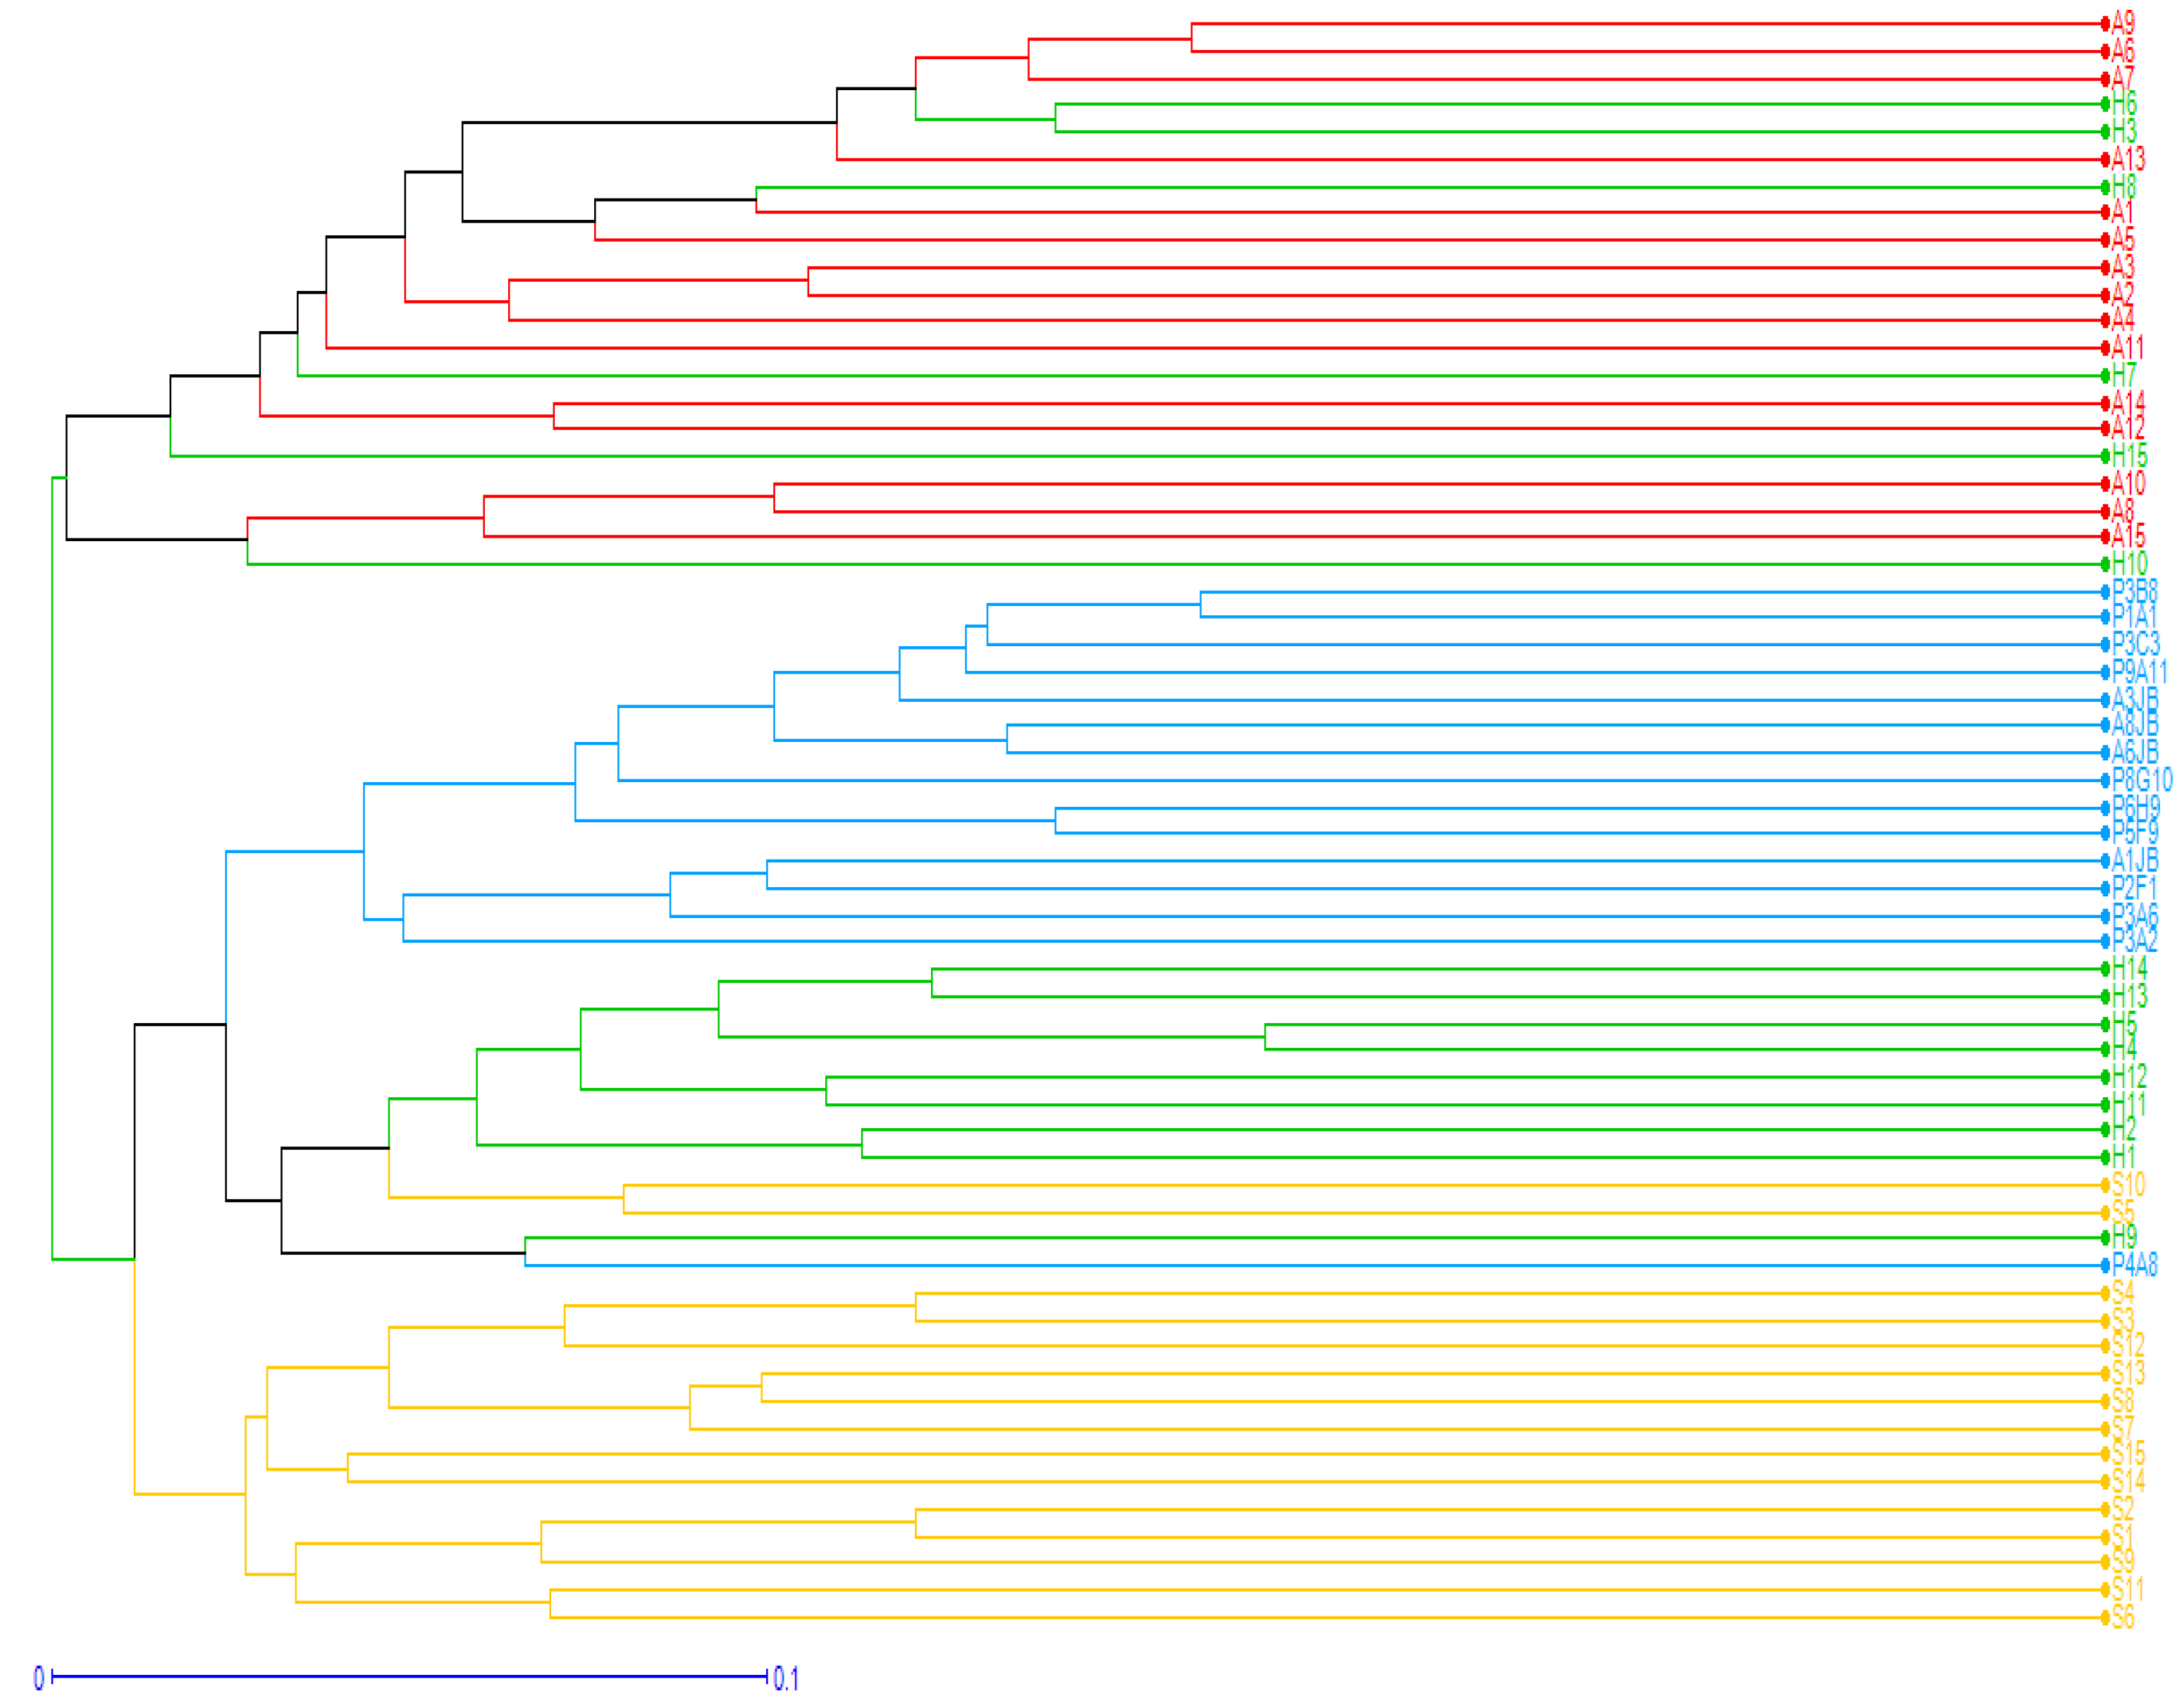
2.7. Clustering and Genetic Relationships among Argan Provenances

The results obtained from Nei’s genetic distances (Table 4) showed that the differentiation among the four provenances ranged from 0.115 between Korbous (A) and Sousse (H), to 0.272 between Botanical garden (JB) and Korbous (A). These findings were confirmed with the unweighted Pair-Group Method with Arithmetic mean (UPGMA) dendrogram which showed that the four provenances formed three major distinct groups of clusters, the first one contained a mixture of individuals from both Korbous (A) and Sousse (H), the second group subdivided into two clear subgroups one containing individuals from the botanical garden (JB), the other containing individuals from Sousse (H) plus one individual from (JB) and two from Sfax (S), while the third group was composed entirely with individuals belonging to Sfax (S) (Figure 4 and Figure 5).
Korbous (A) and Souss (H) were the closest populations and formed a single clustered group, while the majority of individuals from Sfax (S), the rest of individuals from Sousse (H) and the botanical garden (JB) formed single groups except for a few exceptions (S10, S5, P4A8). The relationship among the 60 individuals studied was also demonstrated using Factorial analysis (Figure 5).
The results obtained from these analyses show that individuals were clearly divided into three distinct groups. Using a UPGMA tree (Figure 4 and Figure 5), the first group consists mostly with individuals primarily from (JB) and (H). The second group contains all individuals from (S), while the third contains a mixture of individuals from both sites (A) and (H). Aside from a small detachment of some individuals from (S), and a detachment of one individual, “P4A8” from (JB).
The program STRUCTURE was used to investigate population structure. With the aim of assigning individuals to populations, STRUCTURE was able to confirm the results obtained by using the UPGMA tree and factorial analysis. This program uses a Bayesian algorithm to assess similarities among individuals studied within a known number of genetic groups (or genetic populations, K). Analyzing the results obtained by STRUCTURE using the program Structure Harvester is a fast way to assess and visualize genetic similarities across multiple populations, allowing for the visualization of the number of genetic groups best fitted to the resulting data set. When K = 3, an analysis of assignment probabilities for the 60 individuals studied reveals an increase in cluster resolution. The genotypes were thus grouped into three distinct clusters, the first group (red) contains trees from A and H, the second group (green) contains trees from JB, and the third group (blue) contains individuals from S (Figure 6). S and the JB provenances were observed to be genetically distinct from the two other provenances, A and H which together generated a single cluster (Figure 6.
The assignment of individuals to genetic clusters at K = 3, with the y-axis representing genetic distance and the x-axis the accession and subgroup indicated by color, and with each color representing a single gene pool.

2.8. High Resolution Melting (HRM) Analysis

High resolution melting analysis (HRM) is a fast, simple, sensitive, and cheap method for genotyping and mutation screening in variants. The normalized and temperature-shifted difference plots were obtained by HRM assays using the primer pair for the 130-bp region of the Delta-6 desaturase (D6D) gene in 60 argan samples. The samples from 60 argan individuals were collected from the four sites studied; Korbus (A), Sousse (H), Sfax (S), and Botanical Garden (JB). HRM classified 60 argan individuals into 10 different groups carrying sequence variances for the D6D gene (Table 6). HRM analysis showed that there is a high variability among argan individuals, regardless of proximity to one another.

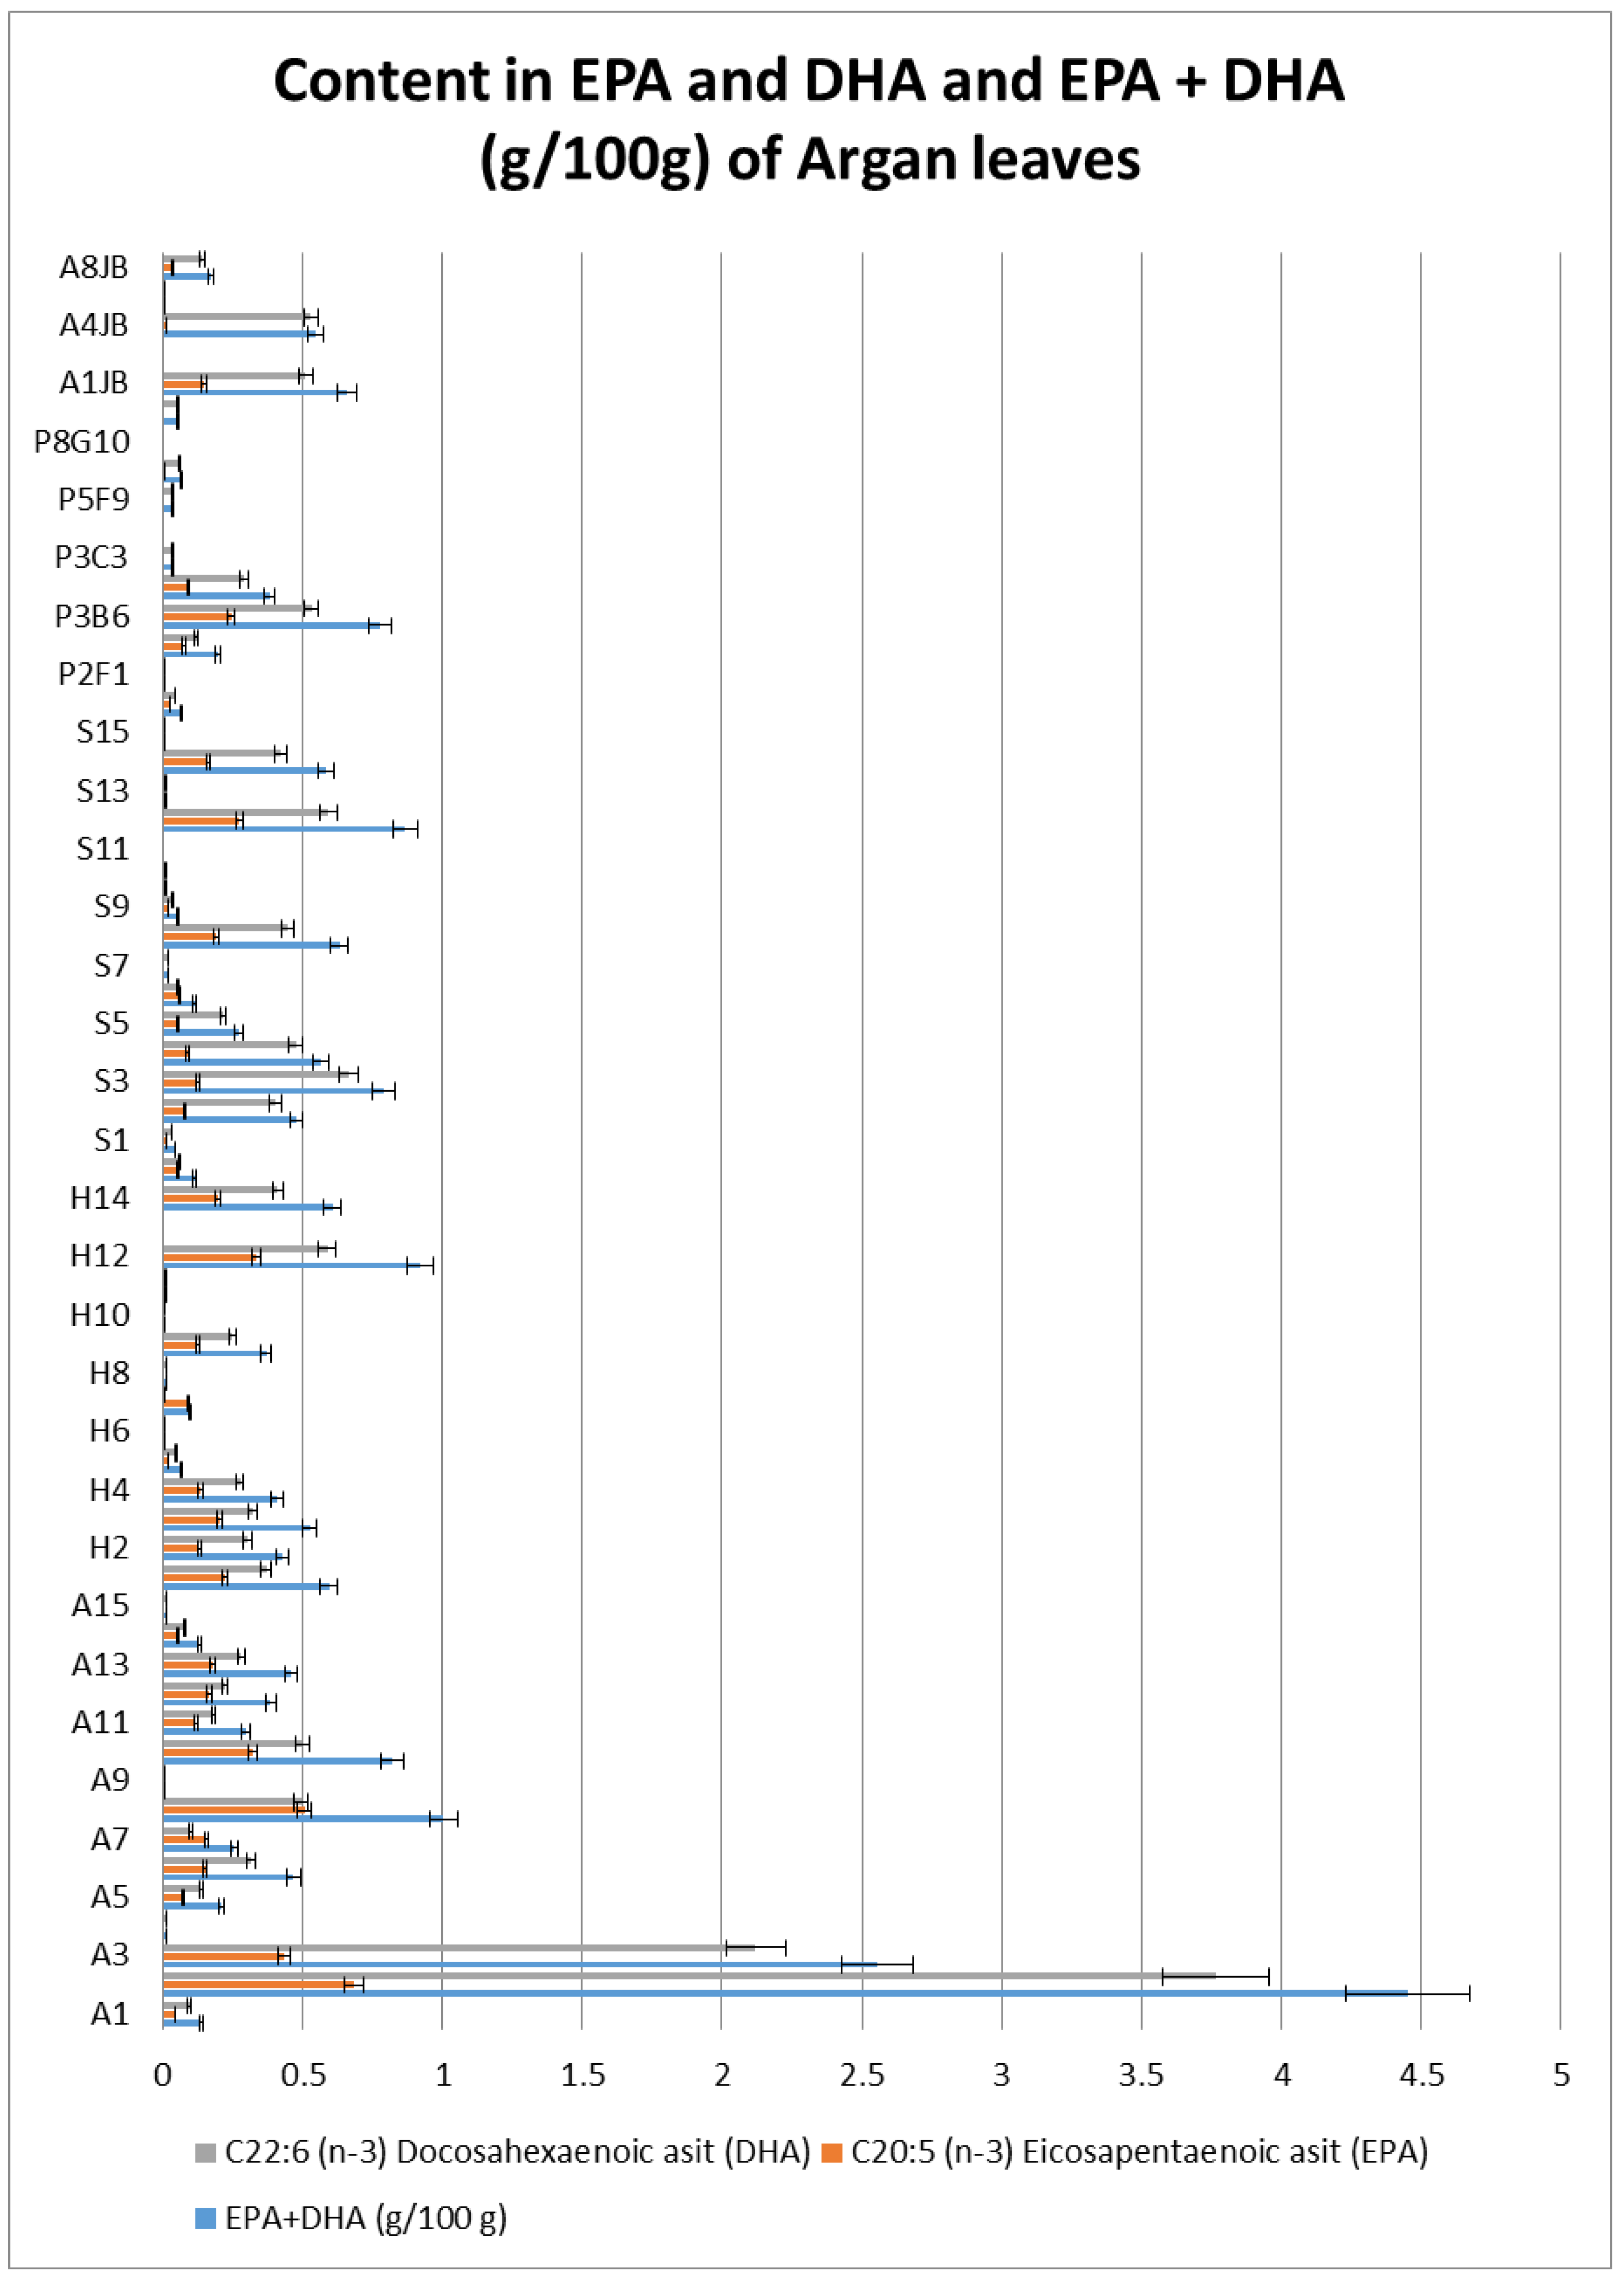
2.9. Fatty Acid Analysis

Fatty acid analysis showed high quantities of eicosapentaenoic acid (EPA) and docosahexaenoic acid (DHA). These are omega-3 fatty acids, which are normally found in cold water fish. EPA and DHA are highly unsaturated fats because they contain six and five double bonds on their long structural chains. The quantities of EPA and DHA vary from one tree to another, some trees are characterized by having high quantities of EPA and DHA while others contain only trace amounts. Individuals containing the highest quantity of EPA and DHA are those inhabiting Korbous; A2 (2.903 g/100 g), A3 (1.631 g/100 g), A8 (1.002), A10 (0.823), while individuals with the second highest quantity of EPA and DHA are found in Sfax S3 (0.788 g/100 g), S4 (0.563 g/100 g), S8 (0.632), S12 (0.866 g/100 g), S14 (0.585 g/100 g) (Figure 7). Figure 7 also shows that the content of DHA in the studied samples is generally higher than the content of EPA.

3. Discussion

3.1. Morphological Diversity

Argan trees show high levels of morphological diversity both within and between different regions within Tunisia. The variability among trees, such as the morphology of both vegetative and reproductive tissue, is visible to the naked eye. This variability was further highlighted using statistical analysis.
The results obtained from ANOVA show discriminating parameters allowing for the subdivision of argan trees into three groups. Principal component analysis (PCA) results show existence of morphological heterogeneity at both intra- and inter-site levels, taking into account quantitative and qualitative variables. These analyses prove that argan trees display considerable morphological variability. Finally, dendrogram classifying argan trees from the four populations studied indicates the presence of substantial morphological variability at the intra- and inter-site level. This variability may be a result of their geographical origin, as well as the detachment of some of these individuals from their original site. We can conclude that argan trees originating from the four sites studied demonstrate a considerable level of morphological variability at the intra- and inter-site level, which could be a result of the geographical origin of the trees themselves. These observations prove contrary to those obtained by Zahidi [30], whose results indicate great morphological diversity between individuals, independent of their geographical origin. The same results were obtained by Bani-Aameur [31] who carried out a morphological study on 30 argan individuals located in three different sites, based on observations of 11 morphological characteristics. Their results showed there was considerable morphological variability within populations, but there was no considerable diversity. We could explain these results by suggesting a high degree of plasticity within this species.

3.2. Genetic Diversity

The degree of genetic diversity between and within populations is the result of a combination of factors such as gene flow, the selection effect, inbreeding, genetic drift, and mutation [32]. When it comes to endangered or at-risk species such as the argan tree, knowing the degree of molecular diversity as well as the genetic structure of this species is an important tool in its conservation [4,5]. Recently, molecular methods have made it easier to analyze the genetic variation of different species, and many studies looking at the genetic diversity of the argan tree have used agromorphological correspondence all observing large phenotypic variability within populations [30,31,33]. In the present study, morphological characterization was performed on argan trees, and showed both inter- and intra- population diversity. However, morphological characteristics are not always enough to conclude the existence of genetic variability. DNA markers have proven to be a precise and reliable method for further analysis of this variability.
In order to adapt to and survive environmental changes, the genetic diversity of a species is vital; the higher the genetic diversity of a species, the higher its chance for survival in a changing climate. ISSRs are efficacious markers used to evaluate polymorphisms as well as the variability of many forest plant species including Argania spinosa [16,17,18,34,35,36,37,38,39].
This is the first report of genetic diversity of argan trees in Tunisia. According to the results obtained from this study, argan trees from the provenance Korbus (A), located in the North not far away from the sea, showed the highest genetic variability (H = 0.27; ne = 1.46; PPL = 80.17%), while the provenance Sousse (H) showed the lowest variability (H = 0.25; ne = 1.41; PPB = 77.59%) (Table 3 and Table 4). However, this location is dryer and characterized by a different soil composition. If all individuals were considered to have inhabited the same location, an even higher genetic diversity is noted (ne = 1.53, h = 0.32, PPL = 89.66%) (Table 3 and Table 4).
In the present study, the 10 ISSR primers showed high levels of polymorphisms when compared to those revealed using different molecular markers on the same species, such as RAPD and allozymes analysis [6,14]. When comparing ISSR markers, the genetic diversity observed in populations of argan trees found within Tunisia is relatively similar to that of argan trees in Morocco [16,17,18,20]. Mouhaddab et al. [17] showed that the genetic diversity based on Nei’s distance was between h = 0.153 and 0.233, which is still lower than the genetic diversity found between the different Tunisian sites. However, if considering all the provenances that were studied as a single source, a high genetic diversity is noted (h = 0.353) which is almost similar to Nei’s genetic diversity found between Tunisian argans. In a different study on argan trees in Morrocco, Pakhrou et al. [20] used ISSR and IRAP markers among 24 populations of the A. spinosa and showed a lower Nei’s genetic diversity in all the populations studied compared to the result found in the present study. A third study [15] on Argan trees in Morrocco with ISSR markers showed a Nei’s genetic diversity index (H) that ranged from 0.12 to 0.24 which is also lower than the genetic diversity index in our study. However, if considering all the provenances as a single source, a high genetic diversity is noted (h = 0.35), which is similar to our results.

3.3. Genetic Differentiation and Gene Flow

Genetic variability parameters showed high levels of genetic variability among the four provenances of A. spinosa in Tunisia, an unsurprising result for an endangered species characterized by small populations [40,41].
Multi locus analysis estimated from 116 loci showed diversity within the four provenances studied; (Gst = 0.17; Nm = 2.42), which is considered lower than the average genetic differentiation coefficient (Gst) among populations of A. spinosa in Morocco which indicated high genetic differentiation (Gst = 0.40), (Gst = 0.20), and (Gst = 0.54) [16,17,20]. The differentiation coefficient foundin argan trees is also lower compared to other forest species, for example sessile oak was sited with a differentiation index of Gst = 0.026 [42], Pinus sylvestris with Gst = 0.3965 [43]; Cupressus gigantea (Gst = 0.36) [44]; Machilus thunbergii (Gst = 0.4118) [39], and Rheum palmatum and Rheum tanguticum (Gst palmatum = 0.537; Gst tanguticum = 0.497) [45]. This may be a result of the ecological differences among the two countries or the limited number of samples compared to the studies in Morocco.
An ANOVA analysis has confirmed a high genetic variability within provenances, showing that 18% of the total variance was between populations while 82% was within populations. The genetic variability of argan could be explained by various factors, including their geographical localization, soil composition, and climatic changes between sites, and their breeding system [46].
We observed a genetic link between “H” Souss and Korbus “A” (Souss plain), while the two other sites were detached forming separate groups which means that gene flow between those two populations is limited. This genetic diversity can be explained by some factors as geographical barriers, wind direction, and also mode of reproduction as reported by El Mousadik and Petit that they have used allozyme markers (Gst = 0.25) PCR-RFLP and the DNAcp markers (Gst = 0.60) in their study [6]. The genetic structure of plant populations designates the interchange between many diagnostic procedures containing the long-term evolutionary history of the species, genetic mutation, genetic drift, gene flow, and selection [47,48].
In this study, the gene flow in and among sites was high as 2.42 compared to ((Nm = 0.4), (Nm = 1.78) and (Nm = 0.73)) argan populations in Morocco [16,17,18,20]. Gene flow has an important role in the determination of genetic structure. Normally whenever Nm > 1 the prevention of divergence from genetic drift is important [49]. We can then assume that pollen movements are the essential cause of this high gene flow among populations. Results with Nei’s genetic distance showed that the highest genetic variability was among “JB” and “A” sites and a lower gene difference was among “H” and “A”.

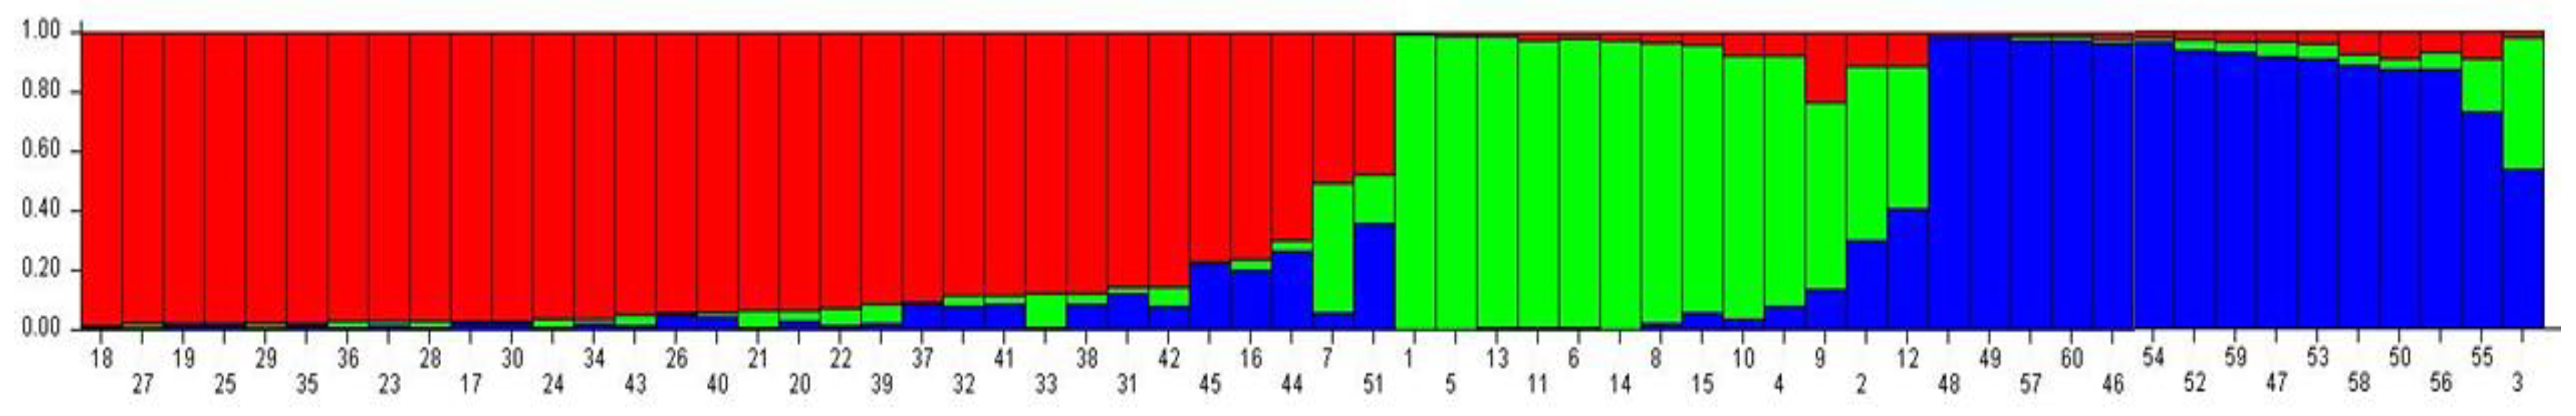
3.4. Genetic Structure

Spatial genetic structure analysis results showed that all populations were assigned to three groups, as indicated by the phylogenetic tree UPGMA (Figure 4), factorial analysis (Figure 5), and the Bayesian-based approach from the STRUCTURE program (Figure 6). The UPGMA dendrogram results showed that the argan trees used in the present study can be divided into two distinct groups or clusters. The first group is detached from other groups and present the provenence “S” the second group is divided in two subgroups, one is formed with two different provenances which are “A” and “H” which suggest that the geographic distribution is not the principal factor shaping the present populations’ genetic structure, the second subgroup is only formed with the provenance “JB” (Figure 5). The hypothesis that can explain these results is that wind and insects are the factors for the reproduction system of the argan tree pollen scattering mechanism [5,23]. The similar result was observed in the factorial analysis, as we can spot that trees from JB (from 1 to 15) and S (from 45 to 60) are forming individual groups while the two other sites form one group. This result was also confirmed by STRUCTURE program which indicates that the geographical distribution is not the main factor that formed these populations’ genetic structure. Genetic variability of argan is caused by both environmental factors and individual differences. Information about the genetic relation between the four provenances of Argania spinosa is important for possible ex situ conservation. The results that we obtained in this study improve our understanding on population structure of the argan tree and give valuable information about management implications for this species, as this diversity among populations should be maintained for later conservation of this species [50].

3.5. HRM

In this work, we reported the use of HRM analysis in plants for scanning and genotyping of A. spinosa individuals which have not reported before. The HRM analysis of gDNA PCR amplicons is a fast, simple, and cost-effective method for identification of variations of argan individuals. A 130-bp region of the D6D gene was scanned by HRM analysis to identify polymorphic variants in 60 argan individuals collected from four different regions of Tunisia. Sixty individuals were grouped into 10 different categories after HRM analysis. The HRM analysis demonstrated that there are large variations among the argan individuals for the D6D gene, even if they grow in the same location under similar conditions. Analysis of fatty acid content, especially LA and ALA, supports the HRM results. LA and ALA contents show high variability in argan individuals. The 10 different “groups” must be verified with sequencing of the PCR products to reveal the polymorphisms in an upcoming study, to reveal the polymorphisms.

3.6. Fatty Acid Analysis

Omega-3 Fatty acids (omega-3 FAs) are found normally in seafood, some plants and livestock in limited concentrations. Normally fish oils are the only concentrated source of eicosapentaenoic acid (EPA; 20:5 omega-3) and docosahexaenoic acid (DHA; 22:6 omega-3) [51]. Clinical trials proved that EPA and DHA can improve joint pain in patients with rheumatoid arthritis, and also can improve skin lesions, lower the hyperlipidemia from etretinates, decrease the toxicity of cyclosporin in patients with psoriasis, and in various animal models omega 3 fatty acids decrease the number and size of tumors and increase the time elapsed before appearance of tumors [52].
EPA and DHA actually represent a subject of much interest, because of their important roles in human health and nutrition, such as neonatal retinal and brain development, as well as cardiovascular health and disease prevention [53]. EPA is a component of mammalian cell membrane and also a precursor of the eicosanoid. It has important roles as a biological effectors involved in inflammatory responses, blood pressure regulation, blood clotting, and cell signaling [54].
According to the results in this study, the quantity of EPA and DHA is found high compared to some plants from other studies, as proved in many articles EPA and DHA are present in higher quantities than marine organisms such as fish, fish oil, shrimp. However, the quantity present in plants is normally too low, and the content in EPA and DHA has not exceeded the 0.01 g/100 g in the majority of plants which are considered as traces. Another study on Purslane leaves showed that it contains a quantity of EPA and DHA of about 0.36 g/100 g in leaves [55] which presents a very interesting quantity for plants. Later in 1996, a study concerning fatty acid percentage contents in edible wild plants was undertaken treating different plants; Beta maritima L., Cakile maritima Scopoli, Portulaca oleracea L., Amaranthus viridis L., Chenopodium album L., Sonchus oleraceus L. and Stellaria media Villars, Crithmum maritimum L., Malva sylvestris L., Parietaria diffusa Mert., Pichris echioides L., Rumex crispus L., Salicornia europaea L., Sisymbrium irio L., Sonchus oleraceus L., Sonchus tenerrimus L., Stellaria media Villars, and Verbena officinalis L. In this study, some of these mentioned plants scored the presence of EPA and DHA. The content in EPA in these different plants went from 0 to 0.9 g/100 g, the content of DHA went from 0 to 2.3 g/100 g [56], however, this present study showed that the content in EPA and DHA in argan tree leaves is considered very important compared with other plants, and what make it more interesting is that argan tree is an evergreen tree with no valorized leaves.
The main known sources of EPA and DHA are different kinds of seafood (Mackerel 1.8–5.3 g/100 g, Herring 1.2–3.1 g/100 g, Salmon 1.0–1.4 g/100 g, Tuna 0.5–1.6 g/100 g, Trout 0.5–1.6 g/100 g, Halibut 0.4–0.9 g/100 g Shrimp) [57]. Additionally, in another study, shrimp in many size categories also supplied 0.2 g/100 g of EPA plus DHA [58]. Compared to these studies, the content of EPA and DHA in agran trees in Tunisia is considered high and even comparable the content of EPA and DHA in seafood. This particular study highlights the richness of argan leaves which make it a great candidate for pharmaceutical or cosmetic products.

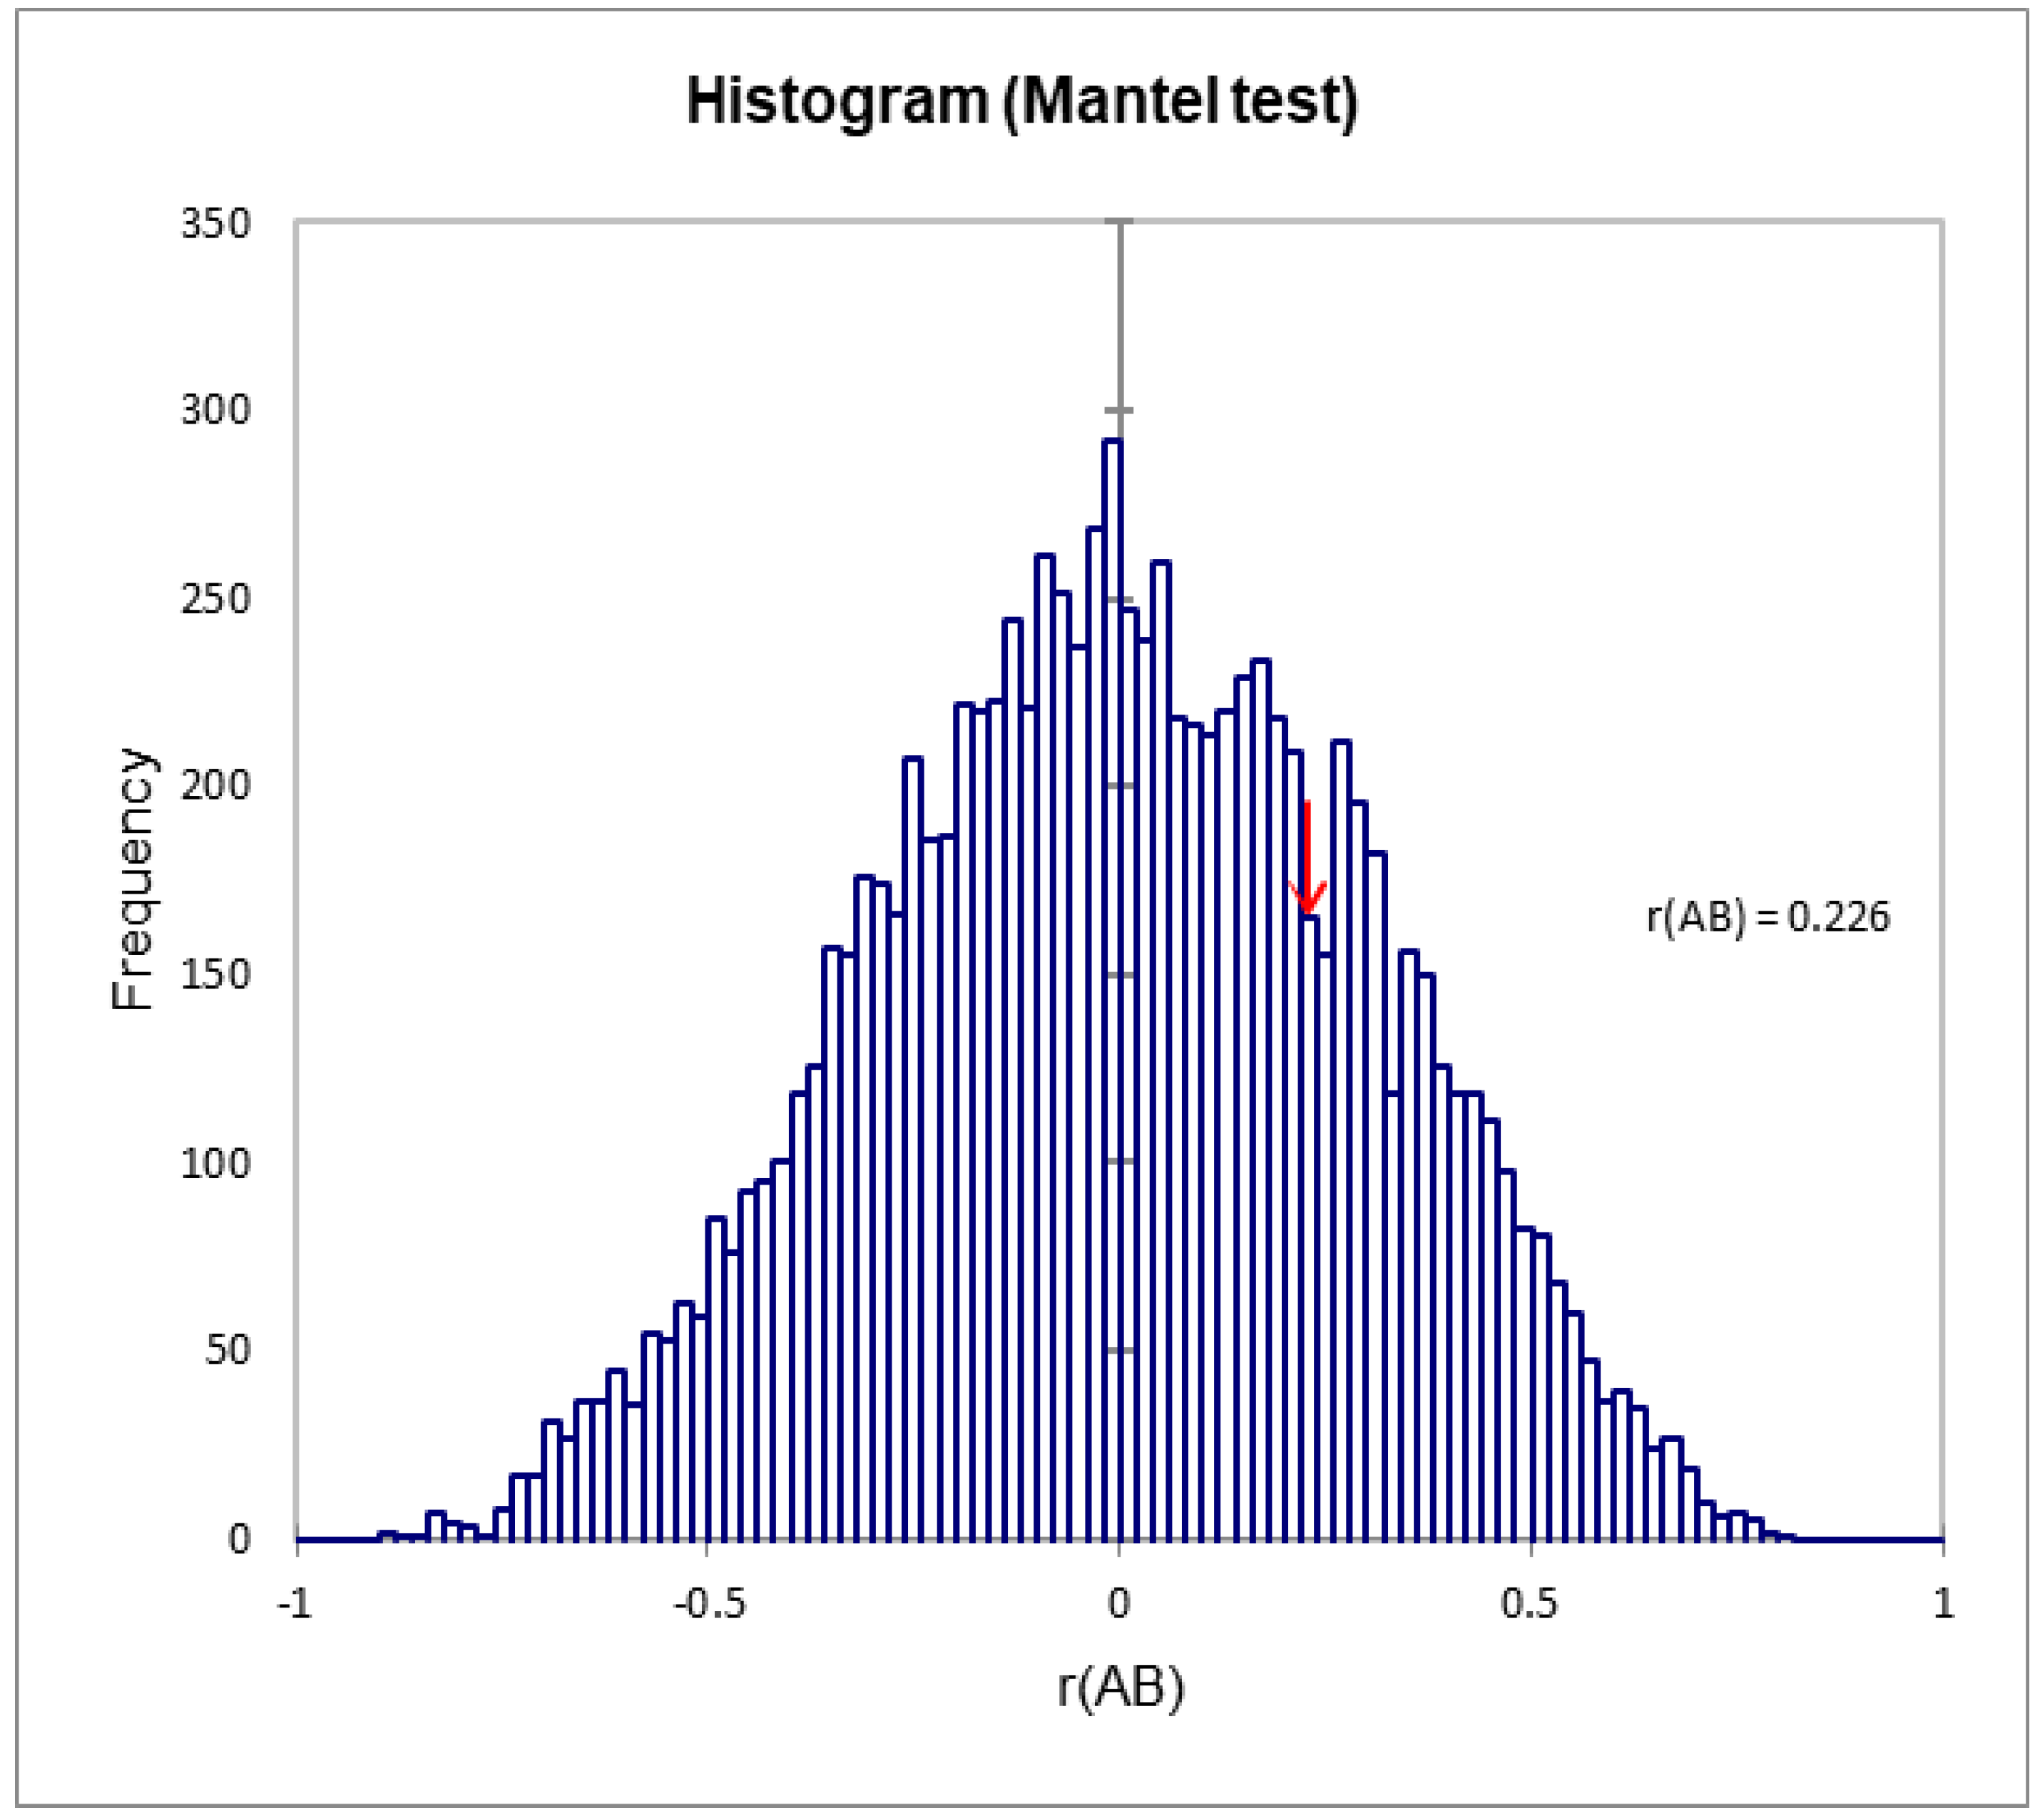
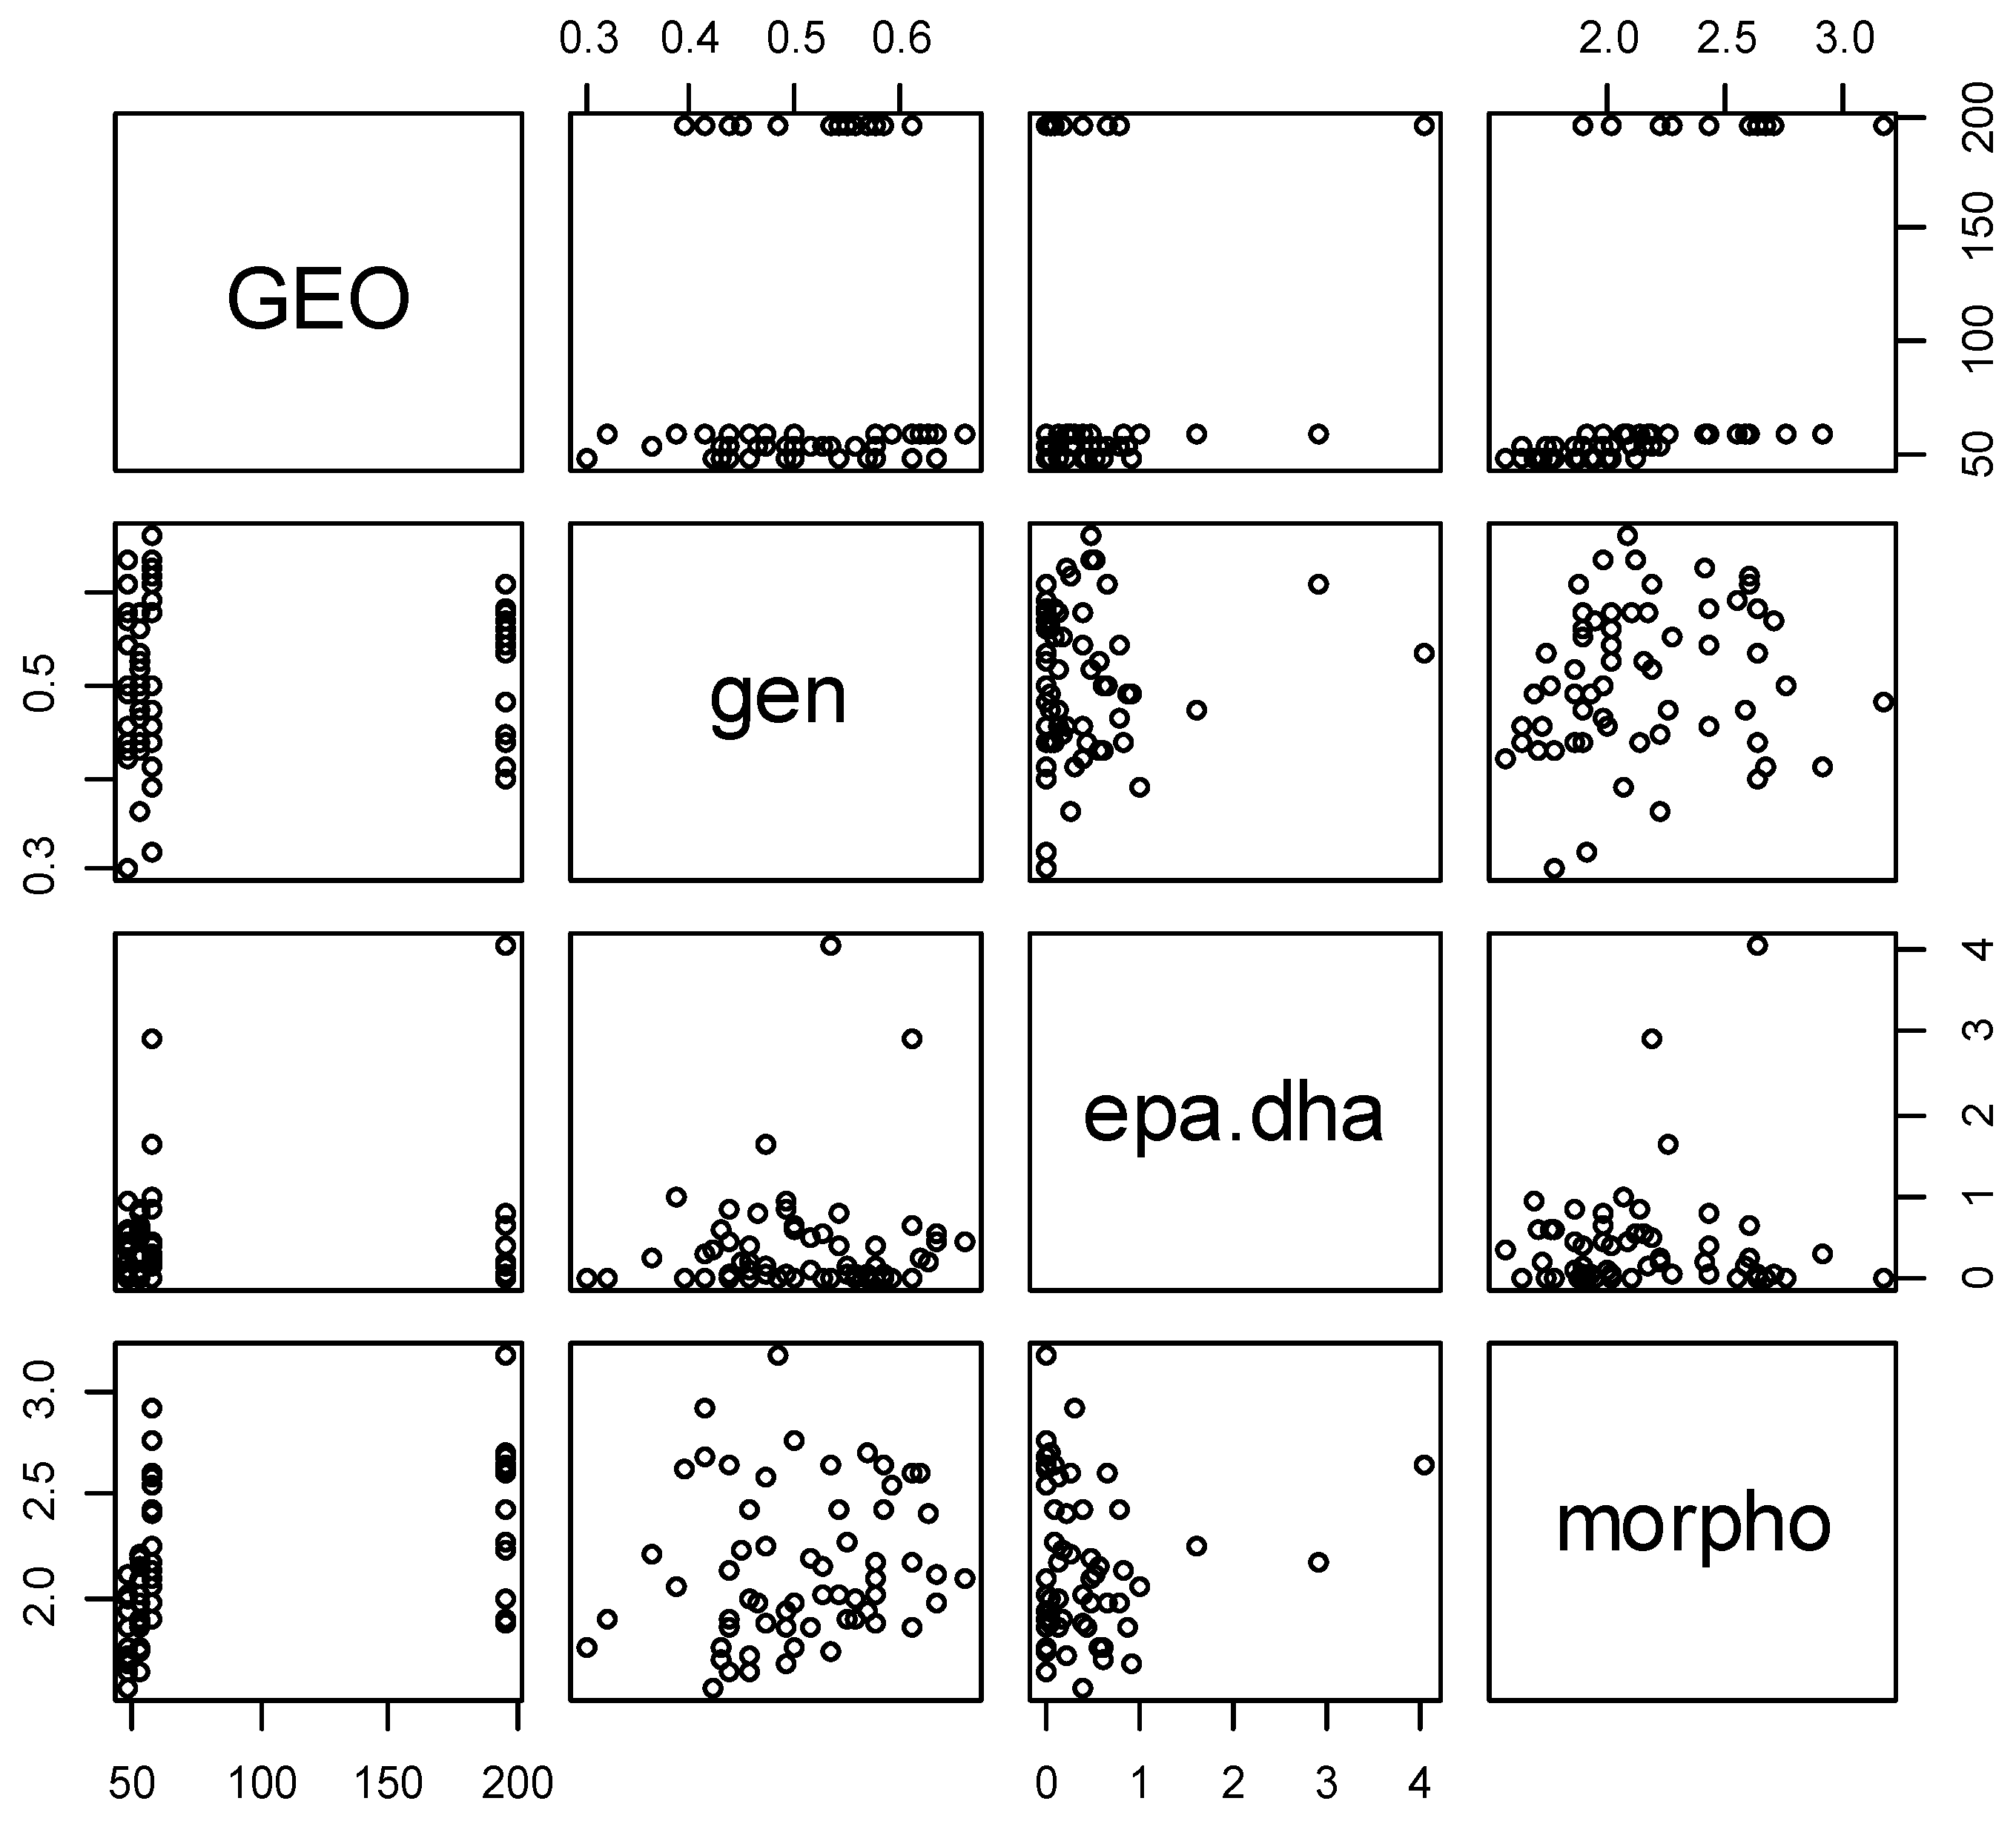
3.7. Correlation between the Different Analyses

The Mantel test was used to calculate the correlation between the genetic and geographical distances. Figure 8 shows that there was no significant correlation between geographical distance and genetic distance (r = 0.226, p = 0.481, alpha = 0.05). This indicates that the great majority of the genetic variation resided within populations.
A correlation test was conducted using Rstudio software [59] to determine the correlation between different factors (Figure 9). The only significant positive correlation was shown between the genetic and morphological factors. None of the matrices had a significant correlation with the geographical matrix. The significance of correlation of two matrices (genetic and morphological) may suggest that there is some linkage between the ISSR marker used and the morphological characters chosen. As shown by Reddy et al. (2002) [60], ISSR markers were successfully used for gene tagging or used in marker-assisted selection for agronomic traits which also represents many of the characters chosen in this work.

4. Materials and Methods

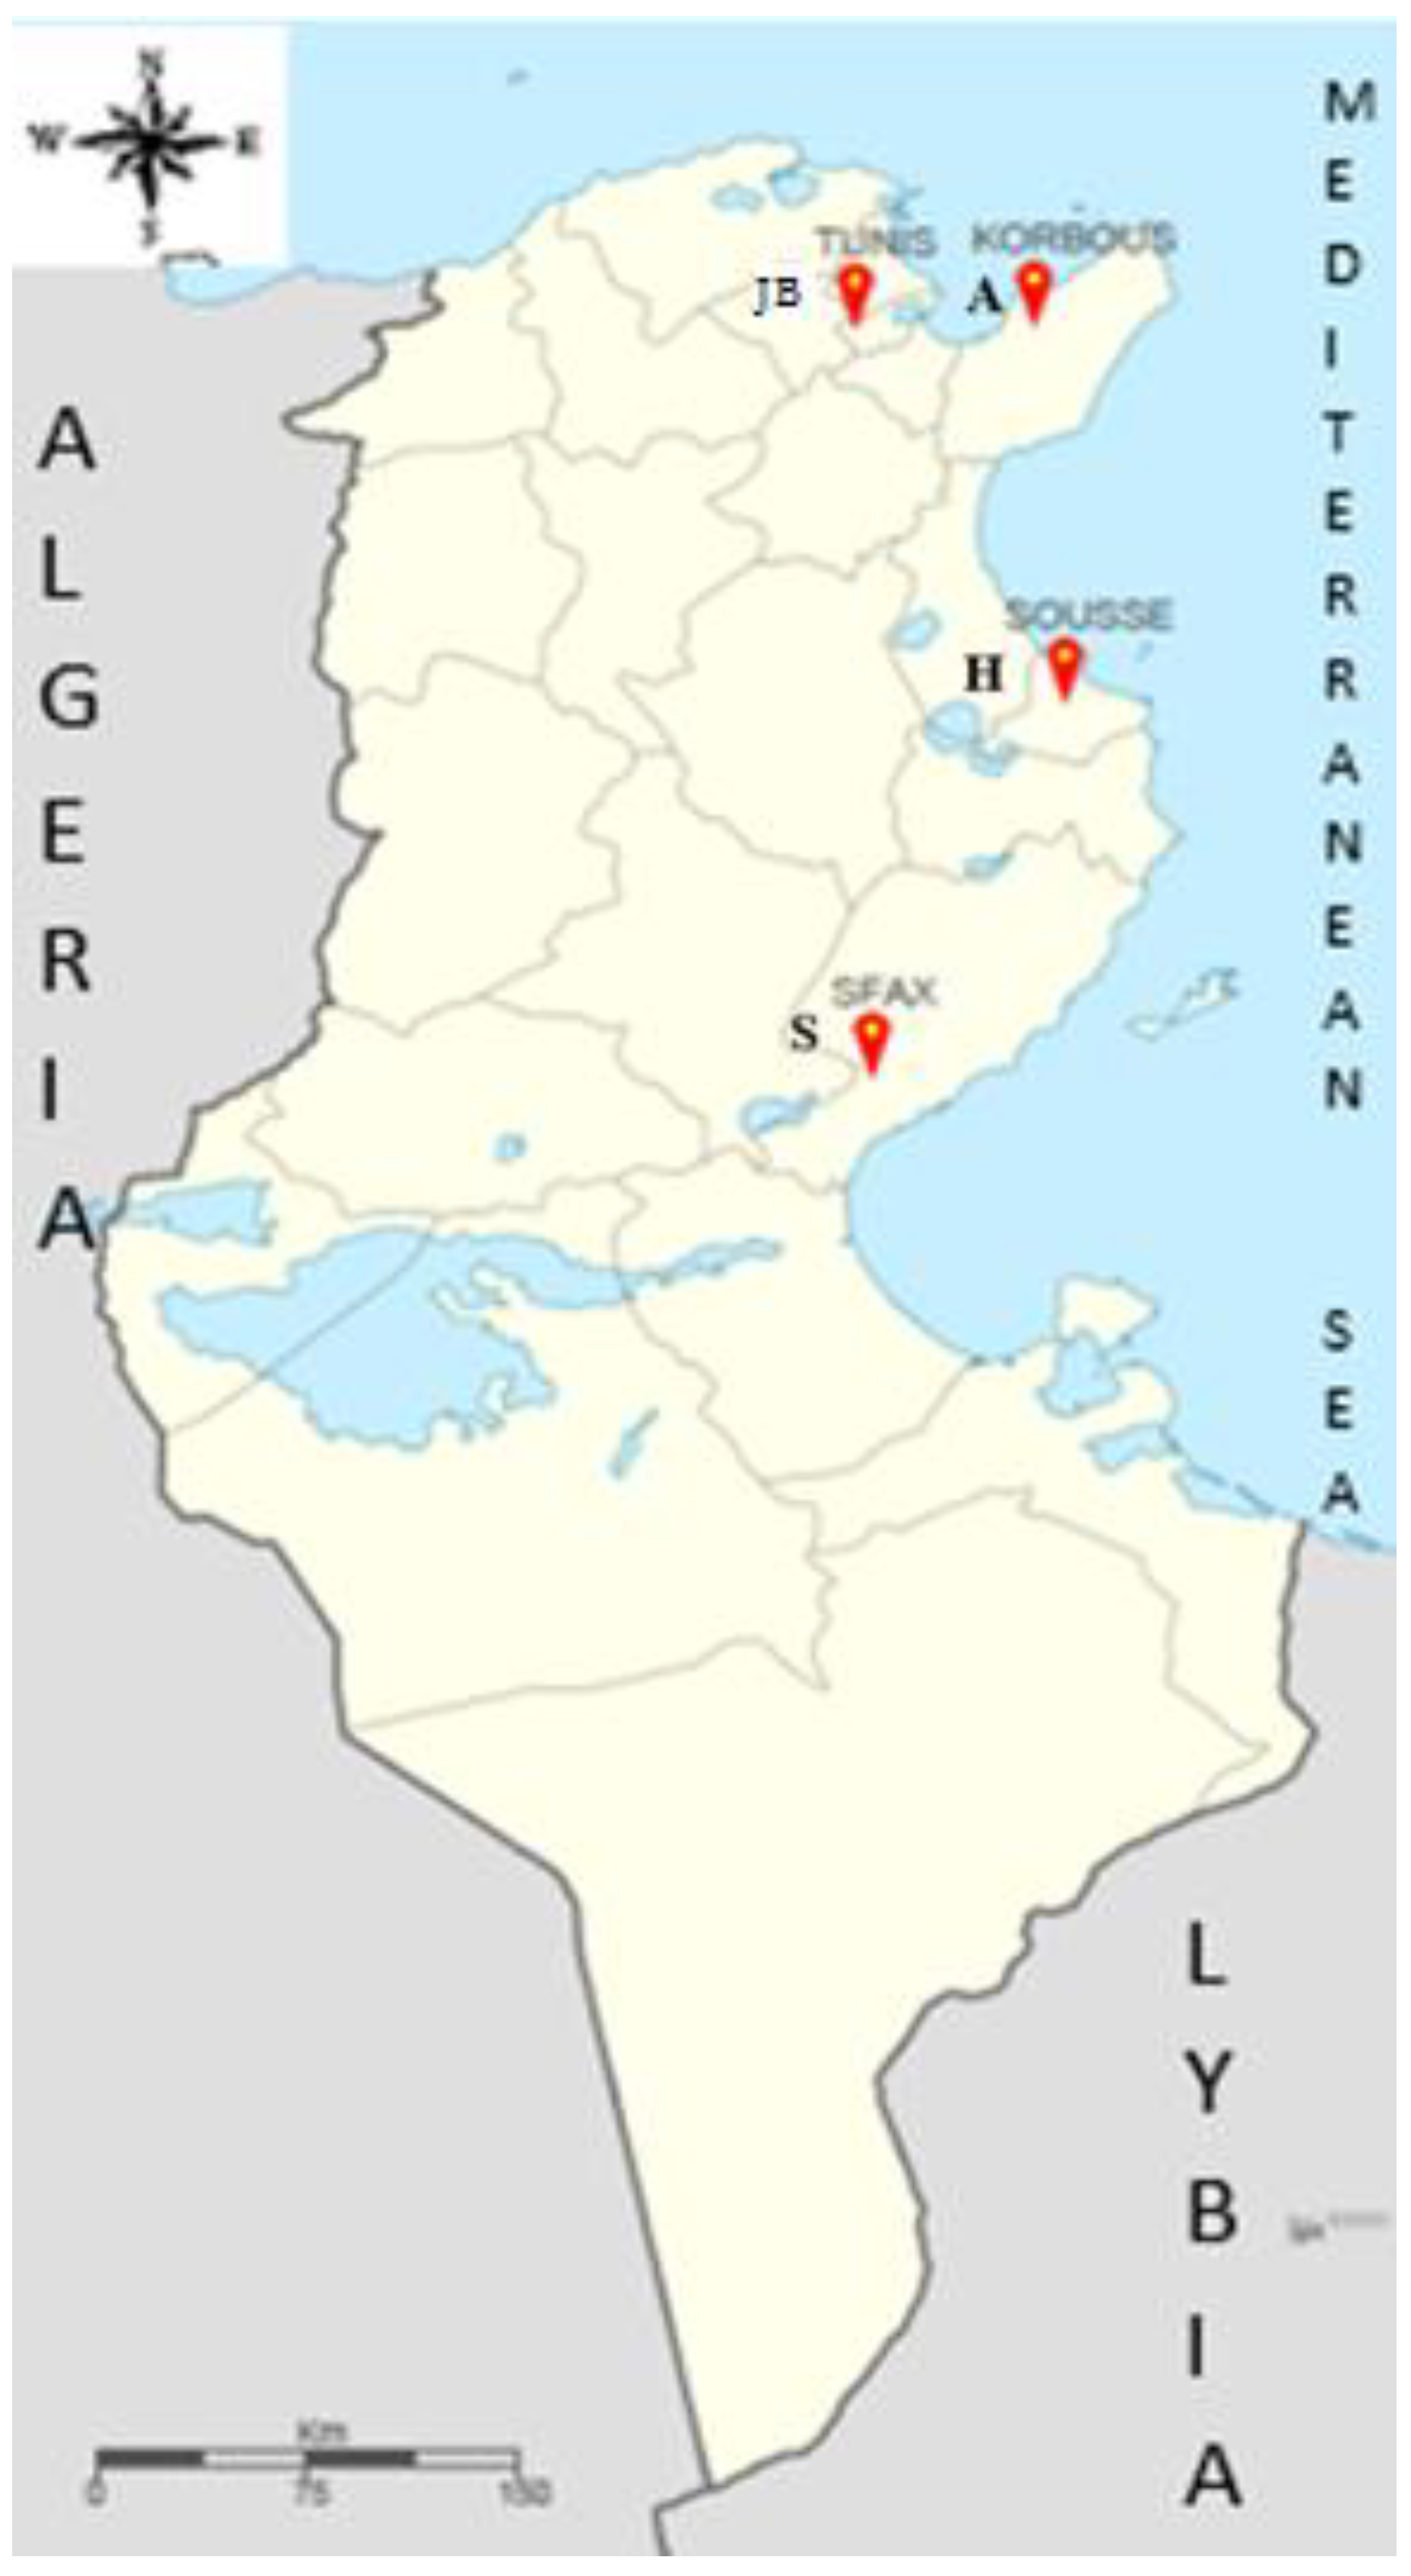
4.1. The Geographical Area of the Study

The samples of leaves and fruits used in this study were collected from 60 trees located in four different sites in Tunisia (Figure 10, Table 7) (Sfax, Souss, Korbous, Tunis (Botanical garden)). These sites are located in four different cities that have different climatic conditions in regards to the altitude and different composition of soil (Table 7). The trees growing in the botanical garden were planted in the 1960s and are from Moroccan origins from many provinces in Morocco [61], while the other sites are from unknown origins.

4.2. Morphological and Pomological Characterization

Fifteen trees from each site were chosen to carry out this study. The assessment of morphological variability was based on the observation and measurement of morphological characters related to leaves, fruits, seeds, kernels, flowers, and the general appearance of selected trees.
Several characters were chosen according to the Avocado descriptor (UPOV Code: PERSE_AME, 2010) since there is not yet a descriptor dedicated to argan trees. Morphometric analysis is essential to make a first “inventory” to identify the most discriminating and informative characters in the description of phenotypic variability and its organization. Sixty argan trees were analyzed based on quantitative and qualitative morphological characters (Table 8).
Ten fruits from each of the 60 trees were collected from different levels and positions of the tree to measure the pomological characters. The sample collection was made between June and August since argan fruits do not reach maturity at the same time. The fruits were pitted to separate the pericarp from the seeds. A morphological study was carried out on the seeds. Subsequently, the kernels of each seed were removed, and a measure of the selected kernel-related traits was established (Table 8).

4.3. Extraction and Purification of DNA

The genomic DNA was extracted from 60 trees, using a modified and optimized CTAB protocol [62]. Difficulties have been faced in isolating DNA free from contaminating proteins and polysaccharides since leaves from argan are too rich with polyphenols, tanins, and polysaccharides [63]. That is the reason why a washing step was added just after grinding leaves in liquid nitrogen and before starting with the modified CTAB protocol, which consisted of washing the grinded leaves at least five times with 1 mL of the washing solution (1M Hepes, 0.1% PVP and 4% βmercaptoethanol), until the supernatant became clear. After the washing step, the extraction protocol began with the addition of 1 mL of 2% CTAB extraction buffer (1 M Tris-HCl pH 8.0, 1.36 M NaCl; 0.5 M EDTA pH 8.0, 0.5 M Poly-Vinyl Pyrrolidone (PVP) and CTAB 2%). The tubes were then incubated at 65 °C for 60 min. Chloroform:isoamyl alcohol (24:1) was used later to extract genomic DNA, centrifugation was done at 4 °C (13.000 rpm for 12 min). To precipitate the DNA, isopropanol (2/3 volume of supernatant) was added and incubation was done for at least 1 h at −20 °C. A centrifugation at 14,000 rpm for 15 min was later performed to collect precipitated DNA. The DNA was washed by 75% ethanol. The final step consisted in drying the pellet and adding TE buffer. A classical RNAse treatment was later performed for better quality of DNA. The quality and quantity of DNA obtained were checked by nanodrop and by electrophoresis in 0.8% agarose gel containing ethidium bromide, respectively. The DNA was stored at −20 °C for later use.

4.4. ISSR Analysis

In this study, 10 ISSR primers that produced high polymorphism were used to estimate the genetic variability of 60 samples. These primers present di- and tri-repeat motifs (Table 2), previously described by Souto Alves et al. [64] that were used to check the diversity of a wide range of forest species. For example, Cassia fistula L. [24], Murraya koenigii [65], Apterosperma oblata [66]. The amplification of DNA by PCR was performed in a thermocycler (Biorad, T100, USA). Temperatures that gave a clear pattern were then repeated until the best Tm was selected. The MgCl2 concentration and annealing temperature varied according to the primers. The PCR reactions were performed in 25 μL reaction mixture containing 50 ng of genomic DNA, 1× PCR buffer Taq polymerase buffer, Taq polymerase (1 U), 0.2 mM of dNTP, and 0.2 mM of primers. The concentration of MgCl2 depends on the nature of the primers. The program performed starts with an initial denaturation cycle at 94 °C for 5 min; followed by 30 cycles of 30 s denaturation at 94 °C, annealing at 47–60 °C for 30 s (depending on the type of primers) and 45 s extension at 72 °C; and ending with final extension cycle at 72 °C, for 10 min. The PCR products were visualized by 2% agarose gel.

4.5. PCR and HRM Conditions

HRM reactions were carried out in two rounds to detect delta-6-desaturase (D6D) variants in 60 A. spinosa individuals. In the first round, D6D (Accession number: AY131238.1) was amplified using 20 ng genomic DNA with primers D6D-F1:5′-CGATTCTTGGGAAAGCCTATGA-3′ and D6D-R1:5′-CATGTAGAGGCAGGATGGAATG-3′. PCR reactions included 0.4 µM forward and reverse primers ((0.25 mM dNTPs, 2 mM MgCl2 and 1 U GoTaq DNA polymerase (Promega, San Luis Obispo, CA, USA)). PCR cycling conditions were programmed as initial denaturation at 95 °C for 10 min, followed by 35 amplification cycles of denaturation at 95 °C for 15 s, annealing at 60 °C for 15 s, and elongation at 72 °C for 15 s with a final extension at 72 °C for 5 min in a thermal cycler (Bio Rad, T100, Hercules, CA, USA). Resulting PCR products were analyzed in 1.2% agarose gels. In the second round, HRM-PCR reactions were performed in a Light Cycler 480 II (Roche Applied Sciences, Indianapolis, IN, USA) and first-round PCR products, diluted 50 fold, were used as DNA template in HRM-PCR reactions. HRM-PCR reactions were performed in a final volume of 10 µL containing 1× the Luminaris Color HRM qPCR Master Mix (Thermo™, Waltham, MA, USA), 0.25 µM of each internal primer, and diluted first round PCR products. Amplification and melting conditions were as follows: 95 °C for 10 min, 35 cycles at 95 °C for 15 s, 60 °C for 15 s, 72 °C for 15 s, and melting at a gradient from 60 to 95 °C at 0.02 °C per second, 25 fluorescence acquisitions per 1 °C [67]. Two technical replicates were used in all reactions and data was analyzed by using Gene Scanning Program Ver. 1.5.

4.6. Fatty Acid Analysis

Total lipids were extracted from lyophilized leaves. After the 24 h rotary extraction with petrolium ether, methyl esters were analyzed [68]. The analysis of fatty acid methyl esters was performed by using gas chromatography (GC) (Perkin-Elmer Claurus 500 GC, Autosystem XL, FID, GC Software Turbochrom 4.1, Awenud-Shelton, DE, USA). GC conditions were as follows: Column SGE BPX70 (SGE Analytic Science, Australia) 60 mm × 0.25 mm ID × 0.25 μm, injection volume 1 μL, injection temperature 220 °C, air 450 mL/min, H2 45 mL/min, flame ionization detector (FID) temperature 240 °C and column temperature, 120 °C for 5 min, programmed at 5 °C increments per min up to 240 °C for 15 min (total program process time was 45 min). Fatty acid methyl esters were identified by comparison of their retention times with a known reference material (Certificated Argan oil) and authentic standards (Supelco 37 Component FAME Mixture, 47885-U Supelco). Two replicate GC analyses were performed, and the results of fatty acid methyl esters were calculated as %. Fatty acid as mg/100 g dried leaves were calculated according to Equation (1):
Fatty acid (mg/100 g): (the percent value of fatty acid × fatty content (g/100 g))/100

4.7. Statistical Analysis

The morphological data was analyzed by different statistical procedures of Rstudio software [69] and XLSTAT software version 2014.5.03 (XLStat software; Addinsoft, Paris, France). ANOVA was performed by XLSTAT software version 2014.5.03. This analysis makes it possible to compare the averages of the parameters measured in several populations [69,70]. It defines the difference among individuals and the residual variation within and between the groups of individuals studied. Thus, the comparison of the variances allows us to conclude on the difference among the intra- and inter-population variance. The degrees of freedom are calculated according to the following Equations (2) and (3) [3]:
k1 = (p − 1),
k2 = p (n − 1) with p: number of populations and n: number of individuals.
Furthermore, a joint analysis of all the parameters was applied to study the morphological variability and its structuring by performing a principal component analysis (PCA) for the quantitative variables. A classification dendrogram was constructed according to Ward’s method based on gower distance all with the software Rstudio. Genetic determinism of ISSR primers is dominant. The amplified fragments on the agarose gel, presented bands in different level according to their molecular weight (bp) the bands were scored using a binary code (present (1) or absent (0)). The exact location of bands and the exact molecular weight were determined with gelpro32 (Syngene, Inc., San Diego, CA, USA). Each of these fragments represents a locus. Data was compiled in a 0/1 binary data matrix of 60 individuals using MS Excel. The parameters related to the genetic variability in and between sites (i.e., the percentage of polymorphic bands (PPB), Nei’s gene diversity (h), Nei’s genetic differentiation index among populations (Gst), allelic richness (A), and gene flow (Nm)) were estimated using POPgen 1.32 [71]. An estimate of Nm among populations was calculated with the formula of Nm = 0.5 (1–Gst)/Gst [72]. The genetic distance matrix was employed to construct a UPGMA dendrogram based on genetic distances calculated with Maximum Composite Likelihood in Popgene ver. 1.32 [73] and imported to MEGA6 [74]. The software Darwin version 6.0.10 [75] was used for factorial analysis and again for another version of UPGMA which we used eventually in this present study. The molecular variance (AMOVA), using GenALEX version 6.5b3 [76], was used to estimate the distribution of the genetic variation between and within the different provenances. A Bayesian analysis of ISSR population structure on the entire data set, using STRUCTURE 3.2 [77], was used to test for genetic admixture across provenances. STRUCTURE algorithm was run using the basic model with admixture and correlated allele frequencies, with the assumed number of genetic K clusters varying from 1 to 10 (the total number of provenances), 10 replicate runs per K value (number of populations), and the burn-in period and Markov Chain Monte Carlo (MCMC) set to 500,000 and 5,000,000 iterations, respectively. To provide a fast way to assess and visualize likelihood values across multiple values of K for easier detection of the number of genetic groups that best fit the data, the program ‘structure harvester’ was used [78].
A Mantel test was performed to determine the correlation between the genetic distance [79] and the geographical distance among the populations using the XLSTAT.
A correlation test was conducted using Rstudio software [59] to determine the correlation between the different factors.

5. Conclusions and Perspective

In order to study the morphological, molecular, and biochemical diversity of argan trees in Tunisia, 60 trees were selected for this study, and leaves and fruits from each tree were collected. With regard to edaphic conditions, the argan tree has no requirement for soil type, based on the results obtained.
In the first part of this study it appears that the argan tree normally develops in different types of soils (sandy and loamy), tolerates a wide pH range from 4 to 8.3, and a high concentration of limestone. The argan tree is a thermophilic and xerophilic tree, whose range overlaps with both humid and arid bioclimates. The introduction of this species into reforestation programs offers a sustainable reforestation solution in the arid and semi-arid zones and also in those affected by salinity and would therefore allow diversified exploitations. For the morphological characterization part, results have shown the existence of different forms, colors, and sizes of fruit and leaves. The results obtained from ANOVA showed that some are more discriminating than others which allowed to subdivide the 60 argan trees in three groups. Principal component analysis (PCA) showed that individuals belonging to the four sites exhibit considerable morphological variability, taking into account quantitative and qualitative variables. The results obtained from Ward’s dendrogram showed a classification of argan trees studied. These results indicated the presence of substantial morphological variability at the intra- and inter-site level. These groups could be dependent on the geographical origin, and we noticed also a formation of three groups; trees from Sfax and Sousse overlapped in same group while trees from Botanical garden and Korbous formed individual groups, although some detachment of some individuals from their original sites was observed.
In the second part of this study, a great level of genetic variation among ISSR markers was shown, as a result of this study, proving that ISSR was an efficient method to assess the genetic differentiation in argan trees. A high amount of genetic diversity within argan populations was shown by AMOVA analysis, which indicates that every site is very important for the argan tree gene pool. The results with UPGMA, factorial analysis, and STRUCTURE analyses divided all the individuals into three groups; one group contains individuals from both sites Korbous and Sousse the two other sites formed individual groups. This result did not correlate with the morphological characterization results, which leads to the conclusion that the morphological diversity determined by ISSR is not related to the morphological variability determined with the chosen variables.
In the third part of this study, HRM was performed to detect D6D gene polymorphisms, which divided the 60 individuals to 10 groups. We could not correlate this result to the results of molecular diversity with ISSR or with the other parts of this study. In fact, each study divided the samples into different groups. Conservation strategies should be planned to preserve this high genetic diversity within populations and to prevent potential extinction of this important species in Tunisia.
Based on our results we suggest possible strategies for conservation of argan trees. In the last part, fatty acid analysis by gas chromatography showed that argan tree leaves are rich in omega 3 and 6, and more importantly in eicosapentaenoic acid (EPA) and docosahexaenoic acid (DHA) which is interesting since normally plants do not produce EPA or DHA. Both EPA and DHA quantities produced in some trees are even more than that produced in salmon fish or comparable to herring fish which are known for its high concentration of EPA and DHA, so this result can be revolutionary. In view of these results, it would be interesting to grow these particular trees that scored the highest quantity of EPA and DHA, in order to develop a genetic selection that would increase the ratio of EPA/DHA.
Argan trees in Tunisia are not valued or exploited in any field, and they are totally neglected, contrary to argan in Morocco which are overexploited.
-
The first most important management practice is to increase awareness about the importance of this species and start exploiting these trees with moderation especially trees with high genetic diversity. At the same time, we should allow populations to increase in size through natural regeneration and also try to grow argan trees in different locations in Tunisia, especially locations under the threat of desertification since it tolerates high temperatures and salinity and fights desertification.
-
The second possible strategy is to focus on the establishment of an ex situ conservation program by seed storage from all the four sites to preserve most of the genetic variation.
-
The third possible strategy consists of building a gene bank with a large number of plantations in a natural reserve, taking into consideration all the populations and genetic groups so that we can increase the possibility of gene exchange and ensure long-term conservation of this genetic variation. Knowing the economical, ecological, nutritional, and pharmaceutical value of this tree, it is important to increase awareness in Tunisia about the importance of this tree in order to preserve it. In addition, it would be interesting to combine the studies on the distribution of genetic diversity with other information such as oil composition and morphological characters per population.

Author Contributions

M.L. conceived the study, collected the samples, performed the ISSR analysis, the morphological characterization, analyzed the data and wrote the manuscript; N.T.-K., performed the fatty acid analysis supervised all the work and corrected the article; C.U. and B.A. performed the HRM analysis; B.G. helped with the morphological characterization; A.S.H. Thesis director and supervisor. All authors reviewed the manuscript.

Funding

This research was funded by the Research Fund of the Istanbul University grant number 23543.

Conflicts of Interest

The authors declare no conflict of interest.

References

  1. Berrougui, H.; Cloutier, M.; Isabelle, M.; Khalil, A. Phenolic-extract from argan oil (Argania spinosa L.) inhibits human low-density lipoprotein (LDL) oxidation and enhances cholesterol efflux from human THP-1 macrophages. Atherosclerosis. 2006, 184, 389–396. [Google Scholar] [CrossRef] [PubMed]
  2. Majourhat, K.; Jabbar, Y.; Araneda, L.; Zeinalabedini, M.; Hafidi, A.; Martínez-Gómez, P. Karyotype characterization of Argania spinosa (L.) Skeel (Sapotaceae). S. Afr. J. Bot. 2007, 73, 661–663. [Google Scholar] [CrossRef]
  3. Msanda, F.; El Aboudi, A.; Peltier, J.P. Biodiversité et biogéographie de l’arganeraie marocaine. Cah. Agric. 2005, 14, 357–364. [Google Scholar]
  4. Thompson, J.D. Population differentiation in Mediterranean plants: insights into colonization history and the evolution and conservation of endemic species. Heredity 1999, 82, 229–236. [Google Scholar] [CrossRef] [PubMed]
  5. Hamrick, J.L. The distribution of genetic variation within and among natural plant populations, in Genetics and Conservation (eds C. M. Schonewald-Cox, S.M. Chambers, B. MacBryde and W. L. Thomas), Benjamin/Cummings, London, 1983, pp. 335–44. Hamrick, J.L.; Godt, M.W. Effects of life history traits on genetic diversity in plant species. Philos. Trans. R. Soc. Lond. Ser. B Biol. Sci. 1996, 351, 1291–1298. [Google Scholar]
  6. El Mousadik, A.; Petit, R.J. High level of genetic differentiation for allelic richness among populations of the argan tree [Argania spinosa (L.) Skeels] endemic to Morocco. Theor. Appl. Genet. 1996, 92, 832–839. [Google Scholar] [CrossRef]
  7. El Mousadik, A.; Petit, R.J. Chloroplast DNA phylogeography of the argan tree of Morocco. Mol. Ecol. 1996, 5, 547–555. [Google Scholar] [CrossRef]
  8. Nouaim, R.; Chaussod, R.; El Aboudi, A.; Schnabel, C.; Peltier, J.P. L’arganier. Essai de synthèse des connaissances sur cet arbre. Groupe d’étude de l’arbre, Editor. Physiologie des Arbres et Arbustes en Zones Arides et Semi Arides 1991, 373–388. (In French) [Google Scholar]
  9. Qian, W.; Ge, S.; Hong, D.Y. Genetic variation within and among populations of a wild rice Oryza granulata from China detected by RAPD and ISSR markers. Theor. Appl. Genet. 2001, 102, 440–449. [Google Scholar] [CrossRef]
  10. Shokri, E.; Nematzadeh, G.; Zolala, J.; Nasiri, N.; Kazemi-Tabar, S.K.; HosseinpourAzad, N. Delta-6 desaturase makes a different fatty acid profile of seed oil in Iranian borage (Echium amoenum Fisch. and Mey.). Acta Physiol. Plant. 2012, 34, 2413–2418. [Google Scholar] [CrossRef]
  11. Adiguzel, A.; Agar, G.; Baris, O.; Gulluce, M.; Sahin, F.; Sengul, M. RAPD and FAME analyses of Astragalus species growing in eastern Anatolia region of Turkey. Biochem. Syst. Ecol. 2006, 34, 424–432. [Google Scholar] [CrossRef]
  12. Krauss, R.M.; Eckel, R.H.; Howard, B.; Appel, L.J.; Daniels, S.R.; Deckelbaum, R.J.; Erdman, J.W., Jr.; Kris-Etherton, P.; Goldberg, I.J.; Kotchen, T.A.; et al. AHA Dietary Guidelines: Revision 2000: A statement for healthcare professionals from the Nutrition Committee of the American Heart Association. Circulation 2000, 102, 2284–2299. [Google Scholar] [CrossRef] [PubMed]
  13. Ursin, V.M. Modification of plant lipids for human health: Development of functional land-based omega-3 fatty acids. J. Nutr. 2003, 133, 4271–4274. [Google Scholar] [CrossRef] [PubMed]
  14. Majourhat, K.; Jabbar, Y.; Hafidi, A.; Martínez-Gómez, P. Molecular characterization and genetic relationships among most common identified morphotypes of critically endangered rare Moroccan species Argania spinosa (Sapotaceae) using RAPD and SSR markers. Ann. For. Sci. 2008, 65, 1. [Google Scholar] [CrossRef]
  15. Mouhaddab, J.; Msanda, F.; Filali-Maltouf, A.; Belkadi, B.; Ferradouss, A.; El Modafar, C.; El Mousadik, A. Using microsatellite markers to map genetic diversity and population structure of an endangered Moroccan endemic tree (Argania spinosa L. Skeels) and development of a core collection. Plant Gene 2017, 10, 51–59. [Google Scholar] [CrossRef]
  16. Aabd, N.A.; Msanda, F.; Mousadik, A.E. Genetic diversity of the endangered argan tree (Argania spinosa L.) (sapotaceae) revealed by ISSR analysis. Basic Res. J. Agric. Sci. Rev. 2015, 4, 176–186. [Google Scholar]
  17. Mouhaddab, J.; Naima, A.I.T.; Achtak, H.; Msanda, F.; Zahidi, A.; Filali-Maltouf, A.; Ferradouss, A.; El Modafar, C.; Nejmeddine, M.; El Mousadik, A. Patterns of genetic diversity and structure at fine scale of an endangered Moroccan endemic tree (Argania spinosa L. Skeels) based on ISSR polymorphism. Not. Bot. Horti Agrobot. Cluj-Napoca 2015, 43, 528–535. [Google Scholar] [CrossRef]
  18. Yatrib, C.; Belkadi, B.; Pakhrou, O.; Alami, M.; Medraoui, L.; El, A.; Mousadik, A.F.; Msanda, F.; El Modafar, C.; Souda-Kouraichi, S.I.; et al. Assessment of genetic diversity of Argania spinosa L. growing in arid and semi-arid areas of Morocco as revealed by Inter-Simple Sequence Repeats. J. Agric. Sci. Technol. B 2015, 5, 336–346. [Google Scholar]
  19. Pakhrou, O.; Medraoui, L.; Yatrib, C.; Alami, M.; Souda-kouraichi, S.I.; Ferradous, A.; Msanda, F.; Filali-Maltouf, A.; Belkadi, B. Study of genetic diversity and differentiation of argan tree population (Argania spinosa L.) using AFLP markers. Aust. J. Crop Sci. 2016, 10, 990. [Google Scholar] [CrossRef]
  20. Pakhrou, O.; Medraoui, L.; Yatrib, C.; Alami, M.; Filali-maltouf, A.; Belkadi, B. Assessment of genetic diversity and population structure of an endemic Moroccan tree (Argania spinosa L.) based in IRAP and ISSR markers and implications for conservation. Physiol. Mol. Boil. Plants 2017, 23, 651–661. [Google Scholar] [CrossRef]
  21. Zietkiewicz, E.; Rafalski, A.; Labuda, D. Genome fingerprinting by simple sequence repeat (SSR)-anchored polymerase chain reaction amplification. Genomics 1994, 20, 176–183. [Google Scholar] [CrossRef] [PubMed]
  22. Ganopoulos, I.; Kalivas, A.; Kavroulakis, N.; Xanthopoulou, A.; Mastrogianni, A.; Koubouris, G.; Madesis, P. Genetic diversity of Barbary fig (Opuntia ficus-indica) collection in Greece with ISSR molecular markers. Plant Gene 2015, 2, 29–33. [Google Scholar] [CrossRef]
  23. Scotti-Saintagne, C.; Mariette, S.; Porth, I.; Goicoechea, P.G.; Barreneche, T.; Bodénes, C.; Burg, K.; Kremer, A. Genome scanning for interspecific differentiation between two closely related oak species [Quercus robur L. and Quercus petraea (Matt.) Liebl.]. Genetics 2004, 168, 1615–1626. [Google Scholar] [CrossRef] [PubMed]
  24. Mohanty, S.; Das, A.B.; Ghosh, N.; Panda, B.B.; Smith, D.W. Genetic diversity of 28 wild species of fodder legume Cassia using RAPD, ISSR and SSR markers: a novel breeding strategy. J. Biotech Res. 2010, 2, 44. [Google Scholar]
  25. Prakash, L.; Middha, S.K.; Mohanty, S.K.; Swamy, M.K. Micropropagation and validation of genetic and biochemical fidelity among regenerants of Nothapodytes nimmoniana (Graham) Mabb. employing ISSR markers and HPLC. 3 Biotech 2016, 6, 171. [Google Scholar] [CrossRef]
  26. Santana, J.G.S.; Nascimento, A.L.S.; Costa, T.S.; de Almeida, T.M.B.; Rabbani, A.R.C.; MUNIZ, A.D.S. Estimation of genetic diversity in a natural population of cambui tree (Myrciaria tenella O. Berg) using ISSR markers. Embrapa Tabuleiros Costeiros-Artigo em Periódico Indexado (ALICE) 2016. [Google Scholar] [CrossRef] [PubMed]
  27. Ringnér, M. What is principal component analysis? Nat. Biotechnol. 2008, 26, 303. [Google Scholar] [CrossRef]
  28. Nei, M. Analysis of gene diversity in subdivided populations. Proc. Natl. Acad. Sci. USA 1973, 70, 3321–3323. [Google Scholar] [CrossRef]
  29. Nei, M. Estimation of average heterozygosity and genetic distance from a small number of individuals. Genetics 1978, 89, 583–590. [Google Scholar]
  30. Zahidi, A.; Bani-Aameur, F.; Mousadık, E. Morphological variability of the fruiting branches in Argania spinosa: Effects of seasonal variations, locality and genotype. J. Hortic. For. 2013, 5, 168–182. [Google Scholar]
  31. Bani-Aameur, F.; Ferradous, A. Fruits and stone variability in three argan (Argania spinosa (L.) Skeels) populations. For. Genet. 2001, 8, 39–43. [Google Scholar]
  32. Hartl, D.L.; Clark, A.G. Principles of population genetics. Sunderland, MA. Sinauer Assoc. 1997, 116, 95–109. [Google Scholar]
  33. Aabd, N.A.; El-Ayadi, F.; Msanda, F.; El-Mousadik, A. Evaluation of agromorphological variability of argan tree under different environmental conditions in Morocco: Implication for selection. Int. J. Biodivers. Conserv. 2011, 3, 73–82. [Google Scholar]
  34. Huang, Y.; Ji, K.; Jiang, Z.; Tang, G. Genetic structure of Buxus sinica var. parvifolia, a rare and endangered plant. Sci. Hortic. 2008, 116, 324–329. [Google Scholar] [CrossRef]
  35. Verma, K.; Kumar, A.G. Studies of Genetic Diversity in the Natural Population of Cassia Fistula L. Using RAPD and ISSR Markers. Ph.D. Thesis, Thapar Institute of Engineering and Technology, Patiala, India, 2017. [Google Scholar]
  36. Nimbalkar, S.D.; Jade, S.S.; Kauthale, V.K.; Agale, S.; Bahulikar, R.A. Genetic diversity in the candidate trees of Madhuca indica JF Gmel. (Mahua) revealed by inter-simple sequence repeats (ISSRs). 3 Biotech 2018, 8, 143. [Google Scholar] [CrossRef] [PubMed]
  37. Khan, S.; Al-Qurainy, F.; Nadeem, M. Biotechnological approaches for conservation and improvement of rare and endangered plants of Saudi Arabia. Saudi J. Biol. Sci. 2012, 19, 1–11. [Google Scholar] [CrossRef] [PubMed] [Green Version]
  38. Maquia, I.; Ribeiro, N.S.; Silva, V.; Bessa, F.; Goulao, L.F.; Ribeiro, A.I. Genetic diversity of Brachystegia boehmii Taub. and Burkea africana Hook. f. across a fire gradient in Niassa National Reserve, Northern Mozambique. Biochem. Syst. Ecol. 2013, 48, 238–247. [Google Scholar] [CrossRef]
  39. Liu, J.; Sun, H.G.; Jiang, J.M.; Shao, W.H.; Luan, Q. Genetic diversity of natural populations of Machilus thunbergii, an endangered tree species in eastern China, determined with ISSR analysis. Genet. Mol. Res. 2013, 12, 3689–3697. [Google Scholar] [CrossRef]
  40. Hedrick, P.W. Book reviews: Genetics and conservation. Evolution 1985, 39, 1180–1181. [Google Scholar] [CrossRef]
  41. Ellstrand, N.C.; Elam, D.R. Population genetic consequences of small population size: Implications for plant conservation. Annu. Rev. Ecol. Syst. 1993, 24, 217–242. [Google Scholar] [CrossRef]
  42. Kremer, A.; Kleinschmit, J.; Cottrell, J.; Cundall, E.P.; Deans, J.D.; Ducousso, A.; König, A.O.; Lowe, A.J.; Munro, R.C.; Petit, R.J.; et al. Is there a correlation between chloroplastic and nuclear divergence, or what are the roles of history and selection on genetic diversity in European oaks? For. Ecol. Manag. 2002, 156, 75–87. [Google Scholar] [CrossRef]
  43. Hui-yu, L.; Jing, J.; Gui-feng, L.; Xu-jun, M.; Jing-xiang, D.; Shi-jie, L. Genetic variation and division of Pinus sylvestris provenances by ISSR markers. J. For. Res. 2005, 16, 216–218. [Google Scholar] [CrossRef]
  44. Xia, T.; Meng, L.; Mao, K.; Tian, B.; Miehe, G.; Liu, J. Genetic variation in the Qinghai-Tibetan plateau endemic and endangered conifer Cupressus gigantea, detected using RAPD and ISSR markers. Silvae Genet. 2008, 57, 85–92. [Google Scholar] [CrossRef]
  45. Wang, X.; Yang, R.; Feng, S.; Hou, X.; Zhang, Y.; Li, Y.; Ren, Y. Genetic variation in Rheum palmatum and Rheum tanguticum (Polygonaceae), two medicinally and endemic species in China using ISSR markers. PLoS ONE 2012, 7, 51667. [Google Scholar] [CrossRef] [PubMed]
  46. Hogbin, P.M.; Peakall, R. Evaluation of the contribution of genetic research to the management of the endangered plant Zieria prostrata. Conserv. Biol. 1999, 13, 514–522. [Google Scholar] [CrossRef]
  47. Slatkin, M. Gene flow and the geographic structure of natural populations. Science 1987, 236, 787–792. [Google Scholar] [CrossRef] [PubMed]
  48. Gabrielsen, T.M.; Bachmann, K.; Jakobsen, K.S.; Brochmann, C. Glacial survival does not matter: RAPD phylogeography of Nordic Saxifraga oppositifolia. Mol. Ecol. 1997, 6, 831–842. [Google Scholar] [CrossRef]
  49. Schaal, B.A.; Hayworth, D.A.; Olsen, K.M.; Rauscher, J.T.; Smith, W.A. Phylogeographic studies in plants: Problems and prospects. Mol. Ecol. 1998, 7, 465–474. [Google Scholar] [CrossRef]
  50. Wright, S. The genetical structure of populations. Ann. Eugen. 1949, 15, 323–354. [Google Scholar] [CrossRef]
  51. Rodrigues, L.; van den Berg, C.; Póvoa, O.; Monteiro, A. Low genetic diversity and significant structuring in the endangered Mentha cervina populations and its implications for conservation. Biochem. Syst. Ecol. 2013, 50, 51–61. [Google Scholar] [CrossRef]
  52. Nettleton, J.A. Omega-3 fatty acids: Comparison of plant and seafood sources in human nutrition. J. Am. Diet. Assoc. 1991, 91, 331–337. [Google Scholar] [PubMed]
  53. Simopoulos, A.P. Omega-3 fatty acids in health and disease and in growth and development. Am. J. Clin. Nutr. 1991, 54, 438–463. [Google Scholar] [CrossRef] [PubMed]
  54. Qi, B.; Fraser, T.; Mugford, S.; Dobson, G.; Sayanova, O.; Butler, J.; Napier, J.A.; Stobart, A.K.; Lazarus, C.M. Production of very long chain polyunsaturated omega-3 and omega-6 fatty acids in plants. Nat. Biotechnol. 2004, 22, 739. [Google Scholar] [CrossRef] [PubMed]
  55. Omara-Alwala, T.R.; Mebrahtu, T.; Prior, D.E.; Ezekwe, M.O. Omega-three fatty acids in purslane (Portulaca oleracea) Tissues. J. Am. Oil Chem. Soc. 1991, 68, 198–199. [Google Scholar] [CrossRef]
  56. Guil, J.L.; Torija, M.E.; Gimenez, J.J.; Rodriguez, I. Identification of fatty acids in edible wild plants by gas chromatography. J. Chromatogr. A 1996, 719, 229–235. [Google Scholar] [CrossRef]
  57. Kris-Etherton, P.M.; Taylor, D.S.; Yu-Poth, S.; Huth, P.; Moriarty, K.; Fishell, V.; Hargrove, R.L.; Zhao, G.; Etherton, T.D. Polyunsaturated fatty acids in the food chain in the United States. Am. J. Clin. Nutr. 2000, 71, 179S–188S. [Google Scholar] [CrossRef] [PubMed] [Green Version]
  58. Krzynowek, J.; Panunzio, L.J. Cholesterol and fatty acids in several species of shrimp. J. Food Sci. 1989, 54, 237–239. [Google Scholar] [CrossRef]
  59. RStudio. R. RStudio: Integrated Development Environment for R (version 0.95.262)[computer software] Boston, MA, USA. 2012. Available online: http://www.rstudio.org/ (accessed on 19 August 2013).
  60. Reddy, M.P.; Sarla, N.; Siddiq, E.A. Inter simple sequence repeats (ISSR) polymorphism and its application in plant breeding. Euphytica 2002, 120, 9–16. [Google Scholar] [CrossRef]
  61. Louati, M.; Khouja, A.; Ben Abdelkrim, A.; Hannachi, A.S.; Baraket, G. Adaptation of Argania spinosa L. in Northern Tunisia: Soil analysis and morphological traits variability. Sci. Hortic. 2019, 255, 220–230. [Google Scholar] [CrossRef]
  62. Doyle, J.J.; Doyle, J.L. A rapid DNA isolation procedure for small quantities of fresh leaf tissue. Phytochem. Bull. 1987, 19, 11–15. [Google Scholar]
  63. Ray, B.; Loutelier-Bourhis, C.; Lange, C.; Condamine, E.; Driouich, A.; Lerouge, P. Structural investigation of hemicellulosic polysaccharides from Argania spinosa: Characterisation of a novel xyloglucan motif. Carbohydr. Res. 2004, 339, 201–208. [Google Scholar] [CrossRef] [PubMed]
  64. Souto Alves, T.; Vanusa da Silva, M.; Alves de Almeida, C.M.; Oliveira Jordão do Amaral, D.; Cordeiro dos Santos, D.; Farias, I.; Tenório Sabino Donato, V.M.; Da Costa, A.F. Genetic diversity in cactus clones using ISSR markers. Acta Hortic. 2009, 811, 55–58. [Google Scholar] [CrossRef]
  65. Verma, S.; Rana, T.S. Genetic diversity within and among the wild populations of Murraya koenigii (L.) Spreng., as revealed by ISSR analysis. Biochem. Syst. Ecol. 2011, 39, 139–144. [Google Scholar] [CrossRef]
  66. Su, Y.J.; Zan, Q.J.; Wang, T.; Ying, Z.M.; Ye, H.G. High ISSR variation in 24 surviving individuals of Apterosperma oblata (Theaceae) endemic to China. Biochem. Syst. Ecol. 2008, 36, 619–625. [Google Scholar] [CrossRef]
  67. Ucarli, C.; Poyraz, N.; Gürel, A.F. Discovery of Dhn3 variants in wild barley (Hordeum spontaneum) byhigh-resolution melting (HRM) technology. Turk. J. Biol. 2015, 39, 758–764. [Google Scholar] [CrossRef]
  68. Ichihara, K.I.; Waku, K.; Yamaguchi, C.; Saito, K.; Shibahara, A.; Miyatani, S.; Yamamoto, K. A convenient method for determination of the C20–22 PUFA composition of glycerolipids in blood and breast milk. Lipids 2002, 37, 523–526. [Google Scholar] [CrossRef] [PubMed]
  69. Dagnelie, P. Analyse Statistique à Plusieurs Variables; Presses agronomiques de Gembloux: Gembloux, Belgium, 1999. [Google Scholar]
  70. Abdelkefi, A.; Boussaid, M.; Biborchi, A.; Haddioui, A.; Salhi-Hanachi, A.; Marrakchi, M. Genetic diversity inventory and valuation of spontaneous species belonging to Medicago L. genus in Tunisia. AGRIS 1996, 18, 185. [Google Scholar]
  71. Yeh, F.C.; Yang, R.; Boyle, T.J.; Ye, Z.; Xiyan, J.M. PopGene32, Microsoft Windows-Based Freeware for Population Genetic Analysis, Version 1.32; Molecular Biology and Biotechnology Centre, University of Alberta: Edmonton, AB, Canada, 2000. [Google Scholar]
  72. McDermott, J.M.; McDonald, B.A. Gene flow in plant pathosystems. Annu. Rev. Phytopathol. 1993, 31, 353–373. [Google Scholar] [CrossRef]
  73. Yeh, F.C.; Yang, R.C.; Boyle, T.J.B. POPGENE VERSION 1.31 Microsoft window-based freeware for population genetic analysis. Available online: http://www.ualberta.ca/~fyeh/popgene.html (accessed on 12 August 2012).
  74. Tamura, K.; Stecher, G.; Peterson, D.; Filipski, A.; Kumar, S. MEGA6: Molecular evolutionary genetics analysis version 6.0. Mol. Boil. Evolut. 2013, 30, 2725–2729. [Google Scholar] [CrossRef]
  75. Perrier, X.; Jacquemoud-Collet, J.P. DARwin Software. 2006. Available online: http://darwin.cirad.fr/darwin (accessed on 30 January 2019).
  76. Peakall, R.O.D.; Smouse, P.E. GENALEX 6: Genetic analysis in Excel. Population genetic software for teaching and research. Mol. Ecol. Notes 2006, 6, 288–295. [Google Scholar] [CrossRef]
  77. Pritchard, J.K.; Matthew, S.; Peter, D. Inference of population structure using multilocus genotype data. Genetics 2000, 155, 945–959. [Google Scholar] [PubMed]
  78. Earl, D.A. Structure Harvester: A website and program for visualizing Structure output and implementing the Evanno method. Conserv. Genet. Res. 2012, 4, 359–361. [Google Scholar] [CrossRef]
  79. Mantel, N. The detection of disease clustering and a generalized regression approach. Cancer Res. 1967, 27, 209–220. [Google Scholar] [PubMed]
Figure 1. Variability in the shape, color of leaves and fruits (a); green and red argan fruits with a fusiform form and dark green leaves, (b); yellow argan fruits with an intermediate form and clear green leaves, (c); green fruits with an oval form with medium green leaves, (d); green fruit with a round form, (e); green fruit with an apiculated form, (f): green fruits with an intermediate form.
Plants 08 00319 g001
Figure 2. Principal component analysis of different individuals from the four provenances and the circle of correlations of selected quantitative and qualitative variables.
Plants 08 00319 g002
Figure 3. Dendrogram constructed by Euclidean distance using Ward’s method, to study the relationships among the 60 argan trees based on quantitative traits.
Plants 08 00319 g003
Figure 4. Dendrogram generated by UPGMA clustering analysis using the genetic distance matrix data with 10 ISSR markers, showing the relationship among the four populations of A. spinosa. Constructed with Darwin software (boostrap 1000).
Plants 08 00319 g004
Figure 5. Factorial analysis of different individuals from the four provenances obtained with Darwin software.
Plants 08 00319 g005
Figure 6. The genetic relationships among the 60 argan tree among the four provenances estimated using the STRUCTURE program based on ISSR data (red: A and H; green: JB; blue: S).
Plants 08 00319 g006
Figure 7. Content of eicosapentaenoic acid (EPA) and docosahexaenoic acid (DHA) and EPA + DHA (g/100 g) in argan leaves.
Plants 08 00319 g007
Figure 8. Mantel test between geographical distance and genetic distance among different populations of A. spinosa.
Plants 08 00319 g008
Figure 9. Correlations between the different matrices (geo: geographic matrix; gen: genetic matrix; epa.dha: EPA and DHA content in leaves matrix; morpho: morphological matrix).
Plants 08 00319 g009
Figure 10. The geographical distribution of the sites in Tunisia.
Plants 08 00319 g010
Table 1. Results of analysis of variance (ANOVA) made for comparison of all variables chosen.
CodesDFSum of sqAverage of sqFP > F
LF1117.3981.5826.297<0.0001
LgF112.3050.2101.8030.080
L/LgF112.1680.1977.453<0.0001
P11184.49216.7723.955<0.0001
Ln112.5900.2359.305<0.0001
DF1130.2072.7462.8170.006
L G118.3280.7574.331<0.0001
LgG111.2360.1121.6160.124
L/LgG112.0430.1862.6080.011
PGf1111.1801.0161.9190.060
PGs115.7500.5231.4330.189
DG115.9370.5401.3870.210
TG111.0170.0922.6110.011
Nb A111.1400.1041.3560.224
Pd A110.0480.0041.2050.309
LA115.2110.4743.7170.001
Lg A110.2870.0260.7110.722
L/Lg A113.4450.3132.7250.008
Ep A110.0370.0030.9440.508
Lfu1120.7421.8861.9280.059
LgFu110.4730.0431.6040.128
SF119.6960.8811.7210.097
Table 2. List of 10 inter-simple sequence repeat (ISSR) primers, annealing temperatures (Ta), MgCl2 concentration optimized for PCR amplification, and length of the amplification products.
PrimersMotifTa (°C)MgCl2 (mM)Size (bp)TNBNPBPPB%PICNo. of Bands in Each Population
JBAHS
ISSR 1/8(AG)8C50 °C2200–100010880%54%10/1010/1010/1010/10
ISSR 3/8(GA)8YG50.3 °C1.5200–9008675%47.6%8/88/88/88/8
ISSR 4/8(AC)8YG49 °C2300–15001414100%66.4%14/1414/1414/1414/14
ISSR 6/8(AC)8YT52 °C1.5300–2500222195%78.1%20/2219/2222/2221/22
ISSR 7/8(AGC)660 °C2200–10006583%69.5%6/66/65/66/6
ISSR 8/8(CTC)657 °C2400–2000111090%69.9%10/1111/1110/1110/11
ISSR 807(GA)8C48.5 °C1.7300–10008675%54.6%8/88/88/88/8
ISSR 808(CT)8A50.8 °C2400–2000111090%77.1%11/1111/1110/1110/11
ISSR 857(AC)8G53 °C2500–2000131292%67.7%13/1313/1312/1313/13
FLA 10(GA)8CT50.3 °C1.8300–2000131292%70.4%13/1312/1311/1312/13
Y: pyrimidine C or G; Ta: Temperature of annealing; TNB: Total number of bands; NPB: Number of polymorphic bands; PPB%: Percentage of polymorphic bands; JB: botanical garden; A: Korbus; H: Sousse; S: Sfax.
Table 3. Intra-population diversity measures of Argania spinosa based on ISSR data.
Mean± Standard DeviationPolymorphic Loci
ProvenanceSizenaneHINPLPPL%
JB151.81 ± 0.391.44 ± 0.330.26 ± 0.180.396 ± 0.259481.03%
A151.80 ± 0.401.46 ± 0.350.27 ± 0.180.41 ± 0.259380.17%
H151.77 ± 0.411.41 ± 0.350.25 ± 0.180.38 ± 0.259077.59%
S151.8 ± 0.391.43 ± 0.350.26 ± 0.170.40 ± 0.249481.03%
Total601.90 ± 0.311.53 ± 0.320.32 ± 0.160.47 ± 0.2110489.66%
na: Observed number of alleles; ne: Effective number of alleles; h: Nei’s (1973) [28] gene diversity; I: Shannon’s Information index; Na: number of alleles; Ne: effective number of alleles; H: Nei’s (1973) [28] gene diversity; I: Shannon’s information index; NPL: Number of polymorphic loci; % PPL: Percentage of polymorphic loci.
Table 4. Genetic distance of Nei (1978) [29] among provenances of A. spinosa.
JBAHS
0.000 JB
0.2720.000 A
0.2470.1150.000 H
0.2340.2370.1860.000S
Table 5. Analysis of molecular variance (AMOVA) within and between provenances of A. spinosa.
Source of VariationdfSSMSVC% of Variationp-Value
Among Pops3233.98377.9943.96718%>0.001
Within Pops561035.20018.48618.48682%>0.001
Total591269.183 22.453100%
df: Degree of freedom; SS: Sum of squares; MS: Mean of squares; VC: Variance components.
Table 6. Grouping of 60 argan variants with high resolution melting (HRM) analysis of the Delta-6 desaturase (D6D) gene.
Group Number IndividualGroup Number Individual
1A1, A2, A5, A6, A7, A10, A11, A12, H2, H7, H9, S1, S3, S9, S11, S12, S14, P3A26H6, H8, S2, S4
2A9, A137A14, H13, H14, H15
3A15, H10, S7, S8, S10, S13, S15, P1A1, P3A6, P5F9, P6H98H12, S6
4A3, A4, H4, H5, P2F1, P3B8, P3C3, P4A8, P8G10, P9A11, A1JB, A3JB, A6JB9H3, H1
5S5, A8JB10H11
Table 7. Ecogeographic sites of selected argan trees in Tunisia and soil texture of each site.
CodesName of Sites (Cities)IndividualsSoil Texture pH of SoilClimate
JBBotanical garden (Tunis)P1A, P2F1, P3A2, P3A6, P3B8, P3C3, P4A8, P5F9, P6H9, P8G10, P9A11, A1JB, A3JB, A6JB, A8JBSilty8.3Semi-arid
AKorbous (Nabeul)A1, A2, A3, A4, A5, A6, A7, A8, A9, A10, A11, A12, A13, A14, A15Sand6.2Semi-arid
SSfax (Sfax)S1, S2, S3, S4, S5, S6, S7, S8, S9, S10, S11, S12, S13, S14, S15Silty sand6Arid
HSouss (Souss)H1, H2, H3, H4, H5, H6, H7, H8, H9, H10, H11, H12, H13, H14, H15Clay loam8.4Semi-Arid
Table 8. Quantitative and qualitative morphological characters of argan trees.
CodeMorphological Character
Fruit
1P F FFruit weight
2L FFruit length
3lg FWidth of the fruit
4LF/lgFRatio length width of the fruit
5D FDiameter of the fruit
6FFruit shape
7C FFruit color
8L N Nape length
9PGWeight of the seed
10PG SWeight of the seed after drying in the oven
11LGLength of the seed
12LgWidth of the seed
13LG/lg GRatio length width of the seed
14DGDiameter of the seed
15TGNumber of sprouting lines
16CLColor of the seed
17Nbr ANumber of kernels per seed
18PAWeight of kernel
19LALength of the kernel
20Lg AWidth of the kernel
21LA/LgARatio length width of the kernel
22Ep AThickness of the kernel
Tree
23Fr FleursFrequency of the flowers
24Fr BFFrequency of flower buds
25Fr FrFrequency of fruits
26Frm de l’arbreShape of the tree
27L de l’arbre Length of the tree
28D trcTrunk diameter
29Fr ramificFrequency of ramifications
30Fr epFrequency of spines
Leaves
31LfLength of the leaf
32LfWidth of the sheet
33SfLeaf area

