Transient Heat Waves May Affect the Photosynthetic Capacity of Susceptible Wheat Genotypes Due to Insufficient Photosystem I Photoprotection

 , , , and
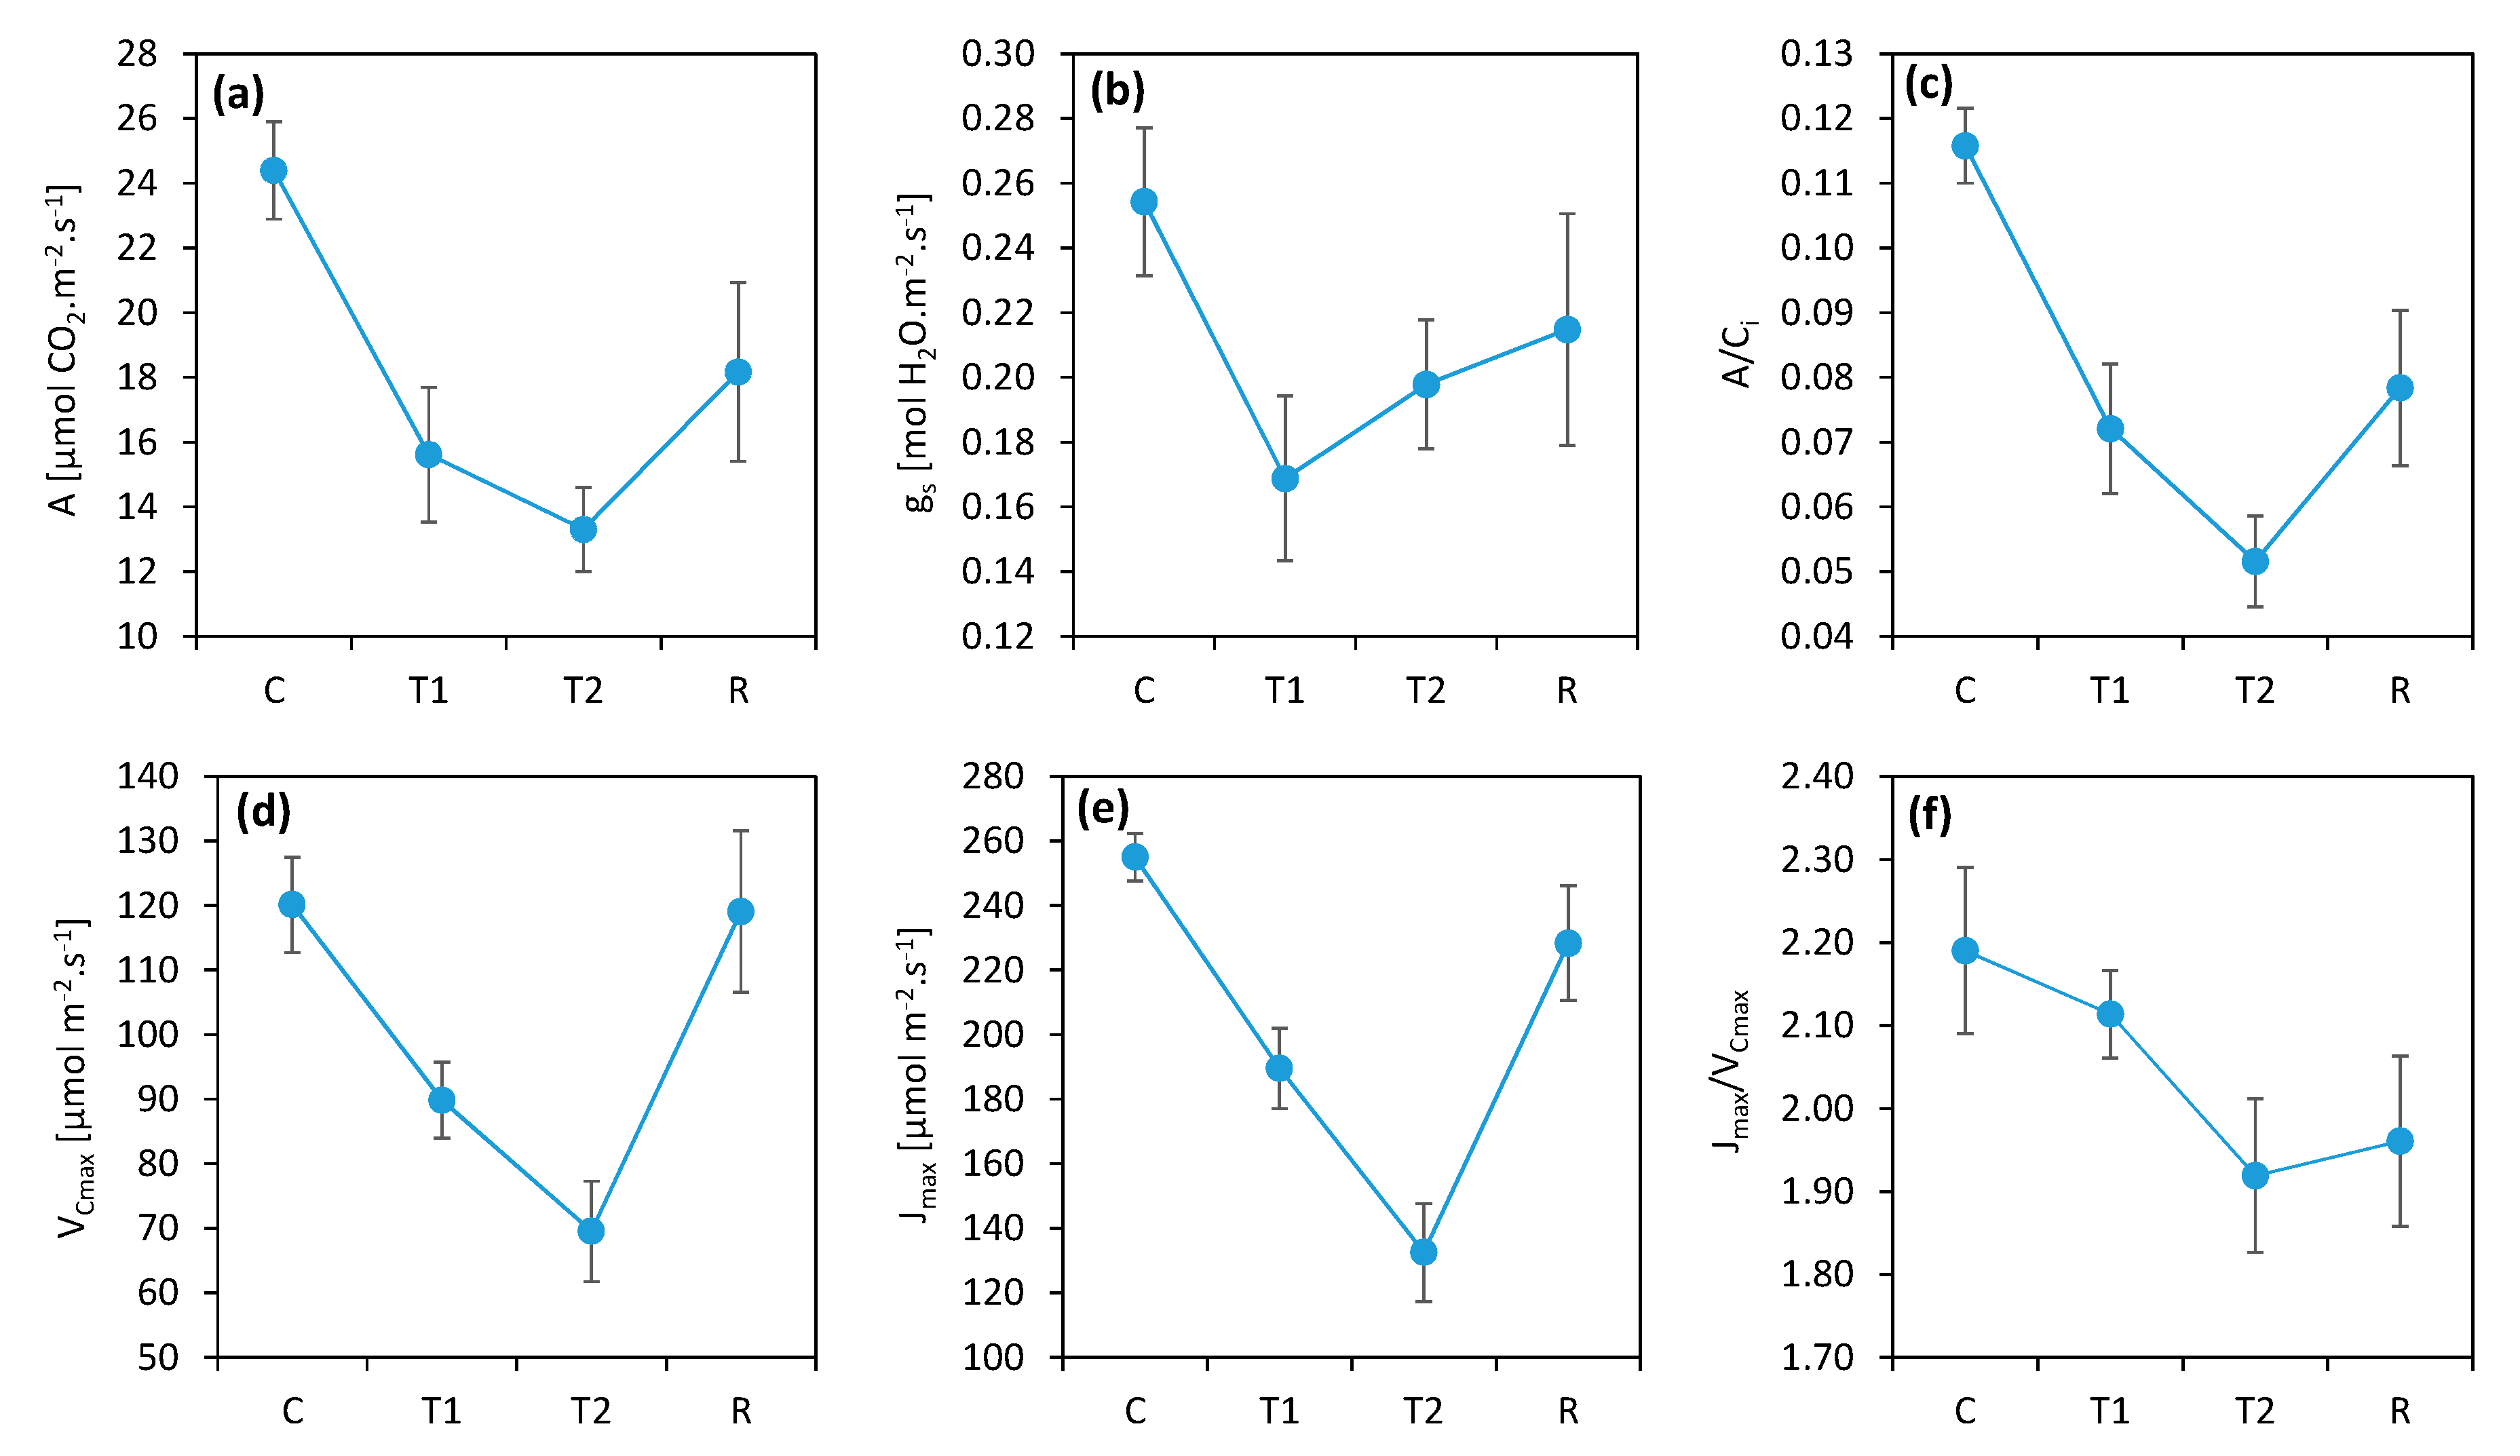
Abstract
:1. Introduction
2. Materials and Methods
2.1. Cultivation of Plants
2.2. Heat Wave Simulation and Measuring Protocol
2.3. Simultaneous Measurements of Gas Exchange and Chlorophyll Fluorescence
2.4. Simultaneous Measurements of P700 Redox State and Chlorophyll Fluorescence
2.5. Data Processing and Analysis
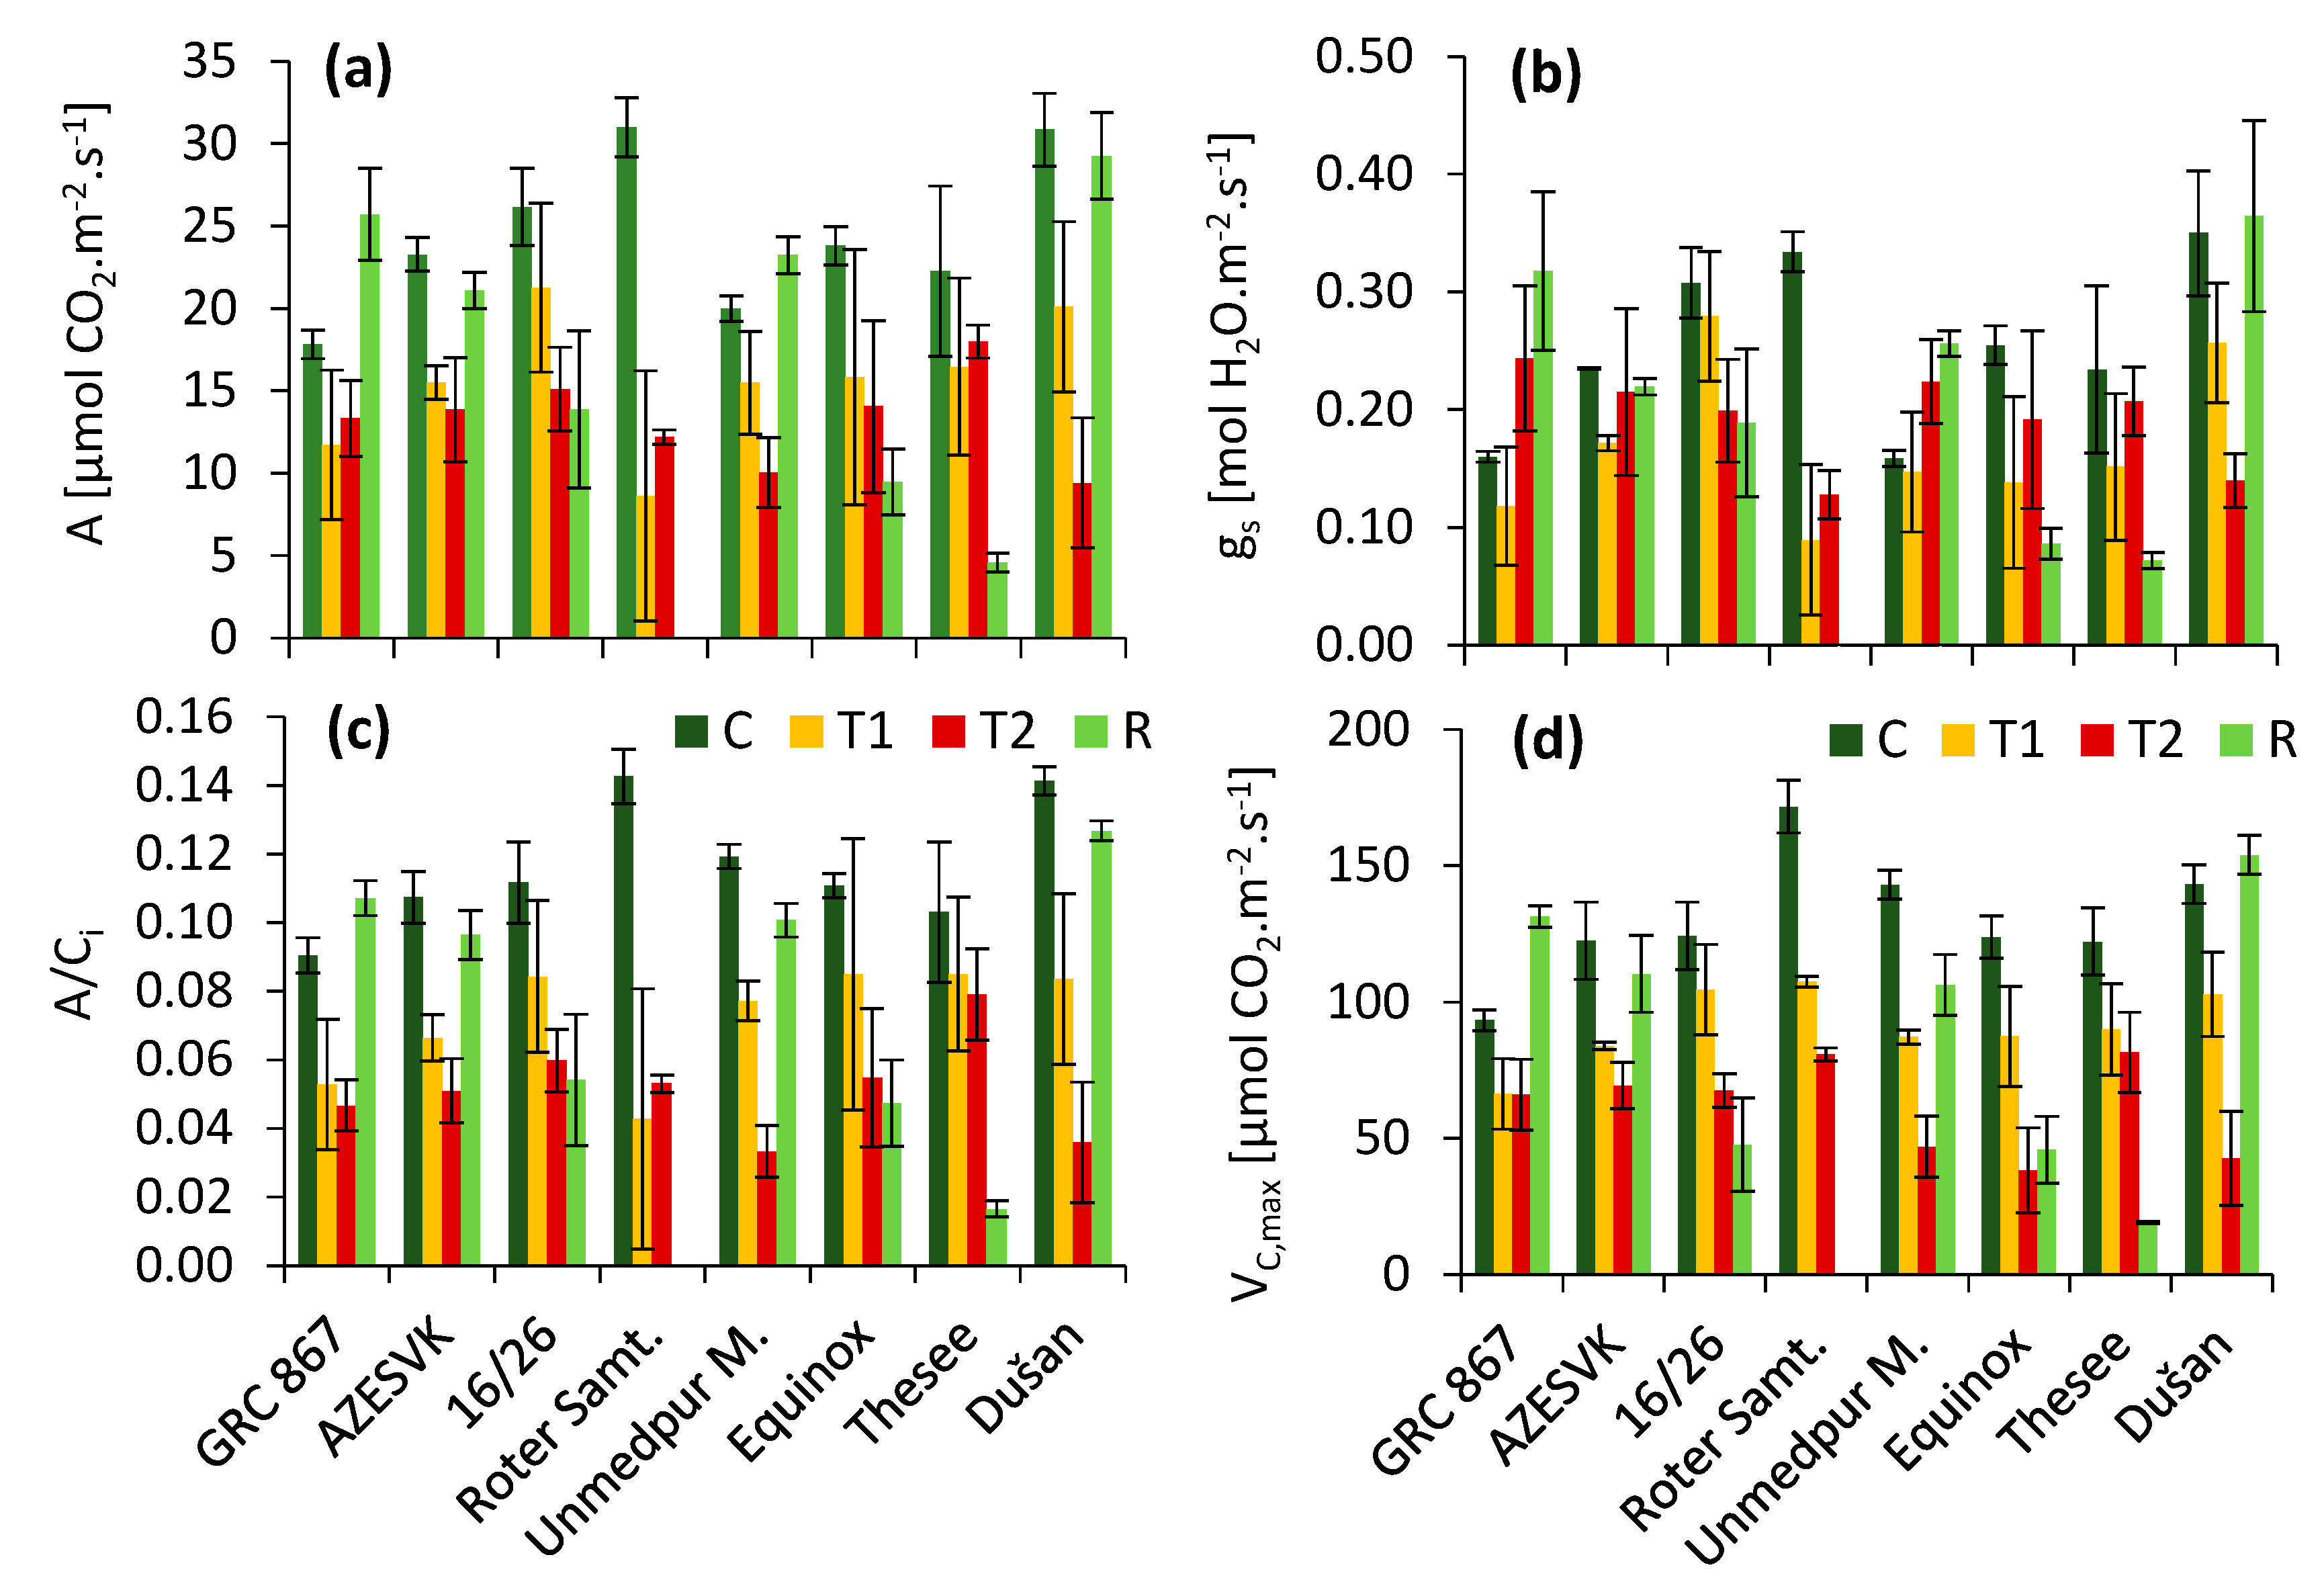
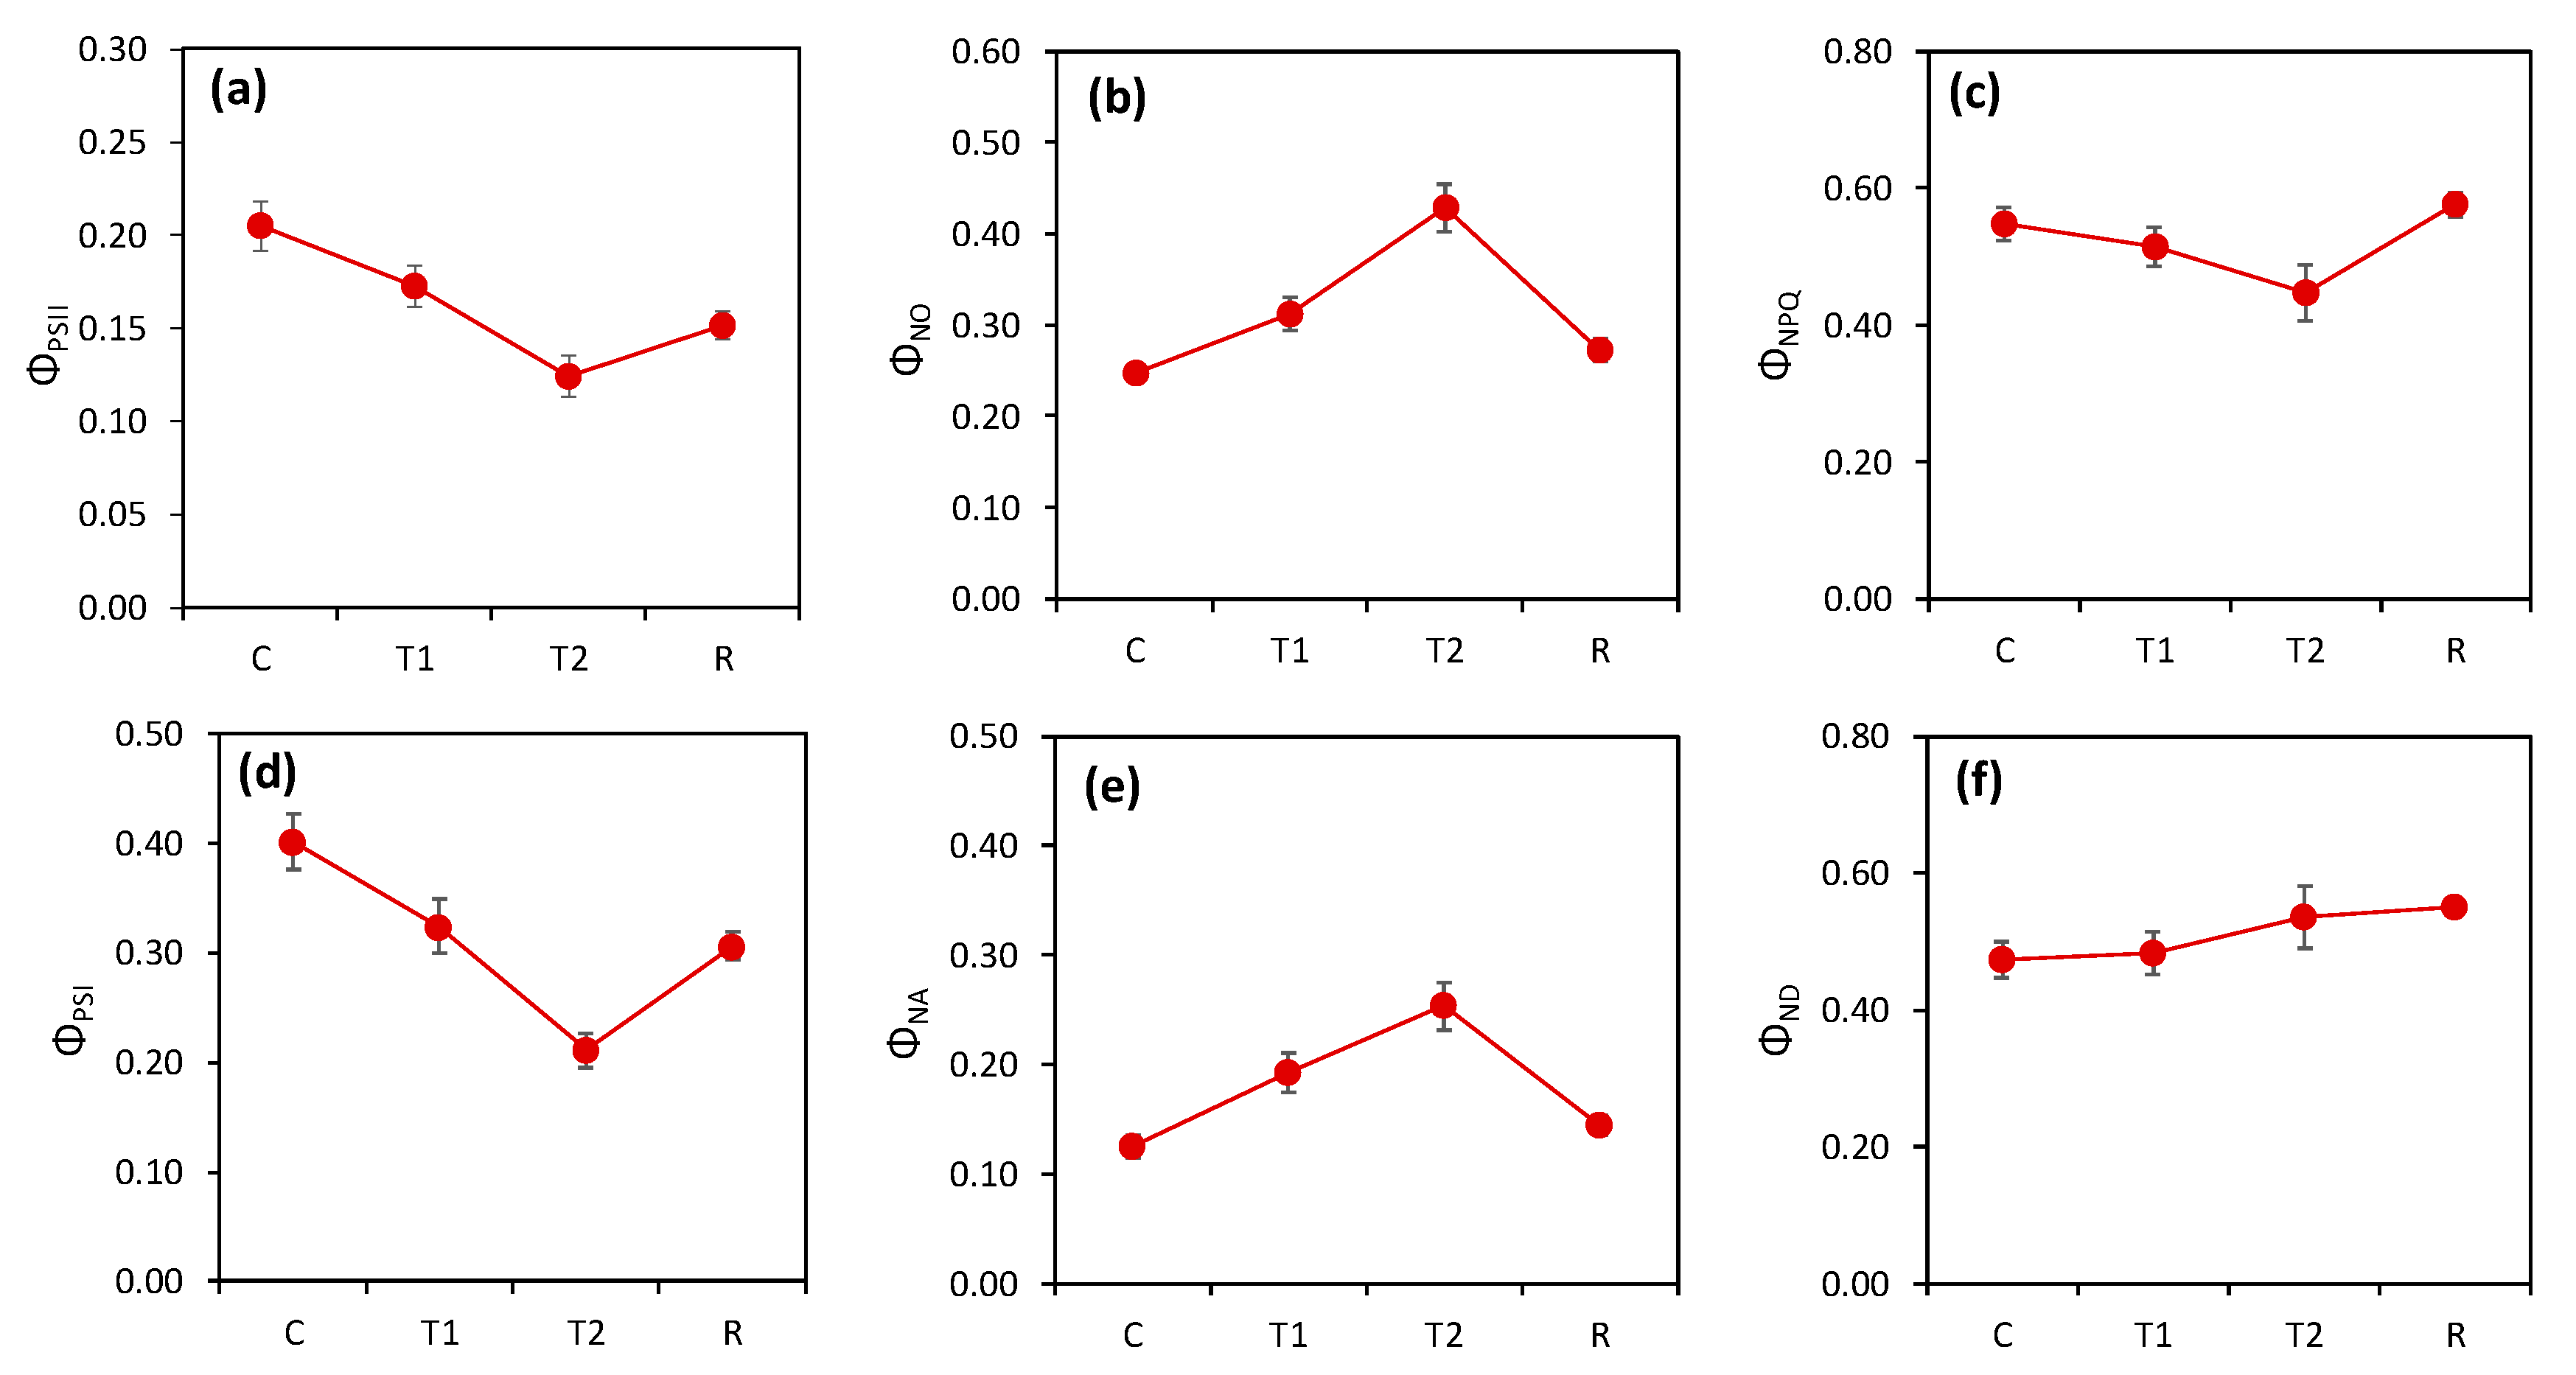
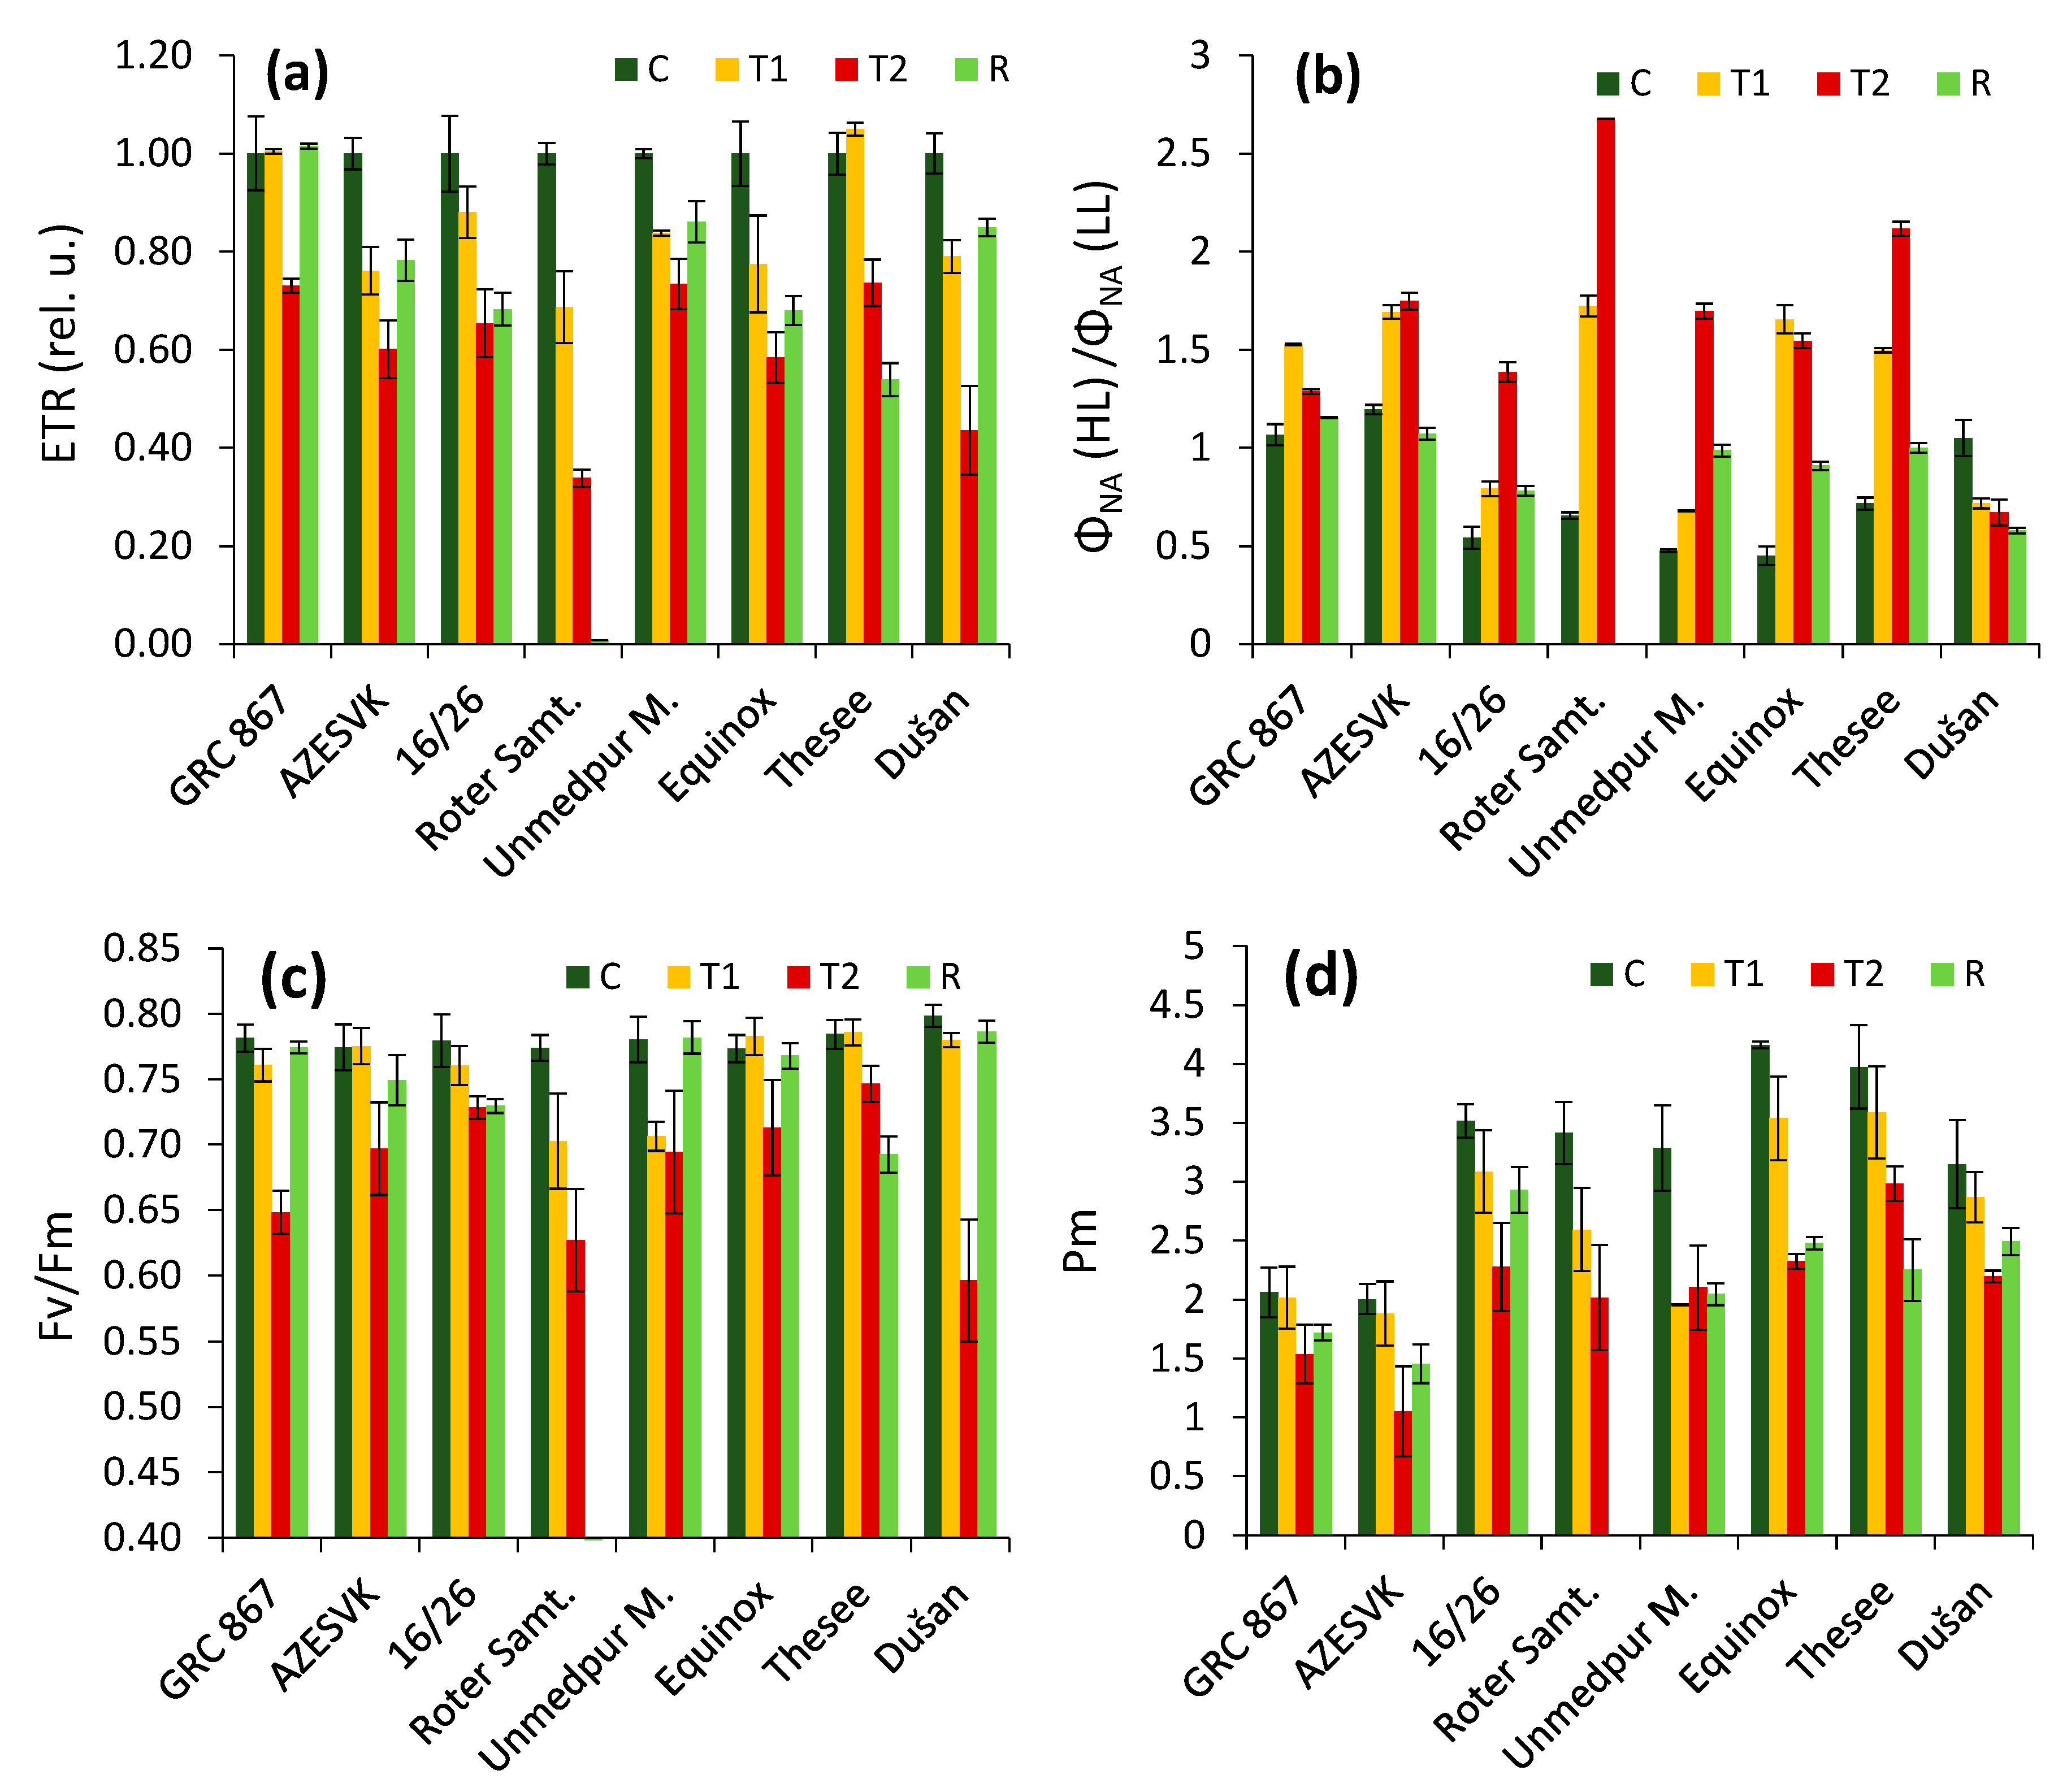
3. Results
4. Discussion
Author Contributions
Funding
Conflicts of Interest
References
- Pachauri, R.K.; Meyer, L.A. (Eds.) Intergovernmental Panel on Climate Change. In Climate Change 2014: Synthesis Report; IPCC: Geneva, Switzerland, 2014. [Google Scholar]
- Duan, H.; Wu, J.; Huang, G.; Zhou, S.; Liu, W.; Liao, Y.; Yang, X.; Xiao, Z.; Fan, H. Individual and interactive effects of drought and heat on leaf physiology of seedlings in an economically important crop. AoB Plants 2017, 9, plw090. [Google Scholar] [CrossRef] [PubMed]
- Nuttall, J.G.; Barlow, K.M.; Delahunty, A.J.; Christy, B.P.; O’Leary, G.J. Acute high temperature response in wheat. Agron. J. 2018, 110, 1296–1308. [Google Scholar] [CrossRef]
- FAOSTAT. Production of Wheat in World. Available online: http://www.fao.org/faostat/en/#data/QC/visualize (accessed on 23 February 2019).
- Slafer, G.A.; Savin, R.; Sadras, V.O. Coarse and fine regulation of wheat yield components in response to genotype and environment. Field Crops Res. 2014, 157, 71–83. [Google Scholar] [CrossRef]
- Shanmugam, S.; Kjaer, K.H.; Ottosen, C.O.; Rosenqvist, E.; Kumari Sharma, D.; Wollenweber, B. The alleviating effect of elevated CO2 on heat stress susceptibility of two wheat (Triticum aestivum L.) cultivars. J. Agron. Crop. Sci. 2013, 199, 340–350. [Google Scholar] [CrossRef]
- Wahid, A.; Gelani, S.; Ashraf, M.; Foolad, M.R. Heat tolerance in plants: An overview. Environ. Exp. Bot. 2007, 61, 199–223. [Google Scholar] [CrossRef]
- Ferris, R.; Ellis, R.H.; Wheeler, T.R.; Hadley, P. Effect of high temperature stress at anthesis on grain yield and biomass of field-grown crops of wheat. Ann. Bot. 1998, 82, 631–639. [Google Scholar] [CrossRef]
- Barnabas, B.; Jager, K.; Feher, A. The effect of drought and heat stress on reproductive processes in cereals. Plant Cell Environ. 2008, 31, 11–38. [Google Scholar] [CrossRef]
- Fischer, R.A. Wheat physiology: A review of recent developments. Crop Pasture Sci. 2011, 62, 95–114. [Google Scholar] [CrossRef]
- Stone, P.; Nicolas, M. Wheat cultivars vary widely in their responses of grain yield and quality to short periods of post-anthesis heat stress. Funct. Plant Biol. 1994, 21, 887–900. [Google Scholar] [CrossRef]
- Howarth, C.J. Genetic improvements of tolerance to high temperature. In Abiotic Stresses; Ashraf, M., Harris, P., Eds.; CRC Press: Boca Raton, FL, USA, 2005; pp. 299–322. [Google Scholar]
- Schoeffl, F.; Prandl, R.; Reindl, A. Molecular responses to heat stress. In Molecular Responses to Cold, Drought, Heat and Salt Stress in Higher Plants; Shinozaki, K., Yamaguchi-Shinozaki, K., Eds.; R.G.Landes Co.: Austin, TX, USA, 1999; pp. 81–98. [Google Scholar]
- Way, D.A.; Oren, R.; Kroner, Y. The space-time continuum: The effects of elevated CO2 and temperature and the importance of scaling. Plant Cell Environ. 2015, 38, 991–1007. [Google Scholar] [CrossRef]
- Slot, M.; Winter, K. In Situ temperature relationships of biochemical and stomatal controls of photosynthesis in four lowland tropical tree species. Plant Cell Environ. 2017, 40, 3055–3068. [Google Scholar] [CrossRef] [PubMed]
- Fauset, S.; Oliveira, L.; Buckeridge, M.S.; Foyer, C.H.; Galbraith, D.; Tiwari, R.; Gloor, M. Contrasting responses of stomatal conductance and photosynthetic capacity to warming and elevated CO2 in the tropical tree species Alchornea glandulosa under heatwave conditions. Environ. Exp. Bot. 2019, 158, 28–39. [Google Scholar] [CrossRef]
- Drake, J.E.; Tjoelker, M.G.; Vårhammar, A.; Medlyn, B.E.; Reich, P.B.; Leigh, A.; Barton, C.V.M. Trees tolerate an extreme heatwave via sustained transpirational cooling and increased leaf thermal tolerance. Glob. Chang. Biol. 2018, 24, 2390–2402. [Google Scholar] [CrossRef] [PubMed]
- Urban, J.; Ingwers, M.W.; McGuire, M.A.; Teskey, R.O. Increase in leaf temperature opens stomata and decouples net photosynthesis from stomatal conductance in Pinus taeda and Populus deltoides x nigra. J. Exp. Bot. 2017, 68, 1757–1767. [Google Scholar] [CrossRef] [PubMed]
- Slot, M.; Winter, K. Photosynthetic acclimation to warming in tropical forest tree seedlings. J. Exp. Bot. 2017, 68, 2275–2284. [Google Scholar] [CrossRef] [PubMed] [Green Version]
- Crafts-Brander, S.J.; Salvucci, M.E. Sensitivity to photosynthesis in the C4 plant, maize to heat stress. Plant Cell 2002, 12, 54–68. [Google Scholar]
- Morales, D.; Rodríguez, P.; Dell’amico, J.; Nicolás, E.; Torrecillas, A.; Sánchez-Blanco, M.J. High-temperature preconditioning and thermal shock imposition affects water relations, gas exchange and root hydraulic conductivity in tomato. Biol. Plant. 2003, 47, 203–208. [Google Scholar] [CrossRef]
- Wise, R.R.; Olson, A.J.; Schrader, S.M.; Sharkey, T.D. Electron transport is the functional limitaion of photosynthesis in field-grown Pima cotton plants at high temperature. Plant Cell Environ. 2004, 27, 717–724. [Google Scholar] [CrossRef]
- Tóth, S.Z.; Schansker, G.; Kissimon, J.; Kovács, L.; Garab, G.; Strasser, R.J. Biophysical studies of photosystem II-related recovery processes after a heat pulse in barley seedling (Hordeum vulgare). J. Plant Physiol. 2005, 162, 181–194. [Google Scholar] [CrossRef]
- Lazár, D. The polyphasic chlorophyll a fluorescence rise measured under high intensity of exciting light. Funct. Plant Biol. 2006, 33, 9–30. [Google Scholar] [CrossRef]
- Chen, L.S.; Li, P.; Cheng, L. Effects of high temperature coupled with high light on the balance between photooxidation and photoprotection in the sun-exposed peel of apple. Planta 2008, 228, 745–756. [Google Scholar] [CrossRef]
- Li, P.; Cheng, L.; Gao, H.; Jiang, C.; Peng, T. Heterogenous behavior of PSII in soybean (Glycine max) leaves with identical PSII photochemistry efficiency under different high temperature treatments. J. Plant Physiol. 2009, 166, 1607–1615. [Google Scholar] [CrossRef]
- Camejo, D.; Rodríguez, P.; Morales, M.A.; Dellamico, J.M.; Torrecillas, A.; Alarcón, J.J. High temperature effects on photosynthetic activity of two tomato cultivars with different heat susceptibility. J. Plant Physiol. 2005, 162, 281–289. [Google Scholar] [CrossRef]
- De Ronde, J.A.D.; Cress, W.A.; Kruger, G.H.J.; Strasser, R.J.; Staden, J.V. Photosynthetic response of transgenic soybean plants containing an Arabidopsis P5CR gene, during heat and drought stress. J. Plant Physiol. 2004, 61, 1211–1244. [Google Scholar] [CrossRef]
- Zivcak, M.; Brestic, M.; Balatova, Z.; Drevenakova, P.; Olsovska, K.; Kalaji, H.M.; Allakhverdiev, S.I. Photosynthetic electron transport and specific photoprotective responses in wheat leaves under drought stress. Photosynt. Res. 2013, 117, 529–546. [Google Scholar] [CrossRef]
- Farquhar, G.D.; von Caemmerer, S.; Berry, J.A. A biochemical model of photosynthetic CO2 assimilation in leaves of C3 species. Planta 1980, 149, 78–90. [Google Scholar] [CrossRef]
- Ethier, G.J.; Livingston, N.J. On the need to incorporate sensitivity to CO2 transfer conductance into the Farquhar–von Caemmerer-Berry leaf photosynthesis model. Plant Cell Environ. 2004, 27, 137–153. [Google Scholar] [CrossRef]
- Klughammer, C.; Schreiber, U. Saturation pulse method for assessment of energy conversion in PSI. Planta 1994, 192, 261–268. [Google Scholar] [CrossRef]
- Baker, N.R. Chlorophyll fluorescence: A probe of photosynthesis in vivo. Ann. Rev. Plant Biol. 2008, 59, 89–113. [Google Scholar] [CrossRef]
- Brestic, M.; Zivcak, M.; Hauptvogel, P.; Misheva, S.; Kocheva, K.; Yang, X.; Li, X.; Allakhverdiev, S.I. Wheat plant selection for high yields entailed improvement of leaf anatomical and biochemical traits including tolerance to non-optimal temperature conditions. Photosynt. Res. 2018, 136, 245–255. [Google Scholar] [CrossRef]
- Allakhverdiev, S.I.; Kreslavski, V.D.; Klimov, V.V.; Los, D.A.; Carpentier, R.; Mohanty, P. Heat stress: An overview of molecular responses in photosynthesis. Photosynt. Res. 2008, 98, 541. [Google Scholar] [CrossRef]
- Sharkey, T.D. Effects of moderate heat stress on photosynthesis: Importance of thylakoid reactions, rubisco deactivation, reactive oxygen species, and thermotolerance provided by isoprene. Plant Cell Environ. 2005, 28, 269–277. [Google Scholar] [CrossRef]
- Salvucci, M.E.; Crafts-Brandner, S.J. Inhibition of photosynthesis by heat stress: The activation state of Rubisco as a limiting factor in photosynthesis. Physiol. Plantarum 2004, 120, 179–186. [Google Scholar] [CrossRef]
- Haldimann, P.; Feller, U. Growth at moderately elevated temperature alters the physiological response of the photosynthetic apparatus to heat stress in pea (Pisum sativum L.) leaves. Plant Cell Environ. 2005, 28, 302–317. [Google Scholar] [CrossRef]
- Zhang, R.; Sharkey, T.D. Photosynthetic electron transport and proton flux under moderate heat stress. Photosynth. Res. 2009, 100, 29–43. [Google Scholar] [CrossRef]
- Brestic, M.; Zivcak, M.; Kunderlikova, K.; Allakhverdiev, S.I. High temperature specifically affects the photoprotective responses of chlorophyll b-deficient wheat mutant lines. Photosynth. Res. 2016, 130, 251–266. [Google Scholar] [CrossRef]
- Zivcak, M.; Brestic, M.; Kunderlikova, K.; Sytar, O.; Allakhverdiev, S.I. Repetitive light pulse-induced photoinhibition of photosystem I severely affects CO2 assimilation and photoprotection in wheat leaves. Photosynth. Res. 2015, 126, 449–463. [Google Scholar] [CrossRef]
- Brestic, M.; Zivcak, M.; Kunderlikova, K.; Sytar, O.; Shao, H.; Kalaji, H.M.; Allakhverdiev, S.I. Low PSI content limits the photoprotection of PSI and PSII in early growth stages of chlorophyll b-deficient wheat mutant lines. Photosynth. Res. 2015, 125, 151–166. [Google Scholar] [CrossRef]
- Huang, W.; Yang, Y.J.; Zhang, S.B. Specific roles of cyclic electron flow around photosystem I in photosynthetic regulation in immature and mature leaves. J. Plant Phys. 2017, 209, 76–83. [Google Scholar] [CrossRef]
- Takagi, D.; Miyake, C. Proton gradient regulation 5 supports linear electron flow to oxidize photosystem I. Physiologia Plantarum 2018, 164, 337–348. [Google Scholar] [CrossRef]
- Takagi, D.; Takumi, S.; Miyake, C. Growth light environment changes the sensitivity of photosystem I photoinhibition depending on common wheat cultivars. Front. Plant Sci. 2019, 10, 686. [Google Scholar] [CrossRef]
- Wada, S.; Takagi, D.; Miyake, C.; Makino, A.; Suzuki, Y. Responses of the photosynthetic electron transport reactions stimulate the oxidation of the reaction center chlorophyll of photosystem I, p700, under drought and high temperatures in rice. Int. J. Mol. Sci. 2019, 20, 2068. [Google Scholar] [CrossRef]
- Schmitt, F.J.; Renger, G.; Friedrich, T.; Kreslavski, V.D.; Zharmukhamedov, S.K.; Los, D.A.; Kuznetsov, V.V.; Allakhverdiev, S.I. Reactive oxygen species: Re-evaluation of generation, monitoring and role in stress-signalling in phototrophic organisms. Biochim. Biophys. Acta 2014, 1837, 835–848. [Google Scholar] [CrossRef]
- Takagi, D.; Amako, K.; Hashiguchi, M.; Fukaki, H.; Ishizaki, K.; Goh, T.; Sawa, S. Chloroplastic ATP synthase builds up a proton motive force preventing production of reactive oxygen species in photosystem I. Plant J. 2017, 91, 306–324. [Google Scholar] [CrossRef] [Green Version]
- Huang, W.; Tikkanen, M.; Zhang, S.B. Photoinhibition of photosystem I in Nephrolepis falciformis depends on reactive oxygen species generated in the chloroplast stroma. Photosynth. Res. 2018, 137, 129–140. [Google Scholar] [CrossRef]
- Tikkanen, M.; Mekala, N.R.; Aro, E.M. Photosystem II photoinhibition-repair cycle protects Photosystem I from irreversible damage. Biochim. Biophys. Acta 2014, 1837, 210–215. [Google Scholar] [CrossRef] [Green Version]
- Kono, M.; Noguchi, K.; Terashima, I. Roles of the cyclic electron flow around PSI (CEF-PSI) and O2-dependent alternative pathways in regulation of the photosynthetic electron flow in short-term fluctuating light in Arabidopsis thaliana. Plant Cell Physiol. 2014, 55, 990–1004. [Google Scholar] [CrossRef]
- Kudoh, H.; Sonoike, K. Irreversible damage to photosystem I by chilling in the light: Cause of the degradation of chlorophyll after returning to normal growth temperature. Planta 2002, 215, 541–548. [Google Scholar] [CrossRef]
- Zivcak, M.; Brestic, M.; Kunderlikova, K.; Olsovska, K.; Allakhverdiev, S.I. Effect of photosystem I inactivation on chlorophyll a fluorescence induction in wheat leaves: Does activity of photosystem I play any role in OJIP rise? J. Photochem. Photobiol. 2015, 152, 318–324. [Google Scholar] [CrossRef]
- Sonoike, K. Photoinhibition of photosystem I. Physiol. Plant 2011, 142, 56–64. [Google Scholar] [CrossRef]
- Fukayama, H.; Ueguchi, C.; Nishikawa, K.; Katoh, N.; Ishikawa, C.; Masumoto, C.; Hatanaka, T.; Misoo, S. Overexpression of Rubisco activase decreases the photosynthetic CO2 assimilation rate by reducing Rubisco content in rice leaves. Plant Cell Physiol. 2012, 53, 976–986. [Google Scholar] [CrossRef]
- Wada, S.; Suzuki, Y.; Takagi, D.; Miyake, C.; Makino, A. Effects of genetic manipulation of the activity of photorespiration on the redox state of photosystem I and its robustness against excess light stress under CO2-limited conditions in rice. Photosynth. Res. 2018, 137, 431–441. [Google Scholar] [CrossRef]


© 2019 by the authors. Licensee MDPI, Basel, Switzerland. This article is an open access article distributed under the terms and conditions of the Creative Commons Attribution (CC BY) license (http://creativecommons.org/licenses/by/4.0/).
Share and Cite
Chovancek, E.; Zivcak, M.; Botyanszka, L.; Hauptvogel, P.; Yang, X.; Misheva, S.; Hussain, S.; Brestic, M. Transient Heat Waves May Affect the Photosynthetic Capacity of Susceptible Wheat Genotypes Due to Insufficient Photosystem I Photoprotection. Plants 2019, 8, 282. https://doi.org/10.3390/plants8080282
Chovancek E, Zivcak M, Botyanszka L, Hauptvogel P, Yang X, Misheva S, Hussain S, Brestic M. Transient Heat Waves May Affect the Photosynthetic Capacity of Susceptible Wheat Genotypes Due to Insufficient Photosystem I Photoprotection. Plants. 2019; 8(8):282. https://doi.org/10.3390/plants8080282
Chicago/Turabian StyleChovancek, Erik, Marek Zivcak, Lenka Botyanszka, Pavol Hauptvogel, Xinghong Yang, Svetlana Misheva, Sajad Hussain, and Marian Brestic. 2019. "Transient Heat Waves May Affect the Photosynthetic Capacity of Susceptible Wheat Genotypes Due to Insufficient Photosystem I Photoprotection" Plants 8, no. 8: 282. https://doi.org/10.3390/plants8080282