

Genome-Wide Association Study Identified Candidate Genes for Alkalinity Tolerance in Rice


School of Plant, Environmental, and Soil Sciences, Louisiana State University Agricultural Center, Baton Rouge, LA 70803, USA
*
Author to whom correspondence should be addressed.
Plants 2023, 12(11), 2206; https://doi.org/10.3390/plants12112206
Submission received: 1 May 2023
/
Revised: 1 June 2023
/
Accepted: 1 June 2023
/
Published: 3 June 2023
(This article belongs to the Special Issue Advances in Genetics and Breeding of Grain Crops)
Abstract
:Alkalinity stress is a major hindrance to enhancing rice production globally due to its damaging effect on plants’ growth and development compared with salinity stress. However, understanding of the physiological and molecular mechanisms of alkalinity tolerance is limited. Therefore, a panel of indica and japonica rice genotypes was evaluated for alkalinity tolerance at the seedling stage in a genome-wide association study to identify tolerant genotypes and candidate genes. Principal component analysis revealed that traits such as alkalinity tolerance score, shoot dry weight, and shoot fresh weight had the highest contribution to variations in tolerance, while shoot Na+ concentration, shoot Na+:K+ ratio, and root-to-shoot ratio had moderate contributions. Phenotypic clustering and population structure analysis grouped the genotypes into five subgroups. Several salt-susceptible genotypes such as IR29, Cocodrie, and Cheniere placed in the highly tolerant cluster suggesting different underlying tolerance mechanisms for salinity and alkalinity tolerance. Twenty-nine significant SNPs associated with alkalinity tolerance were identified. In addition to three alkalinity tolerance QTLs, qSNK4, qSNC9, and qSKC10, which co-localized with the earlier reported QTLs, a novel QTL, qSNC7, was identified. Six candidate genes that were differentially expressed between tolerant and susceptible genotypes were selected: LOC_Os04g50090 (Helix-loop-helix DNA-binding protein), LOC_Os08g23440 (amino acid permease family protein), LOC_Os09g32972 (MYB protein), LOC_Os08g25480 (Cytochrome P450), LOC_Os08g25390 (Bifunctional homoserine dehydrogenase), and LOC_Os09g38340 (C2H2 zinc finger protein). The genomic and genetic resources such as tolerant genotypes and candidate genes would be valuable for investigating the alkalinity tolerance mechanisms and for marker-assisted pyramiding of the favorable alleles for improving alkalinity tolerance at the seedling stage in rice.
1. Introduction
Alkalinity stress drastically reduces rice yield. About 850 million hectares of land are affected by salinization–alkalization and 434 million ha of this land are exposed to alkaline stress [1]. Alkalization of land is increasing every year due to poor irrigation management and climate change [2]. Rice is a staple food for more than 3.5 billion people all over the globe [3]. Due to the exponential population growth in developing countries, rice production in abiotic-stress-affected areas needs to be enhanced for regional and global food security. However, progress in developing alkaline-tolerant varieties is very slow due to the genetic complexity of the alkalinity stress tolerance mechanisms. Therefore, research on rice’s alkalinity tolerance has great relevance for increasing global rice production.
Plants possess various physiological and molecular mechanisms for adaptation to an alkaline environment, and these mechanisms are controlled by the expression of specific stress-related genes [4,5]. Alkaline stress is more harmful to plants than saline stress, but there is a wide range of variations for alkalinity tolerance [6,7]. Alkaline stress is primarily caused by HCO3− and CO32−, as well as high pH [8]. These anions, alongside high pH, might be responsible for different plant adaptation strategies under alkaline stress. Alkali soils have pH values of 8.5–10.0, exchangeable sodium > 15, and electrical conductivity < 4000 micromhos per cm at 25 °C. Soil alkalinity restricts the growth of rice at all stages by decreasing nutrient availability, disrupting ionic balance, and increasing osmotic pressure, especially under high pH [9,10]. Plants need to cope with the high pH of soil or water under alkaline stress in addition to ionic and osmotic stresses [11]. High concentrations of Na+ in alkaline soils disrupt the homeostasis of minerals such as K+ and consequently, affect cellular metabolism by altering cytoplasmic strength [12]. Water and potassium uptake decrease due to Na+ accretion in the roots under excessive Na2CO3 around the rhizosphere. The precipitation of iron and phosphorus under a high pH environment causes deficiencies in these nutrients resulting in the wilting of plants [13,14]. Alkalinity-tolerant plants can sequestrate Na+ in vacuoles to enhance their tolerance to high concentrations of ions [15,16]. The Na+/H+ antiporter in the plasma membrane and HKT family of transporters help to prevent sodium from entering the shoots resulting in a lower sodium/potassium ratio [11,17].
High pH under alkaline stress negatively impacts the root system leading to reduced root surface area and impaired function [18]. To cope with these challenges, rice plants promote the accumulation of osmolytes and organic acids, which act as buffers and help maintain intracellular pH stability and ionic balance [19,20]. Ionic balance and nutrient uptake are associated with root structure as plants with vigorous root systems can maintain their growth under a stressful environment [21]. Alkalinity-stress-induced damage to root cells was reported to be influenced by the accumulation of reactive oxygen species and regulation of cell-death-related and cell-death-suppressor genes [22]. Similarly, plants with larger and deeper root systems can accumulate more Fe under alkaline stress [23]. The over-expression of genes such as OsIRO2, OsIRT1, OsNAS1, OsNAS2, OsYSL15, and OsYSL2 also allows plants to efficiently take up iron and improve alkalinity tolerance [23].
Alkalinity tolerance in rice is a complex trait and multiple quantitative trait loci (QTL) control this attribute [24]. Most of the research related to alkaline stress tolerance in rice is in the primary stage of QTL mapping. Several major QTLs and identified candidate genes (LOC_Os03g59730; LOC_Os09g32860; LOC_Os10g35170) within these QTLs were identified using whole genome sequencing on chromosomes 3, 9, and 10 [2,7]. A major QTL, qSNC3, with two candidate genes (LOC_Os03g62500; LOC_Os03g62620), was detected [15]. A few other alkalinity-tolerance QTL studies were conducted at the seedling and germination stage of rice [24,25,26,27]. A few valuable genes associated with alkalinity tolerance have been identified. The role of LSD1-like zinc finger protein (OsLOL5), a nucleus thylakoid protein (OsY3P1), a potassium channel protein (OsAKT1), a snf2 family gene (OsALT1), a calcium-dependent protein kinase (OsDM13), and a gene encoding an inorganic phosphatase (OsPPa6) have been shown to improve alkalinity tolerance in rice [28,29,30,31,32,33]. Conducting a genome-wide association study (GWAS) is the widely used approach for providing insights into the molecular genetic basis of complex traits and identifying genes or molecular markers associated with target traits for crop improvement [34,35,36]. Compared to traditional QTL mapping, which involves examining the inheritance patterns of a single genetic trait, GWAS looks at the occurrence of variants in natural populations with high resolution [37]. Li et al. (2020) [38] identified a major QTL, qAKT11, for alkalinity tolerance in a GWAS study. A major QTL, qSNC3, and a candidate gene, OsIRO3, were detected for alkalinity tolerance [12]. Eight candidate genes conferring alkalinity tolerance at the germination stage were identified in another rice GWAS study [39].
In this study, we evaluated a diverse panel of 184 indica and japonica rice genotypes for alkalinity tolerance at the seedling stage to evaluate the genetic variation and population structure. To overcome the narrow genetic diversity, rice cultivars released in the United States during the 20th century and cultivars from IRRI were included in this study. The specific objectives of this study were to: (i) screen the japonica and indica rice genotypes for seedling-stage alkalinity tolerance, (ii) investigate the genetic variability, and population structure of the diversity panel, and (iii) identify QTLs and candidate genes for traits associated with seedling-stage alkalinity tolerance.
2. Results
2.1. Phenotypic Evaluation under Alkaline Stress
There was a wide variation in the alkalinity tolerance scores (AKT) in the diversity panel. The highly tolerant, tolerant, moderately tolerant, susceptible, and highly susceptible genotypes constituted 4%, 24%, 33%, 26%, and 13% of the panel, respectively (Figure 1). The performance of some of the lines with known tolerance levels to salt stress under alkaline stress is shown in Figure 2. All morphological and physiological traits varied widely after exposure to alkalinity stress at the seedling stage (Table 1). All traits except shoot fresh weight (FW) and shoot dry weight (DW) were normally distributed (Figure 3). Analysis of variance showed significant differences among genotypes for AKT, shoot length (SHL), root length (RTL), root-to-shoot ratio (RSR), inverse shoot fresh weight (inv_FW), log shoot dry weight (log_DW), shoot Na+ concentration (SNC), shoot K+ concentration (SKC), and shoot Na+: K+ ratio (SNK). AKT, SKC, and SNK showed high heritability (>80%), while medium heritability (50–80%) was observed for the rest of the traits (Table 1).
No significant difference was observed among genotypes in the control experiment (Table S1 and Table 1). The mean AKT score was lower in the control compared to the stress environment. There were reductions in shoot and root length under alkalinity stress. The mean value of SNC and SNK was lower while the mean SKC value was higher under control than the stress environment. Similarly, heritability values were low for all traits under alkalinity stress.
2.2. Correlation Analysis
Significant correlations were observed among different traits (Table 2). AKT was negatively correlated with SHL, RTL, RSR, inv_FW, log_DW, and SKC, while it was positively correlated with SNC and SNK. SHL and RTL had a positive association with inv_FW, log_DW, and SKC; however, both traits were negatively correlated with RSR, SNC, and SNK. SKC had a significant positive correlation with all the morphological traits except AKT. There was a significant positive correlation between SNC and SNK. Inv_FW showed a positive correlation with log_DW and SKC but it was negatively correlated with SNC and SNK.
2.3. Principal Component Analysis (PCA)
Nine morphological and physiological traits were used to separate the genotypes of the panel into different groups reflecting the level of tolerance to alkalinity stress. The first two principal components, PC1 and PC2, accounted for 38% and 22% of the total variation, respectively (Table S2, Figure 4a). The first four principal components with eigenvalues greater than 1 explained 90% of the total variation. Based on a cutoff value of 0.50, four variables contributed to PC1 and PC2 and one variable contributed to PC3 (Table S3). Different principal components might be responsible for explaining the variability for different sets of variables as there was no correlation among principal components. It was evident from the PCA plot that positively correlated traits were grouped together. PC1 accounted for the variability among rice genotypes for Inv_FW, log_DW, and SNC with their positive coefficients, and AKT with its negative coefficient (Table S3). Similarly, PC2 represented the variation for RSR and SKC with their positive coefficients and STL and SNK with their negative coefficients. PC3 explained the variation among genotypes for RTL. PCA did not separate the indica and japonica genotypes based on phenotypic traits (Figure 4b).
2.4. Phenotypic Clustering
The genotypes of the panel were organized into five clusters based on the phenotypic response under alkaline stress (Table 3, Figure 5). The alkalinity tolerance level of each cluster was assessed by the mean AKT scores and mean SNC and SKC values. The genotypes grouped in cluster 1 were highly susceptible to alkalinity stress. The mean AKT, SNC, and SKC of the genotypes in cluster 1 were 8.1, 2056 mmol/kg, and 602 mmol/kg, respectively (Table S4). This cluster included alkalinity-stress-susceptible genotypes N22 and Dular [2,7] and many genotypes from Arkansas, Texas, and Louisiana. The genotypes in cluster 2 were considered as tolerant to alkali stress. The alkalinity-tolerant genotypes Cocodrie [2,7], Jupiter, FL478, Bengal, and IR64 were placed in this group. The average AKT, SNC, and SKC for this cluster were 3.6, 1626 mmol/kg, and 629 mmol/kg, respectively. Most of the genotypes in this cluster were from Louisiana, California, India, and the Philippines. Cluster 3 was a highly tolerant group that included genotypes from Louisiana (JN100, JN349, W149) and genotypes from other countries (IR29, Vandana, Nipponbare). The mean AKT, SNC, and SKC were 1.8, 1487 mmol/kg, and 635 mmol/kg, respectively. Cluster 4 was moderately tolerant with mean AKT, SNC, and SKC of 5.6, 1793 mmol/kg, and 710 mmol/kg, respectively. Salt-tolerant genotypes Pokkali and TCCP were included in this group. Genotypes in cluster 5 were alkali-susceptible with mean AKT, SNC, and SKC of 7.0, 1956 mmol/kg, and 731 mmol/kg, respectively.
2.5. Population Structure
The population structure was determined using the Bayesian clustering method in the ‘STRUCTURE’ software. Five distinct groups (K = 5) were identified using the log-likelihood LnP (D) and Evanno’s deltaK (Figure 6). The list of genotypes, their geographic origin, and the subgroups are listed in Table S5. Subgroup 1 (SG1) contained 40 genotypes belonging to the japonica subspecies. This subgroup contained genotypes from Louisiana, Arkansas, and Texas. The subgroups 2, 3, and 5 (SG2, SG3, and SG5) contained an admixture of indica and japonica subspecies. There was no distinction between US genotypes and those obtained from other countries in these subgroups. Nine genotypes were clustered in SG4, and all belonged to the indica subspecies. Furthermore, all genotypes in SG4 were genotypes from other countries except BHA1115, a black-hulled weedy rice genotype. The analysis of molecular variance (AMOVA) of the five subgroups showed that there were significant differences between and among these subgroups. The total variation among and within the subgroups was 61% and 39%, respectively (Table 4).
2.6. Linkage Disequilibrium (LD)
A final set of 830 SNP markers was used for the GWAS analysis. The number of SNPs within a 1Mb window size is shown in Figure S1. The average SNP density ranged from 367 kb/marker for chromosome 6 to 537 kb/marker for chromosome 4, with an average of 450 kb/marker (Table 5). The mean LD decay over the physical distance, computed as r2, was 10,691 kb with a range of 7334 kb for chromosome 10 to 15,193 kb for chromosome 1. In the whole panel, the r2 estimate was 0.47 (Figure 7). The LD decay was faster for chromosomes 1, 2, 3, 4, 6, and 7 and was greater than its average value. The LD decay was slower for chromosomes 5, 8, 9, 10, 11, and 12.
2.7. GWAS Analysis
GWAS was conducted via the FarmCPU model on all alkalinity-stress-related traits for 184 indica and japonica genotypes considering kinship (K) and population structure (Q) using the rMVP package in R. 31. Significant SNPs (p < 0.011) associated with AKT, SHL, RTL, RSR, Inv_FW, log_DW, SKC, SNC, and SNK were identified (Figure 8). There were 18 significant SNPs for morphological traits (AKT, SHL, RTL, RSR, log_DW, inv_FW) and 10 for physiological traits (SNC, SKC, SNK) (Table 6).
2.8. Candidate Genes/QTLs for Alkalinity Tolerance
The significant SNPs were used to identify candidate genes present within the genes or present within 10 kb flanking genomic regions of the respective SNPs. A total of 28 candidate genes were detected (Table 6). These genes were compared with the earlier QTLs and differential gene expression studies [2,7,16]. Six genes were present within the intervals of earlier identified QTLs [2,7], while three genes were differentially expressed under alkaline stress in an earlier study [16].
Separately, a region was considered a QTL if more than two significant SNPs were present within the LD interval. Six large-impact QTLs were detected on chromosomes 1, 4, 7, 9, 10, and 12 (Table 7). Three QTLs (qlog_DW1.37, qSKC9.19, and qSKC10.18) were congruent to the QTLs identified previously [2,7]. The qSNK4.34 co-localized with the qSNK4-2 identified under alkalinity stress [12]. Two novel QTLs, qSNC7.29 and qSHL12.23, were also identified on chromosomes 7 and 12, respectively.
2.9. Expression Profiling of Selected Candidate Genes under Alkalinity Stress
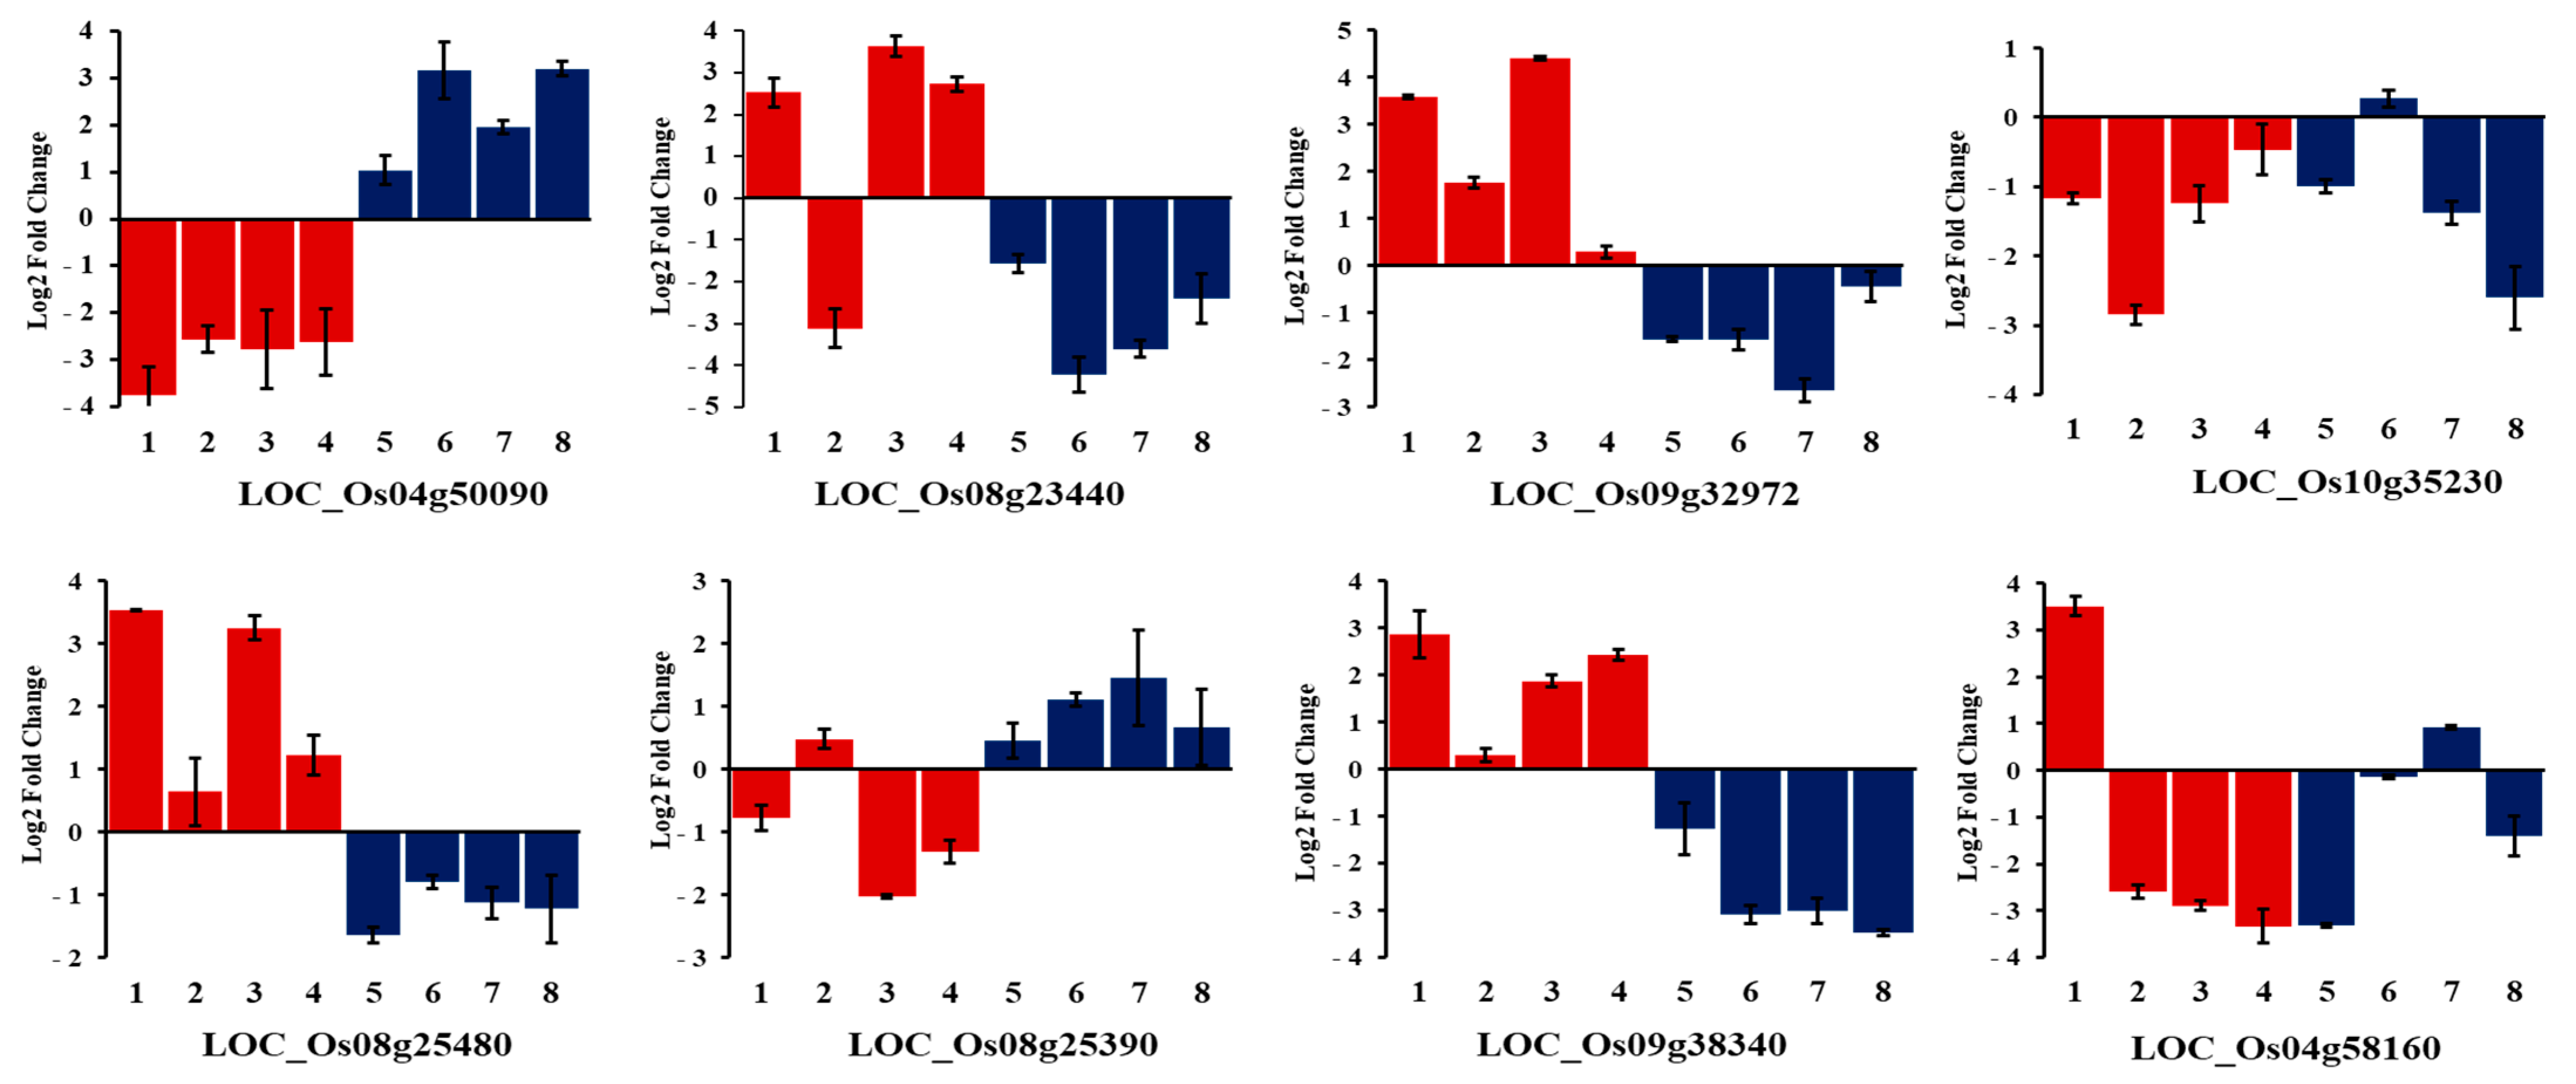
Eight genotypes were selected from the tolerant (JN100, Cheniere, Cocodrie, Nipponbare) and susceptible (N22, Dular, Cypress, Hasawi) genotypes for expression analysis under alkalinity stress (Figure 9). The genes and primers used in the qRT-PCR analysis are listed in Table S6. LOC_Os04g50090 (Helix–loop–helix DNA-binding protein) was downregulated in all the genotypes in the tolerant group compared with those in the susceptible group. The LOC_Os08g25390 (Bifunctional homoserine dehydrogenase) showed the same expression pattern in both groups except alkalinity-tolerant Cheniere. In contrast, the expression level of LOC_Os09g32972 (MYB protein), LOC_Os09g38340 (ZOS9-17—C2H2 zinc finger protein), and LOC_Os08g25480 (Cytochrome P450) increased 6 h after exposure to alkalinity stress in the tolerant group, whereas it decreased in all the genotypes in the susceptible group. A similar trend was observed for LOC_Os08g23440 (amino acid permease family protein) except for Cheniere, in which it was downregulated. There was downregulation in LOC_Os04g58160 (Fiber protein Fb34) in both groups with the exceptions of JN100 (tolerant) and Cypress (susceptible). Similarly, the expression of LOC_Os10g35230 (Rf1, mitochondrial precursor) decreased sharply after 6 h exposure to stress in both groups except Dular.
3. Discussion
Salinity–alkalinity stress is a major hindrance to enhancing food production in many rice-growing areas around the globe [40]. Alkalinity stress can have harmful effects on plant growth and development. In addition to causing toxicity, it can also affect the stability and functioning of plant cells due to high pH [9]. While several studies reported the identification of QTLs and candidate genes for alkalinity-tolerance traits in rice [2,7,12,15,27,38], more research is needed to understand the molecular mechanisms.
Alkaline tolerance evaluation in rice has been largely based on the uptake of sodium and potassium ions and the morpho-physiological response to alkalinity stress [2,12]. The alkalinity-tolerant plants sequester the Na+ outside the shoots and roots to tolerate high concentrations of Na+ around the rhizosphere [11]. This view was supported by our observation of a significant positive correlation between AKT and SNC (Table 2). In addition, an excess of sodium in the shoots indirectly affecting the upward movement of potassium in the plant was corroborated by a significant negative correlation between SNC and SKC (Table 2). The tolerant lines accumulate more K+ than the susceptible lines. The detrimental effects of alkalinity stress were clearly reflected in the negative correlation between AKT and morphological traits. The negative association between RTL and AKT, SNC, and SNK indicated that plants with deeper root systems could maintain a desirable Na:K ratio and uptake of essential nutrients such as Fe under a stress environment, as reported earlier [23]. The range of AKT and other traits was wide under alkaline stress (Figure 1, Figure 2 and Figure 3) and both indica and japonica genotypes included both tolerant and susceptible genotypes. IR29 (indica) and Cocodrie (japonica) were tolerant to alkaline stress, which led us to conclude that indica and japonica genotypes could not be distinguished based on alkalinity tolerance (Figure 2, Table 3). Increased mean AKT score and reduced heritability values for all traits under a stress environment compared to control (Table 1 and Table S1) suggested the influence of alkaline stress on the expression of morpho-physiological traits.
There was a wide range of variability for alkalinity tolerance among the rice genotypes (Figure 4). Principle component analysis revealed that AKT, log_DW, and inv_FW had the highest contribution for the variation among the genotypes, while SNC, SNK, and RSR had a moderate contribution (Figure 4, Table S3). These three traits could be used to assess the level of alkalinity tolerance in rice genotypes. De Leon et al. (2015) [41] used cluster analysis and multivariate test statistics to differentiate salt-tolerant rice genotypes from salt-sensitive genotypes based on morphological traits. Chunthaburee et al. (2016) [42] reported a strong correlation between Na+/K+ and salinity tolerance in rice and used this ratio to group genotypes into tolerant and sensitive groups. The strong positive correlation of AKT with SNC and SNK, and negative correlation between SKC and AKT, in our study confirmed that regulation of the uptake of Na+ and K+ is critical for plants’ survival under alkalinity stress.
The rice genotypes were classified based on their level of tolerance to alkalinity stress. The salt-susceptible IR 29 [43] and Cheniere [44] were placed in the highly tolerant category (Table 3, Figure 5). The other genotypes in the tolerant group included both japonica (Jupiter, Bengal) and indica (FL478, Geumgangbyeo) genotypes. In an earlier study [41], Jupiter and Bengal were classified as susceptible and FL478 and Geumgangbyeo as tolerant to saline stress. The classification of Cocodrie as tolerant and N22 and Dular as highly susceptible in this study was consistent with earlier studies [2,7]. The inclusion of saline-tolerant Hasawi [45] and salt-susceptible Cypress [41] in the highly susceptible group suggested different mechanisms underlying tolerance to alkaline and saline stresses. In contrast, the grouping of some of the saline-tolerant genotypes (Pokkali, Nona Bokra, TCCP, Nipponbare, Geumgangbyeo, and Damodar) in the highly tolerant, moderately tolerant, and tolerant groups suggested that there might be some common physiological responses and the co-expression of genes under both types of stress.
Population structure analysis identified five subgroups within the indica and japonica rice genotypes (Figure 6b). Three subgroups were earlier detected within the japonica subgroup under alkaline stress [12]. This inconsistency could be due to the inclusion of the indica subgroup in our study. There was some clustering of indica and japonica genotypes, with subgroup 1 (SG1) containing all japonica genotypes and SG4 containing all the indica genotypes (Table S5). However, population structure analysis did not show an extreme differentiation among US genotypes or between indica and japonica genotypes. This observation was in disagreement with an earlier study [46], which showed the distinct separation of US and Asian rice genotypes.
Alkaline stress results in osmotic stress, ionic imbalance, and nutritional deficiency due to high pH [47,48,49], and, therefore, is difficult to mitigate. Studies have demonstrated that the expression of stress-responsive genes under stress can enhance the tolerance of plants to various abiotic stresses [50,51,52]. Multiple strategies have been utilized to identify genes related to alkaline tolerance in rice, and several genes have been identified [30,31,33].
Twenty-eight SNPs significantly associated with alkalinity tolerance suggested the involvement of 28 different loci (Table 6). Among these significant SNPs, at least two were associated with all traits except inv_FW. The SNPs identified in this study were compared with the QTLs and candidate genes for alkalinity tolerance in rice. Seventeen SNPs overlapped with QTLs and genes from earlier studies (Table 6). Based on LD decay, we identified a QTL, qSNK4, in the same region with a 5 Mb interval and R2 value of 16% (Table 7). Some known Na+ and K+ transporters such as OsHKT1;1 [53], OsHKT1;4 [54], and OsHAK15 [55] were present within this interval. The role of Na+ and K+ transporters in improving abiotic stress tolerance is well known [56,57,58]. It is possible that these proteins enhance alkalinity tolerance by regulating the uptake of Na+ ions and maintaining the Na+:K+ ratio [53]. Two significant SNPs (S04_29715617 and S04_34925111) for RTL and one SNP each for SNK (S04_34643455) and AKT (S04_29881066) on chromosome 4 tagged to LOC_Os04g4950, LOC_Os04g58730, LOC_Os04g58160, and LOC_Os04g50090, respectively, were located in the same region as qSNK4-2 [12]. The role of HKT and HAK genes in the regulation of Na+ and K+ under high pH conditions has remained elusive to date warranting investigation of this genomic region on chromosome 4 in the future to provide some insights into alkalinity tolerance mechanisms in rice. We included two genes, LOC_Os04g58160 (Fiber protein Fb34, putative) and LOC_Os04g50090 (Helix–loop–helix DNA-binding protein) from this genomic region in the qRT-PCR analysis. There was no clear contrast in the expression pattern of LOC_Os04g58160 between the tolerant and susceptible groups (Figure 9), but LOC_Os04g50090 was downregulated in all genotypes in the tolerant group compared to the susceptible group. These findings suggest the involvement of the novel gene LOC_Os04g50090, which played a negative role in regulating alkalinity tolerance in rice. Several members of the bHLH family were reported to be responsive to abiotic stresses in multiple species [59,60,61,62].
Similarly, two significant SNPs each on chromosomes 9 and 10 led to the detection of qSNC9 and qSKC10, which co-localized with the qSNC9.19 and qSKC10.18 from earlier studies (Table 7) [2,7]. Based on LD decay, qSKC10 and qSKC9 spanned over 735 and 361 kb region, respectively. Six candidate genes were differentially expressed between alkalinity-tolerant and -susceptible genotypes in our previous study [2]. Furthermore, these genes were involved in the abiotic stress tolerance response in rice [29,63,64,65,66,67,68,69,70]. The genes harboring significant SNPs identified in this study were LOC_Os09g32350 (Expressed protein), LOC_Os09g32972 (MYB protein), and LOC_Os10g35230 (Rf1, mitochondrial precursor). These genomic regions can provide a deeper understanding of the molecular basis of alkalinity stress tolerance. Finally, creating mutations using CRISPR-mediated genome editing followed by analyzing the phenotypic changes can help validate the functional role of these genes in response to alkalinity stress. A genome-wide comparative analysis of the MYB gene family in rice and Arabidopsis implicated several MYB proteins in abiotic stress responses [71]. The upregulation of LOC_Os09g32972 in tolerant genotypes suggests a crucial role for the MYB transcription factor in alkalinity tolerance in rice (Figure 9). However, there was no clear trend in the expression of LOC_Os01g35230 (Rf1, mitochondrial precursor), which was downregulated in both tolerant and susceptible genotypes in this study.
The qlog_DW1.38 detected in this study was the same QTL identified previously [72,73]. The sd1 locus (LOC_Os01g66100) [74] was located within this interval. De Leon et al. (2016) [72] showed that the sd1 gene was responsible for increasing SRR in plants under saline stress. The same region was associated with various morphological traits under alkalinity stress [2,7], suggesting the role of this region in alkalinity tolerance. Two QTLs, qSNC7 and qSHL12, were considered to be novel QTLs. The candidate genes linked to significant SNPs detected within the qSNC7 were histone-arginine methyl transferase CARM1 (LOC_Os07g47500) and protein kinase APK1B (LOC_Os07g49470) (Table 6 and Table 7). Similarly, a protein kinase-like family protein (LOC_Os12g37570) and xaa-pro aminopeptidase (LOC_Os12g37640) were present within the qSHL12. A calcium-dependent protein kinase OsDMI3 was earlier shown to enhance the ability of rice roots to tolerate saline–alkaline conditions by regulating the intake of Na+ and H+ ions [32]. Similarly, histone posttranslational modifications (PTMs) and interactions between them play a key role in mediating salt tolerance in plants [75,76]. Our results identified potential genetic targets for improving the growth of rice in environments with high alkalinity levels. Three significant SNPs tagged with candidate genes, amino acid permease family protein (LOC_Os08g23440), Cytochrome P450 (LOC_Os03g25480), and bifunctional homoserine dehydrogenase (LOC_Os08g25390), co-localized with the three earlier reported differentially expressed genes under alkaline stress [16] (Table 6). Among these genes, LOC_Os08g23440 and LOC_Os03g25480 were upregulated in the tolerant group, whereas LOC_Os08g25390 was downregulated in the tolerant group (Figure 9). The amino acid permease1, which is induced by salt stress, mediated the uptake of proline, and increased salt susceptibility was observed in an Arabidopsis mutant due to reduced accumulation of proline compared with the wild type [77]. The upregulation of this gene in tolerant genotypes suggested its role in imparting alkalinity tolerance in rice. Cytochrome P450 was known to confer abiotic stress tolerance [78,79]. Since the role of bifunctional homoserine dehydrogenase under abiotic stresses is unclear, it warrants future investigation for its potential in improving alkaline stress tolerance in rice.
The other candidate genes tagged with the significant SNPs were ER-Golgi intermediate compartment protein 3 (LOC_Os04g38340), OsSIGP1 (LOC_Os02g58139), anthocyanidin 5,3-O-glucosyltransferase (LOC_Os01g64910), OsFBX168 (LOC_Os05g41130), Cysteine protease family protein (LOC_Os02g06890), C2H2 zinc finger protein (LOC_Os09g38340), and fiber protein Fb34 (LOC_Os04g58160) (Table 6). LOC_Os04g38340, LOC_Os02g58139, LOC_Os01g64910, and LOC_Os04g58160 were not reported in previous alkalinity tolerance studies. However, fiber protein Fb34 did not show a contrasting expression pattern between the tolerant and susceptible groups in our study (Figure 9). The expression of C2H2 zinc finger protein sharply increased in all tolerant genotypes compared with the susceptible group (Figure 9). The F-box protein, cysteine protease family protein, and C2H2 zinc finger protein were involved in abiotic stress tolerance [2,7,80]. The C2H2 zinc finger protein is a novel candidate gene for alkalinity tolerance identified in this study.
Several studies identified the same candidate genes and QTLs for highly correlated traits [81,82]. However, this study revealed different results and was in agreement with earlier studies [83,84]. Although a high correlation was observed between Fe and Zn content, different QTLs controlled these traits [83]. Similarly, different candidate genes were identified for the highly correlated traits, grain width and grain weight [84]. Our results could be due to the complexity of alkalinity tolerance mechanisms in which associated phenotypic traits are controlled by many genes and environmental conditions. Another reason could be the low SNP density, which resulted in a failure to detect more SNPs significantly associated with alkalinity tolerance traits.
Given the importance of rice as a staple food and the challenges due to climate-change-related environmental stresses, and geographical limitations, it is crucial to characterize the response of different rice genotypes to alkalinity stress. This study revealed significant variations in the physiological responses of different rice genotypes to alkalinity stress. Specifically, we observed that increased alkalinity led to increased uptake of Na+ in shoots, which in turn resulted in decreased uptake of K+. The study identified several alkalinity-tolerant rice genotypes such as Saturn, Della, JN100, JN349, Nipponbare, Mercury, BHA1115, IR 29, Cheniere, IR 50, Panidhan II, Koshihikari, Teqing, Dellmont, Kanchan, Swarna, W149, Perum karuppan, Taipe 309, and Hayamasari which could be used as potential donors to improve alkalinity tolerance. The high-yielding tolerant genotypes could be also recommended for cultivation in saline–alkaline areas. Most of these top-performing genotypes had relatively low-to-moderate Na+ uptake while maintaining a high K+ uptake indicating a higher degree of tissue tolerance. In addition to the QTLs qSNC9 and qSKC10, which co-localized with previously reported QTLs, a novel QTL and several candidate genes were identified.
4. Conclusions
Alkalinity tolerance exhibited by salt-susceptible rice genotypes, or vice versa, indicated that different mechanisms underly tolerance to salinity and alkalinity stresses. Twenty-eight significant SNPs and six QTL regions were detected via GWAS analysis. Two QTLs, qSNC9 and qSKC10, were congruent with the QTLs detected in previous alkaline studies, while qSNC7 was a novel QTL. Six candidate genes, LOC_Os04g50090, LOC_Os08g23440, LOC_Os09g32972, LOC_Os08g25480, LOC_Os08g25390, and LOC_Os09g38340, showed contrasting expression between tolerant and susceptible genotypes, suggesting their potential role in imparting alkalinity tolerance. Since the understanding of alkalinity tolerance in rice is limited, the alkaline-tolerant genotypes, SNPs, QTLs, and candidate genes identified in this study will be valuable resources for gaining further insights into the tolerance mechanism, as well as for breeding alkaline-tolerant rice varieties.
5. Materials and Methods
5.1. Plant Materials
A total of 185 rice genotypes from the USA and the International Rice Research Institute (IRRI) including some saline-alkaline tolerant genotypes were evaluated under alkalinity stress at the seedling stage. The experiment was conducted in a randomized complete block design (RCBD) at the LSU AgCenter greenhouse with three replications. Seeds were exposed to 50 °C for 3 days to break dormancy and sown in 4-inch sand-filled pots. The seedlings at the two-leaf stage were then exposed to alkalinity stress for two weeks with 0.20% Na2CO3, followed by one week of exposure to 0.40% Na2CO3 in the stress experiment. The pH of the solution was adjusted to 10.0 in the stress experiment to imitate alkaline stress. The seedlings in the control experiment were allowed to grow under normal conditions. After three weeks of stress, the seedlings were evaluated for various morphological and physiological traits. The mean performance of each genotype was recorded for alkalinity tolerance score (AKT), root length (RTL), shoot length (SHL), root-to-shoot ratio (RSR), shoot dry weight (DW), shoot fresh weight (FW), shoot Na+ concentration (SNC), shoot K+ concentration (SKC), and shoot sodium-to-potassium ratio (SNK). Alkalinity tolerance scoring was done on a scale of 1–9 depending on the percentage of dry and yellow leaves [2]. The shoot length and root length of the seedlings were recorded. The fresh weight of the shoots was recorded and the dry weight of the shoots was recorded after drying the seedlings at 50 °C for one week. The shoot samples were harvested and oven-dried at 60 °C for 10 days and 0.1 g of homogenized sample from each genotype was digested with nitric acid: hydrogen peroxide (5:3 mL) at 152–155 °C for 3 h [85]. The Na+ and K+ content of the samples was measured using a flame photometer (Jenway model PFP7, Bibby Scientific Ltd., Staffordshire, UK). The final concentrations of Na+ and K+ were calculated from the standard curve derived from standard solutions of Na+ and K+. The ratio of shoot Na+ to K+ (SNK) was obtained by dividing shoot Na+ concentration by shoot K+ concentration.
5.2. Statistical Analysis
SAS version 9.4 [86] and R version 2.2.1 [87] were used for statistical analysis of phenotypic data. The Shapiro–Wilk test was performed to test the hypothesis of normality and the normality assumption was violated in the case of DW and FW. Log and inverse transformations were performed for the data on DW and FW, respectively. Histograms and descriptive statistics were obtained. For each trait, an analysis of variance (ANOVA) was performed. Pearson correlation coefficients were computed to better understand the association among traits for alkalinity tolerance. The mean value of each trait was used for clustering and PCA. Principal component analysis was done to investigate the relationship among indica and japonica genotypes and the contribution of variables to the phenotype. The clustering of the genotypes was done using Euclidean distance. Broad sense heritability was calculated in SAS following the method of Holland et al. [88].
5.3. SNP Genotyping and Quality Control
Leaf samples of each genotype were collected from 21-day-old seedlings. The leaf samples were sent to the AgriPlex Genomics (https://www.agriplexgenomics.com/ Accessed on 15 August 2022) sequencing facility for genotyping with the IRRI rice amplicon SNP panel. SNP calling was done by Agriplex Genomics. SNPs with minor allele frequency (MAF) < 0.05 and SNPs with >5% missing values were filtered out. The k-nearest neighbor (KNN) method was used for the imputation of the missing values [89]. After filtering, a total of 832 SNPs were used for the analysis.
5.4. Structure Analysis and Linkage Disequilibrium
To assess the population structure and assign individuals to populations, STRUCTURE 2.3.4 [90] was used. The structure with varying numbers of groups (K) from 1 to 10 was run with 10,000 burn-in-periods and 50,000 Markov chain Monte Carlo (MCMC) replications. The ad hoc ΔK statistic was used to determine the true value of K [91].
5.5. Association Mapping
Population stratification often results in false positives in the GWAS analysis. To effectively control these false positives using population structure and kinship matrix, several GLM [94,95] and MLM [94,96] methods can be used. These methods compromise true positives in order to control false positives. The fixed and random model circulating probability unification (FarmCPU) method can reduce overfitting and effectively control false positives without compromising true positives [97]. Given those advantages, genome-wide association mapping was conducted via the FarmCPU method in the R package. The fixed effect model (FEM) and the random effect model (REM), which are used iteratively, are the two components of the multiple loci linear mixed model in FarmCPU. For the prevention of overfitting, REM estimates the several associated markers to calculate kinship, while FEM controls false positives and negatives by testing markers one at a time and kinship from REM as covariates [97]. The p-values of testing markers and various associated markers were unified at each iteration. The mean values of nine physiological and morphological traits were used for genome-wide association analysis. After GWAS, a threshold value (−log10 (p) ≥ 1.95) equivalent to 0.011 was used for declaring significant SNPs.
5.6. Candidate Gene Analysis
Candidate genes associated with significant SNPs (p ≤ 0.001) were selected if the genes were present within ±10 kb of the significant SNPs in the reference rice genome sequence. The functional annotation of candidate genes was evaluated. The list of candidate genes from GWAS analysis was compared with the QTLs and differential expression genes under alkalinity stress in rice from previous studies.
5.7. Expression Profiling of Selected Genes by Real-Time Quantitative Reverse Transcription PCR (qRT-PCR)
Four genotypes each from the tolerant and susceptible groups were selected for gene expression profiling. These genotypes were JN100, Cheniere, Cocodrie, and Nipponbare from the tolerant group and N22, Dular, Cypress, and Hasawi from the susceptible group. A hydroponic setup containing 1 g/L of Jack’s professional fertilizer (20-20-20) (JR Peters Inc., Allentown, PA, USA) was used to grow seedlings of these genotypes. The experiment was conducted in a randomized complete block design (RCBD) at an LSU greenhouse. There were three replications each for the control and alkalinity stress experiments. Twenty to thirty seedlings of each genotype were grown in each replication. Seedlings in the stress experiment were exposed to alkaline stress at the two-leaf stage with a solution of 0.5% Na2CO3 and pH 10.0. Leaf samples were collected from the control and stress experiments at 0 and 6 h of stress exposure and were stored at −80 °C. Total RNA was isolated from leaf tissues using Trizol reagent ((Thermofisher Scientific, Waltham, MA, USA). The quality of the RNA was assessed using a 1.2% agarose gel and the quantity was determined using an ND-1000 spectrophotometer (Thermofisher Scientific, Waltham, MA, USA). The RNA samples were treated with PerfeCTa DNase1 (Quantabio, Beverly, MA, USA) to remove any contaminating genomic DNA, and cDNA was synthesized using iScript™ first strand cDNA synthesis kit (Bio-Rad Laboratories, Hercules, CA, USA). Primers were designed using the PrimerQuest Tool (Integrated DNA Technologies, Inc., Coralville, IA, USA) and EF1α was used as an internal control. The qRT-PCR reaction was performed in triplicate using pooled cDNA from the biological replicates [98]. The expression level of genes was determined using the 2–∆∆CT method [99], which involves normalization to the internal control gene EF1α and calculation of the fold change in expression under alkalinity stress compared to the control for each genotype.
Supplementary Materials
The following supporting information can be downloaded at: https://www.mdpi.com/article/10.3390/plants12112206/s1, Table S1: Phenotypic performance of rice genotypes in the control environment at the seedling stage. Table S2: Eigenvalue, variance, and cumulative variance (%) of principal components for nine morphological and physiological traits in the rice genotypes under alkaline stress. Table S3: Eigenvectors and eigenvalues of the principal components for nine morpho-physiological traits of rice genotypes evaluated for alkalinity tolerance at the seedling stage. Table S4: Mean value of each group identified by cluster analysis for nine morphological and physiological traits in the rice genotypes under alkaline stress at the seedling stage. Table S5: List of rice genotypes, source, subspecies category, and the subgroup classification by the software ‘STRUCTURE’. Table S6: List of primers used in the gene expression profiling by qRT-PCR. Figure S1: Linkage map of rice showing the number of SNPs within a 1Mb window size on each chromosome.
Author Contributions
Conceptualization, P.K.S.; methodology and data analysis, L.S., R.P. and S.C.; draft preparation, L.S.; review and editing, P.K.S. All authors have read and agreed to the published version of the manuscript.
Funding
This research was supported by the United States Department of Agriculture–National Institute of Food and Agriculture (Grant no. 2018-67013-27618).
Data Availability Statement
The data presented in this study are available in the article and Supplementary Materials.
Acknowledgments
The manuscript is approved for publication by the Director of Louisiana Agricultural Experiment Station, USA, as manuscript number 2023-306-38915. We also thank Louisiana State University for allowing us to use the High-Performance Computing Facility for whole genome sequence analysis.
Conflicts of Interest
The authors declare no conflict of interest.
References
- Jin, H.; Plaha, P.; Park, J.Y.; Hong, C.P.; Lee, I.S.; Yang, Z.H.; Jiang, G.B.; Kwak, S.S.; Liu, S.K.; Lee, J.S.; et al. Comparative EST profiles of leaf and root of Leymus chinensis, a xerophilous grass adapted to high pH sodic soil. Plant Sci. 2006, 170, 1081–1086. [Google Scholar] [CrossRef]
- Singh, L.; Coronejo, S.; Pruthi, R.; Chapagain, S.; Subudhi, P.K. Integration of QTL mapping and whole genome sequencing identifies candidate genes for alkalinity tolerance in rice (Oryza sativa). Int. J. Mol. Sci. 2022, 23, 11791. [Google Scholar] [CrossRef] [PubMed]
- Li, Y.; Chen, L.; Cheng, Z.; Han, B.; Huang, X.; Wu, C.; Xiao, J.; Zhang, Q. Rice functional genomics research: Past decade and future. Mol. Plant 2018, 11, 359–380. [Google Scholar] [CrossRef] [PubMed] [Green Version]
- Deinlein, U.; Stephan, A.B.; Horie, T.; Luo, W.; Xu, G.; Schroeder, J.I. Plant salt-tolerance mechanisms. Trends Plant Sci. 2014, 19, 371–379. [Google Scholar] [CrossRef] [Green Version]
- Negrão, S.; Schmöckel, S.M.; Tester, M. Evaluating physiological responses of plants to salinity stress. Ann. Bot. 2017, 119, 1–11. [Google Scholar] [CrossRef] [Green Version]
- Lv, B.S.; Li, X.W.; Ma, H.Y.; Sun, Y.; Wei, L.X.; Jiang, C.J.; Liang, Z.-W. Differences in growth and physiology of rice in response to different saline-alkaline stress factors. Agron. J. 2013, 105, 1119–1128. [Google Scholar] [CrossRef]
- Singh, L.; Coronejo, S.; Pruthi, R.; Chapagain, S.; Bhattarai, U.; Subudhi, P.K. Genetic dissection of alkalinity tolerance at the seedling stage in rice (Oryza sativa) using a high-resolution linkage map. Plants 2022, 11, 3347. [Google Scholar] [CrossRef]
- Fang, S.; Hou, X.; Liang, X. Response mechanisms of plants under saline-alkali stress. Front. Plant Sci. 2021, 12, 667458. [Google Scholar] [CrossRef]
- Chen, W.; Cui, P.; Sun, H.; Guo, W.; Yang, C.; Jin, H.; Fang, B.; Shi, D. Comparative effects of salt and alkali stresses on organic acid accumulation and ionic balance of seabuckthorn (Hippophae rhamnoides L.). Ind. Crops Prod. 2009, 30, 351–358. [Google Scholar] [CrossRef]
- Tian, Z.J.; Li, J.P.; Jia, X.Y.; Yang, F.; Wang, Z.C. Assimilation and translocation of dry matter and phosphorus in rice genotypes affected by salt-alkaline stress. Sustainability 2016, 8, 568. [Google Scholar] [CrossRef] [Green Version]
- Chuamnakthong, S.; Nampei, M.; Ueda, A. Characterization of Na+ exclusion mechanism in rice under saline-alkaline stress conditions. Plant Sci. 2019, 287, 110171. [Google Scholar] [CrossRef] [PubMed]
- Li, N.; Zheng, H.; Cui, J.; Wang, J.; Liu, H.; Sun, J.; Liu, T.; Zhao, H.; Lai, Y.; Zou, D. Genome-wide association study and candidate gene analysis of alkalinity tolerance in japonica rice germplasm at the seedling stage. Rice 2019, 12, 24. [Google Scholar] [CrossRef] [PubMed]
- Wang, H.; Wu, Z.; Chen, C.; Yang, C.; Shi, D. Effects of salt and alkali stresses on growth and ion balance in rice (Oryza sativa L.). Plant Soil Environ. 2011, 57, 286–294. [Google Scholar] [CrossRef] [Green Version]
- Guo, M.; Wang, R.; Wang, J.; Hua, K.; Wang, Y.; Liu, X.; Yao, S. ALT1, a Snf2 family chromatin remodeling ATPase, negatively regulates alkaline tolerance through enhanced defense against oxidative stress in rice. PLoS ONE 2014, 9, e112515. [Google Scholar] [CrossRef] [PubMed] [Green Version]
- Li, N.; Sun, J.; Wang, J.; Liu, H.; Zheng, H.; Yang, L.; Liang, Y.; Li, X.; Zou, D. QTL analysis for alkaline tolerance of rice and verification of a major QTL. Plant Breed. 2017, 136, 881–891. [Google Scholar] [CrossRef]
- Li, N.; Liu, H.; Sun, J.; Zheng, H.; Wang, J.; Yang, L.; Zhao, H.; Zou, D. Transcriptome analysis of two contrasting rice cultivars during alkaline stress. Sci. Rep. 2018, 8, 9586. [Google Scholar] [CrossRef] [Green Version]
- El-Mahi, H.; Pérez-Hormaeche, J.; de Luca, A.; Villalta, I.; Espartero, J.; Gámez-Arjona, F.; Fernández, J.L.; Bundó, M.; Mendoza, I.; Mieulet, D.; et al. A critical role of sodium flux via the plasma membrane Na+/H+ exchanger SOS1 in the salt tolerance of rice. Plant Physiol. 2019, 180, 1046–1065. [Google Scholar] [CrossRef] [Green Version]
- Xiang, G.Q.; Ma, W.Y.; Gao, S.W.; Jin, Z.X.; Yue, Q.Y.; Yao, Y.X. Transcriptomic and phosphoproteomic profiling and metabolite analyses reveal the mechanism of NaHCO3-induced organic acid secretion in grapevine roots. BMC Plant Biol. 2019, 19, 383. [Google Scholar] [CrossRef]
- Li, X.Y.; Li, S.X.; Wang, J.H.; Lin, J.X. Exogenous abscisic acid alleviates harmful effect of salt and alkali stresses on wheat seedlings. Int. J. Environ. Res. Public Health 2020, 17, 3770. [Google Scholar] [CrossRef]
- Chen, T.X.; Shabala, S.; Niu, Y.N.; Chen, Z.H.; Shabala, L.; Meinke, H.; Venkataraman, G.; Pareek, A.; Xu, J.L.; Zhou, M.X. Molecular mechanisms of salinity tolerance in rice. Crop J. 2021, 9, 506–520. [Google Scholar] [CrossRef]
- Galvan-Ampudia, C.S.; Julkowska, M.M.; Darwish, E.; Gandullo, J.; Korver, R.; Brunoud, G.; Haring, M.A.; Munnik, T.; Vernoux, T.; Testerink, C. Halotropism is a response of plant roots to avoid a saline environment. Curr. Biol. 2013, 23, 2044–2055. [Google Scholar] [CrossRef] [Green Version]
- Zhang, H.; Liu, X.L.; Zhang, R.X.; Yuan, H.Y.; Wang, M.M.; Yang, H.Y.; Ma, H.Y.; Liu, D.; Jiang, C.J.; Liang, Z.W. Root damage under alkaline stress is associated with reactive oxygen species accumulation in rice (Oryza sativa L.). Front. Plant Sci. 2017, 8, 1580. [Google Scholar] [CrossRef] [PubMed]
- Li, Q.; Yang, A.; Zhang, W.H. Efficient acquisition of iron confers greater tolerance to saline-alkaline stress in rice (Oryza sativa L.). J. Exp. Bot. 2016, 67, 6431–6444. [Google Scholar] [CrossRef] [PubMed] [Green Version]
- Liang, J.; Qu, Y.; Yang, C.; Ma, X.; Cao, G.; Zhao, Z.; Zhang, S.; Zhang, T.; Han, L. Identification of QTLs associated with salt or alkaline tolerance at the seedling stage in rice under salt or alkaline stress. Euphytica 2015, 201, 441–452. [Google Scholar] [CrossRef]
- Cheng, H.T.; Jiang, H.; Xue, D.W.; Guo, L.B.; Zeng, D.L.; Zhang, G.H.; Qian, Q. Mapping of QTL underlying tolerance to alkali at germination and early seedling stages in rice. Acta Agron. Sin. 2008, 34, 1719–1727. [Google Scholar] [CrossRef]
- Qi, D.L.; Guo, G.Z.; Lee, M.C.; Zhang, J.G.; Cao, G.L.; Zhang, S.; Suh, S.; Zhou, Q.; Han, L. Identification of quantitative trait loci for the dead leaf rate and the seedling dead rate under alkaline stress in rice. J. Genet. Genom. 2008, 35, 299–305. [Google Scholar] [CrossRef]
- Luo, X.; Deng, H.; Wang, P.; Zhang, X.; Li, C.; Li, C.; Tan, J.; Wu, G.; Wang, Y.; Cheng, Q.; et al. Genetic analysis of germinating ability under alkaline and neutral salt stress by a high-density bin genetic map in rice. Euphytica 2020, 216, 107. [Google Scholar] [CrossRef]
- Obata, T.; Kitamoto, H.K.; Nakamura, A.; Fukuda, A.; Tanaka, Y. Rice shaker potassium channel OsKAT1 confers tolerance to salinity stress on yeast and rice cells. Plant Physiol. 2007, 144, 1978–1985. [Google Scholar] [CrossRef] [Green Version]
- Guo, J.; Sun, W.; Liu, H.; Chi, J.; Odiba, A.S.; Li, G.; Li-Ping, J.; Xin, C. Aldehyde dehydrogenase plays crucial roles in response to lower temperature stress in Solanum tuberosum and Nicotiana benthamiana. Plant Sci. 2020, 297, 110525. [Google Scholar] [CrossRef]
- Guan, Q.; Ma, H.; Wang, Z.J.; Wang, Z.Y.; Liu, S.K. A rice LSD1-like-type ZFP gene OsLOL5 enhances saline-alkaline tolerance in transgenic Arabidopsis thaliana, yeast and rice. BMC Genom. 2016, 17, 142. [Google Scholar] [CrossRef] [Green Version]
- Wang, B.; Xie, G.; Liu, Z.; He, R.; Han, J.; Huang, S.; Liu, L.; Cheng, X. Mutagenesis reveals that the OsPPa6 gene is required for enhancing the alkaline tolerance in rice. Front. Plant Sci. 2019, 10, 759. [Google Scholar] [CrossRef] [PubMed] [Green Version]
- Ni, L.; Wang, S.; Shen, T.; Wang, Q.; Chen, C.; Xia, J.; Jiang, M. Calcium/calmodulin-dependent protein kinase OsDMI3 positively regulates saline-alkaline tolerance in rice roots. Plant Signal. Behav. 2020, 15, 1813999. [Google Scholar] [CrossRef] [PubMed]
- Moon, H.; Kim, Y.A.; Shin, R.; Park, C.J. Nucleus-encoded thylakoid protein, OsY3IP1, confers enhanced tolerance to saline and alkaline stresses in rice. Rice Sci. 2022, 29, 225–236. [Google Scholar] [CrossRef]
- Zhou, Z.; Jiang, Y.; Wang, Z.; Gou, Z.; Lyu, J.; Li, W.; Yu, Y.; Shu, L.; Zhao, Y.; Ma, Y.; et al. Resequencing 302 wild and cultivated accessions identifies genes related to domestication and improvement in soybean. Nat. Biotechnol. 2015, 33, 408. [Google Scholar] [CrossRef] [Green Version]
- Huang, X.; Yang, S.; Gong, J.; Zhao, Q.; Feng, Q.; Zhan, Q.; Zhao, Y.; Li, W.; Cheng, B.; Xia, J.; et al. Genomic architecture of heterosis for yield traits in rice. Nature 2016, 537, 629. [Google Scholar] [CrossRef]
- Du, X.; Xu, W.; Peng, C.; Li, C.; Zhang, Y.; Hu, L. Identification and validation of a novel locus, Qpm-3BL, for adult plant resistance to powdery mildew in wheat using multilocus GWAS. BMC Plant Biol. 2021, 21, 357. [Google Scholar] [CrossRef]
- Flint-Garcia, S.A.; Thornsberry, J.M.; Buckler, E.S. Structure of linkage disequilibrium in plants. Annu. Rev. Plant Biol. 2003, 54, 357–374. [Google Scholar] [CrossRef] [Green Version]
- Li, X.; Zheng, H.; Wu, W.; Liu, H.; Wang, J.; Jia, Y.; Li, J.; Yang, L.; Lei, L.; Zou, D.; et al. QTL Mapping and candidate gene analysis for alkali tolerance in japonica rice at the bud stage based on linkage mapping and genome-wide association study. Rice 2020, 13, 48. [Google Scholar] [CrossRef]
- Mei, S.; Zhang, G.; Jiang, J.; Lu, J.; Zhang, F. Combining genome-wide association study and gene-based haplotype analysis to identify candidate genes for alkali tolerance at the germination stage in rice. Front. Plant Sci. 2022, 13, 887239. [Google Scholar] [CrossRef]
- Wei, L.X.; Lv, B.S.; Wang, M.M.; Ma, H.Y.; Yang, H.Y.; Liu, X.L.; Jiang, C.J.; Liang, Z.W. Priming effect of abscisic acid on alkaline stress tolerance in rice (Oryza sativa L.) seedlings. Plant Physiol. Biochem. 2015, 90, 50–57. [Google Scholar] [CrossRef]
- De Leon, T.B.; Linscombe, S.; Gregorio, G.; Subudhi, P.K. Genetic variation in Southern USA rice genotypes for seedling salinity tolerance. Front. Plant Sci. 2015, 6, 374. [Google Scholar] [CrossRef] [Green Version]
- Chunthaburee, S.; Dongsansuk, A.; Sanitchon, J.; Pattanagul, W.; Theerakulpisut, P. Physiological and biochemical parameters for evaluation and clustering of rice cultivars differing in salt tolerance at seedling stage. Saudi J. Biol. Sci. 2016, 23, 467–477. [Google Scholar] [CrossRef] [PubMed] [Green Version]
- Haque, T.; Elias, S.M.; Razzaque, S.; Biswas, S.; Khan, S.F.; Azad Jewel, G.M.N.; Rahman, M.S.; Juenger, T.E.; Seraj, Z.I. Salt tolerance QTLs of an endemic rice landrace, Horkuch at seedling and reproductive stages. Sci. Rep. 2022, 12, 17306. [Google Scholar] [CrossRef] [PubMed]
- Puram, V.R.R.; Ontoy, J.; Subudhi, P.K. Identification of QTLs for salt tolerance traits and prebreeding lines with enhanced salt tolerance in an introgression line population of rice. Plant Mol. Biol. Rep. 2018, 36, 695–709. [Google Scholar] [CrossRef]
- Rahman, M.A.; Bimpong, I.K.; Bizimana, J.B.; Pascual, E.D.; Arceta, M.; Swamy, B.P.M.; Diaw, F.; Rahman, M.S.; Singh, R.K. Mapping QTLs using a novel source of salinity tolerance from Hasawi and their interaction with environments in rice. Rice 2017, 10, 47. [Google Scholar] [CrossRef] [Green Version]
- Lu, H.; Redus, M.A.; Coburn, J.R.; Rutger, N.; McCouch, S.R.; Tai, T.H. Population structure and breeding patterns of 145 U.S. rice cultivars based on SSR marker analysis. Crop Sci. 2005, 45, 66–76. [Google Scholar] [CrossRef] [Green Version]
- Shi, D.; Sheng, Y. Effect of various salt-alkaline mixed stress conditions on sunflower seedlings and analysis of their stress factors. Environ. Exp. Bot. 2005, 54, 8–21. [Google Scholar] [CrossRef]
- Gao, P.; Bai, X.; Yang, L.; Lv, D.; Pan, X.; Li, Y.; Cai, H.; Ji, W.; Chen, Q.; Zhu, Y. Osa-MIR393: A salinity- and alkaline stress-related microRNA gene. Mol. Biol. Rep. 2011, 38, 237–242. [Google Scholar] [CrossRef]
- Wang, N.; Fan, X.; Lin, Y.; Li, Z.; Wang, Y.; Zhou, Y.; Meng, W.; Peng, Z.; Zhang, C.; Ma, J. Alkaline stress induces different physiological, hormonal and gene expression responses in diploid and autotetraploid rice. Int. J. Mol. Sci. 2022, 23, 5561. [Google Scholar] [CrossRef]
- Hu, H.; Xiong, L. Genetic engineering and breeding of drought-resistant crops. Ann. Rev. Plant Biol. 2014, 65, 715–741. [Google Scholar] [CrossRef]
- Sahni, S.; Prasad, B.D.; Liu, Q.; Grbic, V.; Sharpe, A.; Singh, S.P.; Krishna, P. Overexpression of the brassinosteroid biosynthetic gene DWF4 in Brassica napus simultaneously increases seed yield and stress tolerance. Sci. Rep. 2016, 6, 28298. [Google Scholar] [CrossRef] [PubMed] [Green Version]
- Wang, F.; Zhu, H.; Chen, D.; Li, Z.; Peng, R.; Yao, Q. A grape bHLH transcription factor gene, VvbHLH1, increases the accumulation of flavonoids and enhances salt and drought tolerance in transgenic Arabidopsis thaliana. Plant Cell Tissue Organ Cult. 2016, 125, 387–398. [Google Scholar] [CrossRef]
- Wang, R.; Jing, W.; Xiao, L.; Jin, Y.; Shen, L.; Zhang, W. The rice high-affinity potassium transporter1;1 is involved in salt tolerance and regulated by an MYB-type transcription factor. Plant Physiol. 2015, 168, 1076–1090. [Google Scholar] [CrossRef] [Green Version]
- Khan, I.; Mohamed, S.; Regnault, T.; Mieulet, D.; Guiderdoni, E.; Sentenac, H.; Véry, A.A. Constitutive contribution by the rice OsHKT1;4 Na+ transporter to xylem sap desalinization and low Na+ accumulation in young leaves under low as high external Na+ conditions. Front. Plant Sci. 2020, 11, 1130. [Google Scholar] [CrossRef] [PubMed]
- Gupta, M.; Qiu, X.; Wang, L.; Xie, W.; Zhang, C.; Xiong, L.; Lian, X.; Zhang, Q. KT/HAK/KUP potassium transporters gene family and their whole-life cycle expression profile in rice (Oryza sativa). Mol. Genet. Genom. 2008, 280, 437–452. [Google Scholar] [CrossRef]
- Cotsaftis, O.; Plett, D.; Shirley, N.; Tester, M.; Hrmova, M. A two-staged model of Na+ exclusion in rice explained by 3D modeling of HKT transporters and alternative splicing. PLoS ONE 2012, 7, e39865. [Google Scholar] [CrossRef] [PubMed] [Green Version]
- Mishra, S.; Singh, B.; Panda, K.; Singh, B.P.; Singh, N.; Misra, P.; Rai, V.; Singh, N.K. Association of SNP haplotypes of HKT family genes with salt tolerance in Indian wild rice germplasm. Rice 2016, 9, 15. [Google Scholar] [CrossRef] [Green Version]
- Shohan, M.U.S.; Sinha, S.; Nabila, F.H.; Dastidar, S.G.; Seraj, Z.I. HKT1;5 transporter gene expression and association of amino acid substitutions with salt tolerance across rice genotypes. Front. Plant Sci. 2019, 10, 1420. [Google Scholar] [CrossRef] [Green Version]
- Liu, W.; Tai, H.; Li, S.; Gao, W.; Zhao, M.; Xie, C.; Li, W.-X. bHLH122 is important for drought and osmotic stress resistance in Arabidopsis and in the repression of ABA catabolism. New Phytol. 2014, 201, 1192–1204. [Google Scholar] [CrossRef]
- Huang, X.; Li, K.; Jin, C.; Zhang, S. ICE1 of Pyrus ussuriensis functions in cold tolerance by enhancing PuDREBa transcriptional levels through interacting with PuHHP1. Sci. Rep. 2015, 5, 17620. [Google Scholar] [CrossRef] [Green Version]
- Wang, H.; Wang, H.; Shao, H.; Tang, X. Recent advances in utilizing transcription factors to improve plant abiotic stress tolerance by transgenic technology. Front. Plant Sci. 2016, 7, 67. [Google Scholar] [CrossRef] [PubMed] [Green Version]
- Man, L.; Xiang, D.; Wang, L.; Zhang, W.; Wang, X.; Qi, G. Stress-responsive gene RsICE1 from Raphanus sativus increases cold tolerance in rice. Protoplasma 2017, 254, 945–956. [Google Scholar] [CrossRef] [PubMed]
- Huang, W.; Ma, X.; Wang, Q.; Gao, Y.; Xue, Y.; Niu, X.; Yu, G.; Liu, Y.S. Significant improvement of stress tolerance in tobacco plants by overexpressing a stress-responsive aldehyde dehydrogenase gene from maize (Zea mays). Plant Mol. Biol. 2008, 68, 451–463. [Google Scholar] [CrossRef] [PubMed] [Green Version]
- Yan, Y.S.; Chen, X.Y.; Yang, K.; Sun, Z.X.; Fu, Y.P.; Zhang, Y.M.; Fang, R.X. Overexpression of an F-box protein gene reduces abiotic stress tolerance and promotes root growth in rice. Mol. Plant 2011, 4, 190–197. [Google Scholar] [CrossRef] [PubMed] [Green Version]
- Li, D.; Zhang, H.; Hong, Y.; Huang, L.; Li, X.; Zhang, Y.; Ouyang, Z.; Song, F. Genome-wide identification, biochemical characterization, and expression analyses of the YTH domain-containing RNA-binding protein family in Arabidopsis and rice. Plant Mol. Biol. Rep. 2014, 32, 1169–1186. [Google Scholar] [CrossRef]
- Dametto, A.; Buffon, G.; Dos Reis Blasi, E.A.; Sperotto, R.A. Ubiquitination pathway as a target to develop abiotic stress tolerance in rice. Plant Signal. Behav. 2015, 10, e1057369. [Google Scholar] [CrossRef] [PubMed] [Green Version]
- Razzaque, S.; Elias, S.M.; Haque, T.; Biswas, S.; Jewel, N.A.; Rahman, S.; Weng, X.; Ismail, A.M.; Walia, H.; Juenger, T.E.; et al. Gene expression analysis associated with salt stress in a reciprocally crossed rice population. Sci. Rep. 2019, 9, 8249. [Google Scholar] [CrossRef] [Green Version]
- Gautam, R.; Meena, R.K.; Woch, N.; Kirti, P. Ectopic expression of BrALDH7B2 gene encoding an antiquitin from Brassica rapa confers tolerance to abiotic stresses and improves photosynthetic performance under salt stress in tobacco. Environ. Exp. Bot. 2020, 180, 104223. [Google Scholar] [CrossRef]
- Lin, R.; Zheng, J.; Pu, L.; Wang, Z.; Mei, Q.; Zhang, M.; Jian, S. Genome-wide identification and expression analysis of aquaporin family in Canavalia rosea and their roles in the adaptation to saline-alkaline soils and drought stress. BMC Plant Biol. 2021, 21, 333. [Google Scholar] [CrossRef]
- Shim, J.S.; Park, S.H.; Lee, D.K.; Kim, Y.S.; Park, S.C.; Redillas, M.R.; Seo, J.S.; Kim, J.K. The rice GLYCINE-RICH PROTEIN 3 confers drought tolerance by regulating mRNA stability of ROS scavenging-related genes. Rice 2021, 14, 31. [Google Scholar] [CrossRef]
- Katiyar, A.; Smita, S.; Lenka, S.K.; Rajwanshi, R.; Chinnusamy, V.; Bansal, K.C. Genome-wide classification and expression analysis of MYB transcription factor families in rice and Arabidopsis. BMC Genom. 2012, 13, 544. [Google Scholar] [CrossRef] [PubMed] [Green Version]
- De Leon, T.B.; Linscombe, S.; Subudhi, P.K. Molecular dissection of seedling salinity tolerance in rice (Oryza sativa L.) using a high-density GBS-based SNP linkage map. Rice 2016, 9, 52. [Google Scholar] [CrossRef] [PubMed] [Green Version]
- Bhattarai, U.; Subudhi, P.K. Genetic analysis of yield and agronomic traits under reproductive-stage drought stress in rice using a high-resolution linkage map. Gene 2018, 669, 69–76. [Google Scholar] [CrossRef] [PubMed]
- Spielmeyer, W.; Ellis, M.H.; Chandler, P.M. Semidwarf (sd-1), “green revolution” rice, contains a defective gibberellin 20-oxidase gene. Proc. Natl. Acad. Sci. USA 2002, 99, 9043–9048. [Google Scholar] [CrossRef] [Green Version]
- Kim, J.M.; Sasaki, T.; Ueda, M.; Sako, K.; Seki, M. Chromatin changes in response to drought, salinity, heat, and cold stresses in plants. Front. Plant Sci. 2015, 6, 114. [Google Scholar] [CrossRef] [Green Version]
- Singroha, G.; Kumar, S.; Gupta, O.P.; Singh, G.P.; Sharma, P. Uncovering the epigenetic marks involved in mediating salt stress tolerance in plants. Front. Genet. 2022, 13, 811732. [Google Scholar] [CrossRef]
- Wang, T.; Chen, Y.; Zhang, M.; Chen, J.; Liu, J.; Han, H.; Hua, X. Arabidopsis AMINO ACID PERMEASE1 contributes to salt stress-induced proline uptake from exogenous sources. Front. Plant Sci. 2017, 8, 2182. [Google Scholar] [CrossRef] [Green Version]
- Rai, A.; Singh, R.; Shirke, P.A.; Tripathi, R.D.; Trivedi, P.K.; Chakrabarty, D. Expression of rice CYP450-like gene (Os08g01480) in Arabidopsis modulates regulatory network leading to heavy metal and other abiotic stress tolerance. PLoS ONE 2015, 10, e0138574. [Google Scholar] [CrossRef]
- Pandian, B.A.; Sathishraj, R.; Djanaguiraman, M.; Prasad, P.V.V.; Jugulam, M. Role of cytochrome P450 enzymes in plant stress response. Antioxidants 2020, 9, 454. [Google Scholar] [CrossRef]
- Han, G.; Lu, C.; Guo, J.; Qiao, Z.; Sui, N.; Qiu, N.; Wang, B. C2H2 Zinc finger proteins: Master regulators of abiotic stress responses in plants. Front. Plant Sci. 2020, 11, 115. [Google Scholar] [CrossRef] [Green Version]
- Meng, B.; Wang, T.; Luo, Y.; Guo, Y.; Xu, D.; Liu, C.; Zou, J.; Li, L.; Diao, Y.; Gao, Z.; et al. Identification and allele combination analysis of rice grain shape-related genes by genome-wide association study. Int. J. Mol. Sci. 2022, 23, 1065. [Google Scholar] [CrossRef] [PubMed]
- Alam, M.N.U.; Jewel, G.A.; Azim, T.; Seraj, Z.I. Novel QTLs for salinity tolerance revealed by genome-wide association studies of biomass, chlorophyll and tissue ion content in 176 rice landraces from Bangladesh. PLoS ONE 2021, 16, e0259456. [Google Scholar] [CrossRef]
- Descalsota, G.I.L.; Swamy, B.P.M.; Zaw, H.; Inabangan-Asilo, M.A.; Amparado, A.; Mauleon, R.; Chadha-Mohanty, P.; Arocena, E.C.; Raghavan, C.; Leung, H.; et al. Genome-wide association mapping in a rice MAGIC plus population detects QTLs and genes useful for biofortification. Front. Plant Sci. 2018, 9, 1347. [Google Scholar] [CrossRef]
- Alkahtani, J. Genome-wide association study of grain quality traits in rice detected genomic regions of high-quality rice for increasing rice consumption. Biosci. Biotechnol. Res. Asia 2022, 19, 333–346. [Google Scholar] [CrossRef]
- Jones, J.B.; Case, V.W. Sampling, handling, and analyzing plant tissue samples. In Soil Testing and Plant Analysis, 3rd ed.; Book Series No. 3; Westerman, R.L., Ed.; Soil Science Society of America: Madison, WI, USA, 1990; pp. 389–427. [Google Scholar]
- SAS Institute Inc. SAS®9.4 System Options: Reference, 2nd ed.; SAS Institute Inc.: Cary, NC, USA, 2012; p. 69. [Google Scholar]
- R Foundation. R: A Language and Environment for Statistical Computing; Reference Index Version 2.2.1; R Foundation: Vienna, Austria, 2005; Volume 68. [Google Scholar]
- Holland, J.B.; Nyquist, W.E.; Cervantes-Martínez, C.T. Estimating and interpreting heritability for plant breeding: An update. Plant Breed. Rev. 2003, 22, 9–111. [Google Scholar]
- Money, D.; Gardner, K.; Migicovsky, Z.; Schwaninger, H.; Zhong, G.Y.; Myles, S. LinkImpute: Fast and accurate genotype imputation for nonmodel organisms. G3 2015, 5, 2383–2390. [Google Scholar] [CrossRef] [PubMed] [Green Version]
- Pritchard, J.K.; Stephens, M.; Donnelly, P. Inference of population structure using multilocus genotype data. Genetics 2000, 155, 945–959. [Google Scholar] [CrossRef]
- Evanno, G.; Regnaut, S.; Goudet, J. Detecting the number of clusters of individuals using the software STRUCTURE: A simulation study. Mol. Ecol. 2005, 14, 2611–2620. [Google Scholar] [CrossRef] [Green Version]
- Bradbury, P.J.; Zhang, Z.; Kroon, D.E.; Casstevens, T.M.; Ramdoss, Y.; Buckler, E.S. TASSEL: Software for association mapping of complex traits in diverse samples. Bioinformatics 2007, 23, 2633–2635. [Google Scholar] [CrossRef] [Green Version]
- Hill, W.G.; Weir, B.S. Variances and covariance of squared linkage disequilibria in finite populations. Theor. Popul. Biol. 1988, 33, 54–78. [Google Scholar] [CrossRef]
- Price, A.; Patterson, N.; Plenge, R.; Weinblatt, M.E.; Shadick, N.A.; Reich, D. Principal components analysis corrects for stratification in genome-wide association studies. Nat. Genet. 2006, 38, 904–909. [Google Scholar] [CrossRef]
- Larsson, S.J.; Lipka, A.E.; Buckler, E.S. Lessons from Dwarf8 on the strengths and weaknesses of structured association mapping. PLoS Genet. 2013, 9, e1003246. [Google Scholar] [CrossRef] [PubMed] [Green Version]
- Yu, J.; Pressoir, G.; Briggs, W.; Bi, I.V.; Yamasaki, M.; Doebley, J.F.; McMullen, M.D.; Gaut, B.S.; Nielsen, D.M.; Holland, J.B.; et al. A unified mixed-model method for association mapping that accounts for multiple levels of relatedness. Nat. Genet. 2006, 38, 203–208. [Google Scholar] [CrossRef] [PubMed]
- Liu, X.; Huang, M.; Fan, B.; Buckler, E.S.; Zhang, Z. Iterative usage of fixed and random effect models for powerful and efficient genome-wide association studies. PLoS Genet. 2016, 12, e1005767. [Google Scholar] [CrossRef]
- Subudhi, P.K.; Garcia, R.S.; Coronejo, S.; Tapia, R. Comparative transcriptional profiling of root tissues in two rice genotypes reveals differential expressed genes associated with root architecture under nitrogen stress. Int. J. Mol. Sci. 2020, 21, 5759. [Google Scholar] [CrossRef] [PubMed]
- Livak, K.J.; Schmittgen, T.D. Analysis of relative gene expression data using real-time quantitative PCR and the 2−ΔΔCT method. Methods 2001, 25, 402–408. [Google Scholar] [CrossRef] [PubMed]
Figure 1.
Variation in alkalinity tolerance among the rice genotypes based on alkalinity tolerance score (AKT) at the seedling stage.
Figure 1.
Variation in alkalinity tolerance among the rice genotypes based on alkalinity tolerance score (AKT) at the seedling stage.
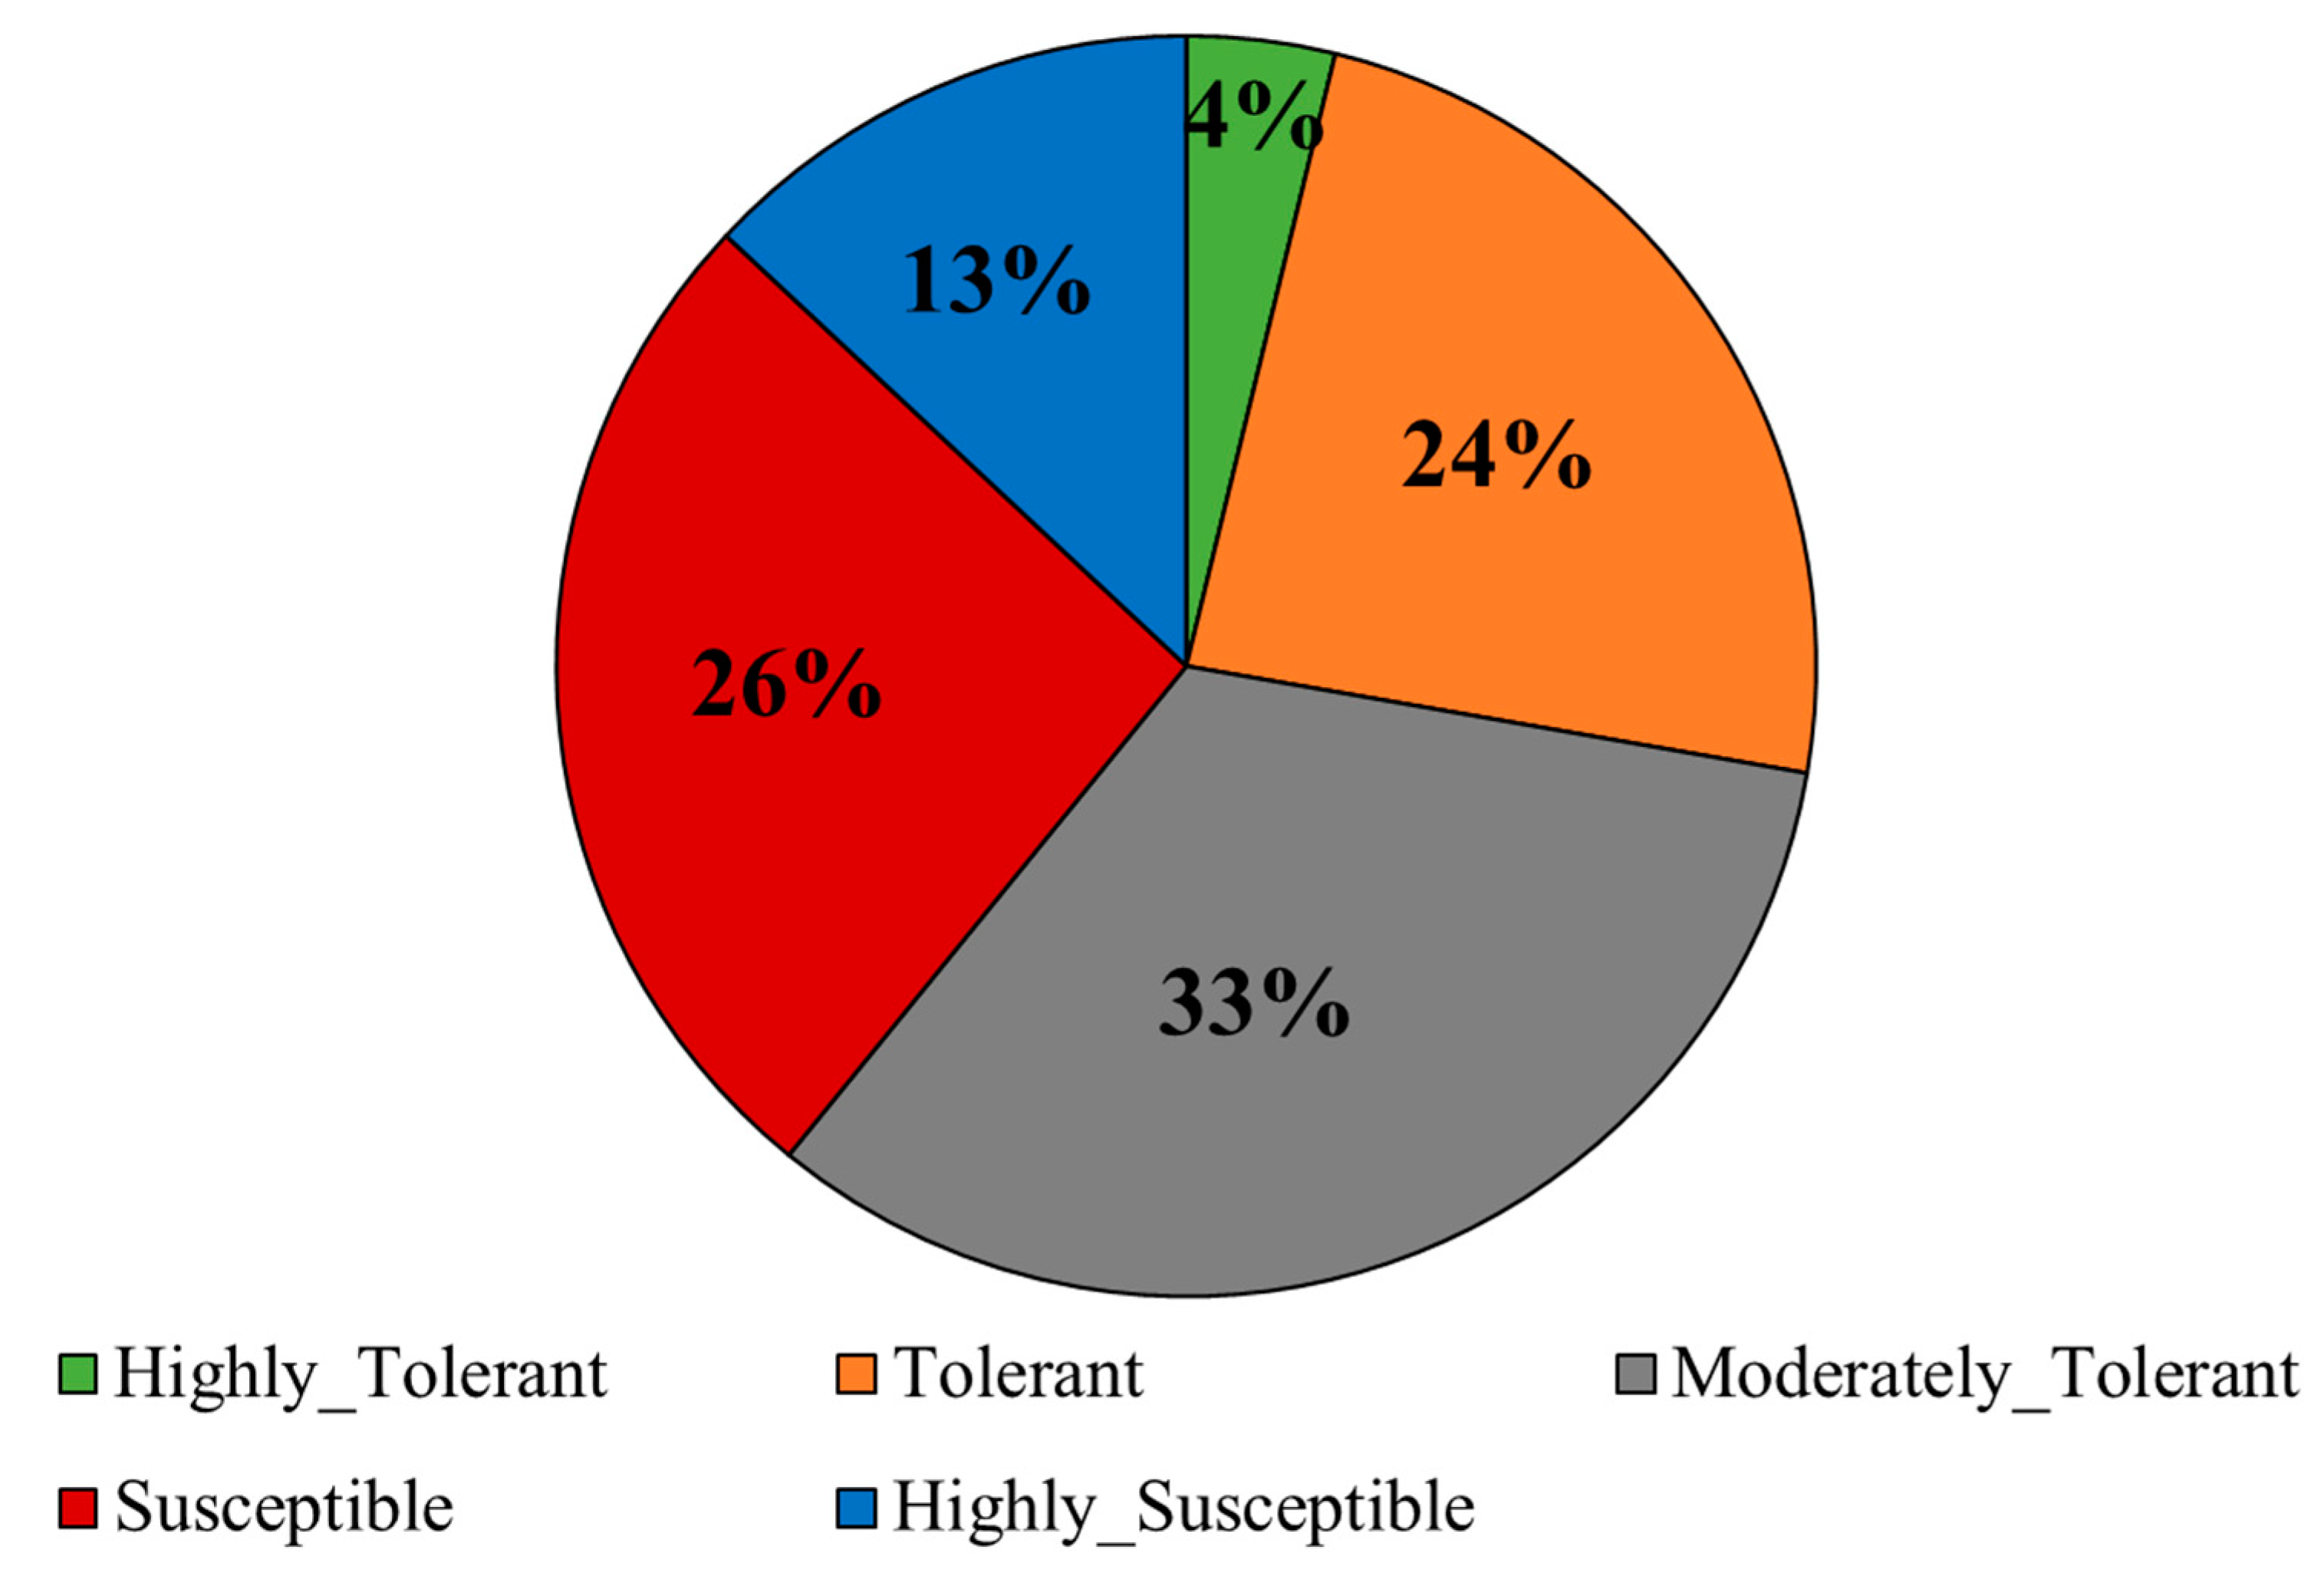
Figure 2.
Performance of some of the lines (known salt-tolerance level) after 21 days of alkaline stress at the seedling stage. The scale represents the alkalinity tolerance score (AKT) after the stress on a scale of 1 (highly tolerant) to 9 (highly susceptible).
Figure 2.
Performance of some of the lines (known salt-tolerance level) after 21 days of alkaline stress at the seedling stage. The scale represents the alkalinity tolerance score (AKT) after the stress on a scale of 1 (highly tolerant) to 9 (highly susceptible).
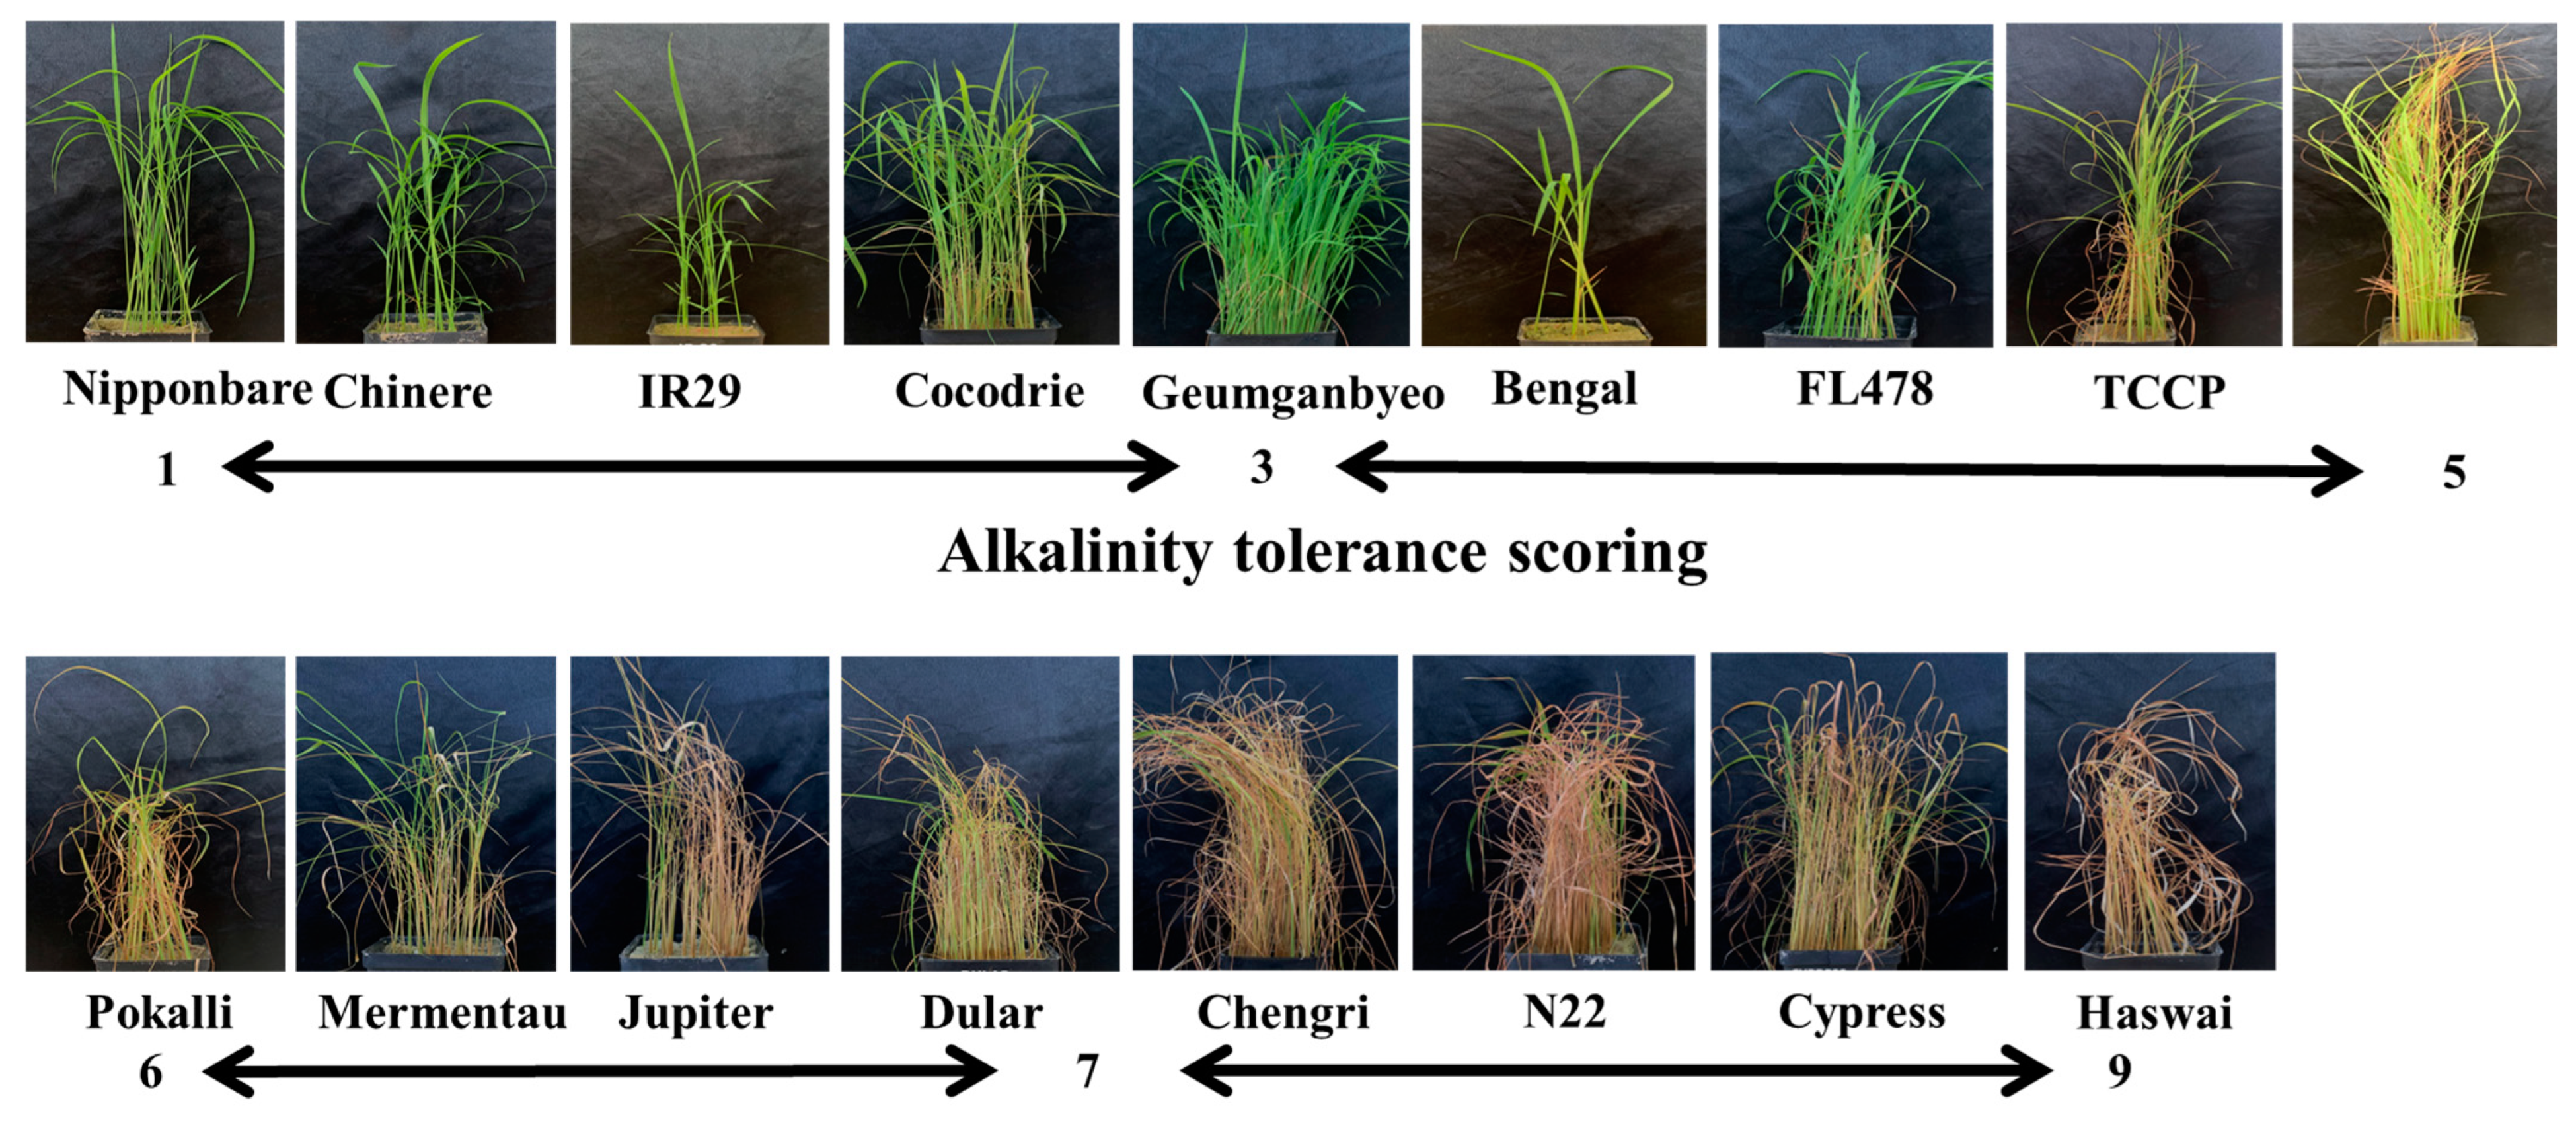
Figure 3.
Frequency distribution of nine morphological and physiological traits under alkaline stress. AKT, alkalinity tolerance score; SHL, shoot length; RTL, root length; RSR, root-to-shoot ratio; inv_FW, inverse fresh weight; log_DW, log dry weight; SNC, shoot Na+ concentration; SKC, shoot K+ concentration; SNK, shoot Na+:K+ concentration.

Figure 4.
Principal component analysis (PCA) plot. (a) Grouping of variables associated with nine morphological and physiological traits of rice genotypes under alkalinity stress at the seedling stage, (b) Scatter plot of the indica and japonica rice genotypes represented in the two major principal component axes. No sufficient clustering was observed between indica and japonica genotypes. AKT, alkalinity tolerance score; CHL, chlorophyll content (SPAD units); SHL, shoot length (cm); RTL, root length (cm); log_DW, log dry weight (gm); inv_FW, inverse fresh weight (gm); SNC, Shoot Na+ concentration (mmol/kg); SKC, shoot K+ concentration (mmol/kg); SNK, shoot Na+:K+ ratio.

Figure 5.
Phenotypic clustering of rice genotypes by UPGMA based on Euclidean distance computed from nine morphological and physiological traits under alkalinity stress at the seedling stage.
Figure 5.
Phenotypic clustering of rice genotypes by UPGMA based on Euclidean distance computed from nine morphological and physiological traits under alkalinity stress at the seedling stage.
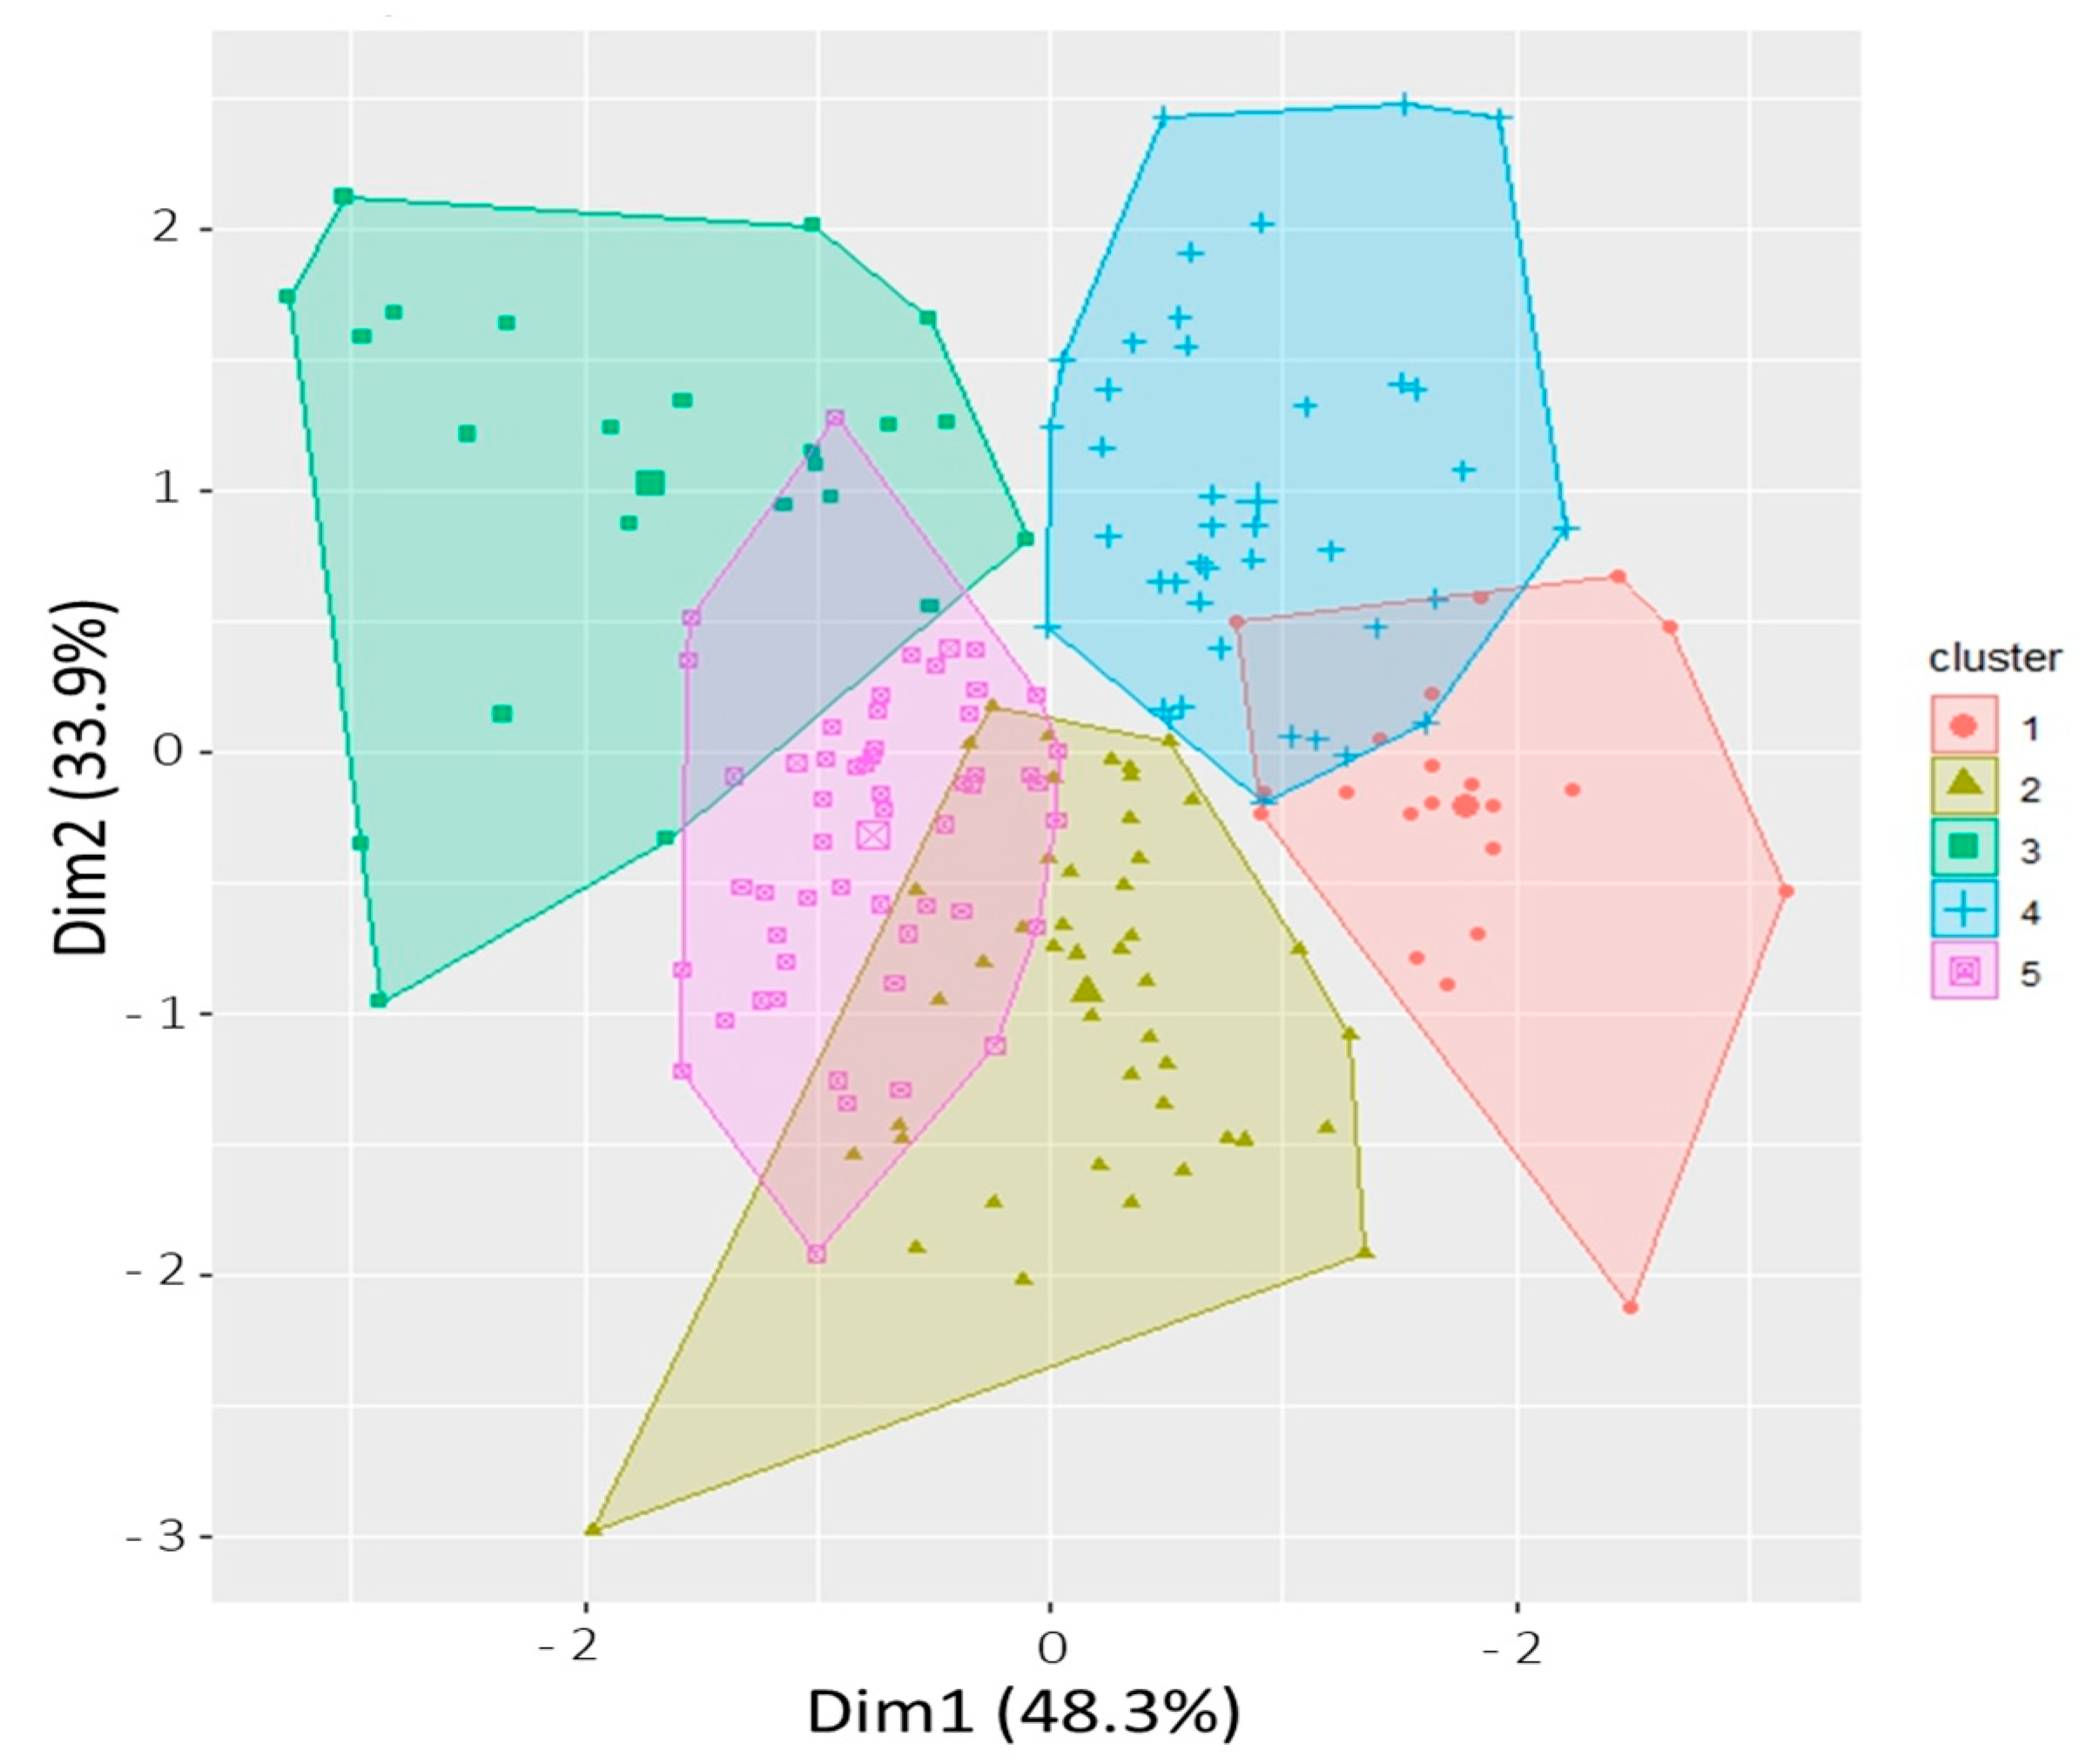
Figure 6.
Population structure analysis of rice genotypes. (a) identification of the optimum number of subpopulations using LnP(D) derived ΔK. The maximum value of ΔK was found to be at K = 5, suggesting a division of the entire population into five subpopulations. The X-axis shows the number of subgroups (K) and Y-axis shows rate change of log probability values (ΔK) with change in K (b) Assignment of rice genotypes into five subpopulations, with the X-axis and Y-axis representing genotypes and the proportion of genetic ancestry in the subgroup membership, respectively. The genotypes present in each subgroup are listed in Table S5.

Figure 7.
Genome-wide average linkage disequilibrium decay across all chromosomes. The X-axis and Y-axis represent the distance (bp) and LD, respectively. The intersection of green and blue lines indicates the derived threshold for LD due to linkage at respective distance (blue line) and LD (green line).
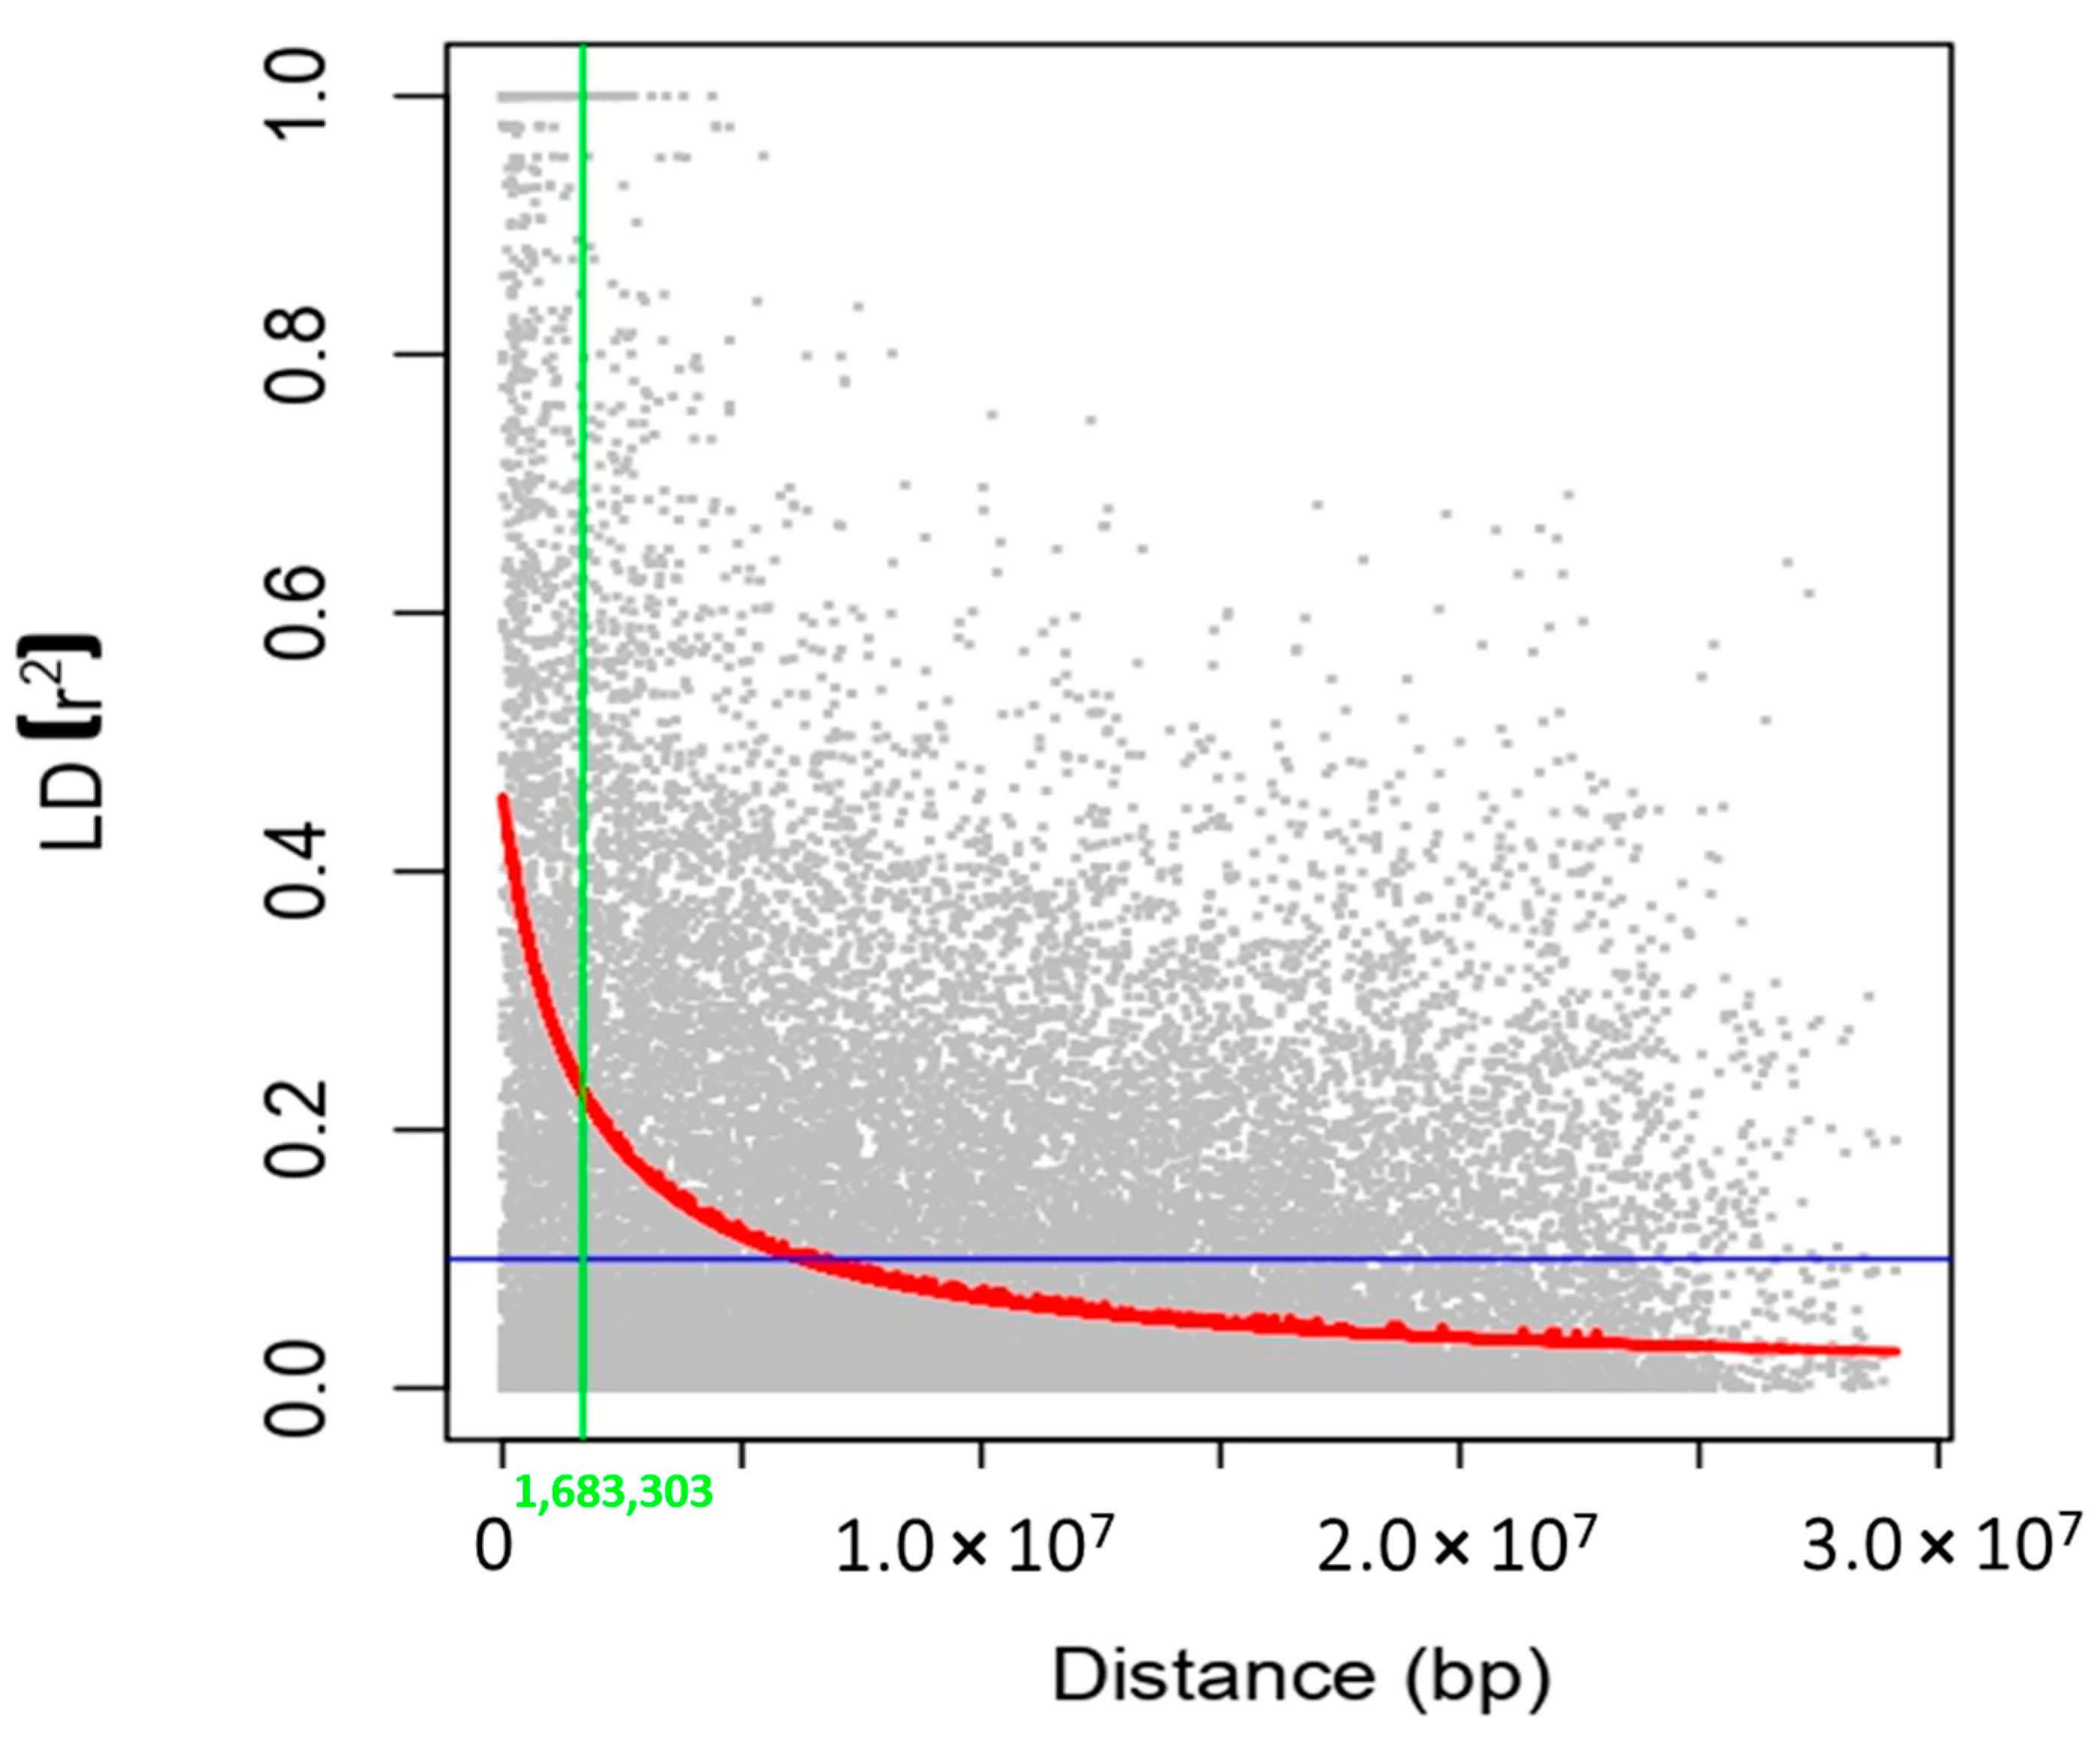
Figure 8.
Manhattan plots of the markers associated with alkalinity tolerance in rice. The X-axis shows markers along the 12 rice chromosomes and the Y-axis shows the negative log10- transformed p-values for each association. Red dotted lines indicate the significance threshold. AKT, alkalinity tolerance score; SHL, shoot length; RTL, root length; RSR, root-to-shoot ratio; inv_FW, inverse fresh weight; log_DW, log dry weight; SNC, shoot Na+ concentration; SKC, shoot K+ concentration; SNK, shoot Na+:K+ ratio.
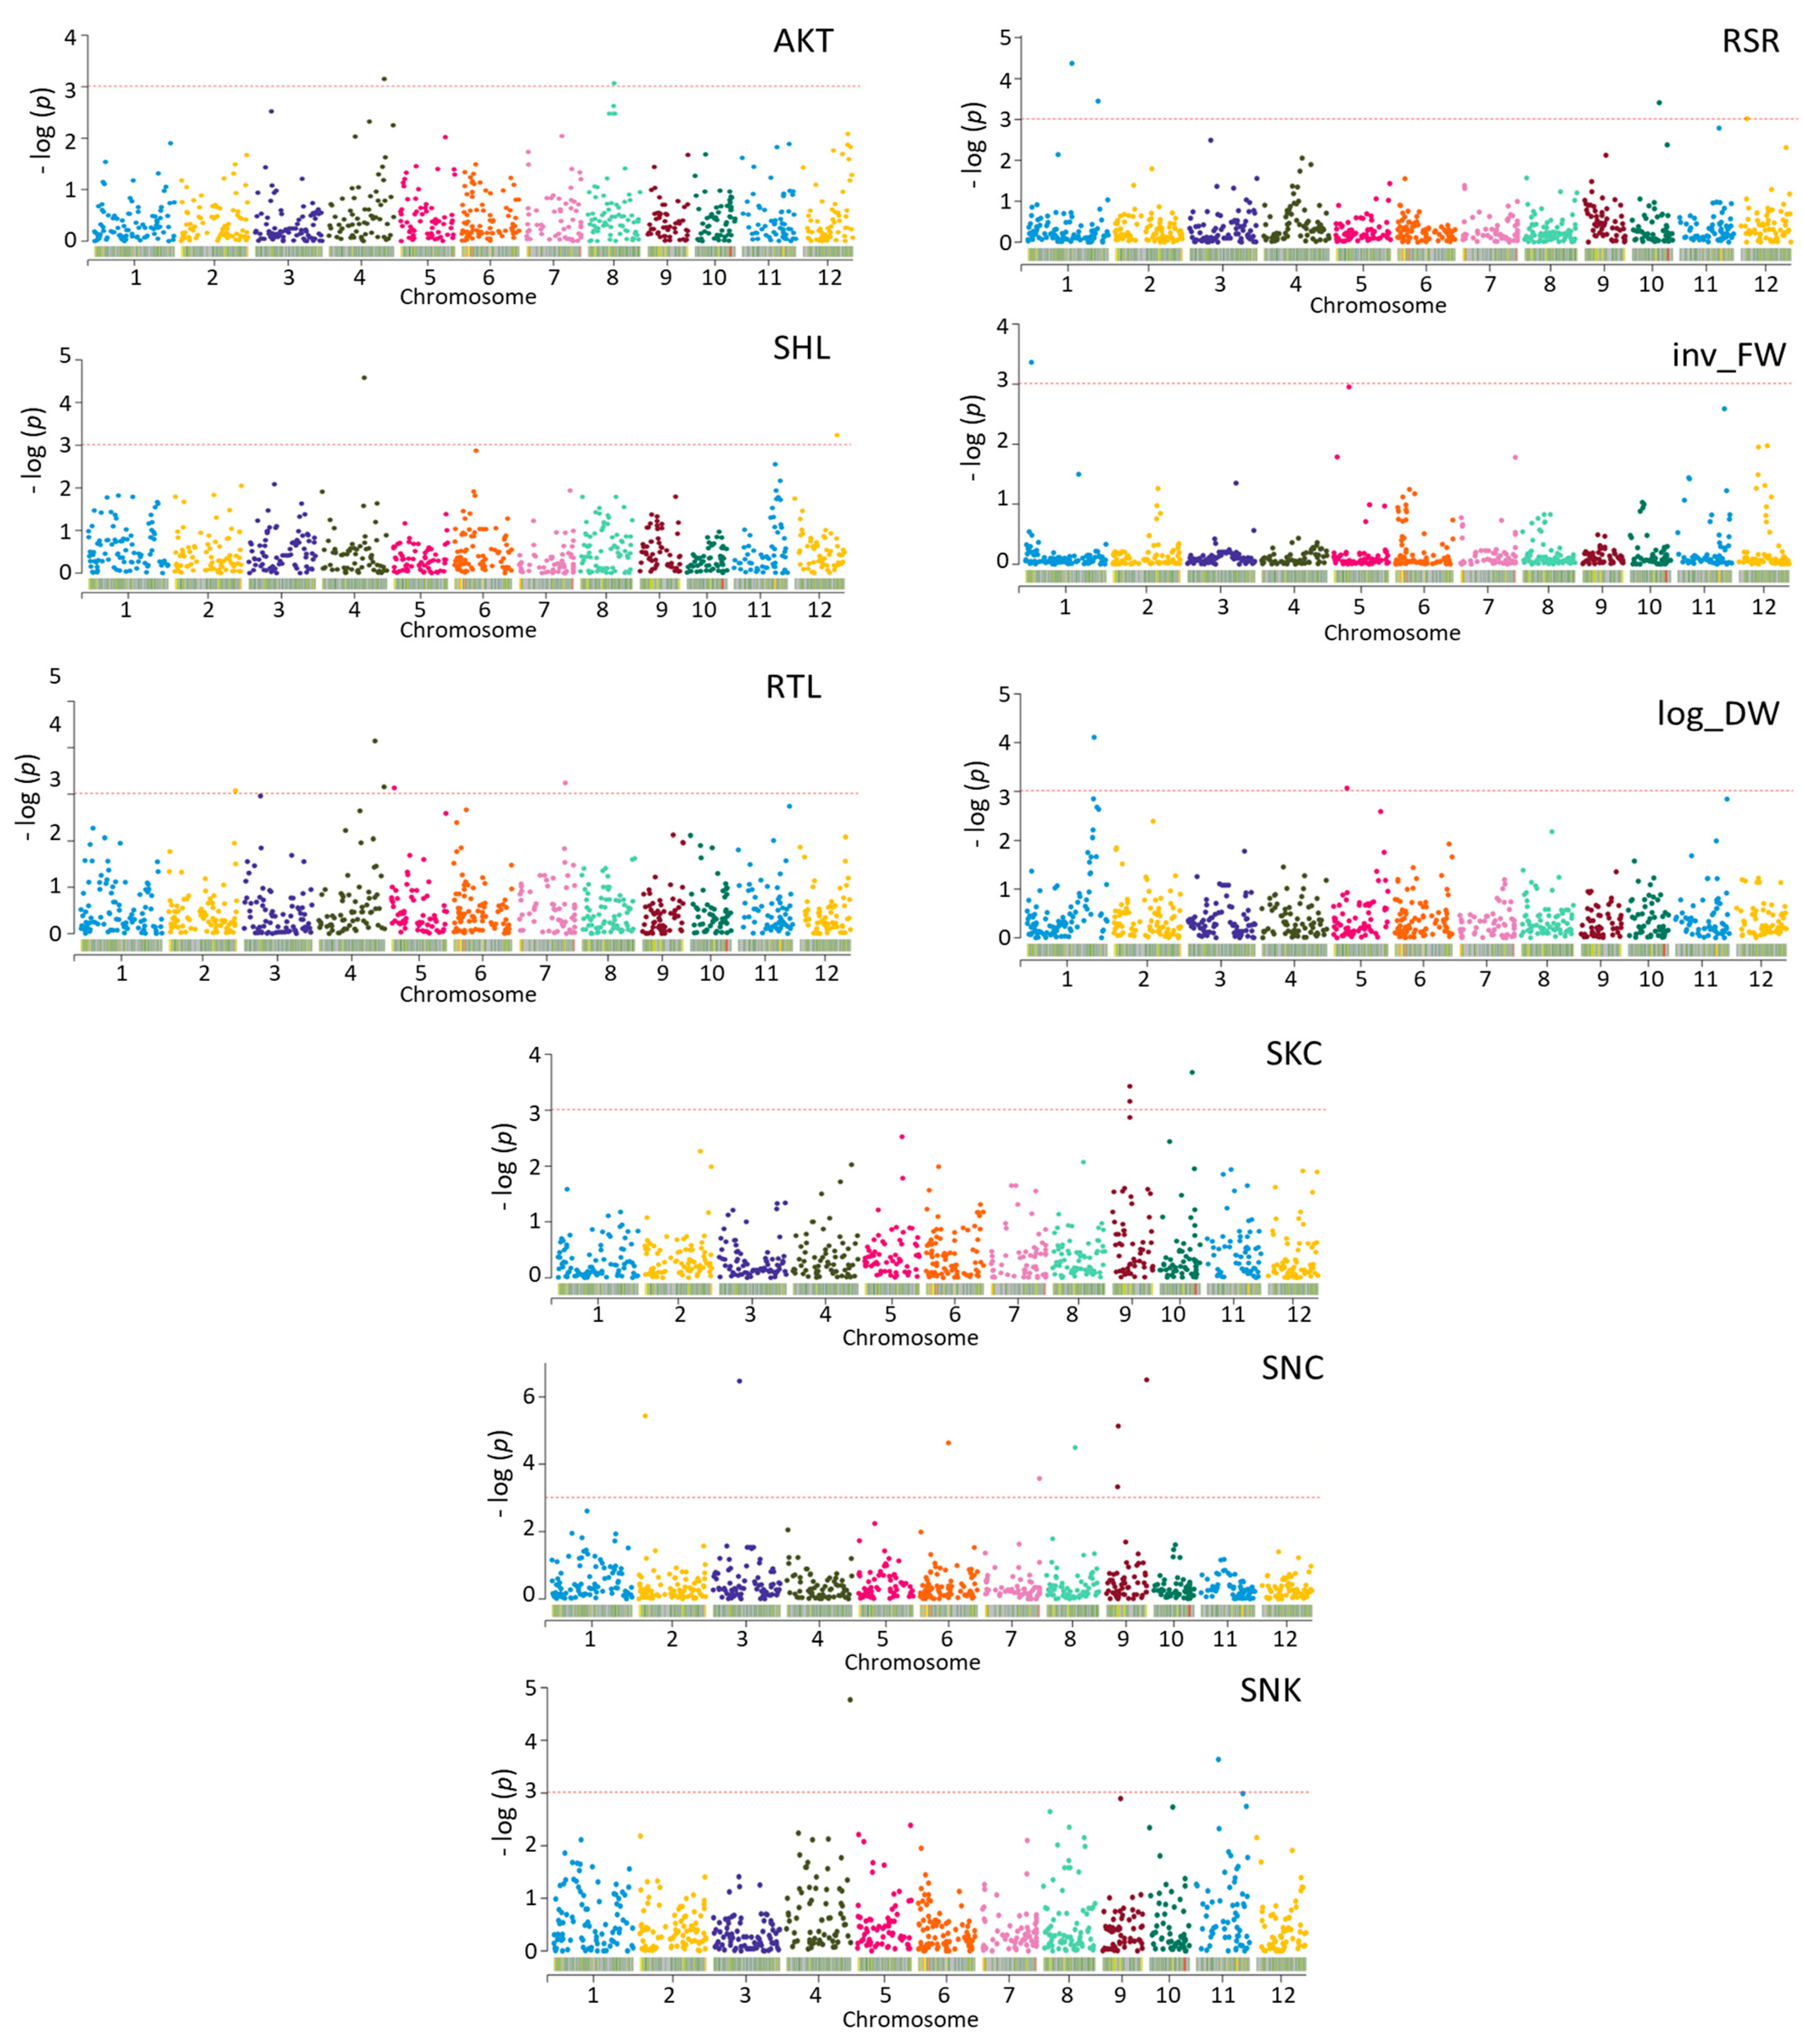
Figure 9.
Expression profiles of selected genes present under alkalinity stress (6 h after imposition of stress) in the tolerant and susceptible groups. Red and blue in the bars represent tolerant and susceptible groups, respectively. Genotypes included in the experiment were: 1—JN100; 2—Cheniere, 3—Cocodrie; 4—Nipponbare; 5—N22; 6—Dular; 7—Cypress; 8—Hasawi. EF1α was used as the reference gene and gene expressions were calculated as log2-fold changes under alkaline stress compared with control in all genotypes. LOC_Os04g50090—Helix–loop–helix DNA-binding protein; LOC_Os08g23440—amino acid permease family protein; LOC_Os09g32972—MYB protein; LOC_Os10g35230—Rf1, mitochondrial precursor; LOC_Os03g25480—cytochrome P450; LOC_Os08g25390—Bifunctional homoserine dehydrogenase; LOC_Os09g38340—ZOS9-17—C2H2 zinc finger protein, LOC_Os04g58160—Fiber protein Fb34, putative.

Table 1.
Phenotypic performance of rice genotypes under alkalinity stress at the seedling stage.
| Trait a | Min | Max | Mean | Standard Deviation | RIL Pr > Fc b | Heritability |
|---|---|---|---|---|---|---|
| AKT | 1.0 | 9.0 | 4.75 | 2.05 | 0.002 ** | 0.87 |
| SHL | 21.3 | 63.0 | 37.7 | 6.6 | 0.047 * | 0.64 |
| RTL | 7.0 | 22.7 | 16.4 | 3.2 | 0.029 * | 0.52 |
| RSR | 0.16 | 0.76 | 0.46 | 0.21 | 0.029 * | 0.69 |
| Inv_FW | 0.01 | 0.30 | 0.16 | 0.07 | 0.0003 ** | 0.61 |
| log_DW | −2.84 | −0.60 | −1.50 | 0.43 | 0.029 * | 0.53 |
| SNC | 661.6 | 3508.1 | 1730.1 | 440.3 | 0.032 * | 0.77 |
| SKC | 326.3 | 1077.9 | 657.7 | 138.3 | 0.048 * | 0.84 |
| SNK | 0.88 | 5.95 | 2.79 | 1.11 | 0.041 * | 0.81 |
a AKT, alkalinity tolerance score; SHL, shoot length; RTL, root length; RSR, root-to-shoot ratio; inv_FW, inverse fresh weight; log_DW, log dry weight; SNC, shoot Na+ concentration; SKC, shoot K+ concentration; SNK, shoot Na+:K+ ratio. b Genotypic difference among lines; *, ** significant differences between the means of genotypes at 0.05 and 0.01 level of probability, respectively; Fc—Analysis of variance test.
Table 2.
Pearson correlation coefficients between morphological and physiological traits in rice genotypes under alkalinity stress.
Table 2.
Pearson correlation coefficients between morphological and physiological traits in rice genotypes under alkalinity stress.
| Trait a | AKT | SHL | RTL | RSR | Inv_FW | log_DW | SNC | SKC | SNK |
|---|---|---|---|---|---|---|---|---|---|
| AKT | 1.000 | ||||||||
| SHL | −0.123 * | 1.000 | |||||||
| RTL | −0.147 * | 0.02 | 1.000 | ||||||
| RSR | −0.154 * | −0.757 ** | −0.533 ** | 1.000 | |||||
| Inv_FW | −0.909 ** | 0.127 * | 0.174 * | −0.173 * | 1.000 | ||||
| log_DW | −0.954 ** | 0.139 * | 0.170 * | −0.181 * | 0.961 ** | 1.000 | |||
| SNC | 0.467 ** | −0.028 | −0.074 | −0.027 | −0.36 ** | −0.423 ** | 1.000 | ||
| SKC | −0.053 * | 0.004 | 0.009 | 0.002 | 0.155 * | 0.094 | −0.87 ** | 1.000 | |
| SNK | 0.321 ** | −0.028 | −0.002 | −0.015 | −0.18 ** | −0.258 ** | 0.742 ** | −0.674 ** | 1.000 |
a KT, alkalinity tolerance score; CHL, chlorophyll content; SHL, shoot length; RTL, root length; RSR, root-to-shoot ratio; inv_FW, inverse shoot fresh weight; log_DW, log shoot dry weight; SNC, shoot Na+ concentration; SKC, shoot K+ concentration; SNK, shoot Na+:K+ ratio. * Significant at 0.05 level of probability; ** Significant at 0.01 level of probability.
Table 3.
Classification of rice genotypes based on various morphological and physiological traits under alkalinity stress.
Table 3.
Classification of rice genotypes based on various morphological and physiological traits under alkalinity stress.
| Clusters | Genotypes |
|---|---|
| Cluster 1 (Highly Susceptible) | Hasawi, Roy J, Djogolan, Dular, Cypress, Vegold, ChN1264, Toro-2, Belle Patna, N22, Magnolia, Glutinous Zenith, Jazzman-2, Toro, Chengri, Azucena, Chambal, Bluebonnet, Orion, Adair, Pratao Tipo Guedes, Dholamon 560, Hill medium, KN-1-B-361-1-8-67 |
| Cluster 2 (Tolerant) | PSBRC-50, CL111, Caloro, Cheriviruppu, CL131, Trenasse, Pirogue, LA0802140, Jupiter, LA0702085, Rexona, FL478, Geumgangbyeo, Neptune, CL261, FL318, Caffey, Lacassine, CLPK873, Cocodrie, Lacrosse, Sunbonnet, Lafitte, Dellmati, Carolina Gold, Bengal, Century Patna, CL152, Nato, MS-1996-9, Glutinous Selection, Saturn Rogue, Langmanbi, Milagrosa, Zhenshan 97, R-50, Mars, Kasalath, Sarioo50, IR 8, M202, Zenith, IR 64, Arkansas Fortuna, Texmont, Kranti, TP 49, Millie, Kirak, Chung yuen, IRGC1244, Newrex, RD, IRGC32567, Kitaake, Brazos, M-204, Delitus, Italica Livorno, CT-329 |
| Cluster 3 (Highly Tolerant) | Saturn, Della, JN100, Moroberekan, JN349, Nipponbare, Mercury, BHA1115, IR 29, Dellrose, Lotus, Agami, Neches, Epagri, Cheniere, CSR11, Vandana, Gu Ze, IR 50, Panidhan II, Koshihikari, Teqing, Taichung 65, Daido, Lemont, Quilloa 66304, Dellmont, Kanchan, Swarna, W149, Perum karuppan, Taipe 309, Hayamasari |
| Cluster 4 (Moderately Tolerant) | LA110, CL142, Century Rogue, Pokkali, Pecos, Nona Bokra, Wells, Gold Zenith, Skybonnet, Tebonnet, Nira, Vista, TCCP, Templeton, Nova 66, IRRI147, Taggert, Bluebelle, Arang, Ecrevisse, Smooth Zenith, Damodar, Kalia, MS-1995-15, SLO16, Rexark, V20B, Ning Yang Keng, Stormproof, Starbonnet, B573-A4-20-6, R-27, Gold Nato, Naylamp, Azaurel, Melrose, Jinheung, Arkrose, Dixiebelle, Nerretto, PSRR-1, Bala, Co39, San Tou Thou, IR4432-52-6-4, Hill LongGrain, Bharathy, H4, IARI 5823, Early Prolific, Fatehpur 3, Prelude, WC10380 |
| Cluster 5 (Susceptible) | Pinkaeo, LAH10, Mermentau, Evangeline, CR5272, R609, Jes, Della-2, CL162, R-54, Radin Ebos 33, Kokubelle, LaGrue, Jackson |
Table 4.
Analysis of molecular variance (AMOVA) among the five subpopulations identified by ‘STRUCTURE’ software.
Table 4.
Analysis of molecular variance (AMOVA) among the five subpopulations identified by ‘STRUCTURE’ software.
| Source of Variation | DF a | Sum of Squares | Mean Sum of Squares | Variance (%) | p-Value b |
|---|---|---|---|---|---|
| Among population | 4 | 495.8 | 123.9 | 61 | <0.0001 |
| Within population | 163 | 1129.8 | 6.9 | 39 | <0.001 |
| Total | 167 | 1625.6 | 100 |
a Degrees of freedom; b Level of significance.
Table 5.
Analysis of genome-wide linkage disequilibrium (LD) decay used for GWAS in this study.
| Chr. | No. of SNPs | Chr. Size (bp) † | SNP Density (bp/SNP) | LD $ Distance (bp) | |
|---|---|---|---|---|---|
| 1 | 93 | 43,270,923 | 465,279 | 15,193,454 | |
| 2 | 81 | 35,937,250 | 443,670 | 13,604,743 | |
| 3 | 78 | 36,413,819 | 466,844 | 12,513,847 | |
| 4 | 66 | 35,502,694 | 537,920 | 11,534,383 | |
| 5 | 64 | 29,958,434 | 468,101 | 10,451,492 | |
| 6 | 85 | 31,248,787 | 367,633 | 11,193,100 | |
| 7 | 59 | 29,697,621 | 503,350 | 11,473,349 | |
| 8 | 72 | 28,443,022 | 395,042 | 9,654,739 | |
| 9 | 58 | 23,012,720 | 396,772 | 7,434,300 | |
| 10 | 54 | 23,207,287 | 429,765 | 7,334,850 | |
| 11 | 59 | 29,021,106 | 491,884 | 9,261,105 | |
| 12 | 62 | 27,531,856 | 444,063 | 8,644,012 | |
| Total | 830 | 373,245,519 | Mean | 450,861 | 10,691,115 |
† According to Kawahara et al., 2013; $ LD, Linkage disequilibrium.
Table 6.
Significant SNPs, associated genes, and co-localized QTLs or genes for alkalinity tolerance in this genome-wide association study.
Table 6.
Significant SNPs, associated genes, and co-localized QTLs or genes for alkalinity tolerance in this genome-wide association study.
| Trait a | SNP | Locus | Annotation | QTLs/Genes in Previous Studies |
|---|---|---|---|---|
| AKT | S04_29881066 | Os04g50090 | Helix–loop–helix DNA-binding protein | qSNK4-2 [12] |
| S08_14184612 | Os08g23440 | amino acid permease family protein | LOC_Os08g23440 [16] | |
| SHL | S04_22808095 | Os04g38340 | ER-Golgi intermediate-compartment protein 3 | qDLR4 [26] |
| S12_23066809 | Os12g37570 | protein kinase family protein | ||
| S12_23108164 | Os12g37640 | xaa-Pro aminopeptidase | ||
| RTL | S02_35216781 | Os02g58139 | OsSigP1-Type I Signal Peptidase homolog | |
| S04_29715617 | Os04g49850 | Expressed protein | qSNK4-2 [12] | |
| S04_34925111 | Os04g58730 | AT-hook-motif-domain-containing protein | qSNK4-2 [12] | |
| S05_1487229 | Os05g03510 | Expressed protein | ||
| S07_28409912 | Os07g47500 | Histone-arginine methyltransferase CARM1 | qRGR7 [25] | |
| RSR | S01_23656773 | Os01g41790 | Expressed protein | |
| S01_37680628 | Os01g64910 | Anthocyanidin 5,3-O-glucosyltransferase | ||
| S05_24090514 | Os05g41130 | OsFBX168-F-box-domain-containing protein | qRRN5 [25] | |
| S10_18098744 | Os10g35570 | Expressed protein | qSKC10.18 [2,7] | |
| S12_3544726 | Os12g07210 | Expressed protein | ||
| log_DW | S01_36150523 | Os01g62450 | Expressed protein | |
| S05_7195992 | Os05g12510 | Expressed protein | qDLRa5-3 [24] | |
| inv_FW | S01_3236648 | Os01g06820 | hcr2-0B, putative | |
| SKC | S09_19322095 | Os09g32350 | Expressed protein | qSNC9.19 [2] |
| S09_19683788 | Os09g32972 | MYB protein | qSNC9.19 [2] | |
| S10_18834021 | Os10g35230 | Rf1, mitochondrial precursor | qSKC10.18 [2,7] | |
| SNC | S02_3477202 | Os02g06890 | OTU-like cysteine protease family protein | |
| S03_14554651 | Os03g25480 | Cytochrome P450 | Os03g25480 [16] | |
| S06_15335573 | Os06g39580 | Hypothetical protein | qARL6 [38] | |
| S07_29627590 | Os07g49470 | Protein kinase APK1B, chloroplast precursor | ||
| S08_15439243 | Os08g25390 | Bifunctional homoserine dehydrogenase | Os08g25390 [16] | |
| S09_22076185 | Os09g38340 | ZOS9-17-C2H2 zinc finger protein | ||
| SNK | S04_34643455 | Os04g58160 | Fiber protein Fb34, putative | qSNK4-2 [12] |
a AKT, alkalinity tolerance score; SHL, shoot length; RTL, root length; RSR, root-to-shoot ratio; inv_FW, inverse fresh weight; log_DW, log dry weight; SNC, shoot Na+ concentration; SKC, shoot K+ concentration; SNK, shoot Na+:K+ ratio.
Table 7.
The mapped QTLs associated with alkalinity tolerance at the seedling stage in this genome-wide association study.
Table 7.
The mapped QTLs associated with alkalinity tolerance at the seedling stage in this genome-wide association study.
| Trait a | QTLs | Lead SNP | Position | p-Value | R2 (%) | QTLs in a Previous Study |
|---|---|---|---|---|---|---|
| SHL | qSHL12 | S12_23108164 | 23,108,164 | 0.00058 | 11 | - |
| log_DW | qlog_DW1 | S01_36150523 | 36,150,523 | 0.00008 | 14 | qSHL1.38 [2,7] |
| SNC | qSNC7 | S07_29627590 | 29,627,590 | 0.00027 | 11 | - |
| SKC | qSKC9 | S09_19322095 | 19,322,095 | 0.00037 | 22 | qSNC9.19 [2] |
| SKC | qSKC10 | S10_18834021 | 18,834,021 | 0.00021 | 18 | qSKC10.18 [2,7] |
| SNK | qSNK4 | S04_34643455 | 34,643,455 | 0.00002 | 16 | qSNK4-2 [12] |
a SHL, shoot length; log_DW, log dry weight; SNC, shoot Na+ concentration; SKC, shoot K+ concentration; SNK, shoot Na+:K+ ratio.
Disclaimer/Publisher’s Note: The statements, opinions and data contained in all publications are solely those of the individual author(s) and contributor(s) and not of MDPI and/or the editor(s). MDPI and/or the editor(s) disclaim responsibility for any injury to people or property resulting from any ideas, methods, instructions or products referred to in the content. |
© 2023 by the authors. Licensee MDPI, Basel, Switzerland. This article is an open access article distributed under the terms and conditions of the Creative Commons Attribution (CC BY) license (https://creativecommons.org/licenses/by/4.0/).
Share and Cite
MDPI and ACS Style
Singh, L.; Pruthi, R.; Chapagain, S.; Subudhi, P.K. Genome-Wide Association Study Identified Candidate Genes for Alkalinity Tolerance in Rice. Plants 2023, 12, 2206. https://doi.org/10.3390/plants12112206
AMA Style
Singh L, Pruthi R, Chapagain S, Subudhi PK. Genome-Wide Association Study Identified Candidate Genes for Alkalinity Tolerance in Rice. Plants. 2023; 12(11):2206. https://doi.org/10.3390/plants12112206
Chicago/Turabian StyleSingh, Lovepreet, Rajat Pruthi, Sandeep Chapagain, and Prasanta K. Subudhi. 2023. "Genome-Wide Association Study Identified Candidate Genes for Alkalinity Tolerance in Rice" Plants 12, no. 11: 2206. https://doi.org/10.3390/plants12112206
Note that from the first issue of 2016, this journal uses article numbers instead of page numbers. See further details here.