Article

Simulated Analysis of Influence of Changes in H+-ATPase Activity and Membrane CO2 Conductance on Parameters of Photosynthetic Assimilation in Leaves

Department of Biophysics, N.I. Lobachevsky State University of Nizhny Novgorod, Nizhny Novgorod 603950, Russia
*
Author to whom correspondence should be addressed.
Plants 2022, 11(24), 3435; https://doi.org/10.3390/plants11243435
Submission received: 20 November 2022 / Revised: 3 December 2022 / Accepted: 5 December 2022 / Published: 8 December 2022
(This article belongs to the Section Plant Response to Abiotic Stress and Climate Change)

Abstract

:
Photosynthesis is an important process in plants which influences their development and productivity. Many factors can control the efficiency of photosynthesis, including CO2 conductance of leaf mesophyll, which affects the CO2 availability for Rubisco. It is known that electrical stress signals can decrease this conductance, and the response is probably caused by inactivation of H+-ATPase in the plasma membrane. In the current work, we analyzed the influence of both CO2 conductance in the plasma membrane, and chloroplast envelopes and H+-ATPase activity on photosynthetic CO2 assimilation, using a two-dimensional mathematical model of photosynthesis in leaves. The model included a description of assimilation on the basis of the Farquhar–von Caemmerer–Berry model, ion transport through the plasma membrane, diffusion of CO2 in the apoplast, and transport of CO2 through the plasma membrane and chloroplast envelope. The model showed that the photosynthetic CO2 assimilation rate was mainly dependent on the plasma membrane and chloroplast envelope conductance; direct influence of the H+-ATPase activity (through changes in pH and CO2/HCO3 concentration ratio) on this rate was weak. In contrast, both changes in CO2 conductance of the plasma membrane and chloroplast envelopes and changes in the H+-ATPase activity influenced spatial heterogeneity of the CO2 assimilation on the leaf surface in the simulated two-dimensional system. These effects were also observed under simultaneous changes in the CO2 conductance of the plasma membrane and H+-ATPase activity. Qualitatively similar influence of changes in the CO2 conductance of the plasma membrane and chloroplast envelopes, and changes in the H+-ATPase activity on photosynthesis were shown for two different densities of stomata in the simulated leaf; however, lowering the density of stomata decreased the assimilation rate and increased the heterogeneity of assimilation. The results of the model analysis clarify the potential influence of H+-ATPase inactivation on photosynthesis, and can be the basis for development of new methods for remote sensing of the influence of electrical signals.

1. Introduction

Photosynthesis is a critical process in green plants that uses light energy to convert carbon dioxide and water into simple sugars. It is necessary for the nutrition of living organisms, oxygen production and carbon dioxide elimination; particularly, the leaves, seeds and roots of green plants are the basis of food security for humanity [1,2]. Investigations of photosynthesis in plants are necessary for improving plant productivity and providing their protection from the action of stressors including excess light, drought, high and low temperatures, salinity and others.
Photosynthesis is very sensitive to the influence of adverse factors which can disturb the balance of photosynthetic processes through changes in photosynthetic parameters; CO2 concentration in the stroma of chloroplasts in particular can be an important target of these adverse factors [3,4]. It is known that this concentration can strongly limit the rate of photosynthetic CO2 assimilation in the Calvin–Benson cycle [5,6]. There are numerous stressors (among other things, high temperature [7,8], drought [9,10], soil salinity [11,12]) which limit water availability for plants and cause the closing of stomata [9,13]. It is known that this stomatal closing significantly decreases the photosynthetic CO2 assimilation rate (Ahv) [14], thereby suppressing the activity of the electron transport chain [15]. This suppression can cause stimulation of the regulated dissipation of light energy in light-harvesting complexes, and can decrease the size of these complexes to reduce electron flow in the electron transport chain [15,16]; in addition, the light-dependent transportation of charges in the electron transport chain can produce reactive oxygen species [17,18] which disrupt cellular structures and biochemical compounds [19] in plant cells, causing yellowing and withering of leaves and whole plants.
The availability of CO2 for photosynthesis can be also limited by mesophyll resistance to carbon dioxide [20,21]. Mechanisms of mesophyll conductance of CO2 are interesting problems which are actively investigated. It is known that lipid membranes are relatively weakly permeable to CO2; carbon dioxide is considered to be mainly transported through aquaporins of biological membranes [22,23,24], because modification of the number of aquaporins can change photosynthetic CO2 assimilation in plants [24,25]. The activity of these aquaporins can be regulated by pH and tension of membrane [9,13]. This means that environmental factors and stress signals (e.g., electrical signals) can also have influence on the transport of CO2 through aquaporins in the plasma membrane and chloroplast envelopes [9]. Investigation of the role of aquaporins in photosynthetic responses to the action of stressors can be important for understanding the mechanisms of photosynthesis regulation.
The CO2 transport from the apoplast to the chloroplast stroma and photosynthetic assimilation can also be dependent on the conversion of CO2 to HCO3, which is regulated by pH in medium [26,27]. These two forms of carbon dioxide have a different rate of diffusion through water and biological membranes [3]; additionally, the possibility of direct HCO3 use by Rubisco in the Calvin–Benson cycle in C3 plants is not clear.
It is known that H+-ATPase in the plasma membrane is a key proton transporter which controls apoplastic and cytoplasmic pH in plant cells [28]. It can be hypothesized that this transporter can also regulate CO2 availability; this hypothesis is supported by our previous results. In particular, we showed that changes in CO2 assimilation were strongly related to shifts in the apoplastic pH [29]. The theoretical analysis also showed the influence of activity of H+-ATPase in the plasma membrane on the ratio of CO2 to HCO3 in the apoplast [27]; this ratio can potentially regulate CO2 mesophyll conductance. Additionally, changes in the apoplastic and cytoplasmic pH can influence CO2 transport through the plasma membrane and chloroplast envelopes; this effect is based on changes in the activity of aquaporins [30].
This potential influence of H+-ATPase on CO2 availability, which is based on increasing the apoplastic pH and decreasing the cytoplasmic pH, can be especially important for explanation of photosynthetic regulation by electrical stress signals (action potentials, variation potentials and system potentials). These signals are induced by local irritations, propagate into intact parts of plants, and modify photosynthetic processes [31,32,33,34]. It is known that generation of these electrical signals is related to changes in H+-ATPase activity [31,32,34,35,36]; i.e., these changes can be a mechanism of induction of photosynthetic responses through changes in CO2 availability in the Calvin–Benson cycle [33]. The changes in CO2 mesophyll conductance caused by electrical signals and related to changes in pH [30] support the hypothesis concerning the influence of changes in H+-ATPase activity on the induction of photosynthetic responses. Thus, the problem of the influence of changes in H+-ATPase activity on photosynthesis is the important and requires further investigations.
Theoretical analysis, using mathematical models of photosynthesis, can be the basis of detailed investigation of the role of different systems of leaf mesophyll, including the conductance of the plasma membrane and chloroplast envelopes, diffusion of CO2 in the cytoplasm and apoplast and the activities of systems of ion transport, etc., in photosynthetic regulation. Earlier, we preliminarily used a simple “point model” for analysis of the influence of H+-ATPase activity on the ratio of CO2 to HCO3 in the apoplast, and for estimation of the influence of this activity on photosynthesis [27]; however, using more detailed description of photosynthetic processes and taking into account spatial heterogeneity of a leaf can also be important in theoretical investigation of this problem.
There are different photosynthetic models (mainly based on the Farquhar—von Caemmerer—Berry model) developed for analysis of mesophyll conductance [3,4,37] and the vertical distribution of CO2 in leaf depth [38,39,40]. These models show the role of different leaf structures in mesophyll conductance, and simulate the dependence of CO2 assimilation on its distance from the illuminated leaf surface [4,41]. However, analysis of the influence of surface distribution of the photosynthetic processes can also be important for understanding the role of H+-ATPase in photosynthetic regulation [42], because lateral propagation of carbon dioxide and its influx into cells can be dependent upon the ratio of CO2 to HCO3, and on the CO2 conductance of the plasma membrane and chloroplast envelopes. Additionally, it is notable that analysis of spatial distribution of the photosynthetic CO2 assimilation rate on the leaf surface can show changes in this distribution, which can be markers of electrical signal-induced photosynthetic response [43,44]. Revealing these markers can be important for the development of new methods of analysis of electrical activity in plants, which are actively developing [45,46,47].
Earlier, we developed the two-dimensional model of photosynthetic processes in leaves [42], which can be used for investigation of the influence of membrane conductance and H+-ATPase activity on the photosynthetic CO2 assimilation rate and the spatial heterogeneity of this rate on the leaf surface. The current work has the following specific aims: (i) Analysis of the influence of changes in H+-ATPase activity on the photosynthetic CO2 assimilation rate. This analysis should show whether H+-ATPase activity influences photosynthesis through changes in pH and changes in the ratio of CO2 to HCO3 (without additional mechanisms). (ii) Analysis of the influence of CO2 conductance of the plasma membrane and chloroplast envelopes on the photosynthetic assimilation rate. This problem was important because the influence of electrical signals on the mesophyll CO2 conductance was shown earlier [30], and this mechanism should be considered even in the absence of the influence of changes in H+-ATPase activity on photosynthesis (at negative response to Question (i)). (iii) Analysis of the influence of both changes in H+-ATPase activity and changes in the CO2 conductance of the plasma membrane and chloroplast envelopes on the spatial heterogeneity of distribution of the photosynthetic assimilation rate on the leaf surface. Thus, the general objective of the current investigation was further clarification of the mechanisms of influence of electrical signals on photosynthesis in plants, and of the searching markers of this influence.

2. Description of the Two-Dimensional Model

The two-dimensional model of photosynthesis in leaves, which was earlier developed and verified [42], was used in the current investigation. A detailed description of the equations and parameters of this model is shown in File S1 (Supplementary Materials). Briefly, the model included the two-dimensional system of elements which connected with each other through apoplast space (Figure 1a). Each element included the mesophyll cell and section of the apoplast; some elements also included stomata, which are described as the points of CO2 entrance.
Each stomata was located in center of a square with an area equal to 3 × 3 elements or 5 × 5 elements. These variants of stomata localization described different stomata densities or partial stomata closure. CO2 entered into the leaf through the stomata. After that, carbon dioxide diffused through apoplast along neighboring cells and was transported into the cytoplasm and chloroplast through the plasma membrane and chloroplast envelopes; these fluxes were described on the basis of Fick’s law [3,48] (Figure 1b). There were two forms of the carbon dioxide which were described in the model (CO2 and HCO3); conversion between CO2 and HCO3 was regulated by a pH of medium (the apoplast, cytoplasm, or stroma of chloroplast) [26,27]. CO2 and HCO3 had different constants of diffusion in water and through biological membranes [3]; in the current work, the HCO3 transport through the plasma membrane and chloroplast envelopes was assumed to equal zero. We also assumed that only the CO2 form was fixed by Rubisco [6,49].
The C3 photosynthesis and photorespiration were described on the basis of the classical model by Farquhar—von Caemmerer—Berry [6,49]. This model was based on the limitation of stationary photosynthetic CO2 assimilation by the rate of photosynthetic electron transport in thylakoid membranes in chloroplasts, or by rate of CO2 carboxylation by Rubisco; the minimal rate was assumed to be the photosynthetic rate. The dark respiration rate was assumed to be constant [5,49].
The ion transport (H+ and K+) and gradient of electrical potential across the plasma membrane were described on the basis of our earlier work [50,51]. In the current work, this description was simplified, and included only H+-ATPase, K+/H+-antiporter and inwardly and outwardly rectifying K+-channels. The directions of transport of ions through these transporters are shown in Figure 2b.
The fluxes through inwardly and outwardly rectifying K+-channels were described by the Goldman–Hodgkin–Katz equation [52,53]; the probability of the opening of these channels was described as a function of the electrical potential gradient across the plasma membrane [53,54].
The H+-ATPase activity was described on the basis of the two-state model of active ion transport, which included the free and proton-bound states of this transporter [53,55,56]. Additionally, regulation of H+-ATPase activity by light intensity and ATP concentration was described in the model [57]. The stationary concentration of ATP was described as a function of the rates of photosynthesis, photorespiration and dark respiration.
H+ and K+ fluxes through the electro-neutral K+/H+-antiporter were described on the basis of simple equations of chemical kinetics, in accordance with our previous work [54].
The diffusion of K+ and H+ from the apoplast along neighboring cells was described on the basis of Fick’s law [58]. The buffer capacity of H+ in the cytoplasm and the capacities of H+ and K+ in the apoplast were also included into the current model [50,54].

3. Results

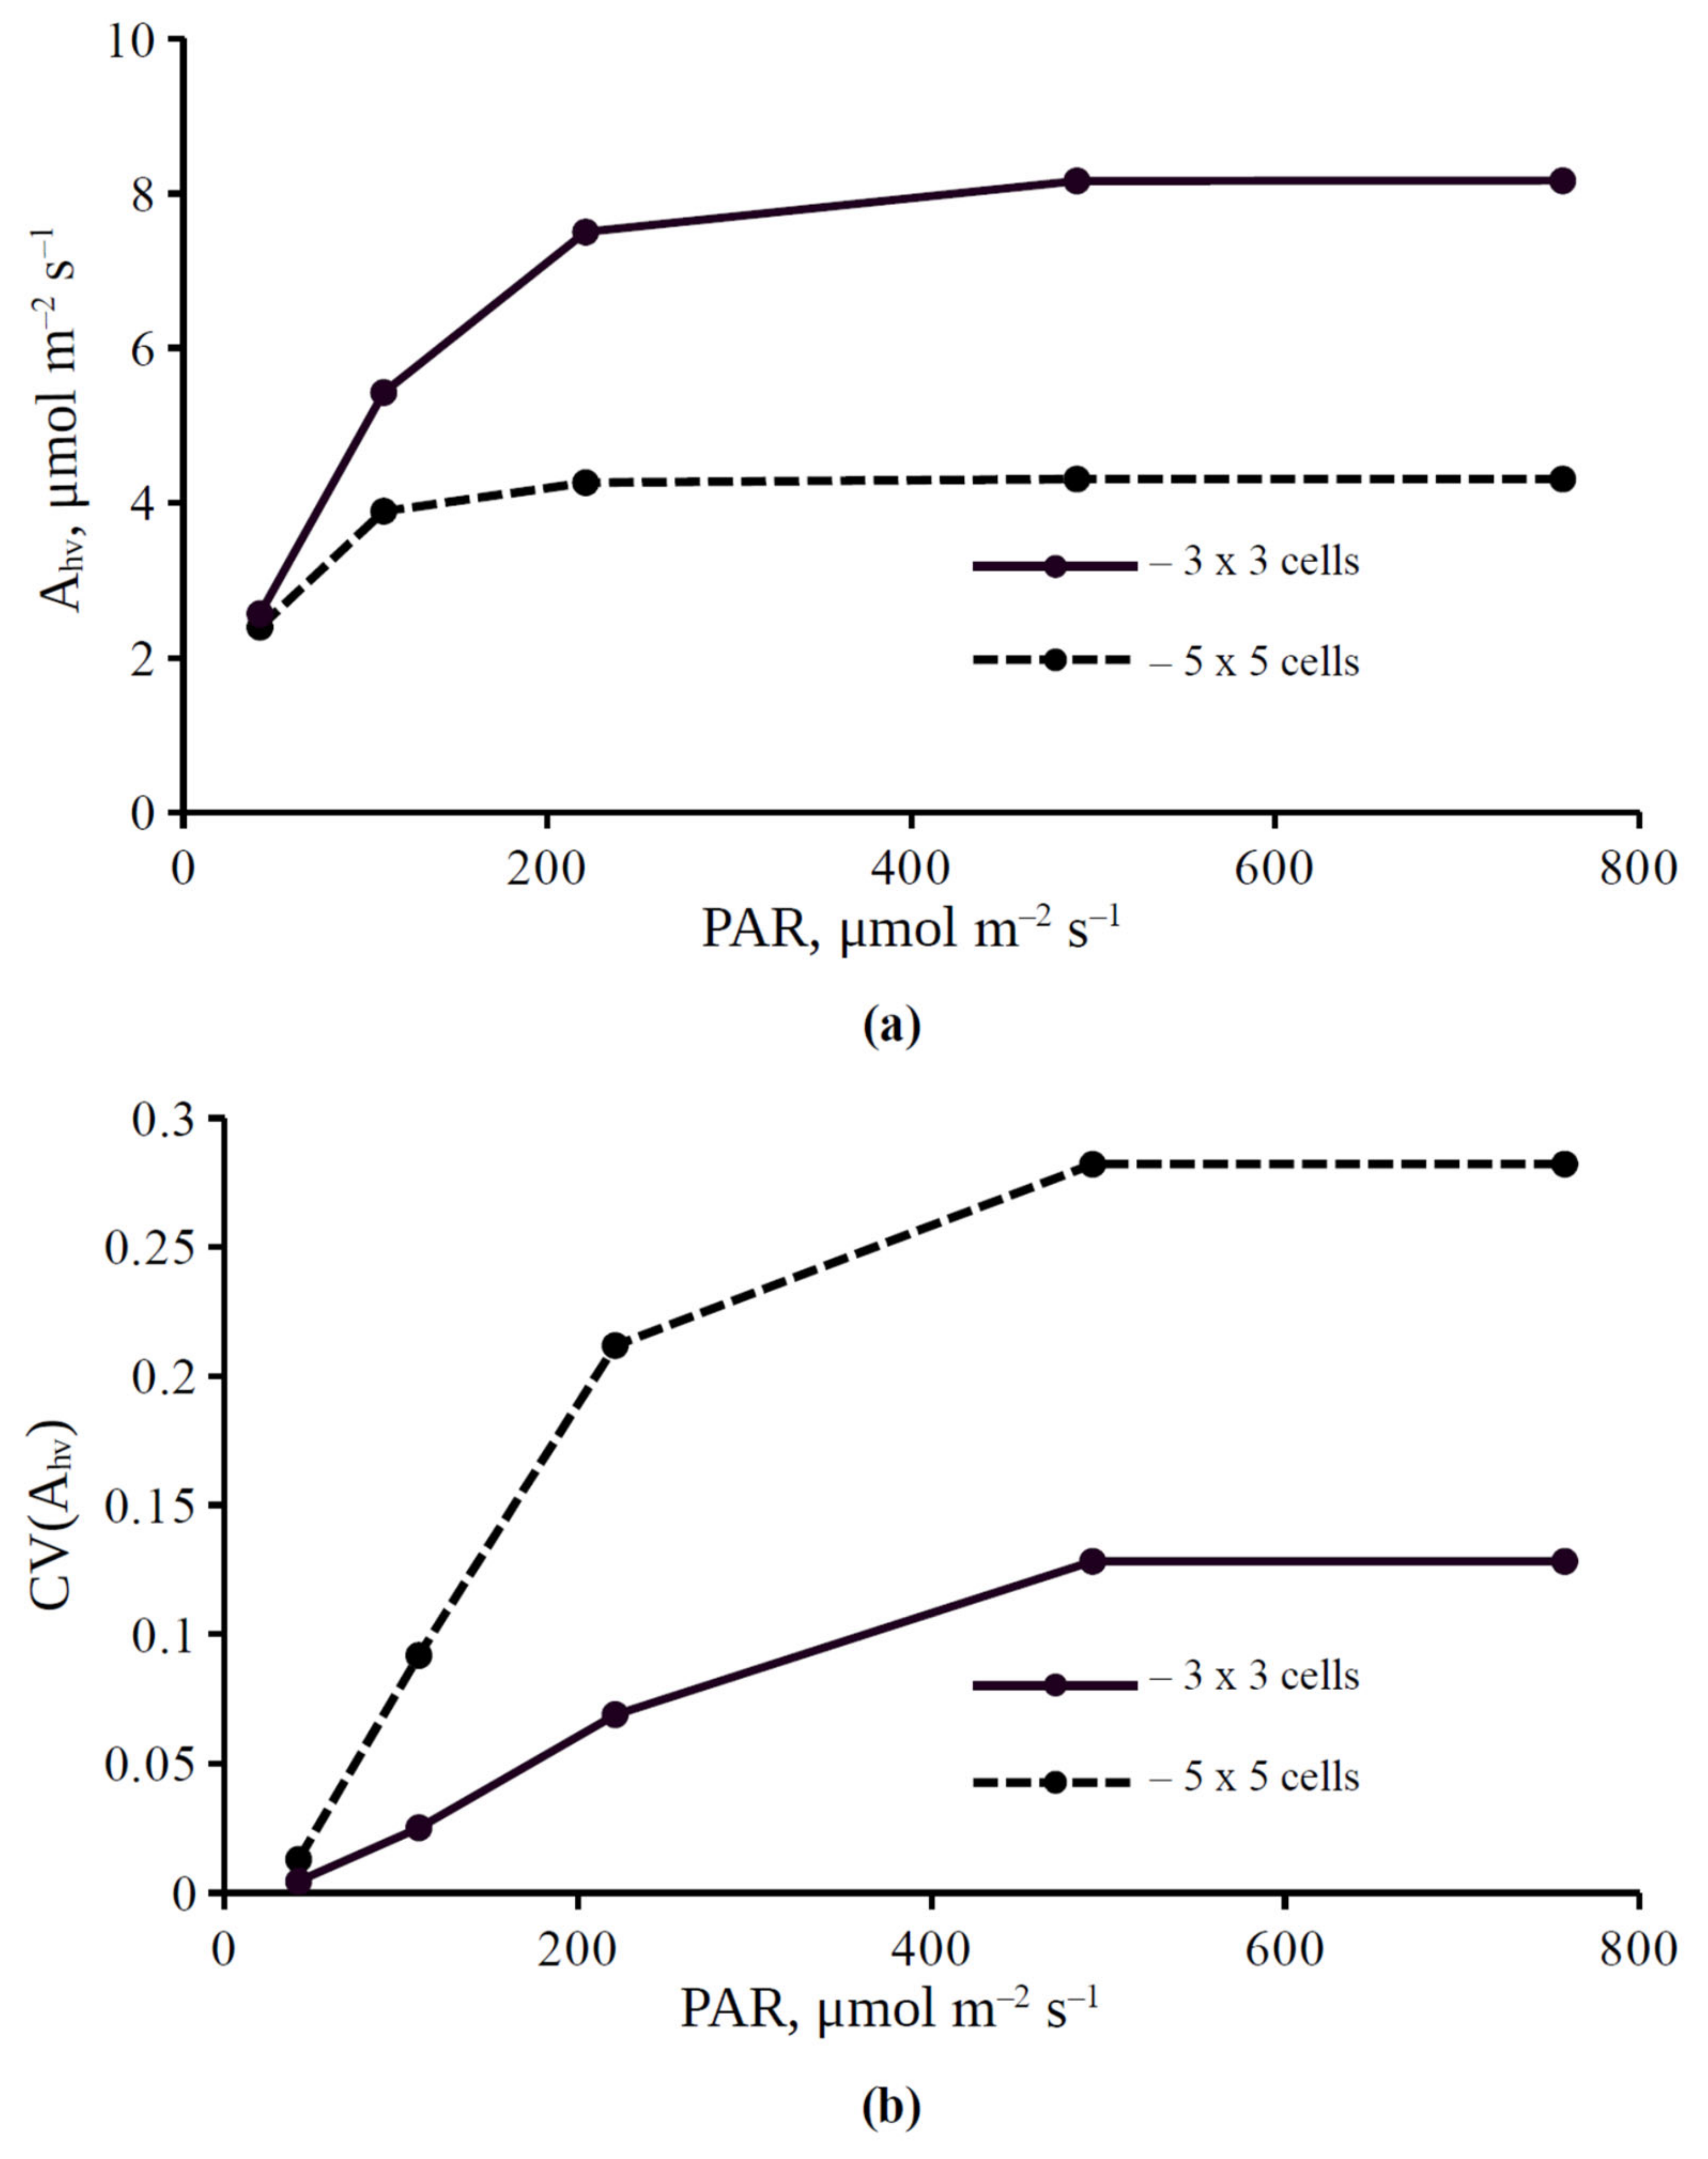
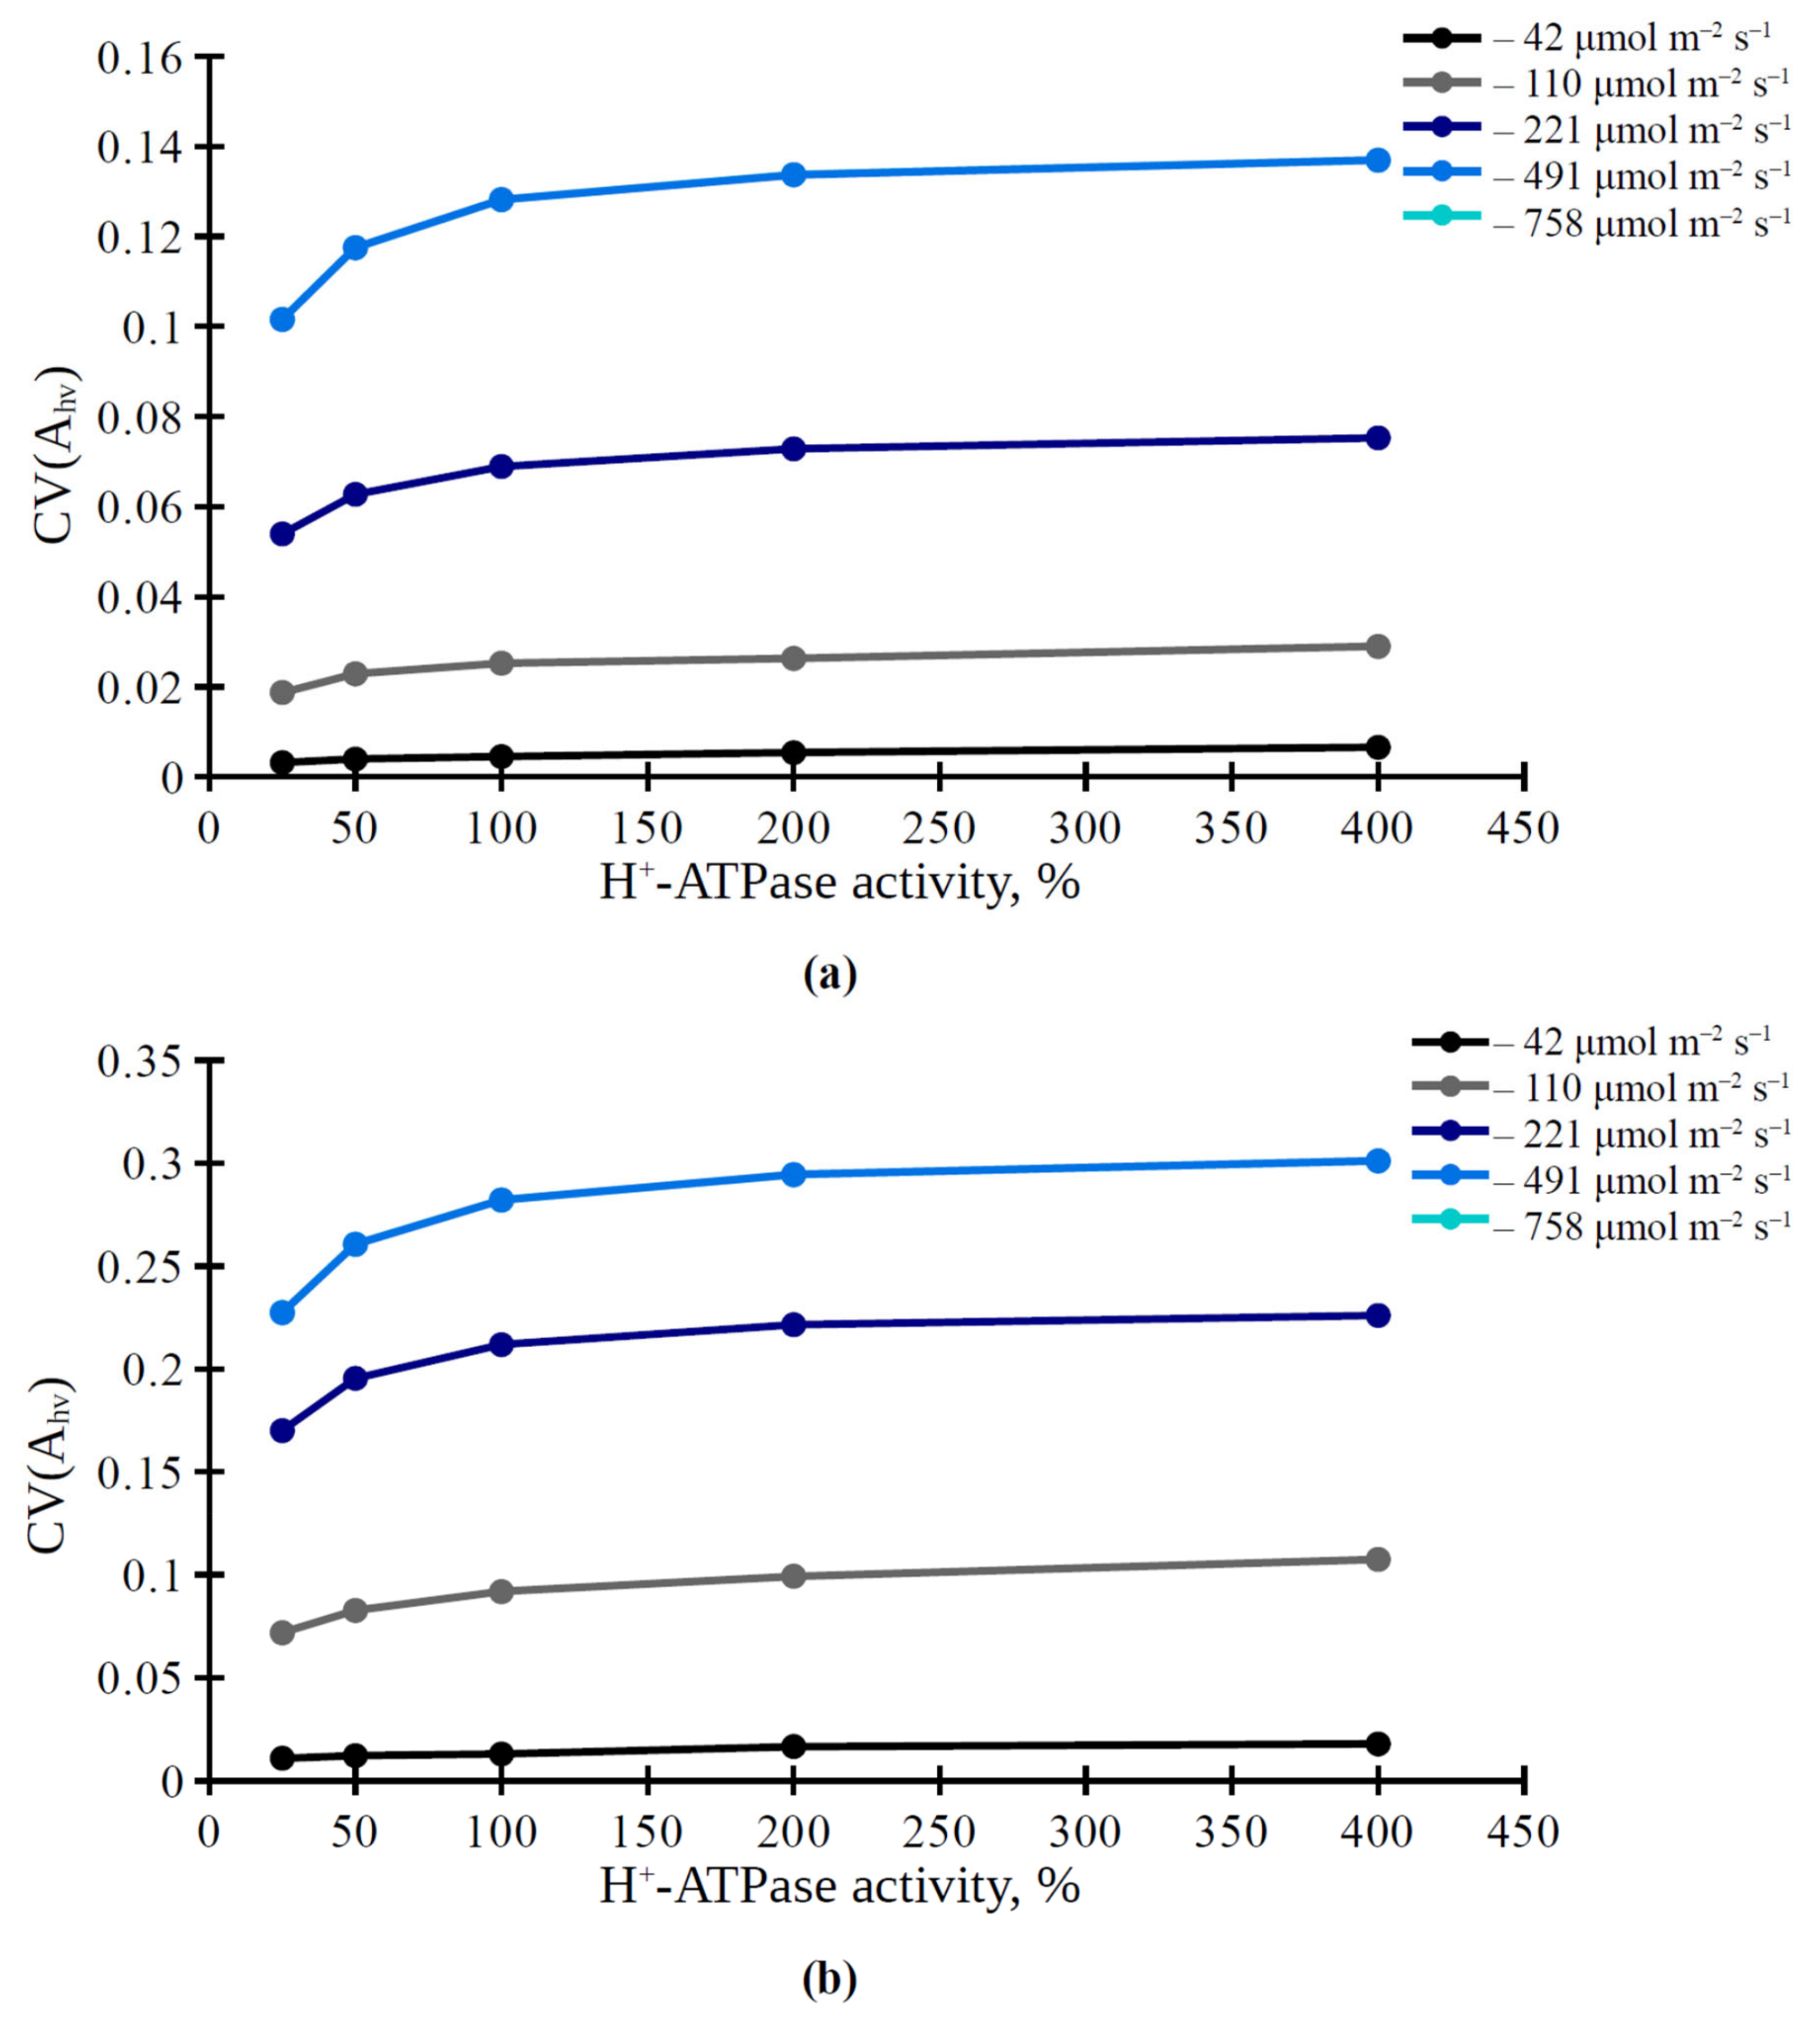
3.1. The Influence of Light Intensity and H+-ATPase Activity on Parameters of Photosynthetic Assimilation of CO2

In accordance with our previous work [42], influence of light intensity on the photosynthetic CO2 assimilation rate and on its spatial heterogeneity on the leaf surface was investigated at the first stage of the current analysis. Light dependence of the CO2 assimilation rate and the variation coefficient of this assimilation are shown in Figure 2. It was shown that the CO2 assimilation rate and its coefficient of variation (CV(Ahv)) were increased with increasing photosynthetically active radiation (PAR). The light saturation of these parameters was observed under illumination intensities equal to 500 μmol m−2 s−1 and more; this value was similar to the light saturation of Ahv in pea leaves [42]. It should be noted that the CO2 assimilation rate was more in the variant with stomata localized in center of a 3 × 3 cell square than in the variant with stomata localized in center of a 5 × 5 cell square (Figure 2a). In contrast, the coefficient of variation of the CO2 assimilation rate was higher in the variant with a 5 × 5 cell square (Figure 2b).
Furthermore, we analyzed the influence of the H+-ATPase activity on the average photosynthetic CO2 assimilation rate in the simulated leaf and on the spatial distribution of this rate on the leaf surface. It was shown that Ahv and CV(Ahv) were dependent on light intensity at all levels of activity of H+-ATPase in the plasma membrane (Figure 3 and Figure 4). Average Ahv in the simulated leaf was weakly dependent on the H+-ATPase activity in both investigated variants, 3 × 3 cells (Figure 3a) and 5 × 5 cells (Figure 3b). In contrast, CV(Ahv) was dependent on H+-ATPase activity; increased CV(Ahv) was observed under the increased H+-ATPase activity (Figure 4). This effect was more dramatic under high and medium light intensities.

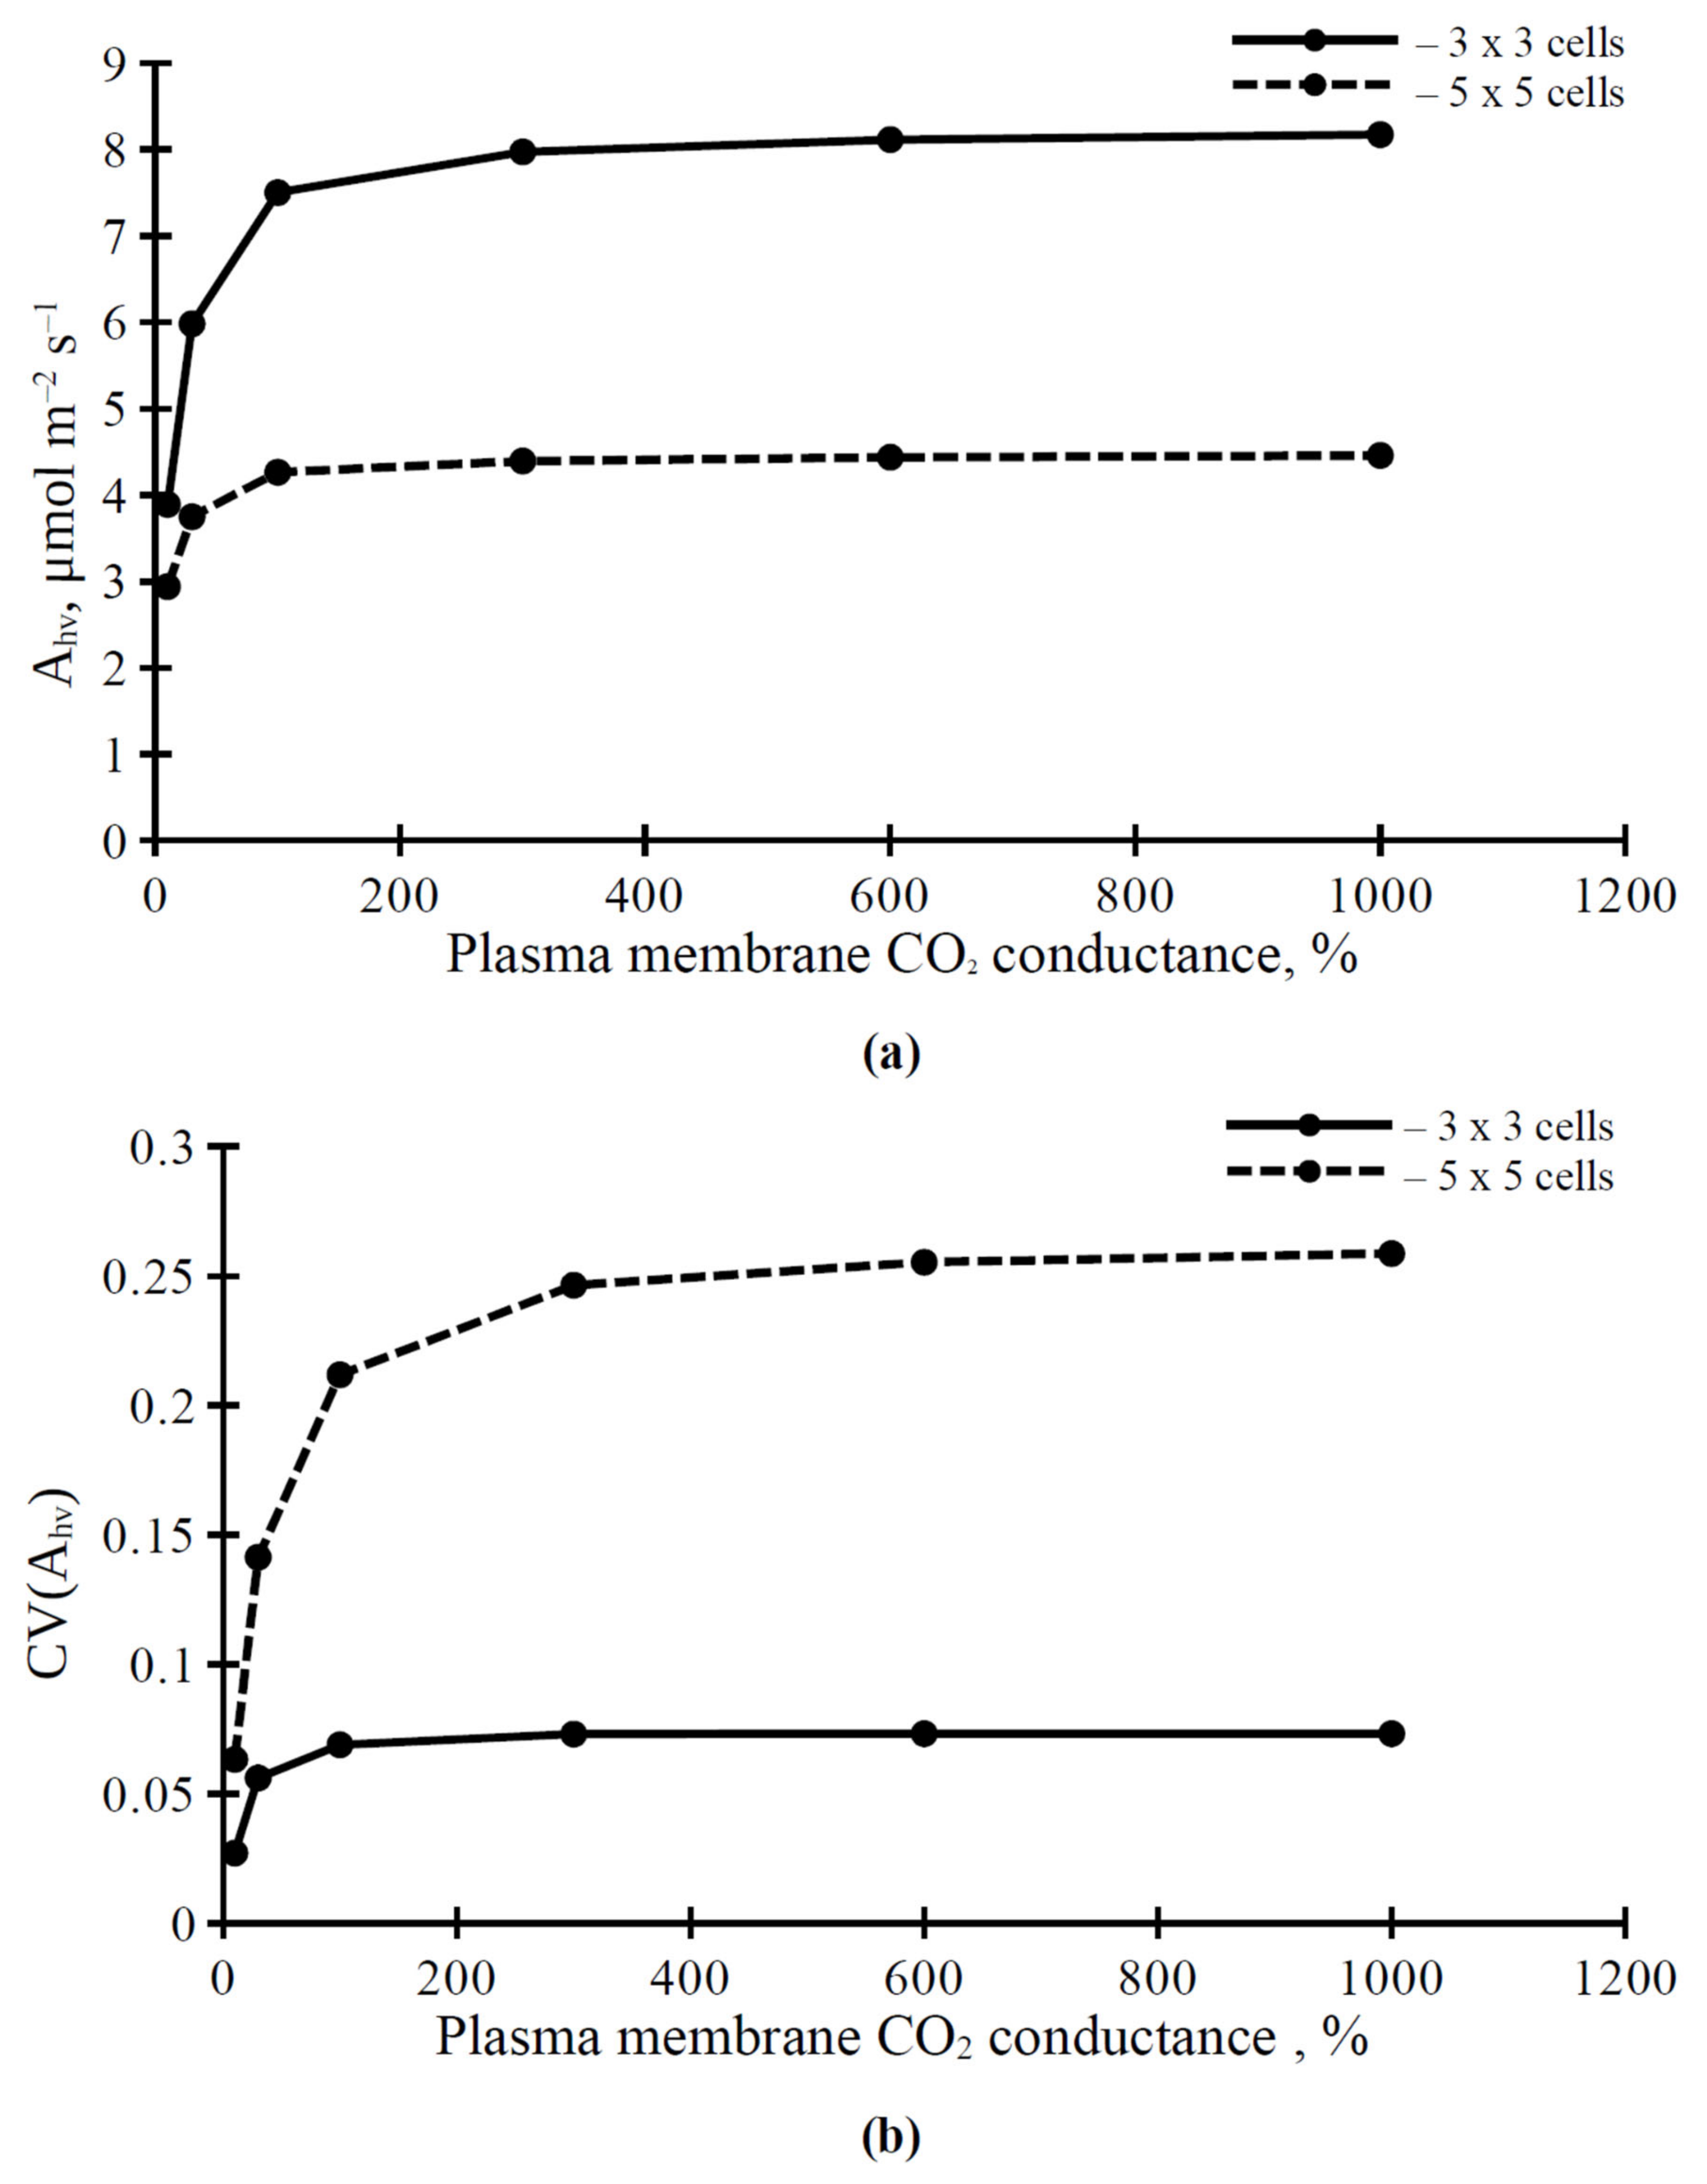
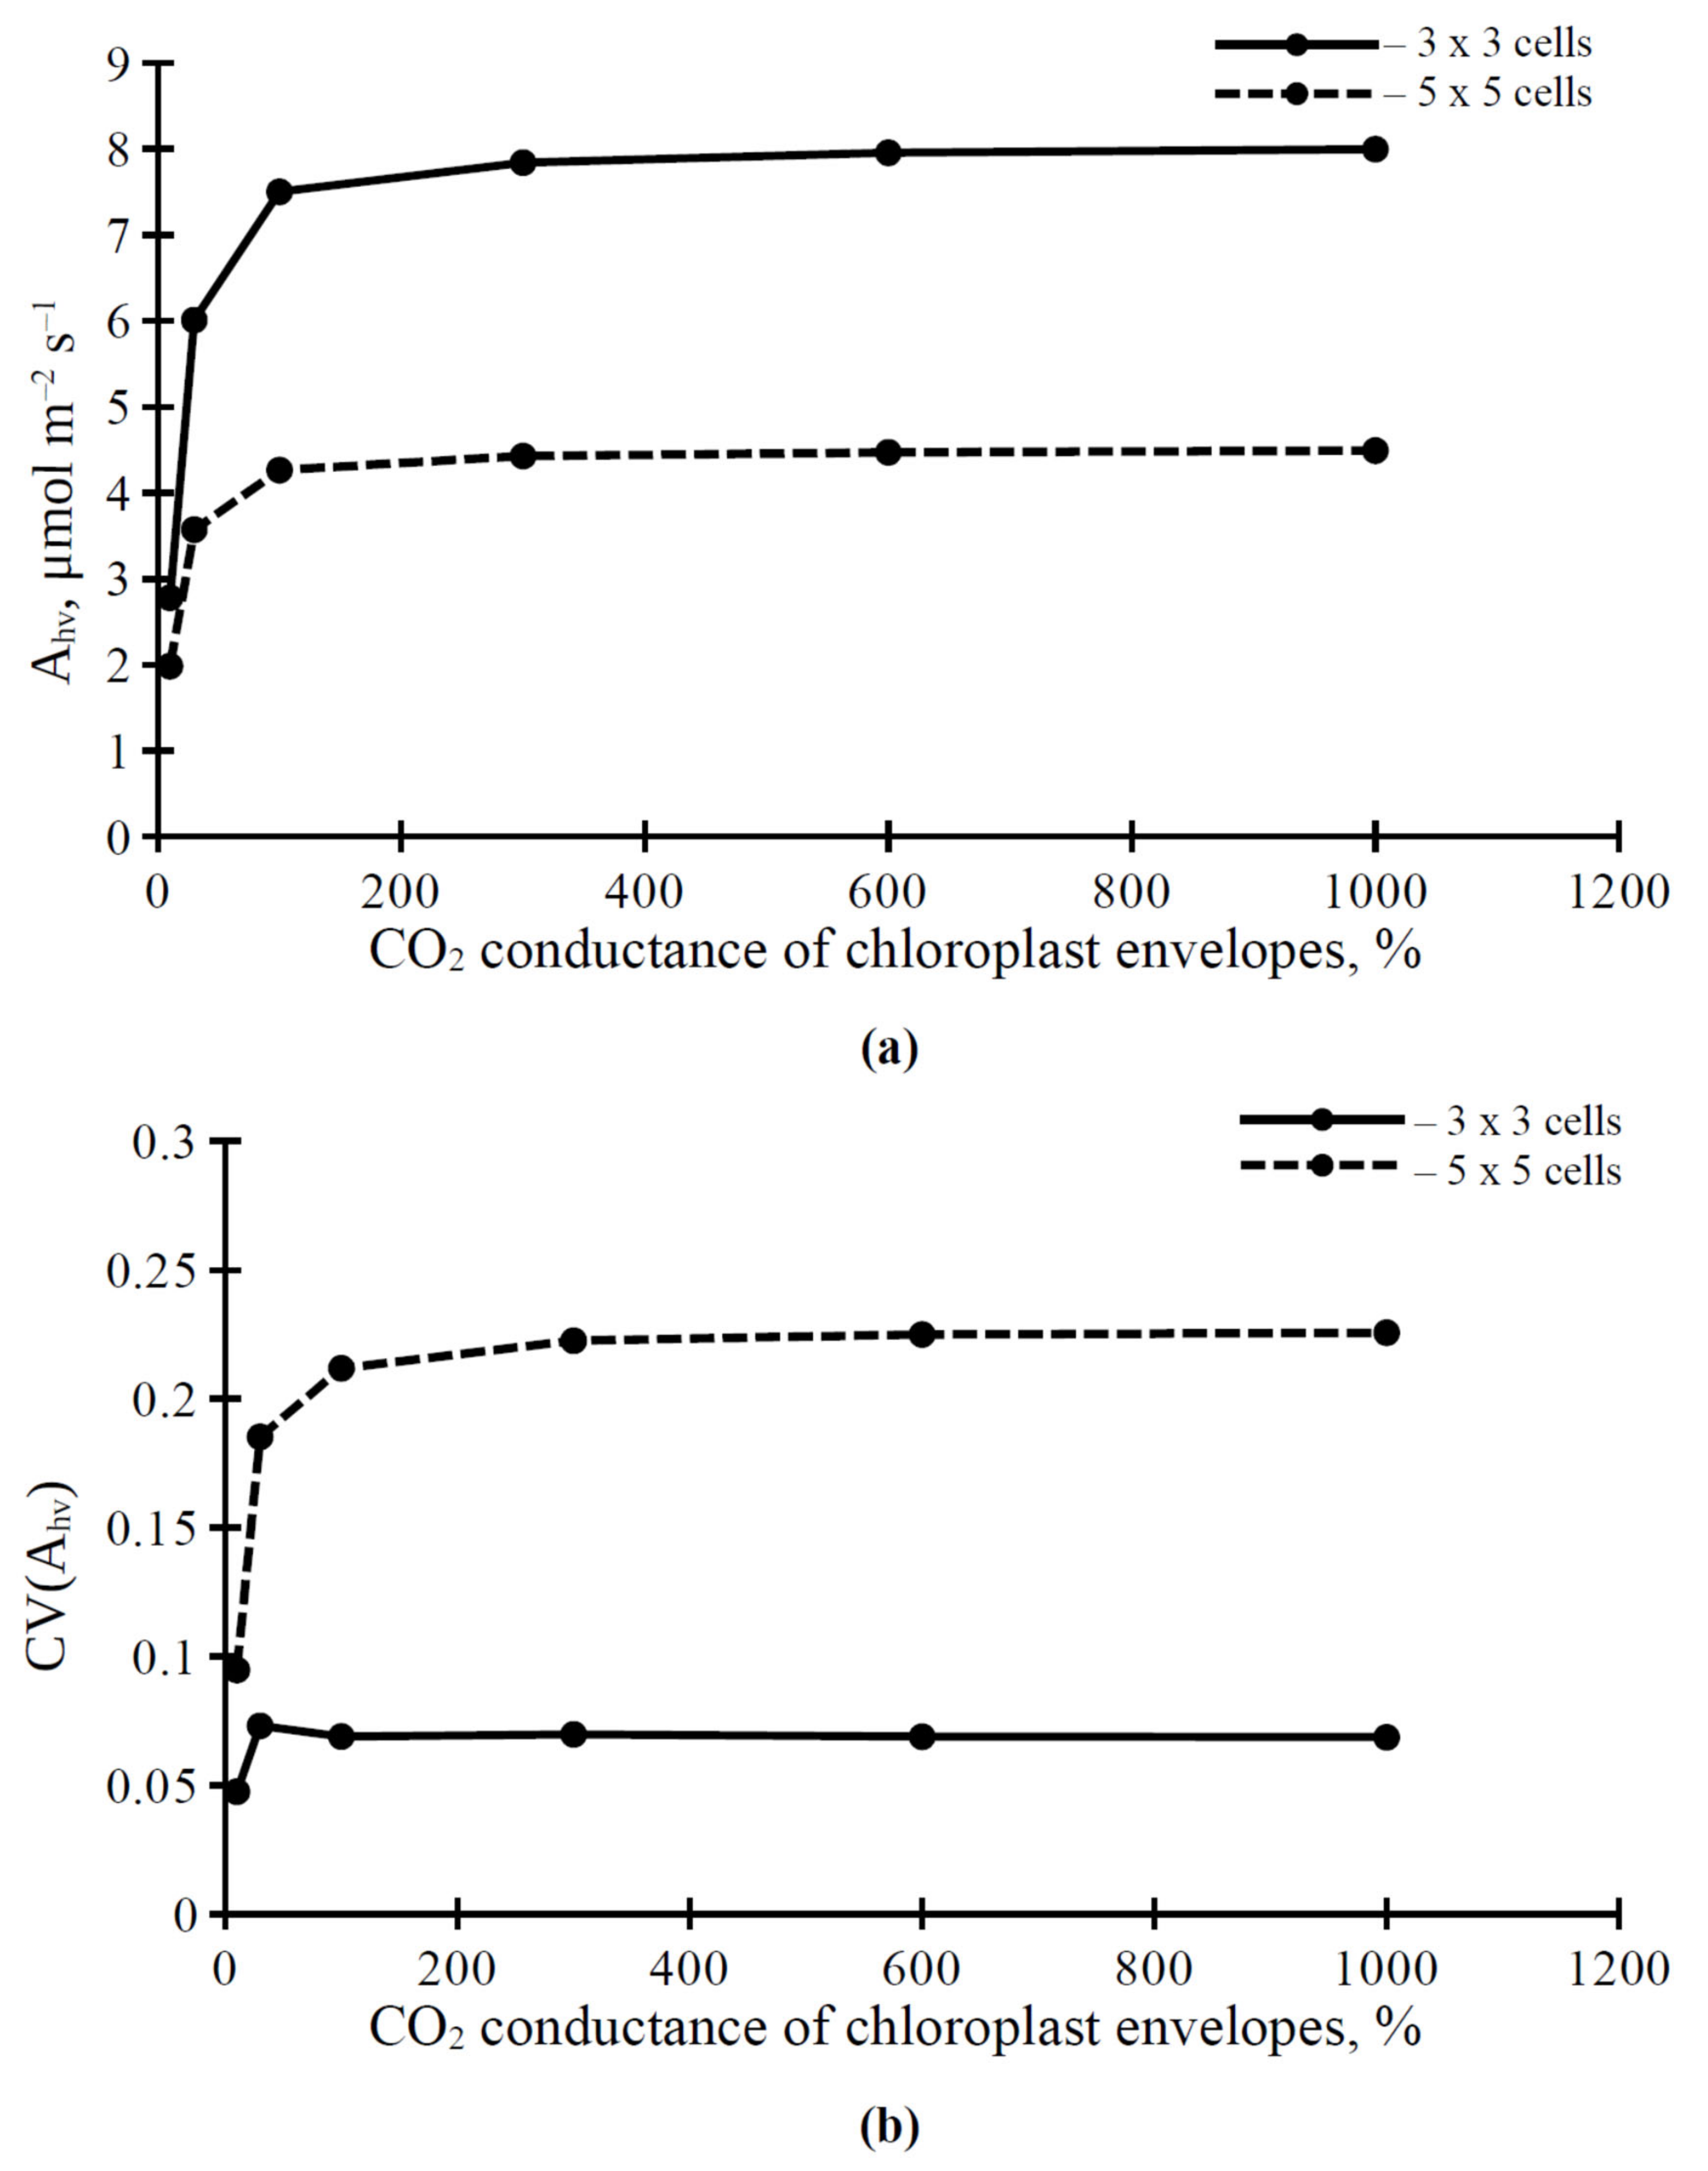
3.2. The Influence of CO2 Conductance of Plasma Membrane and Chloroplast Envelopes on Parameters of Photosynthetic Assimilation of CO2

We analyzed the influence of the plasma membrane and chloroplast envelope conductance of CO2 on the photosynthetic assimilation rate, and its spatial heterogeneity, in the simulated leaf. It was shown that dependence of Ahv (Figure 5a), and CV(Ahv) (Figure 5b) on the CO2 conductance of the plasma membrane was nonlinear. The saturation of this dependence was observed under CO2 conductance of the plasma membrane that equaled 300 %, from the initial activity and more (Figure 5). The value of Ahv was higher in the 3 × 3 cell variant than in the 5 × 5 cell variant (Figure 5a). In contrast, CV(Ahv) was higher in the 5 × 5 cell variant than in the 3 × 3 cell variant (Figure 5b).
The dependence of Ahv and CV(Ahv) on the CO2 conductance of chloroplast envelopes (Figure 6) was similar to the dependence of parameters of the photosynthetic CO2 assimilation on the CO2 conductance of the plasma membrane (Figure 5). However, there were some differences between these dependences. The values of Ahv and CV(Ahv) under the weak CO2 conductance of chloroplast envelopes were lower than the parameters under the similar CO2 conductance of the plasma membrane; the increase of Ahv and CV(Ahv) was sharper with an increase in the CO2 conductance of chloroplast envelopes (Figure 6). The values of CV(Ahv) in the 5 × 5 cell variant were lower under the high CO2 conductance of chloroplast envelopes (Figure 6b) than the values under the high CO2 conductance of the plasma membrane (Figure 5b).
Finally, it was shown that the revealed effects could be also observed in simultaneous changes in the H+-ATPase and in the plasma membrane CO2 conductance (Table 1 and Table 2). It should be noted that these effects were only checked for the variant with a 3 × 3 cell square (because qualitive differences in the dependence of Ahv and CV(Ahv) in variants with a 3 × 3 cell square and a 5 × 5 cell square were absent in our analysis) and for only the plasma membrane CO2 conductance (because the influence of CO2 conductance in the plasma membrane and chloroplast envelopes on Ahv and CV(Ahv) was similar).

4. Discussion

Photosynthesis is a key process in plants which permits them to assimilate CO2 and is the basis of productivity. The photosynthetic assimilation and, therefore, productivity depend on the mesophyll conductance of CO2 [20]. The conductance of mesophyll can be modified by environmental factors, physiological processes and the structural parameters of mesophyll cells [21,37,59,60], which can modify the activity of CO2 assimilation. The total mesophyll CO2 conductance is dependent on the conductance of the cell wall, plasma membrane, cytoplasm, chloroplast envelopes and chloroplast stroma [20,24,61]; it should be noted that the contribution of the plasma membrane and chloroplast envelopes to the total conductance is key.
Photosynthesis is very sensitive to the influence of different environmental factors, including stressors [13]. Long-term changes in photosynthesis can be caused by structural changes in photosynthetic apparatus, synthesis and degradation of photosynthetic pigments [62,63,64] and modification of the mesophyll conductance [13,21,60]. On the other hand, changes in the mesophyll CO2 conductance can be also caused by relatively fast processes, including physiological responses induced by systemic action of abiotic environmental factors (e.g., light intensity and temperature [13]), and by local action of stressors causing generation and propagation of specific stress signals (electrical signals) [30].
Considering the strong influence of electrical signals on photosynthesis (including suppression of photosynthetic CO2 assimilation and linear electron flow, and activation of the cyclic electron flow and non-photochemical quenching of fluorescence of chlorophylls [31,32,33,34]) and the role of these photosynthetic responses in increasing plant tolerance to action of stressors [33,34], analysis of the ways that these signals influence mesophyll CO2 conductance is a very important scientific task. This analysis requires understanding of the limiting stages of CO2 transport from the intercellular space of the leaf to the chloroplast stroma; these stages are basis of mesophyll CO2 conductance and its regulation. Investigation of the limiting stages can be based on investigation of transgenic plants [24], meta-analyses of the literature data showing the mesophyll CO2 conductance in different plant species [13,21], and development of mathematical models of CO2 transport [3,37]. The latter method seems to be very effective because it can be used for complex investigation of the problem (if necessary, in combination with experimental measurements).
Earlier, we showed that changes in the H+-ATPase activity in the apoplastic and cytoplasmic pH are mechanisms of electrical signals’ influence on photosynthesis [33,34,65]. On the basis of a simulation, it was also shown [27] that the changes in the H+-ATPase activity strongly influence the ratio of CO2 to HCO3, and thereby, should modify transport of CO2 into the chloroplast stroma, because charged HCO3 is weakly transported through the biological membranes [3,26]. Further analysis of this hypothesis, which was based on the two-dimensional model of photosynthesis in leaves [42], was the first main task of the current work.
The analysis shows that changes in the H+-ATPase activity weakly influence the photosynthetic CO2 assimilation rate (Figure 3 and Table 1). It means that our hypothesis [27,33] about the key role of modification of the ratio of CO2 to HCO3 in the apoplast and cytoplasm—which is caused by changes in the H+-ATPase activity and changes in pH in these compartments—in the electrical signals-induced photosynthetic response, seems to be incorrect (i.e., the influence of activity of H+-ATPase in the plasma membrane on conversion between CO2 and HCO3 is not sufficient for regulation of photosynthetic CO2 assimilation, at least for the stationary assimilation). In contrast, changes in the CO2 conductance of the plasma membrane and chloroplast envelopes, which are the basis of mesophyll CO2 conductance, strongly influence Ahv (Figure 5a and Figure 6a). This result is in good accordance with an alternative hypothesis about the influence of electrical signals on photosynthesis: ESs-related changes in the H+-ATPase activity and changes in the apoplastic and cytoplasmic pH modify the activity of aquaporins [30], which participate in CO2 transport through biological membranes in plants and support photosynthetic processes [23,24,25]. It should be noted that we do not directly describe the influence of pH on aquaporin activity to simplify our model; including this dependence in a future model may be useful for revealing more detailed information about changes in the H+-ATPase activity and photosynthetic CO2 assimilation.
In our previous work [42], analysis of the model showed that the spatial heterogeneity of the photosynthetic assimilation rate on the leaf surface is strongly dependent on light intensity and stomata density; changes in this heterogeneity (which are estimated on basis of the variation coefficient of spatial distribution of Ahv on the leaf surface) can potentially be used for revealing the action of stressors on the plant. It can be expected that changes in the spatial heterogeneity can also be related to the influence of electrical signals on photosynthesis. Thus, analysis of the influence of H+-ATPase activity and CO2 conductance in the plasma membrane and chloroplast envelopes on the spatial heterogeneity in the CO2 assimilation rate on the leaf surface was the second main task of the current work.
We show that CV(Ahv) is increased with increasing H+-ATPase activity (Figure 4) and CO2 conductance in the plasma membrane (Figure 5b) and chloroplast envelopes (Figure 6b); this dependence has saturations at high values of the H+-ATPase activity and CO2 conductance. This effect is also observed in simultaneous changes in H+-ATPase activity and CO2 conductance (Table 2). Potentially, the CV(Ahv) increase may be caused (i) by different lateral diffusions of CO2 and HCO3 (through changes in the ratio between these forms at different levels of H+-ATPase activity) and (ii) by the increased carbon dioxide flux into mesophyll cells during the lateral transport of CO2 from stomata (through increasing CO2 conductance) and, thereby, the increased lateral gradient of CO2 concentration in the apoplast.
The spatial heterogeneity of assimilation (CV(Ahv)) may be important for monitoring the induction of systemic plant stress responses caused by the propagation of electrical signals [34,66]. It is known that photosynthetic activity is related to optical properties of leaves, including changes in reflectance [67]. The decrease in mesophyll conductance of CO2 in particular causes suppression of assimilation [21,37,59,60], which increases ratios of ATP: ADP and NADPH: NADP+, stimulates the lumen acidification, and, thereby, suppresses the activity of the electron transport chain of chloroplast [68]. This luminal acidification leads to pigment transformation [69], which changes reflectance in leaves (e.g., by increasing the photochemical reflectance index [70,71]). This means that the development of spatial heterogeneity in photosynthetic activity can lead to the increased spatial heterogeneity in leaf reflectance (e.g., the photochemical reflectance index). Thus, propagation of electrical signals, which are related to changes in the H+-ATPase activity (inactivation during the action potential and variation potential [34], activation during the system potential [35]) and influence the mesophyll CO2 conductance [30], can potentially be revealed on the basis of spatial heterogeneity in leaf reflectance.
However, the last possibility requires further theoretical and probably experimental analysis, because there are additional factors which can also influence the spatial heterogeneity in the Ahv. Firstly, our results show that changes in the density of stomata (or changes in the quantity of opened stomata) strongly influence the Ahv spatial heterogeneity (Figure 4, Figure 5 and Figure 6). It is known that electrical signals can induce multi-phase responses in stomata (e.g., stomata opening, following their closing) [72,73]. These changes in stomata opening may be an additional factor in CV(Ahv) changes. Secondly, the parameters of electrical signals can be dependent on their distance from the damaged zone [34], and these parameters are also strongly related to the parameters of photosynthetic response [33]. This means that the propagation of electrical signals can also influence the CV(Ahv) in leaves; this effect should be more dramatic on large spatial scale. In future, these problems may be solved through the development of a complex model which will include the two-dimensional model of leaf photosynthesis, a model of electrical signal propagation (see, e.g., [53]), and a model of regulation of stomata opening by these signals.
As a whole, the current investigation shows two main points: (i) The conductance of CO2 in the plasma membrane and chloroplast envelopes strongly influences photosynthetic assimilation; in contrast, changes in H+-ATPase activity weakly influence this assimilation. (ii) Changes in H+-ATPase activity and CO2 membrane conductance in the plasma membranes and chloroplast envelopes modify the spatial heterogeneity of the photosynthetic assimilation distribution on the leaf surface. The first result shows that the influence of electrical signals on photosynthesis cannot only be based on changes in the ratio of CO2 to HCO3+, which is dependent on pH and, thereby, the H+-ATPase activity. The additional mechanism, of the influence of changes in H+-ATPase activity on CO2 mesophyll conductance, is necessary. The second result is the basis for the development of new methods of remote sensing of plant systemic responses induced by electrical signals, e.g., methods based on measuring plant reflectance.

5. Materials and Methods

We analyzed the two-dimension model of photosynthesis in leaves. The details and equations of the model are described in our previous work [42] and in File S1 (Supplementary Materials). The parameters of the model were estimated on the basis of the literature data (Table S1 in File S1). The verification of the model was performed in our earlier work [42]. The model was numerically analyzed using the forward Euler method in the specialized computer program (Microsoft Visual C++ 2019, Microsoft Corporation, Redmond, WA, USA) developed for solution of this task.
The analyzed parameters of photosynthesis in leaves were calculated throughout all elements of the simulated leaf. The heterogeneity in the spatial distribution of the photosynthetic assimilation rate was estimated using of the variation coefficient of this rate.

6. Conclusions

The simulated analysis, based on the two-dimensional model of photosynthesis in leaves, showed the following main results: (i) Changes in H+-ATPase activity weakly influenced the photosynthetic CO2 assimilation rate; i.e., changes in pH and pH-dependent changes in the ratio of CO2 to HCO3 were not probable to be mechanisms of the influence of electrical signals on photosynthesis. (ii) Decreasing the CO2 conductance across the plasma membrane and chloroplast envelopes supressed photosynthetic CO2 assimilation; i.e., the decreasing of CO2 conductance could be a mechanism of electrical signals’ influence on photosynthesis. (iii) Both changes in the H+-ATPase activity and membrane CO2 conductance influenced the spatial heterogeneity of the photosynthetic CO2 assimilation in the leaf. This result can be used for the development of new methods of estimating the electrical signals in plants, and revealing the physiological responses induced by these signals.

Supplementary Materials

The following supporting information can be downloaded at: https://www.mdpi.com/article/10.3390/plants11243435/s1, File S1. Description of the two-dimensional photosynthetic model. Table S1. Parameters and initial values of the two-dimensional photosynthetic model. References [74,75,76,77,78] are cited in the Supplementary Materials.

Author Contributions

Conceptualization, E.S. and V.S.; methodology, E.S., D.R. and V.S.; software, E.S. and D.R.; formal analysis, E.S.; investigation, E.S. and D.R.; writing—original draft preparation, E.S.; writing—review and editing, V.S.; supervision, V.S.; project administration, V.S. All authors have read and agreed to the published version of the manuscript.

Funding

This research was funded by the Ministry of Science and Higher Education of the Russian Federation for large scientific projects in priority areas of scientific and technological development, (contract no. 075–15-2020–774).

Institutional Review Board Statement

Not applicable.

Informed Consent Statement

Not applicable.

Data Availability Statement

The data presented in this study are available upon request from the corresponding author.

Conflicts of Interest

The authors declare no conflict of interest. The funders had no role in the design of the study, the collection, analyses, or interpretation of data, the writing of the manuscript or in the decision to publish the results.

References

  1. Foyer, C.H.; Ruban, A.V.; Nixon, P.J. Photosynthesis solutions to enhance productivity. Philos. Trans. R. Soc. Lond. B Biol. Sci. 2017, 372, 20160374. [Google Scholar] [CrossRef] [Green Version]
  2. Simkin, A.J.; López-Calcagno, P.E.; Raines, C.A. Feeding the world: Improving photosynthetic efficiency for sustainable crop production. J. Exp. Bot. 2019, 70, 1119–1140. [Google Scholar] [PubMed] [Green Version]
  3. Tholen, D.; Zhu, X.-G. The mechanistic basis of internal conductance: A theoretical analysis of mesophyll cell photosynthesis and CO2 diffusion. Plant Physiol. 2011, 156, 90–105. [Google Scholar] [CrossRef] [Green Version]
  4. Berghuijs, H.N.; Yin, X.; Ho, Q.T.; Driever, S.M.; Retta, M.A.; Nicolaï, B.M.; Struik, P.C. Mesophyll conductance and reaction-diffusion models for CO2 transport in C3 leaves; needs, opportunities and challenges. Plant Sci. 2016, 252, 62–75. [Google Scholar] [CrossRef] [PubMed]
  5. Von Caemmerer, S.; Farquhar, G.; Berry, J. Biochemical model of C3 photosynthesis. In Photosynthesis In Silico: Advances in Photosynthesis and Respiration; Laisk, A., Nedbal, L., Govindjee, Eds.; Springer: Dordrecht, The Netherlands, 2009; Volume 29, pp. 209–230. [Google Scholar]
  6. Von Caemmerer, S. Steady-state models of photosynthesis. Plant Cell Environ. 2013, 36, 1617–1630. [Google Scholar] [CrossRef]
  7. Ghosh, A.K.; Ichii, M.; Asanuma, K.; Kusutani, A. Optimum and sub-optimal temperature effects on stomata and photosynthesis rate of determinate soybeans. Acta Hortic. 1996, 440, 81–86. [Google Scholar] [CrossRef] [PubMed]
  8. Huang, G.; Yang, Y.; Zhu, L.; Peng, S.; Li, Y. Temperature responses of photosynthesis and stomatal conductance in rice and wheat plants. Agric. Forest Meteorol. 2021, 300, 108322. [Google Scholar] [CrossRef]
  9. Chaumont, F.; Tyerman, S.D. Aquaporins: Highly regulated channels controlling plant water relations. Plant Physiol. 2014, 164, 1600–1618. [Google Scholar]
  10. Osakabe, Y.; Osakabe, K.; Shinozaki, K.; Tran, L.S. Response of plants to water stress. Front Plant Sci. 2014, 5, 86. [Google Scholar] [CrossRef] [PubMed] [Green Version]
  11. Brugnoli, E.; Lauteri, M. Effects of salinity on stomatal conductance, photosynthetic capacity, and carbon isotope discrimination of salt-tolerant (Gossypium hirsutum L.) and salt-sensitive (Phaseolus vulgaris L.) C3 non-halophytes. Plant Physiol. 1991, 95, 628–635. [Google Scholar] [CrossRef] [Green Version]
  12. Mohamed, I.A.A.; Shalby, N.; Bai, C.; Qin, M.; Agami, R.A.; Jie, K.; Wang, B.; Zhou, G. Stomatal and photosynthetic traits are associated with investigating sodium chloride tolerance of Brassica napus L. cultivars. Plants 2020, 9, 62. [Google Scholar] [CrossRef] [PubMed]
  13. Flexas, J.; Ribas-Carbó, M.; Diaz-Espejo, A.; Galmés, J.; Medrano, H. Mesophyll conductance to CO2: Current knowledge and future prospects. Plant Cell Environ. 2008, 31, 602–621. [Google Scholar] [CrossRef] [PubMed]
  14. Flexas, J.; Medrano, H. Drought-inhibition of photosynthesis in C3 plants: Stomatal and non-stomatal limitations revisited. Ann Bot. 2002, 89, 183–189. [Google Scholar] [CrossRef] [PubMed] [Green Version]
  15. Medrano, H.; Escalona, J.M.; Bota, J.; Gulías, J.; Flexas, J. Regulation of photosynthesis of C3 plants in response to progressive drought: Stomatal conductance as a reference parameter. Ann. Bot. 2002, 89, 895–905. [Google Scholar] [CrossRef] [PubMed]
  16. Kalaji, H.M.; Schansker, G.; Brestic, M.; Bussotti, F.; Calatayud, A.; Ferroni, L.; Goltsev, V.; Guidi, L.; Jajoo, A.; Li, P.; et al. Frequently asked questions about chlorophyll fluorescence, the sequel. Photosynth. Res. 2017, 132, 13–66. [Google Scholar] [PubMed] [Green Version]
  17. Ivanov, B.; Khorobrykh, S. Participation of photosynthetic electron transport in production and scavenging of reactive oxygen species. Antioxid. Redox Signal. 2003, 5, 43–53. [Google Scholar] [CrossRef] [PubMed]
  18. Khorobrykh, S.; Havurinne, V.; Mattila, H.; Tyystjärvi, E. Oxygen and ROS in Photosynthesis. Plants 2020, 9, 91. [Google Scholar]
  19. Li, M.; Kim, C. Chloroplast ROS and stress signaling. Plant Commun. 2022, 3, 100264. [Google Scholar] [CrossRef]
  20. Flexas, J.; Barbour, M.M.; Brendel, O.; Cabrera, H.M.; Carriqui, M.; Diaz-Espejo, A.; Douthe, C.; Dreyer, E.; Ferrio, J.P.; Gago, J.; et al. Mesophyll diffusion conductance to CO2: An unappreciated central player in photosynthesis. Plant Sci. 2012, 193, 70–84. [Google Scholar] [CrossRef]
  21. Elferjani, R.; Benomar, L.; Momayyezi, M.; Tognetti, R.; Niinemets, Ü.; Soolanayakanahally, R.Y.; Théroux-Rancourt, G.; Tosens, T.; Ripullone, F.; Bilodeau-Gauthier, S.; et al. A meta-analysis of mesophyll conductance to CO2 in relation to major abiotic stresses in poplar species. J. Exp. Bot. 2021, 72, 4384–4400. [Google Scholar]
  22. Tournaire-Roux, C.; Sutka, M.; Javot, H.; Gout, E.; Gerbeau, P.; Luu, D.-T.; Bligny, R.; Maurel, C. Cytosolic pH regulates root water transport during anoxic stress through gating of aquaporins. Nature 2003, 425, 393–397. [Google Scholar] [CrossRef] [PubMed]
  23. Flexas, J.; Ortuño, M.F.; Ribas-Carbo, M.; Diaz-Espejo, A.; Flórez-Sarasa, I.D.; Medrano, H. Mesophyll conductance to CO2 in Arabidopsis thaliana. New Phytol. 2007, 175, 501–511. [Google Scholar] [CrossRef] [PubMed]
  24. Kromdijk, J.; Głowacka, K.; Long, S.P. Photosynthetic efficiency and mesophyll conductance are unaffected in Arabidopsis thaliana aquaporin knock-out lines. J. Exp. Bot. 2020, 71, 318–329. [Google Scholar] [CrossRef]
  25. Sade, N.; Gallé, A.; Flexas, J.; Lerner, S.; Peleg, G.; Yaaran, A.; Moshelion, M. Differential tissue-specific expression of NtAQP1 in Arabidopsis thaliana reveals a role for this protein in stomatal and mesophyll conductance of CO2 under standard and salt-stress conditions. Planta 2014, 239, 357–366. [Google Scholar] [CrossRef] [PubMed]
  26. Bulychev, A.A.; Cherkashin, A.A.; Vredenberg, V.; Rubin, A.B.; Zykov, V.C.; Muller, S.H. Fluorescence and photosynthetic activity of chloroplasts in acid and alkaline zones of Chara corallina cells. Fisiol. Rasteniy 2001, 48, 384–391. [Google Scholar]
  27. Sukhova, E.M.; Sukhov, V.S. Dependence of the CO2 uptake in a plant cell on the plasma membrane H+-ATPase activity: Theoretical analysis. Biochem. Mosc. Suppl. Ser. A 2018, 12, 146–159. [Google Scholar] [CrossRef]
  28. Morsomme, P.; Boutry, M. The plant plasma membrane H+-ATPase: Structure, function and regulation. Biochim. Biophys. Acta (BBA) Biomembr. 2000, 1465, 1–16. [Google Scholar] [CrossRef] [Green Version]
  29. Sherstneva, O.N.; Vodeneev, V.A.; Surova, L.M.; Novikova, E.M.; Sukhov, V.S. Application of a mathematical model of variation potential for analysis of its influence on photosynthesis in higher plants. Biochem. Mosc. Suppl. Ser. A 2016, 10, 269–277. [Google Scholar] [CrossRef]
  30. Gallé, A.; Lautner, S.; Flexas, J.; Ribas-Carbo, M.; Hanson, D.; Roesgen, J.; Fromm, J. Photosynthetic responses of soybean (Glycine max L.) to heat-induced electrical signalling are predominantly governed by modifications of mesophyll conductance for CO2. Plant Cell Environ. 2013, 36, 542–552. [Google Scholar] [CrossRef]
  31. Fromm, J.; Lautner, S. Electrical signals and their physiological significance in plants. Plant Cell Environ. 2007, 30, 249–257. [Google Scholar] [CrossRef] [PubMed]
  32. Gallé, A.; Lautner, S.; Flexas, J.; Fromm, J. Environmental stimuli and physiological responses: The current view on electrical signalling. Environ. Exp. Bot. 2015, 114, 15–21. [Google Scholar] [CrossRef]
  33. Sukhov, V. Electrical signals as mechanism of photosynthesis regulation in plants. Photosynth. Res. 2016, 130, 373–387. [Google Scholar] [CrossRef]
  34. Sukhova, E.; Sukhov, V. Electrical signals, plant tolerance to actions of stressors, and programmed cell death: Is interaction possible? Plants 2021, 10, 1704. [Google Scholar] [CrossRef] [PubMed]
  35. Zimmermann, M.R.; Maischak, H.; Mithöfer, A.; Boland, W.; Felle, H.H. System potentials, a novel electrical long-distance apoplastic signal in plants, induced by wounding. Plant Physiol. 2009, 149, 1593–1600. [Google Scholar] [CrossRef]
  36. Zimmermann, M.R.; Mithöfer, A.; Will, T.; Felle, H.H.; Furch, A.C. Herbivore-triggered electrophysiological reactions: Candidates for systemic signals in higher plants and the challenge of their identification. Plant Physiol. 2016, 170, 2407–2419. [Google Scholar] [CrossRef] [PubMed] [Green Version]
  37. Tomás, M.; Flexas, J.; Copolovici, L.; Galmés, J.; Hallik, L.; Medrano, H.; Ribas-Carbó, M.; Tosens, T.; Vislap, V.; Niinemets, Ü. Importance of leaf anatomy in determining mesophyll diffusion conductance to CO2 across species: Quantitative limitations and scaling up by models. J. Exp. Bot. 2013, 64, 2269–2281. [Google Scholar] [CrossRef] [PubMed]
  38. Aalto, T.; Juurola, E. A three-dimensional model of CO2 transport in airspaces and mesophyll cells of a silver birch leaf. Plant Cell Environ. 2002, 25, 1399–1409. [Google Scholar] [CrossRef]
  39. Buckley, T.N.; Farquhar, G.D. A new analytical model for whole-leaf potential electron transport rate. Plant Cell Environ. 2004, 27, 1487–1502. [Google Scholar] [CrossRef]
  40. Ho, Q.T.; Berghuijs, H.N.; Watté, R.; Verboven, P.; Herremans, E.; Yin, X.; Retta, M.A.; Aernouts, B.; Saeys, W.; Helfen, L.; et al. Three-dimensional microscale modelling of CO2 transport and light propagation in tomato leaves enlightens photosynthesis. Plant Cell Environ. 2016, 39, 50–61. [Google Scholar] [CrossRef] [PubMed] [Green Version]
  41. Sukhova, E.M.; Vodeneev, V.A.; Sukhov, V.S. Mathematical modeling of photosynthesis and analysis of plant productivity. Biochem. Mosc. Suppl. Ser. A Membr. Cell Biol. 2021, 15, 52–72. [Google Scholar] [CrossRef]
  42. Sukhova, E.; Ratnitsyna, D.; Gromova, E.; Sukhov, V. Development of two-dimensional model of photosynthesis in plant leaves and analysis of induction of spatial heterogeneity of CO2 assimilation rate under action of excess light and drought. Plants 2022, 11, 3285. [Google Scholar] [CrossRef]
  43. Pavlovič, A. The effect of electrical signals on photosynthesis and respiration. In Plant Electrophysiology; Volkov, A., Ed.; Springer: Berlin/Heidelberg, Germany, 2012; pp. 33–62. [Google Scholar]
  44. Szechyńska-Hebda, M.; Lewandowska, M.; Karpiński, S. Electrical signaling, photosynthesis and systemic acquired acclimation. Front Physiol. 2017, 8, 684. [Google Scholar] [CrossRef] [PubMed]
  45. Chatterjee, S.K.; Das, S.; Maharatna, K.; Masi, E.; Santopolo, L.; Mancuso, S.; Vitaletti, A. Exploring strategies for classification of external stimuli using statistical features of the plant electrical response. J. R. Soc. Interface 2015, 12, 20141225. [Google Scholar] [CrossRef] [PubMed]
  46. Souza, G.M.; Ferreira, A.S.; Saraiva, G.F.; Toledo, G.R. Plant “electrome” can be pushed toward a self-organized critical state by external cues: Evidences from a study with soybean seedlings subject to different environmental conditions. Plant Signal. Behav. 2017, 12, e1290040. [Google Scholar] [CrossRef] [PubMed]
  47. Chatterjee, S.K.; Malik, O.; Gupta, S. Chemical sensing employing plant electrical signal response-classification of stimuli using curve fitting coefficients as features. Biosensors 2018, 8, 83. [Google Scholar] [CrossRef] [Green Version]
  48. Winter, H.; Robinson, D.G.; Heldt, H.W. Subcellular volumes and metabolite concentrations in spinach leaves. Planta 1994, 193, 530–535. [Google Scholar] [CrossRef]
  49. Farquhar, G.D.; von Caemmerer, S.; Berry, J.A. A biochemical model of photosynthetic CO2 assimilation in leaves of C3 species. Planta 1980, 149, 78–90. [Google Scholar] [CrossRef] [PubMed] [Green Version]
  50. Sukhov, V.S.; Vodeneev, V.A. Mathematical model of action potential in higher plant. In Mathematics, Computing, Education. Regular and Chaotic Dynamics; Riznichenko, G.Y., Ed.; Moskow-Izhevsk: Moscow, Russia, 2005; pp. 267–278. (In Russian) [Google Scholar]
  51. Sukhova, E.; Ratnitsyna, D.; Sukhov, V. Stochastic spatial heterogeneity in activities of H+-ATP-ases in electrically connected plant cells decreases threshold for cooling-induced electrical responses. Int. J. Mol. Sci. 2021, 22, 8254. [Google Scholar] [CrossRef]
  52. Gradmann, D. Impact of apoplast volume on ionic relations in plant cells. J. Membr. Biol. 2001, 184, 61–69. [Google Scholar] [CrossRef] [PubMed]
  53. Sukhova, E.; Akinchits, E.; Sukhov, V. Mathematical models of electrical activity in plants. J. Membr. Biol. 2017, 250, 407–423. [Google Scholar] [CrossRef]
  54. Sukhov, V.; Vodeneev, V. A mathematical model of action potential in cells of vascular plants. J. Membr. Biol. 2009, 232, 59–67. [Google Scholar] [CrossRef] [PubMed]
  55. Hansen, U.-P.; Gradmann, D.; Sanders, D.; Slayman, C.L. Interpretation of current-voltage relationships for ‘‘active’’ ion transport systems: I. Steady-state reaction-kinetic analysis of class-I mechanisms. J Membr. Biol. 1981, 63, 165–190. [Google Scholar] [PubMed]
  56. Hansen, U.-P.; Tittor, J.; Gradmann, D. Interpretation of current voltage relationships for ‘‘active’’ ion transport systems: II. Nonsteady-state reaction kinetic analysis of class-I mechanisms with one slow time-constant. J. Membr. Biol. 1983, 75, 141–169. [Google Scholar] [CrossRef] [PubMed]
  57. Kinoshita, T.; Shimazaki, K. Blue light activates the plasma membrane H+-ATPase by phosphorylation of the C-terminus in stomatal guard cells. EMBO J. 1999, 18, 5548–5558. [Google Scholar] [CrossRef] [PubMed]
  58. Sukhov, V.; Nerush, V.; Orlova, L.; Vodeneev, V. Simulation of action potential propagation in plants. J. Theor. Biol. 2011, 291, 47–55. [Google Scholar] [CrossRef] [PubMed]
  59. Théroux Rancourt, G.; Éthier, G.; Pepin, S. Greater efficiency of water use in poplar clones having a delayed response of mesophyll conductance to drought. Tree Physiol. 2015, 35, 172–184. [Google Scholar] [CrossRef] [Green Version]
  60. Shrestha, A.; Buckley, T.N.; Lockhart, E.L.; Barbour, M.M. The response of mesophyll conductance to short- and long-term environmental conditions in chickpea genotypes. AoB Plants 2018, 11, ply073. [Google Scholar] [CrossRef] [PubMed] [Green Version]
  61. Evans, J.R.; Kaldenhoff, R.; Genty, B.; Terashima, I. Resistances along the CO2 diffusion pathway inside leaves. J. Exp. Bot. 2009, 60, 2235–2248. [Google Scholar] [CrossRef] [PubMed] [Green Version]
  62. Batra, N.G.; Sharma, V.; Kumari, N. Drought-induced changes in chlorophyll fluorescence, photosynthetic pigments, and thylakoid membrane proteins of Vigna radiata. J. Plant Interact. 2014, 9, 712–721. [Google Scholar] [CrossRef] [Green Version]
  63. Guo, Y.Y.; Yu, H.Y.; Kong, D.S.; Yan, F.; Zhang, Y.-J. Effects of drought stress on growth and chlorophyll fluorescence of Lycium ruthenicum Murr. seedlings. Photosynthetica 2016, 54, 524–531. [Google Scholar] [CrossRef]
  64. Li, P.; Zhu, Y.; Song, X.; Song, F. Negative effects of long-term moderate salinity and short-term drought stress on the photosynthetic performance of Hybrid Pennisetum. Plant Physiol. Biochem. 2020, 155, 93–104. [Google Scholar] [CrossRef] [PubMed]
  65. Yudina, L.; Sherstneva, O.; Sukhova, E.; Grinberg, M.; Mysyagin, S.; Vodeneev, V.; Sukhov, V. Inactivation of H+-ATPase participates in the influence of variation potential on photosynthesis and respiration in peas. Plants 2020, 9, 1585. [Google Scholar] [CrossRef] [PubMed]
  66. Sukhov, V.; Sukhova, E.; Vodeneev, V. Long-distance electrical signals as a link between the local action of stressors and the systemic physiological responses in higher plants. Progr. Biophys. Mol. Biol. 2019, 146, 63–84. [Google Scholar]
  67. Kume, A.; Akitsu, T.; Nasahara, K.N. Why is chlorophyll b only used in light-harvesting systems? J. Plant Res. 2018, 131, 961–972. [Google Scholar] [CrossRef] [Green Version]
  68. Pavlovič, A.; Slováková, L.; Pandolfi, C.; Mancuso, S. On the mechanism underlying photosynthetic limitation upon trigger hair irritation in the carnivorous plant Venus flytrap (Dionaea muscipula Ellis). J. Exp. Bot. 2011, 62, 1991–2000. [Google Scholar] [CrossRef] [PubMed]
  69. Demmig-Adams, B. Carotenoids and photoprotection in plants: A role for the xanthophyll zeaxanthin. Biochim. Biophys. Acta 1990, 1020, 1–24. [Google Scholar] [CrossRef]
  70. Gamon, J.A.; Serrano, L.; Surfus, J.S. The photochemical reflectance index: An optical indicator of photosynthetic radiation use efficiency across species, functional types, and nutrient levels. Oecologia 1997, 112, 492–501. [Google Scholar] [CrossRef] [PubMed]
  71. Filella, I.; Porcar-Castell, A.; Munné-Bosch, S.; Bäck, J.; Garbulsky, M.F.; Peñuelas, J. PRI assessment of long-term changes in carotenoids/chlorophyll ratio and short-term changes in de-epoxidation state of the xanthophyll cycle. Int. J. Remote Sens. 2009, 30, 4443–4455. [Google Scholar] [CrossRef]
  72. Grams, T.E.; Koziolek, C.; Lautner, S.; Matyssek, R.; Fromm, J. Distinct roles of electric and hydraulic signals on the reaction of leaf gas exchange upon re-irrigation in Zea mays L. Plant Cell Environ. 2007, 30, 79–84. [Google Scholar] [CrossRef] [PubMed]
  73. Grams, T.E.; Lautner, S.; Felle, H.H.; Matyssek, R.; Fromm, J. Heat-induced electrical signals affect cytoplasmic and apoplastic pH as well as photosynthesis during propagation through the maize leaf. Plant Cell Environ. 2009, 32, 319–326. [Google Scholar] [CrossRef]
  74. Bernacchi, C.J.; Rosenthal, D.M.; Pimentel, C.; Long, S.P.; Farquhar, G.D. Modeling the temperature dependence of C3. In Photosynthesis in silico. Advances in Photosynthesis and Respiration; Laisk, A., Nedbal, L., Govindjee, G., Eds.; Springer: Dordrecht, The Netherlands, 2009; Volume 29, pp. 231–246. [Google Scholar]
  75. Day, T.A.; Vogelmann, T.C. Alterations in photosynthesis and pigment distributions in pea leaves following UV-B exposure. Physiol. Plant. 1995, 94, 433–440. [Google Scholar] [CrossRef]
  76. Antal, T.K.; Kovalenko, I.B.; Rubin, A.B.; Tyystjärvi, E. Photosynthesis-related quantities for education and modeling. Photosynth. Res. 2013, 117, 1–30. [Google Scholar] [CrossRef]
  77. Roeske, C.A.; Chollet, R. Role of metabolites in the reversible light activation of pyruvate, orthophosphate dikinase in Zea mays mesophyll cells in Vivo. Plant Physiol. 1989, 90, 330–337. [Google Scholar] [CrossRef] [PubMed] [Green Version]
  78. Wang, Y.; Wu, W.H. Plant sensing and signaling in response to K+-deficiency. Mol. Plant. 2010, 3, 280–287. [Google Scholar] [CrossRef] [PubMed]
Figure 1. (a) A general scheme of the two-dimensional model of photosynthesis in a leaf. The simulated leaf is round and is composed of cells which are connected through the apoplast. Small arrows show transport of carbon dioxide, H+, and K+ between apoplastic volumes of neighboring cells and across the plasma membrane. PAR is the photosynthetically active radiation. (b) A description of ion and CO2 fluxes, the activities of ion transporters, buffer capacities, and photosynthetic and respiratory processes simulated by the model. pHap, pHcyt, and pHstr are the pH in the apoplast, cytoplasm, and stroma of chloroplasts, respectively. Bcyt and BcytH are the free and proton-bound cytoplasmic buffers. Bap, BapH, and BapK are the free, proton-bound, and potassium-bound apoplastic buffers. Em is the gradient of electrical potential across the plasma membrane. FvCB-model is the Farquhar–von Caemmerer–Berry model. The main systems of ion transport at rest, including H+-ATP-ases, H+/K+-antiporters, inwardly rectifying K+ channels, and outwardly rectifying K+ channels are described in the two-dimensional photosynthetic model. The schemes from [42], with modifications, are used.
Plants 11 03435 g001
Figure 2. Light dependence of the photosynthetic CO2 assimilation rate Ahv (a) and the coefficient of variation of assimilation CV(Ahv) (b). PAR is photosynthetically active radiation. Each stomata in the simulated leaf was located in center of a 3 × 3 cell square or a 5 × 5 cell square. The basic values of the model parameters were used.
Plants 11 03435 g002
Figure 3. Simulated dependence of the photosynthetic CO2 assimilation rate (Ahv) on the H+-ATPase activity in variants with stomata located in center of the 3 × 3 cell square (a) or in center of the 5 × 5 cell square (b) under various intensities of PAR. The value of the H+-ATPase activity from our previous work [42] was used as 100%.
Plants 11 03435 g003
Figure 4. Simulated dependence of variation coefficient of spatial distribution of the photosynthetic CO2 assimilation rate (CV(Ahv)) on the H+-ATPase activity in variants with stomata located in center of 3 × 3 cells square (a) or in center of 5 × 5 cells square (b) under various intensities of PAR. Value of the H+-ATPase activity from our previous work [42] was used as 100%.
Plants 11 03435 g004
Figure 5. Dependence of the photosynthetic CO2 assimilation rate (Ahv) (a) and the coefficient of variation of the spatial distribution of this rate (CV(Ahv)) (b) on the plasma membrane CO2 conductance under PAR intensity equaling to 221 μmol m−2 s−1. Each stomata in the simulated leaf was located in center of a 3 × 3 cell square or in center of a 5 × 5 cell square. The value of the plasma membrane CO2 conductance from our previous work [42] was used as 100%.
Plants 11 03435 g005
Figure 6. Dependence of the photosynthetic CO2 assimilation rate (Ahv) (a) and the coefficient of variation of the spatial distribution of this rate (CV(Ahv)) (b) on the CO2 conductance of chloroplast envelopes under PAR intensity equaling to 221 μmol m−2 s−1. Each stomata in the simulated leaf was located in center of a 3 × 3 cell square or in center of a 5 × 5 cell square. The value of the CO2 conductance of chloroplast envelopes from our previous work [42] was used as 100%.
Plants 11 03435 g006
Table 1. Simulated dependence of Ahv on the plasma membrane CO2 conductance and H+-ATPase activity under PAR intensity equal to 221 μmol m−2 s−1. Each stomata in the simulated leaf was located in center of a 3 × 3 cell square. The values of the H+-ATPase activity and plasma membrane CO2 conductance from our previous work [42] were used as 100%.
Plasma Membrane
Conductance for CO2, %
H+-ATPase Activity, %
2550100200400
103.91733.89423.89033.88103.8814
306.07216.01035.98165.97945.9878
1007.63917.55817.50137.47317.4587
3008.13198.02467.97337.96317.9688
6008.27788.16768.11478.10398.1097
10008.35548.22568.17228.16128.1669
Table 2. Simulated dependence of CV(Ahv) on simultaneous changes in plasma membrane CO2 conductance and H+-ATPase activity under PAR intensity equal to 221 μmol m−2 s−1. Each stomata in the simulated leaf was located in center of a 3 × 3 cell square. The values of the H+-ATPase activity and plasma membrane CO2 conductance from our previous work [42] were used as 100%.
Plasma Membrane
Conductance for CO2, %
H+-ATPase Activity, %
2550100200400
100.0212150.0248050.0271330.0285070.029249
300.0440120.0513820.0561180.0587930.060186
1000.0539480.0627380.0689330.0728290.075273
3000.056960.0668340.0730890.0765350.078442
6000.0570050.0669420.0732310.0766780.078577
10000.0564460.0669440.073240.0766870.078579
Publisher’s Note: MDPI stays neutral with regard to jurisdictional claims in published maps and institutional affiliations.

