1. Introduction
A ground mobile mapping system (MMS) mounted with multiple sensors such as a mono/stereo camera, panoramic camera, laser scanner, and GPS/INS (global positioning system/inertial navigation system) has shown a wide range of implications in city planning, 2D/3D map making, traffic surveillance, and autonomous cars [
1,
2,
3,
4]. A challenge is to effectively locate objects of interest, such as manhole covers, telegraph poles, building corners, and so on, from multi-view images acquainted by an MMS, for constructing and maintaining georeferenced datasets of certain objects [
5,
6]. An intuitive solution is to automatically recognize the designated object instances with high precision and recall rate, then calculate their geolocation by GPS/INS and triangulation according to specific points in objects (for example, the geometric center of a manhole cover or the base of a pole). However, this solution can hardly be approached in practice with the difficulty of accurately extracting and segmenting objects. To construct a highly accurate object dataset for traffic maps or 3D city maps, manual recognition and measuring are still necessary.
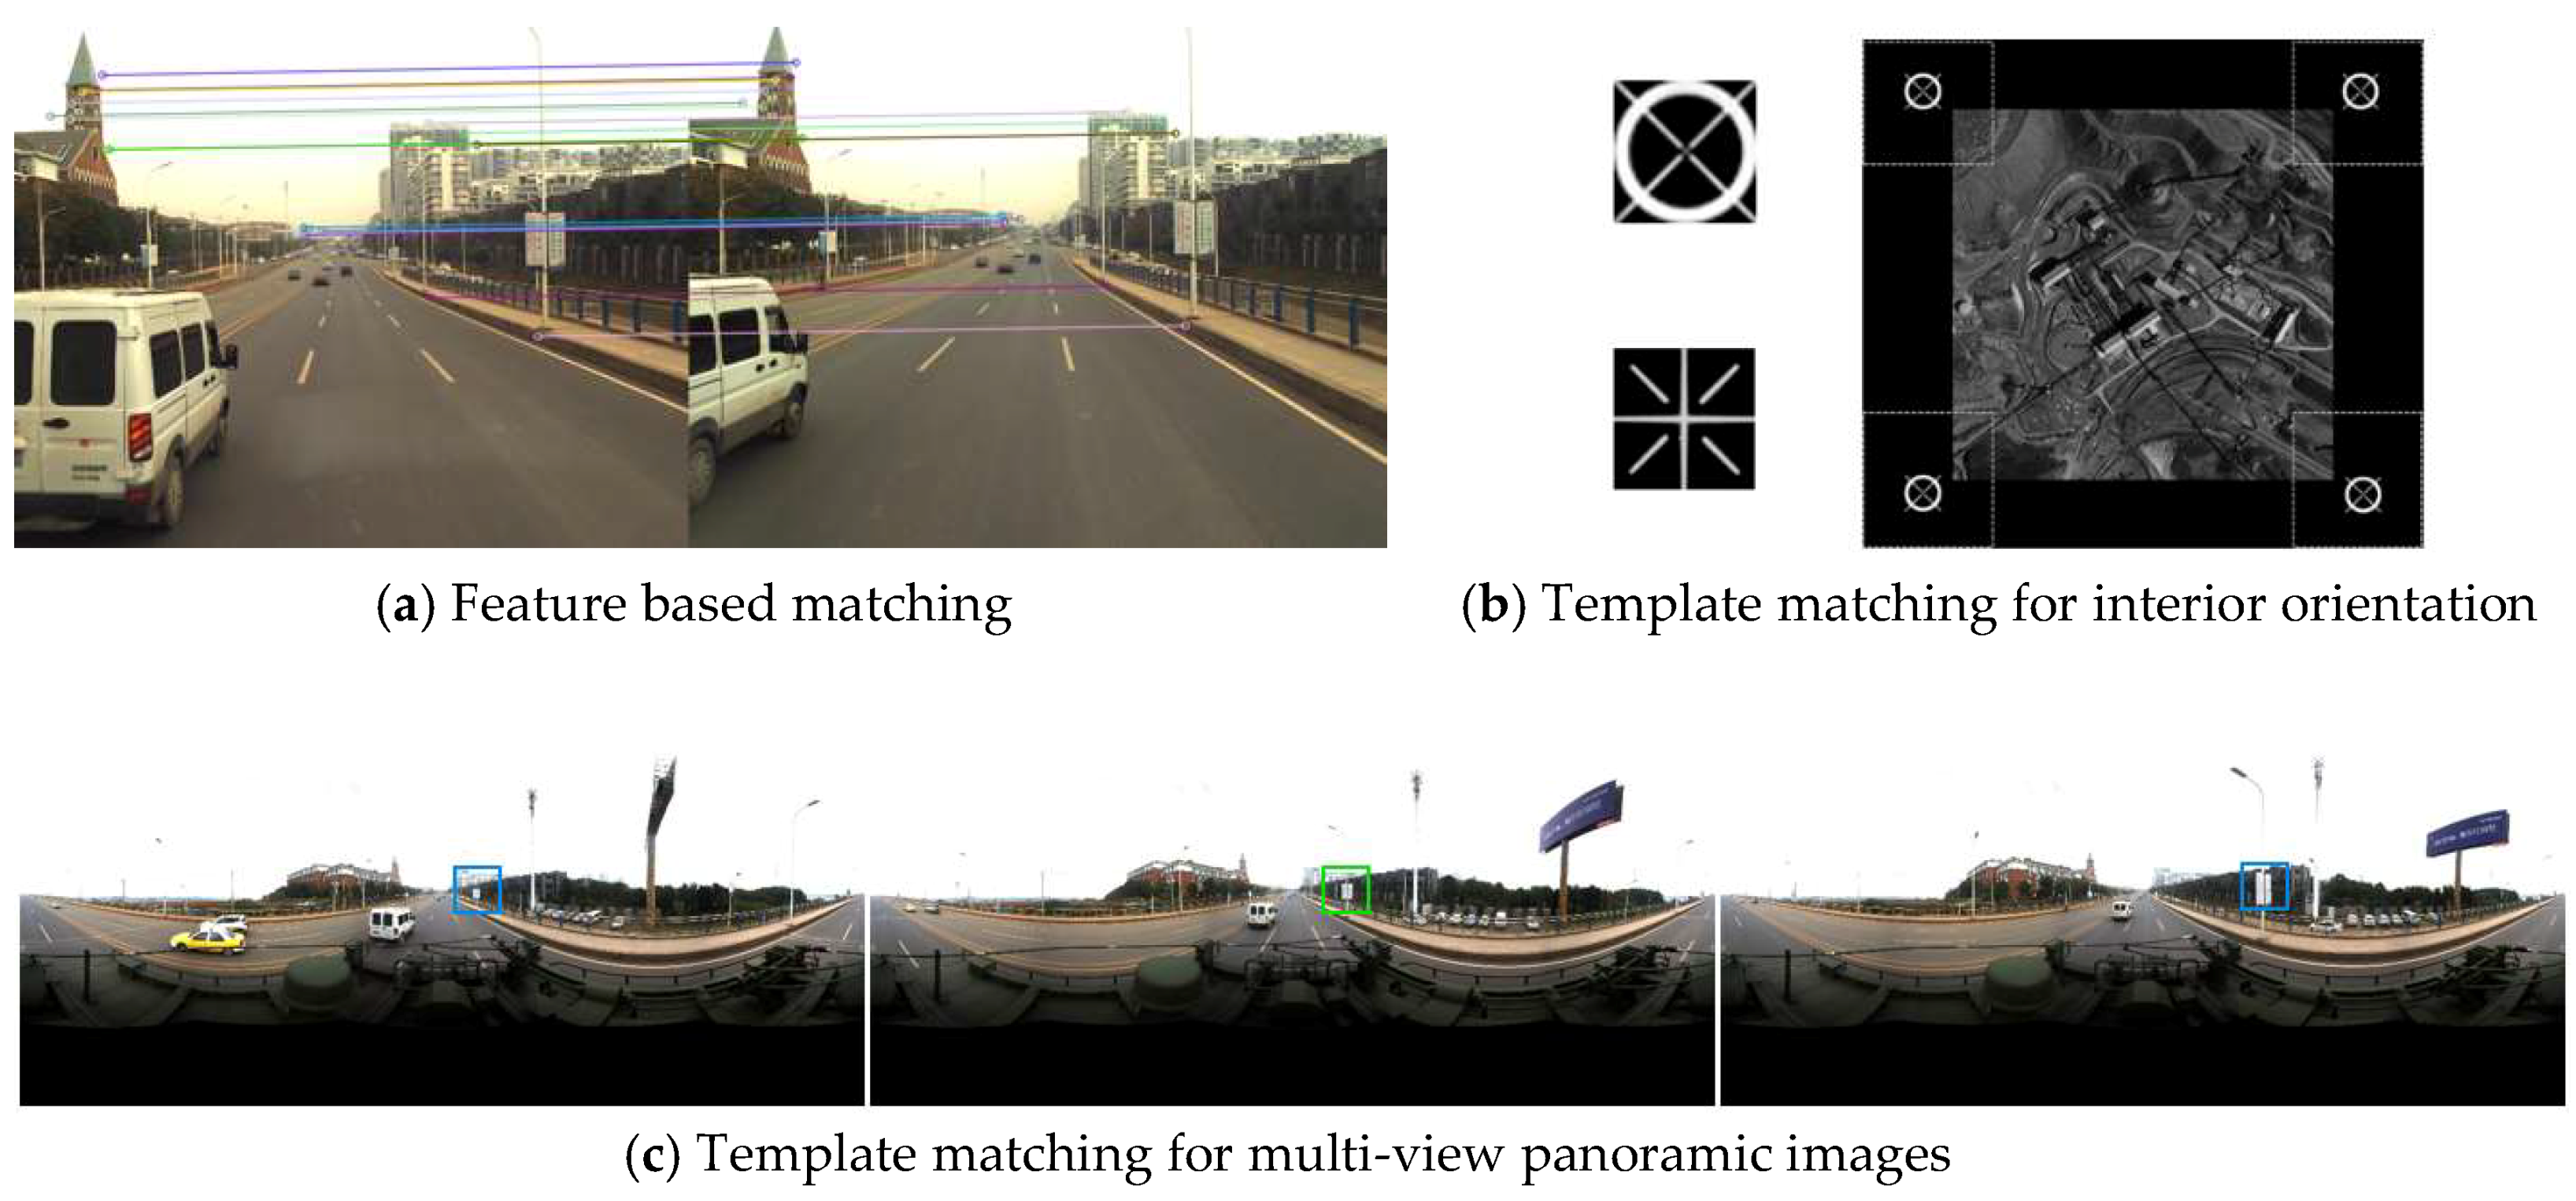
In this paper, we automatically identify correspondences from multi-view images given a user-specified object in one of the images. With the correspondences, 3D world coordinates of the object could be calculated using GPS/INS. The strategy can greatly reduce the manual work of selecting at least two correspondent points from stereo or multi-view images. One technology that has been used for specific object recognition is called template matching [
7,
8]. In contrast to a common sparse stereo matching, which typically extracts arbitrary features from images and then matches them [
9,
10] (see
Figure 1a), template matching finds corresponding objects or image patches given a template.
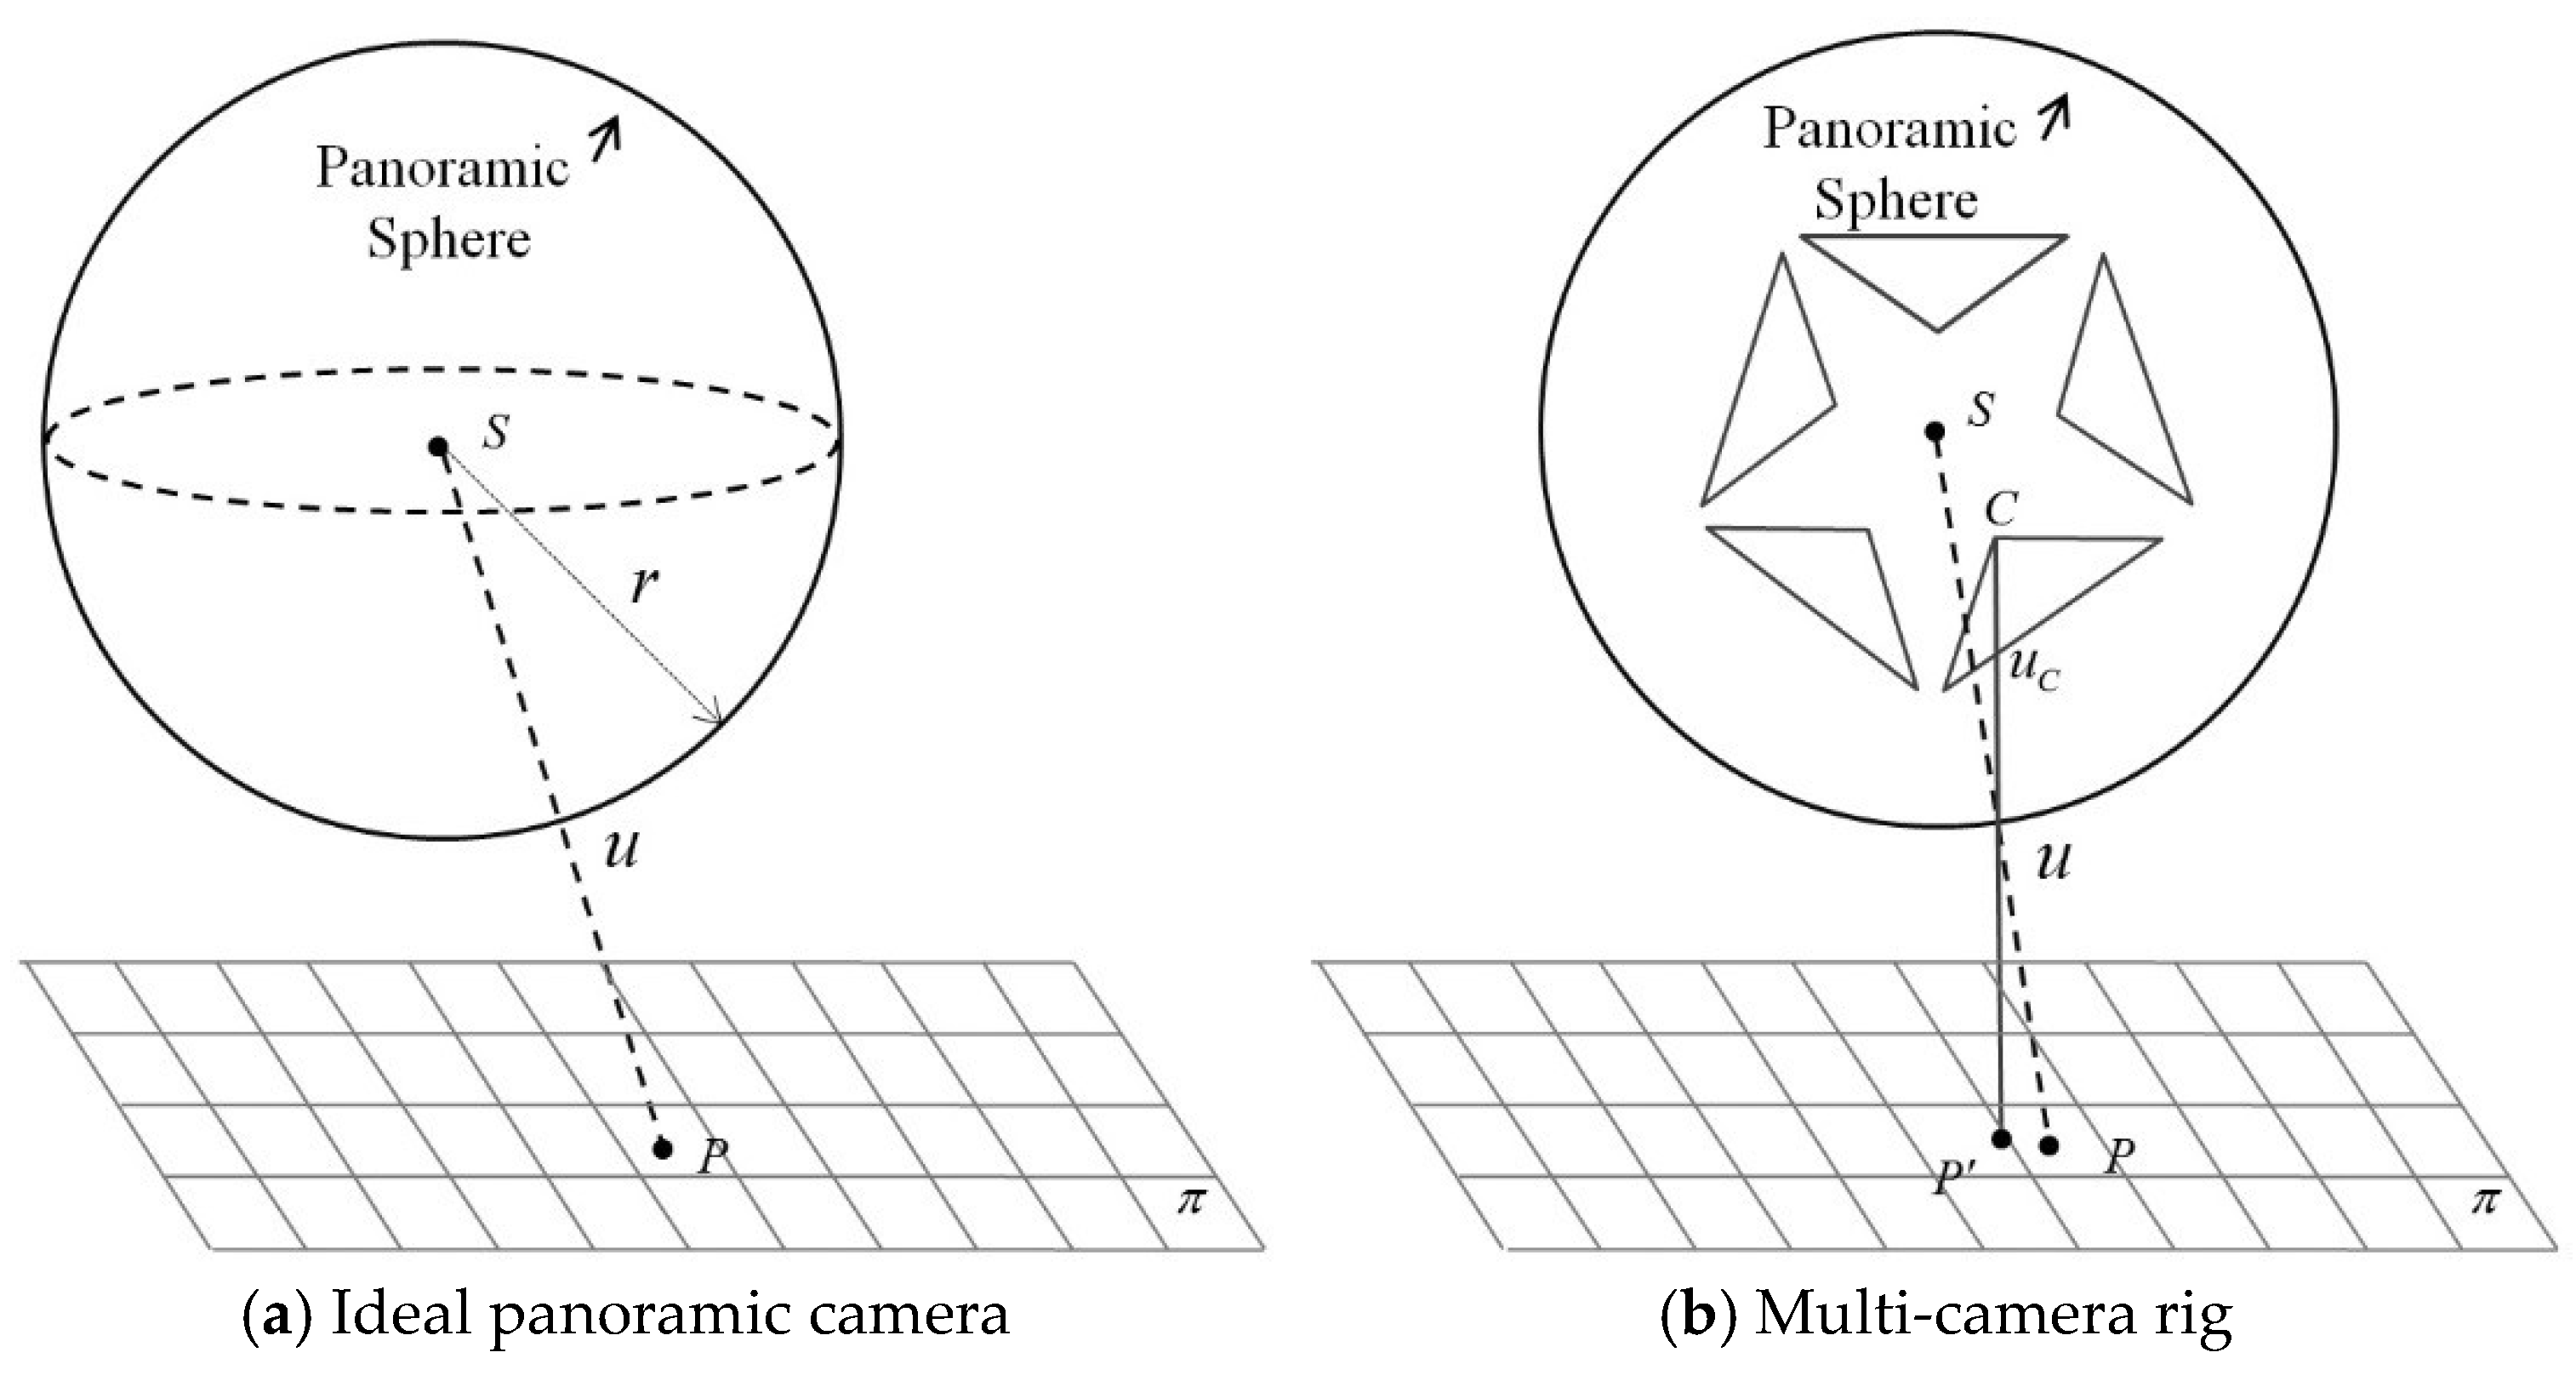
Figure 1b shows a classic case in early film photogrammetry where four fiducial marks are matched to the corresponding template for precise interior orientation. In this study, we aim to automatically locate a user-specified object in multi-view panoramic images through template matching (
Figure 1c).
The main advantage of a panoramic camera over a mono/stereo camera is that it covers a 360° scene at one shot. Its sensor models and applications have been studied for years. The spherical perspective [
11], global description of omni-directional images [
12], and rotation and scale invariance of image patches [
13] of a spherical camera have been studied theoretically. However, no physical spherical camera has been produced due to the challenging manufacturing process. One type of manufactured panoramic camera, called a catadioptric camera, utilizes a paraboloid mirror to reflect light from all around a scene into a lens for light collecting. Geyer and Daniilidis gave detailed projective geometry for a catadioptric panoramic sensor [
14]. Barreto and Araujo studied the geometry of the catadioptric projection of lines and its use in calibration [
15]. Another type of panoramic camera uses a high-speed rotating CCD to collect a 360°-cylinder scene [
16]. The third and the most popular panoramic camera used in an MMS is called multi-camera rig system, which consists of a series of fisheye lenses. Shi et al. proposed a rigorous model for a multi-camera rig and integrated the model into a GPS-supported simultaneous localization and mapping (SLAM) [
17]. Kaess and Dellaert used a multi-camera rig for a SLAM with an ideal spherical model [
18]. Ji et al. compared the difference between the ideal model and the rigorous model in indoor and outdoor scenes [
19].
Although a popular substitute for the ideal omnidirectional camera, the multi-camera rig is limited by the current manufacturing techniques: the projection center of each fisheye lens hardly overlaps and the optical axis of each lens seldom lies in the same plane; the separate fisheye images are stitched to a panoramic image with inevitable stitching errors. These technical limitations restrain the applications of 3D street scene reconstruction and high-precision surveying. However, the multi-camera rig could be used to measure objects of interest with an accuracy of decimeter level. In [
19], the localization error has been analyzed, and experimentally proved to be less than 0.2 m. In this paper, we leverage multi-view panoramic images captured from a multi-camera rig to locate user-specified objects and focus the work on the challenges of applying template matching to detect distorted objects from panoramic images.
Three problems of using a multi-camera rig in template matching should be addressed. First, the wide baseline (e.g., 8 m) of a multi-camera causes significant perspective distortion between multi-view images. The distortions could beat some classic matching methods using absolution intensity difference or normalized correlation of image patches. Secondly, a panoramic camera introduces further geometric deformation. One part of the deformation is caused by the projection from a 3D sphere to a 2D image, which makes the epipolar no longer a line but a trigonometric curve. The other part is the stitching error raised from the camera model of a multi-camera rig. The stitching error cannot be eliminated without knowing the depth of the scene. An object farther away from the panoramic projection sphere (e.g., 20 m radius) has larger errors as its corresponding points in the adjacent fisheye images could not be overlapped with each other. Third, compared to an arbitrary feature matching where correspondences are compared in feature space, a template matching requires pixelwise searching in a given range in the original image. This indicates that the setting of an adequate search range may affect the efficiency and success rate, as a larger search range brings more false positives.
Considering these restrictions, our work focuses on two aspects. One is to investigate the epipolar geometry of the multi-camera rig and the epipolar accuracy that could be achieved. Shi et al. proposed the stereo geometry of a multi-camera rig and pointed out that the epipolar line is the intersection of the panoramic sphere and a 2D plane roughly passes through camera center [
17]. Ji et al. further analyzed the accuracy of the epipolar according to correspondent points in the stereo pairs [
19]. However, these studies do not explicitly provide the formula of the epipolar model of a multi-camera rig.
The other goal of our work is to develop an optimal feature descriptor or a robust template matching method that could match wide baseline panoramic images. The most used technology in template matching is normalized correlation with pixel values (intensity) [
20]. However, correlation could be defeated by any geometric distortion more than a shift. To make the descriptor (or similarity measure) more robust, the strategy used in the feature matching can be utilized. Although an object selected by a user (typically an image patch) does not satisfy the definition of an empirical feature, it can be described by any feature descriptor. For example, CENSUS is a simple and popular feature descriptor used in stereo matching, which consists of a sequence vector with binary elements comparing between a point of interest and its neighborhood [
21]. The descriptor used in the SURF feature consists of Haar wavelet responses in horizontal and vertical directions and the absolute values of these responses [
9]. The SIFT descriptor is a 128-dimensional bin-based gradient vector [
10].
Besides utilizing feature descriptors in template matching, several recent articles examined other strategies for template matching in challenging situations. Itamar et al. proposed a similarity measure named deformable diversity similarity for template matching based on properties of the nearest neighborhood [
22]. Shaul et al. used a measurement called Best-Buddies similarity to make template matching robust against complex geometric deformations and high levels of outliers [
23]. Wisarut et al. presented an adaptive template matching based on the sum of squared difference to enhance the matching quality in object tracking and reduce high computational cost [
24]. Wu et al. also proposed a method to speed-up template matching and decrease the computational costs of conventional methods [
25]. Yoo et al. presented a histogram-based template matching method for the situation of large-scale differences between target and template images [
26]. To deal with heavy appearance variations, Sun et al. proposed a multiple template method to track fast motion by generating virtual templates that are affinely transformed from the original one [
27]. Korman et al. also proposed a fast method for template matching considering 2D affine transformations [
28]. Hong et al. proposed a compact orientation templates (DOT) representation with a fast partial occlusion handling approach [
29]. Generally, an ideal template matching method should be effective and efficient. We propose an accelerated SIFT descriptor for template matching with improved effectivity and efficiency comparing to the most recent template matching methods that are considered robust.
The main contribution of the paper is to thoroughly investigate the challenging template matching on wide baseline multi-view panoramic images for the first time, and to propose a high performance matching method. In
Section 2, we review the camera and stereo geometry of a multi-camera rig and deduce the explicit epipolar model under a sphere projection. In
Section 3, we analyze the epipolar errors to constrain the searching range for a pixel-wise matching. Several feature descriptors are introduced to the template matching on multi-view panoramic images, and an efficient matching strategy that significantly alleviates computational costs is proposed. The experiments in
Section 4 are designed to evaluate the accuracy and efficiency of these matching methods. The discussion and conclusion are given in
Section 5 and
Section 6 respectively.
2. Geometry of A Multi-Camera Rig System
2.1. Ideal Panoramic Camera Model
An ideal spherical panoramic model represents the collinearity of an arbitrary 3D point
P with coordinate vector
Xp, the corresponding panoramic point
u with coordinate vector
X = [
x′,
y′,
z′], and the panoramic center S (
Figure 1a). In Equation (1),
R and
T are the rotation matrix and translation vector, respectively, and
λ is the scale difference between the panoramic and world coordinate systems. In Equation (2),
X is restricted on the surface of a sphere with radius
r.
Coordinate X can be obtained from a 2D image point x = [x, y]. In Equation (3), ϕh and ϕv are the horizontal angle with the range [−π, π] and the elevation angle with the range [−0.5π, 0.5π] respectively. w and h are the width and height of the panoramic image respectively. Equation (4) calculates sphere coordinate X using a right-hand coordinate system.
2.2. Rigorous Panoramic Camera Model
As is shown in
Figure 2b, a multi-camera rig is composed of five separate fish-eye lenses. The rigorous camera model is therefore a transformation from a world object
P′ to the corresponding projection point
uc on the fish-eye image (the solid line). For convenience, the fish-eye image coordinates are usually firstly transformed to a virtual plane camera coordinates by choosing a fisheye camera model [
30] and a calibration model [
31]; we denote the transformation as
Kc. Then, according to the rotation
Rc and translation
Tc between a fisheye camera and the virtual panoramic camera, Equation (5) describes a fisheye image point
uc with a coordinate
xc projected to the corresponding panoramic camera point
u with a coordinate
X.
Kc,
Rc,
Tc are typically fixed values with pre-calibration, and
k is the scale factor between the ideal plane and the panoramic sphere, which can be calculated by combining Equations (2) and (5).
The third step is to associate the obtained panoramic coordinate
X with its world coordinate
Xp. According to the solid line in
Figure 2b that passes
C,
u, and
P’, a more rigorous model could be constructed as Equation (6) where the projection centre lies in the fisheye camera.
Neither (1) nor (6) could fully compensate the geometric stitching errors caused by a multi-camera rig system. However, the projection centres of the separate fish-eye cameras C and the panoramic centre S are very close, and the angle between SP and CP’ is very small, which could ensure that by using (6) the projection errors of an object, within a certain distance to the projection sphere, are limited to less than one pixel. Note that every fisheye camera has its own translation parameter Tc to the panoramic camera.
In this paper, the rigorous camera model (5) and (6) is used for relative orientation and local bundle adjustment of panoramic image series for recovering the geometric relations between the adjacent multi-view images. The ideal camera model (1) is utilized to generate epipolar curve and to evaluate its accuracy, as the object is measured on a panoramic image with 360° covering.
2.3. Ideal Epipolar of Panoramic Stereo
Both the ideal and rigorous multi-camera model have their corresponding epipolar geometry. As points are matched in the stitched panoramic images other than separate fisheye images, only the epipolar of an ideal panoramic stereo is utilized.
We set the baseline B = [Bx By Bz] and the corresponding rays X1 = [X1 Y1 Z1] and X2 = [X2 Y2 Z2] in panoramic coordinates. X2’ = RX2 is the ray that has been translated to the coordinates of the left camera by a rotation R. Then we have
Equation (7) can be expanded by the third line of the determinant to obtain Equation (8), where a, b, and c are determined by X1 and R and a = ByZ1 − BzY1, b = BzX1 − BxZ1, c = TxY1 − TyX1. Combined with Equation (2), the epipolar line of ideal panoramic stereo images is a large circle through the panoramic camera centre.
Finally, we take Equations (3) and (4) into (8):
where (
x,
y) is pixel coordinate and
w and
h are the width and height of the image, respectively, indicating a trigonometric curve epipolar line of a panoramic stereo.
3. Multi-View Template Matching for Panoramic Images
3.1. Pre-Processing of Feature-Based Matching and Local Bundle Adjustment
The exterior orientation parameters obtained by the GPS/INS system could be utilized to recover epipolar geometry. However, we found the errors in GPS/INS observations could cause bias in images up to a dozen pixels. We execute relative orientation and local bundle adjustment to obtain the relative poses between adjacent images and use them to generate more accurate epipolar curves.
Firstly, SIFT features [
10] are extracted from fisheye images and then matched in stereo pairs with a GPU boosted strategy [
32]. Then, by transferring these matching candidates to panoramic coordinates with Equation (5), RANSAC [
33] is embedded into Equation (6) for outlier elimination. Third, the corresponding features in adjacent stereo pairs are used to recover the scale shift between them. Every 3D feature could vote a scale and the median value is used. In this study, we use only triple view geometry for panoramic epipolar generation and template matching, as we used a wide baseline up to 8 m. Some matching errors may remain in the triple view images after scale fusion. We execute bundle adjustment embedded with weight decaying methods for the three images according to Equation (6) to ensure all of the false correspondences are eliminated. Finally, we obtain the accurate relative poses between the multi-view panoramic images.
3.2. Error Estimation of Panoramic Epipolar
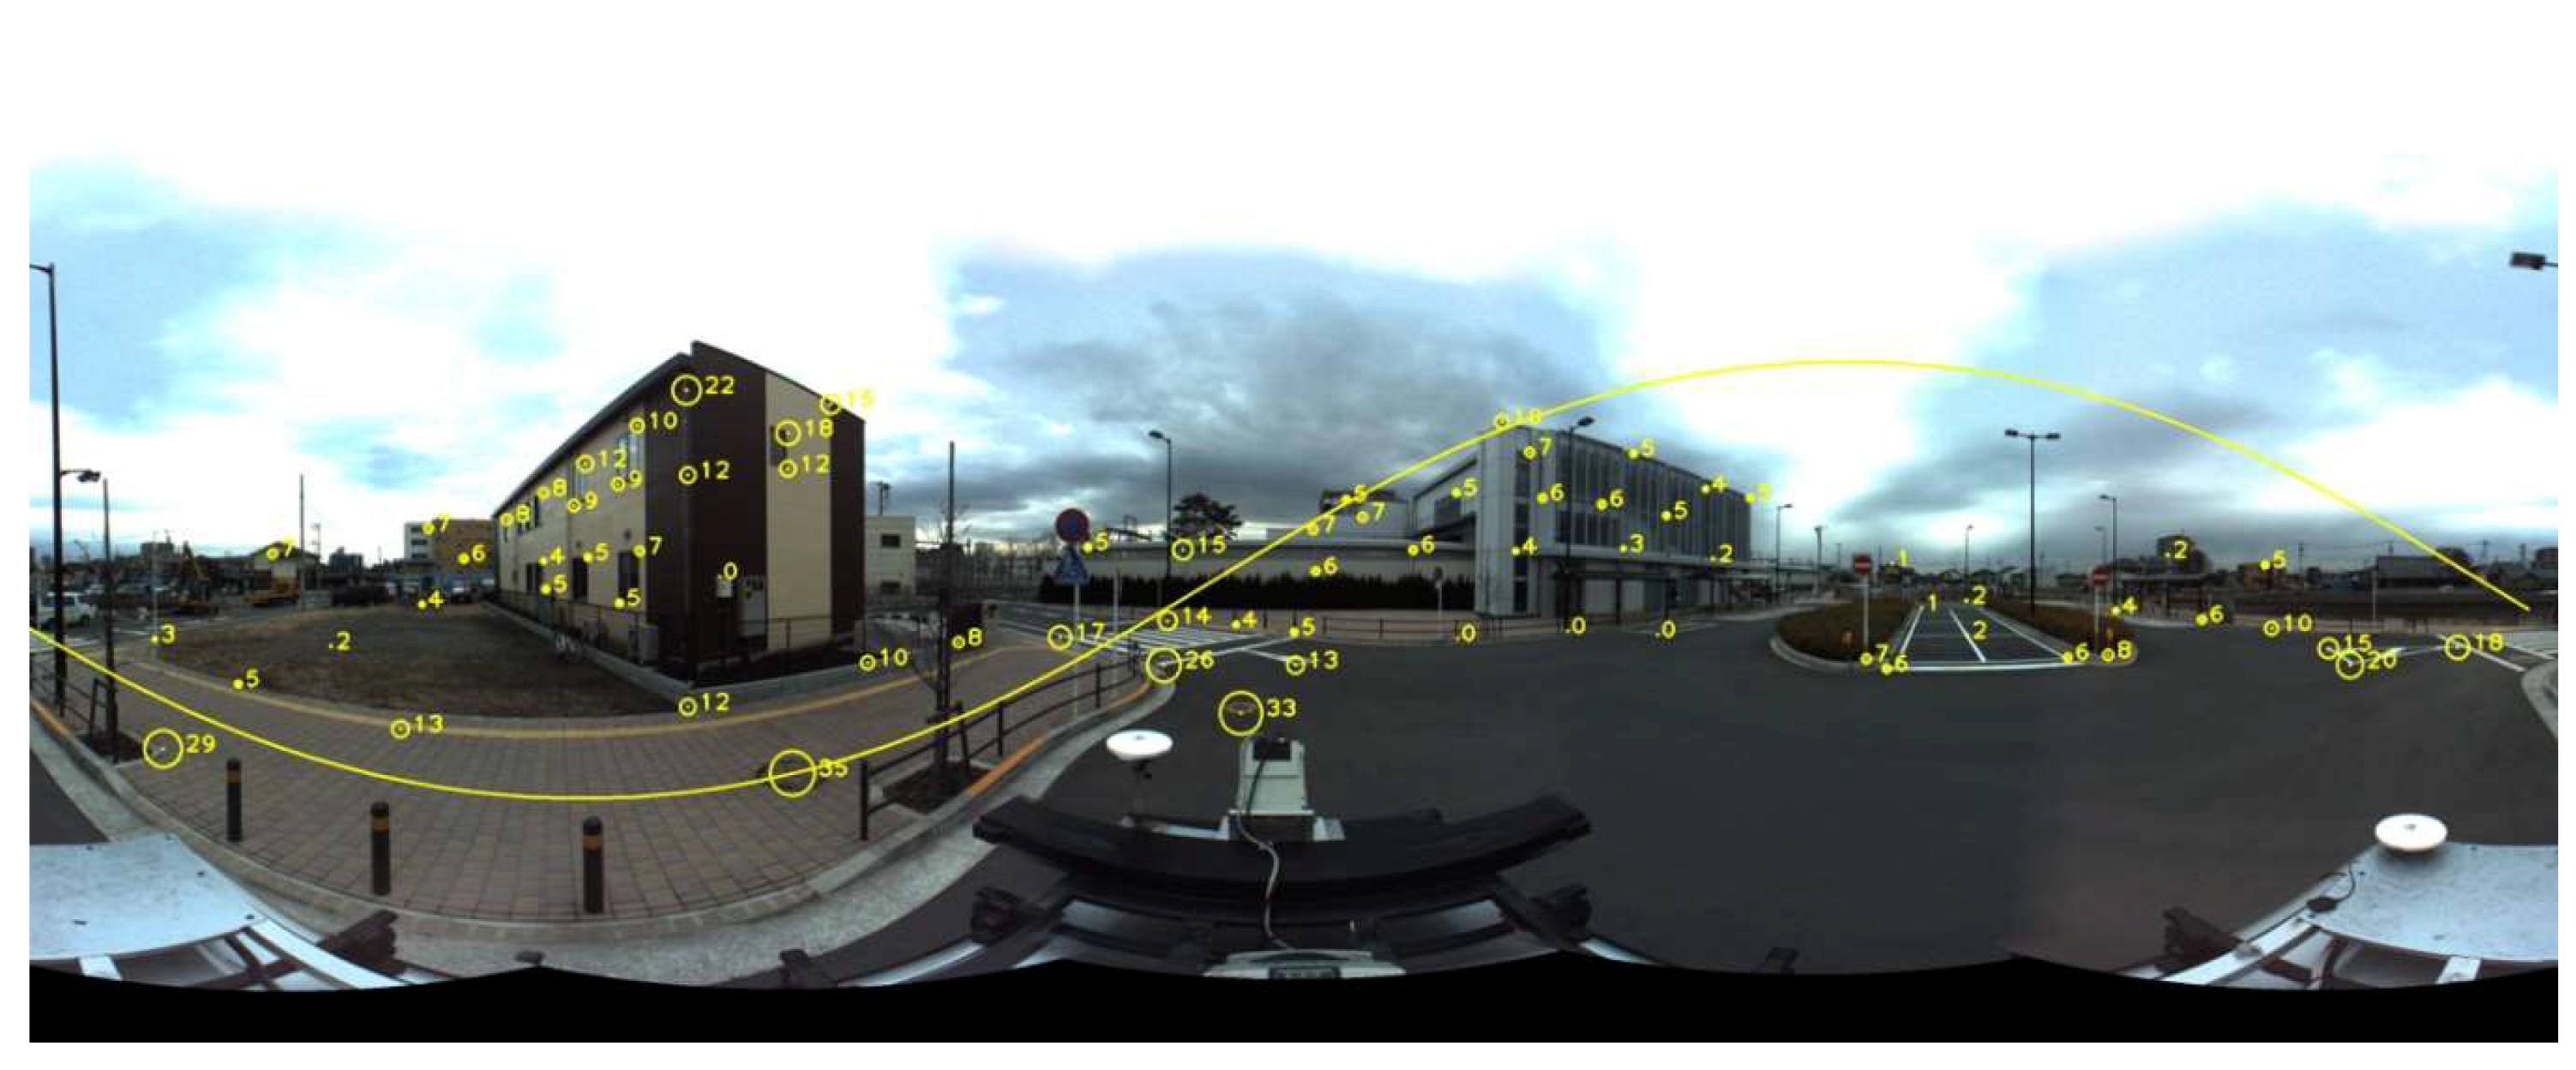
Based on Equation (9), we draw the epipolar line on a panoramic image with sphere projection. In
Figure 3, we evenly select points in the image and calculate the bias of the epipolar line, that is, the minimum distance between a true correspondent point and the epipolar line. According to
Table 1, the average bias is 8.29 pixels and the maximum bias is 35 pixels. Generally, nearer points exhibit larger errors, as observed in
Figure 3. We set a search range of 40 pixels in the orthogonal direction to the epipolar line to ensure every candidate is in the search area.
The search range along the epipolar line is determined in two ways. In one case, we set the depth of an object to be measured between 0.5~100 m without any support from a depth sensor. A distance farther than 100 m could cause rapid degeneration of localization accuracy and is ignored.
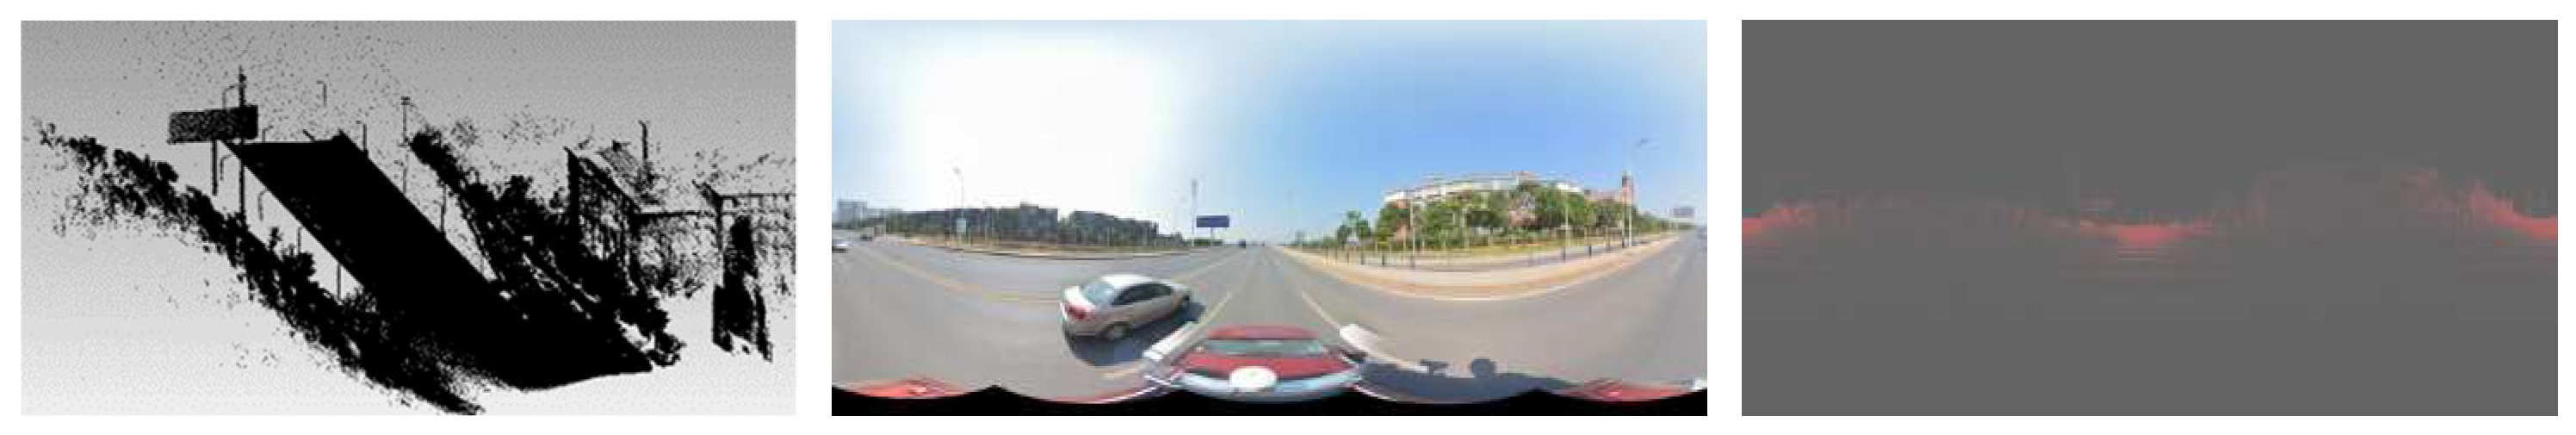
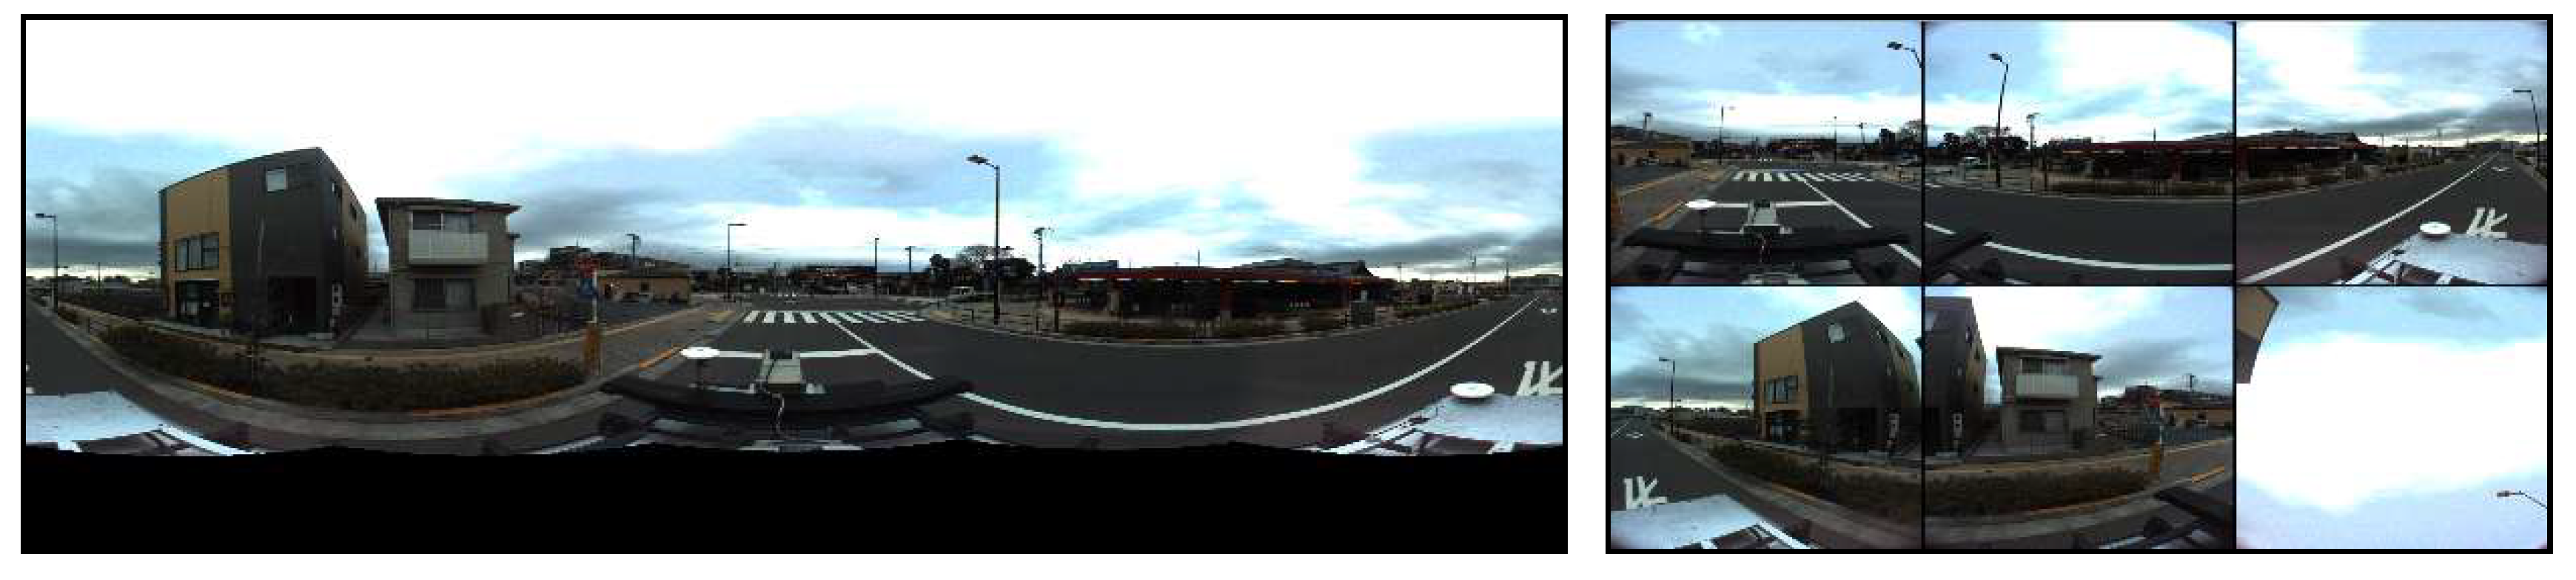
In the other case, a laser scanner is considered available for collecting sparse point cloud. The point cloud has been georeferenced by GPS/INS data and the pre-calibration parameters between the laser scanner and the GPS/INS system. We project 3D laser points to a virtual panoramic image according to the pose of the camera (obtained by GPS/INS data and the pre-calibration parameters between the GPS/INS system and the camera) and the sensor model (1). As shown in
Figure 4, the point cloud is sparse and sparser in larger depth. To make maximum use of the data, we set a search window for the given object point. The median value in this window is chosen as the depth of the object. In this paper, the length of the window is set to 20 pixels. Finally, the error range of a depth value
d is set to
d ±
n, where
n is empirically set to 2 m.
In both cases, the object with the assumed maximum and minimum depth is projected to the panoramic image respectively to be the two endpoints of an epipolar curve segment, for constraining the search range along the epipolar.
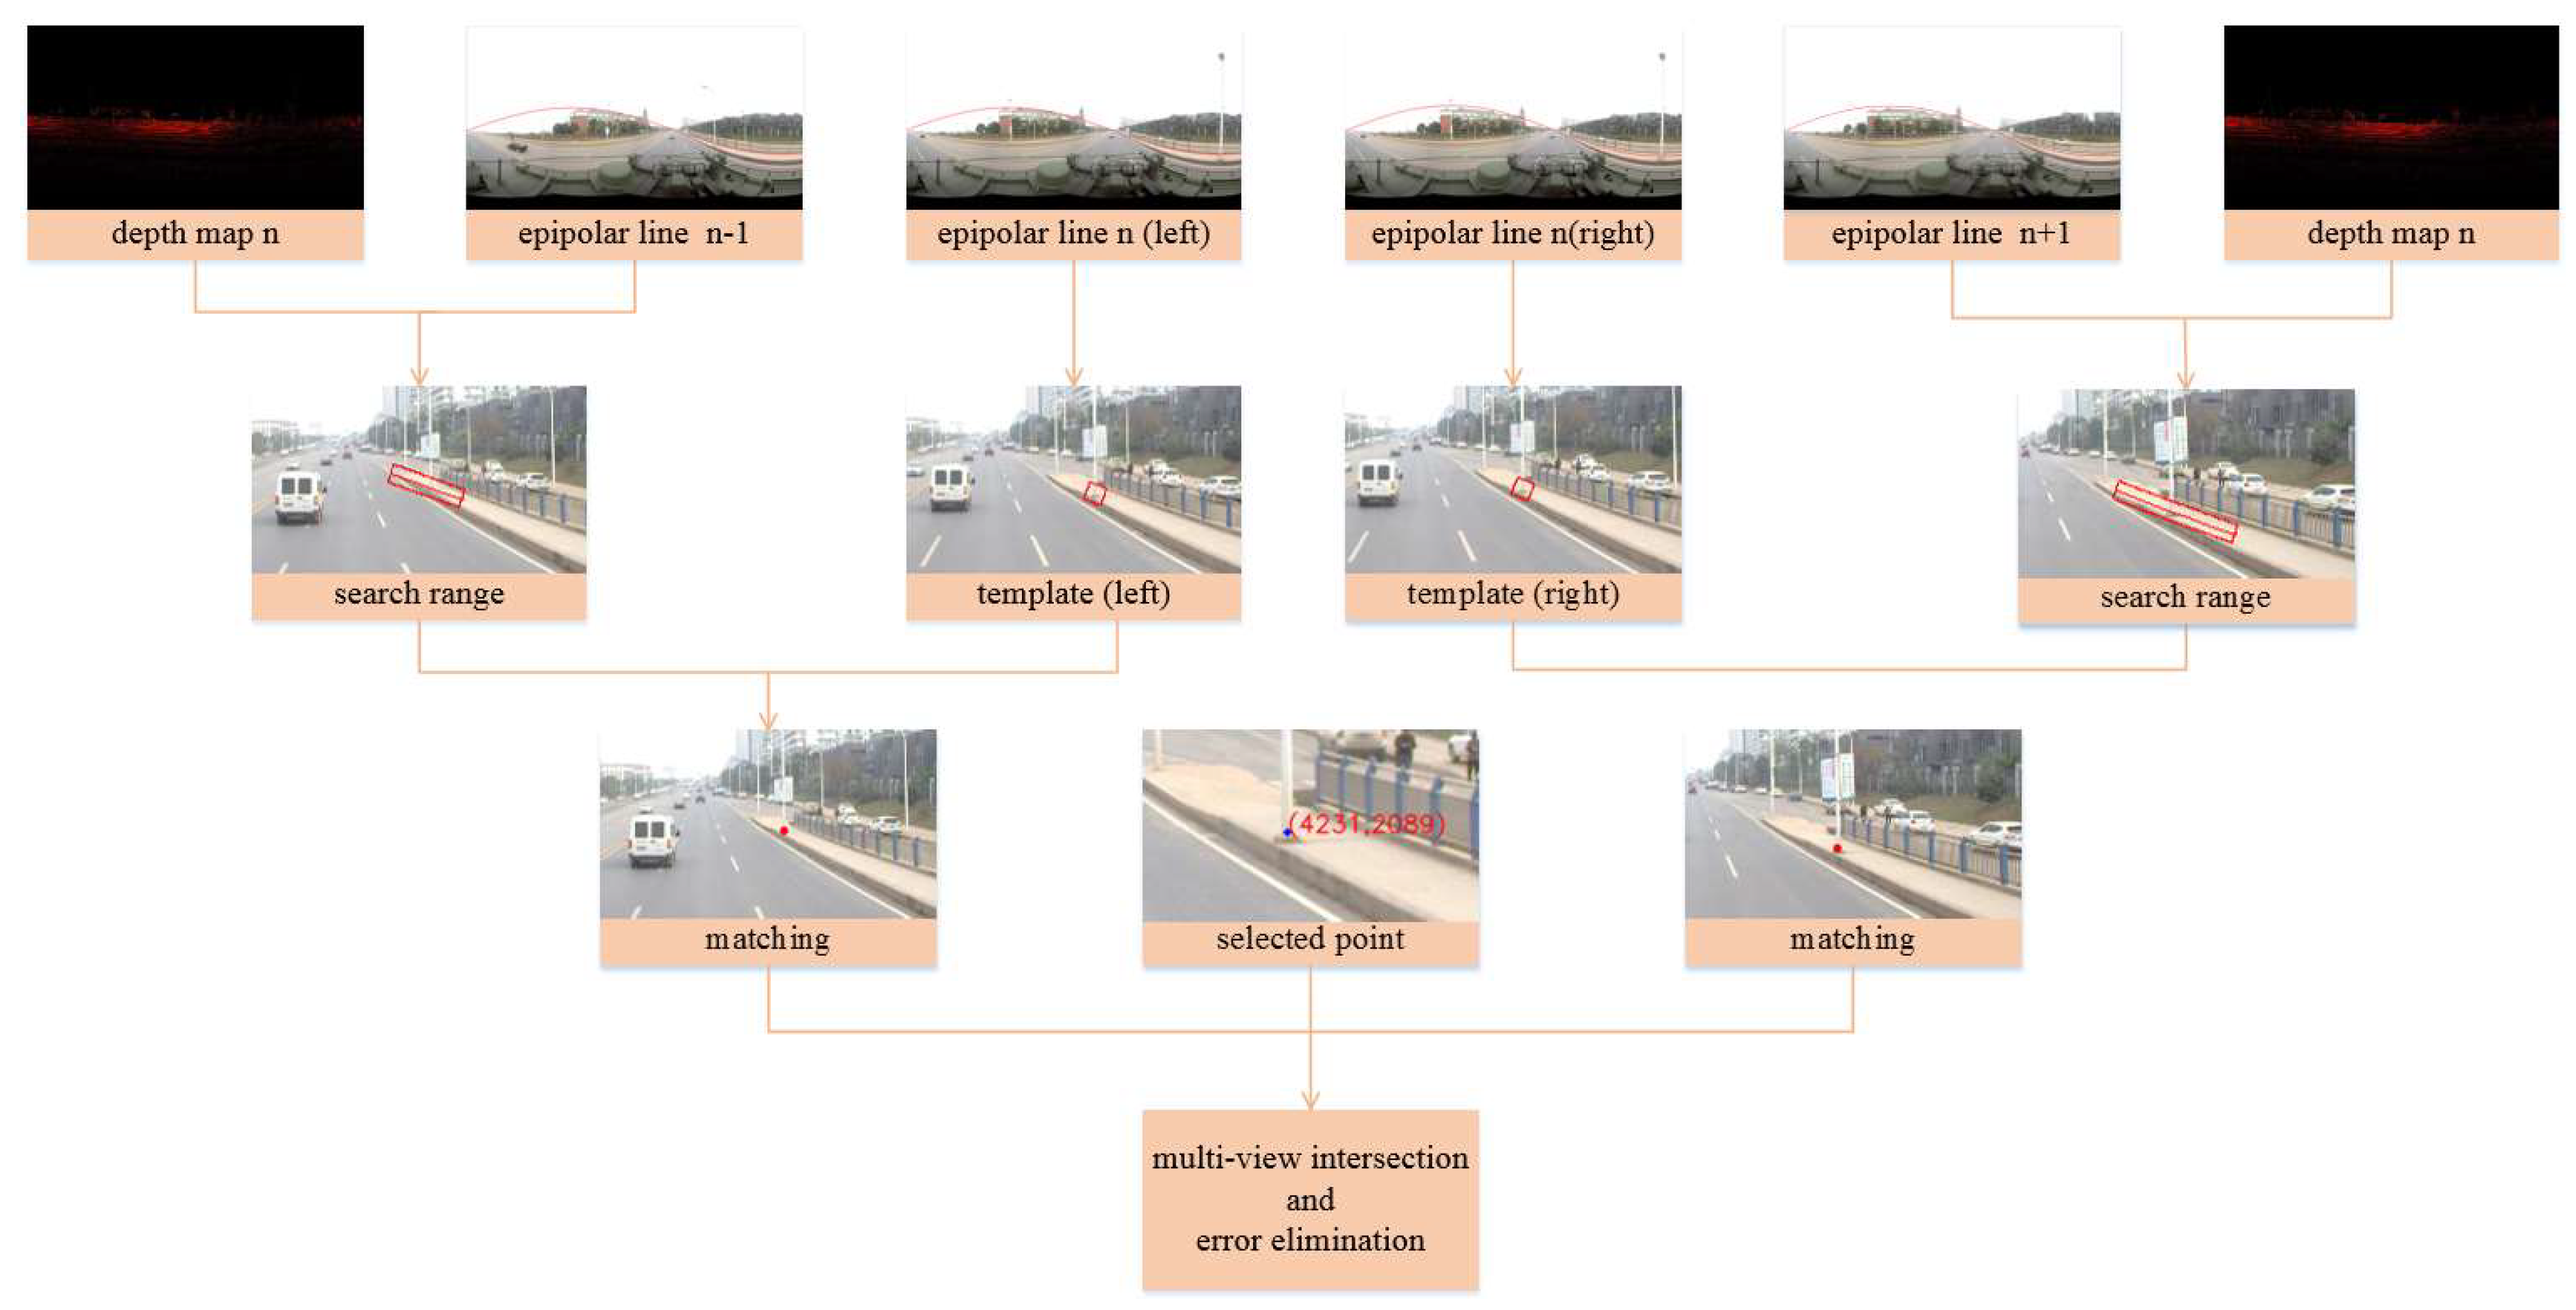
Figure 5 shows the workflow of the depth map supported searching strategy for multi-view panoramic image matching. Given an object point in the n-
th image, epipolar lines are generated respectively in the first stereo pair and the second pair. The depth of the object point is retrieved from the corresponding depth map. The search range is determined (the red curved boxes in the second row) based on the range of depth value and the bias of the epipolar line. Within the search range, the optimal candidates are retrieved by pixelwise matching with a given similarity measurement. At last, the multi-view intersection is carried out for locating and error elimination.
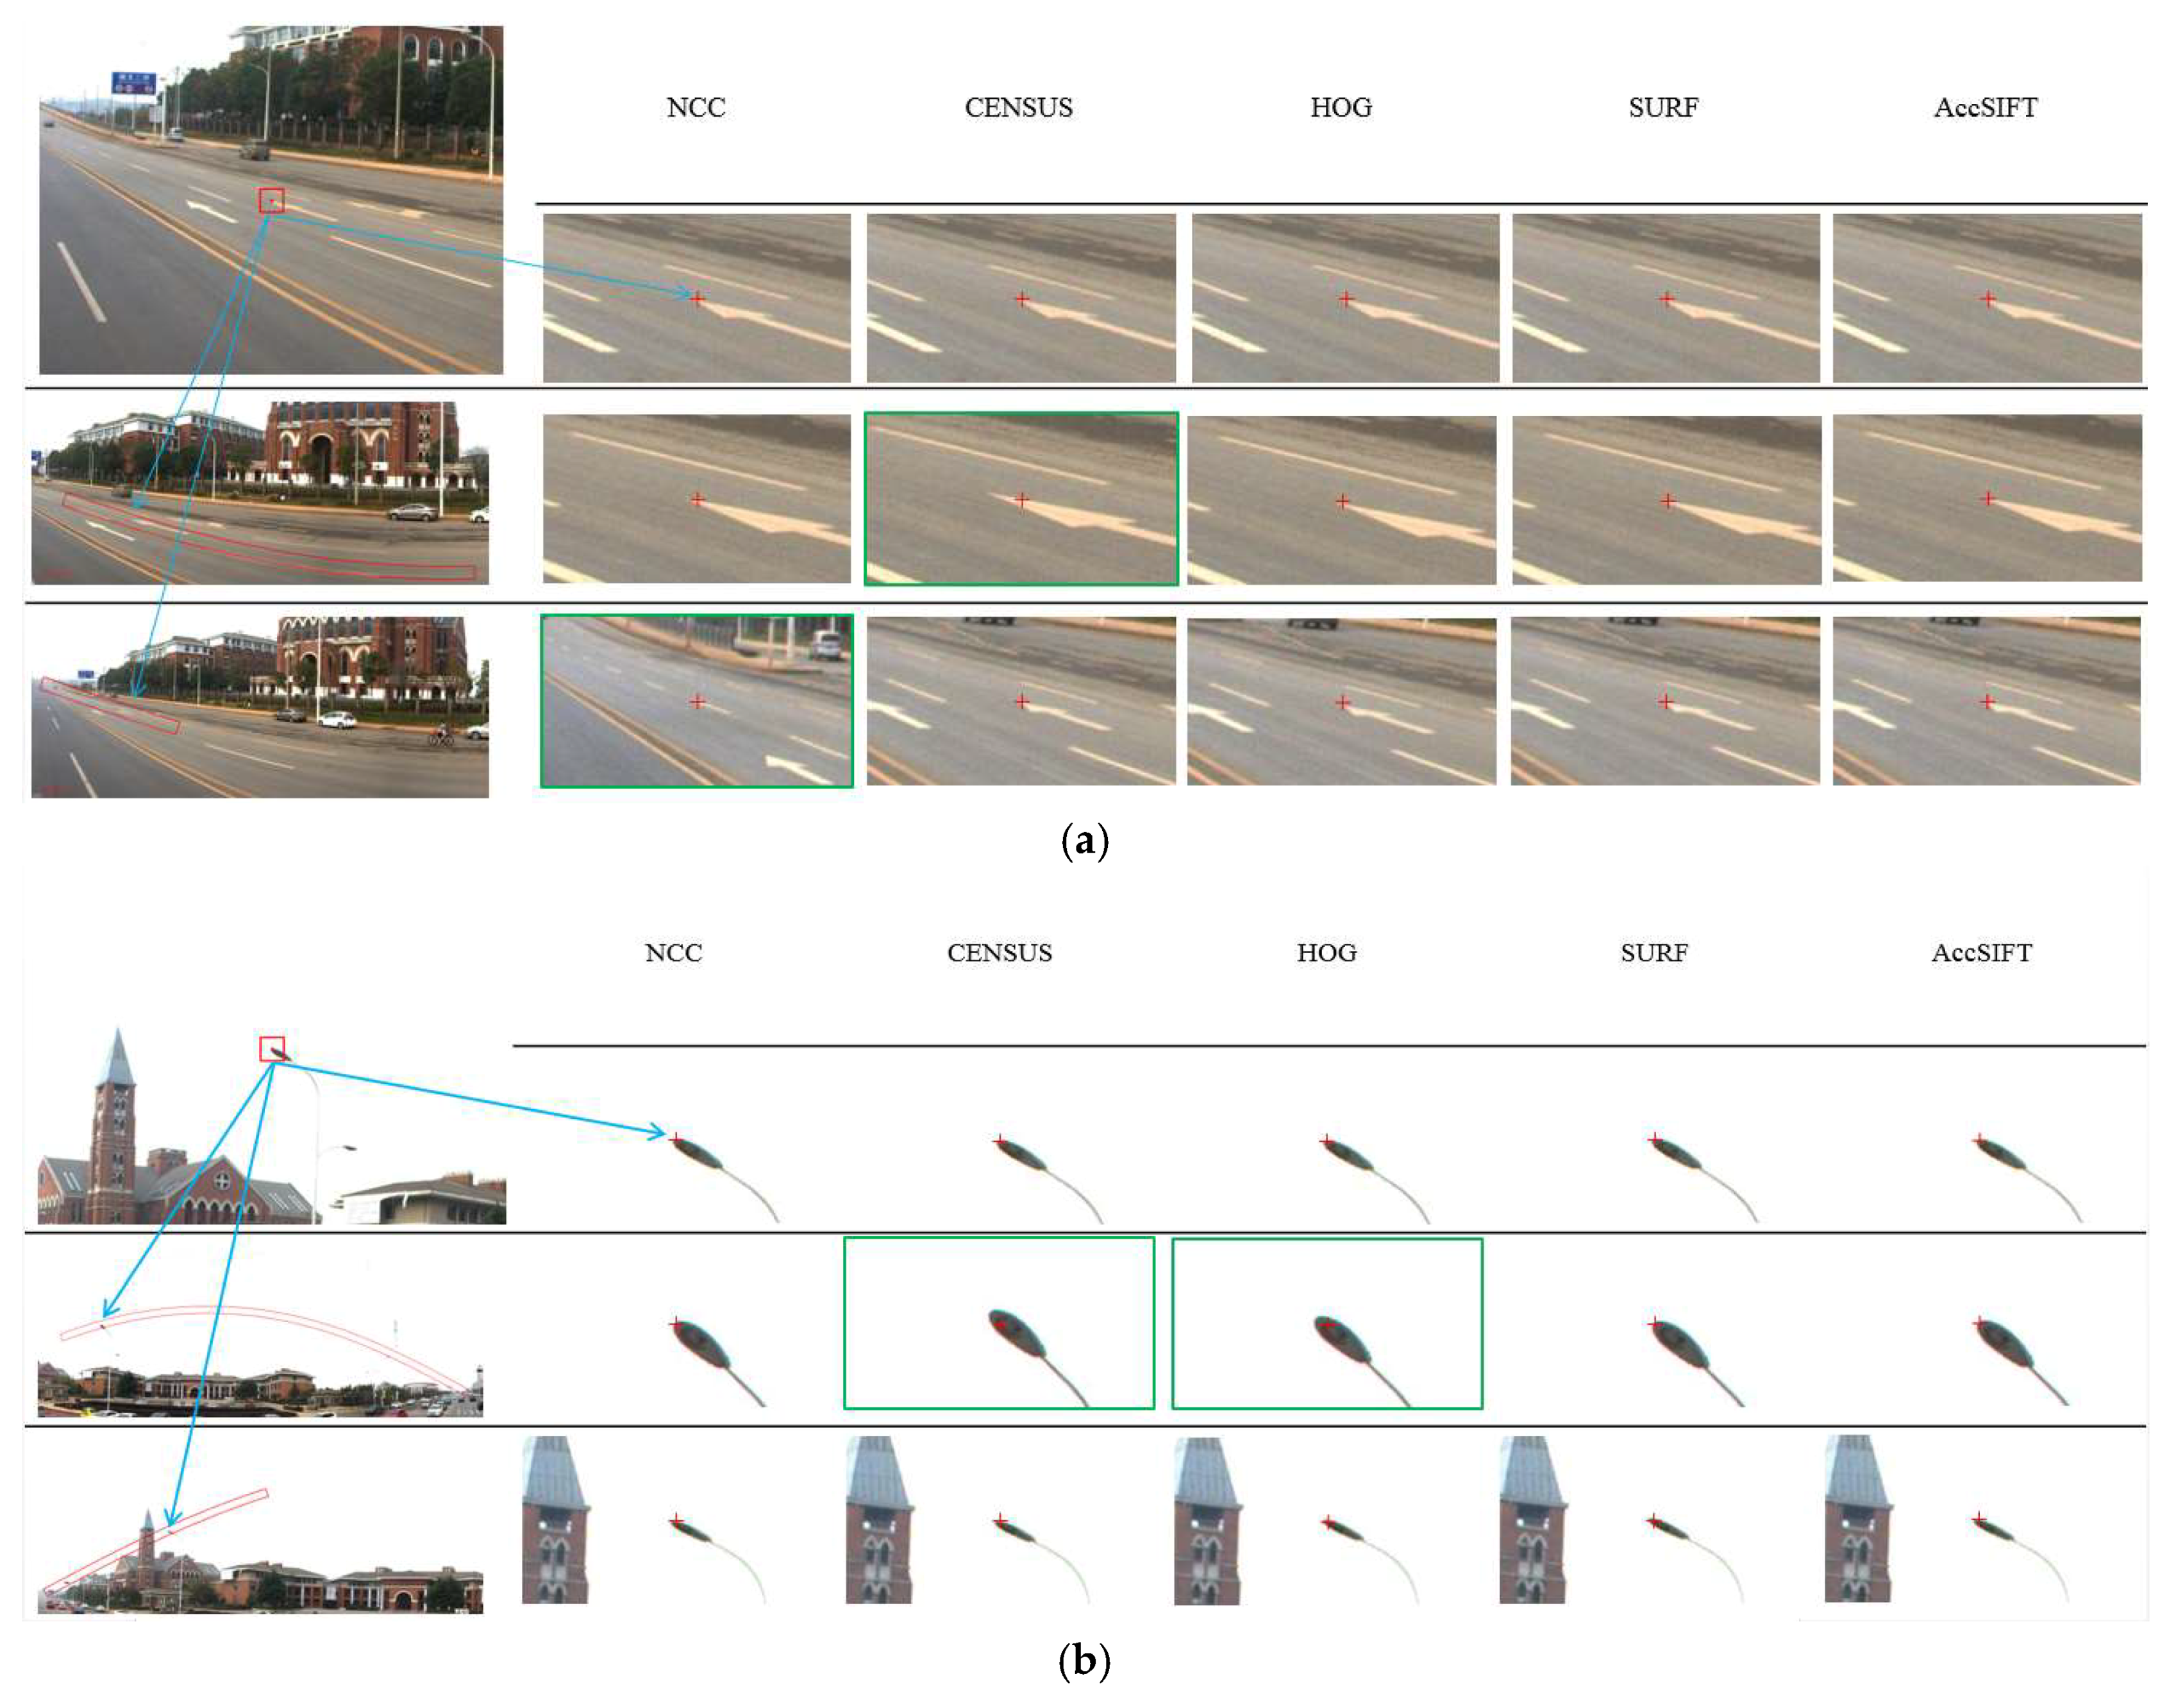
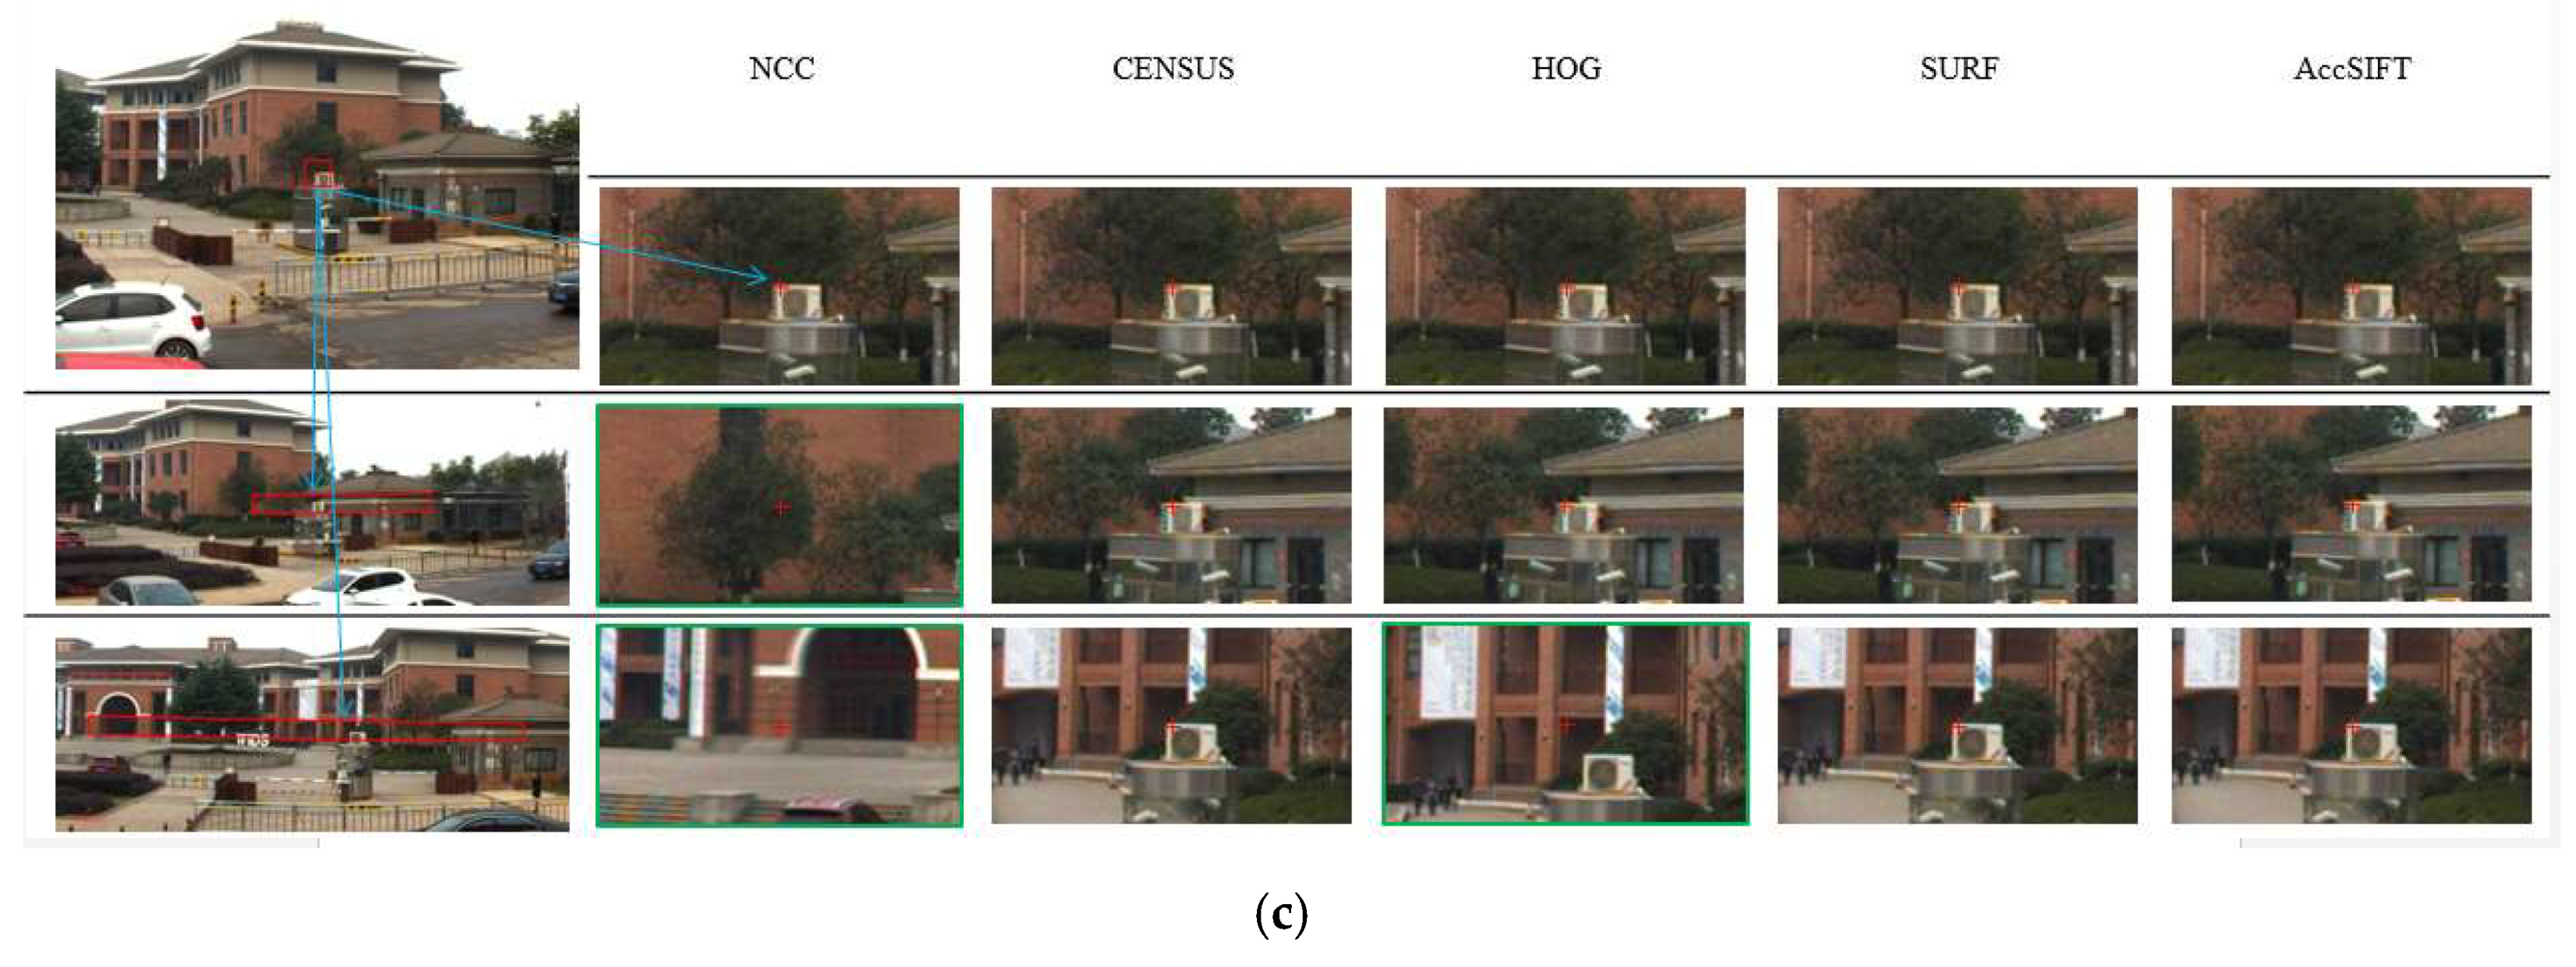
3.3. Template Matching with Different Feature Descriptors
Pixel-wise template matching within a given search area depends largely on a robust descriptor used for representing the reference and target image patches. The descriptor is then compared with a normalized correlation (or other similarity measure) and the highest correlation coefficient (or minimum distance) corresponds to the optimal candidate. In this section, we review several commonly used descriptors in template matching and feature matching, and propose an efficient strategy for calculating SIFT descriptors and their similarity.
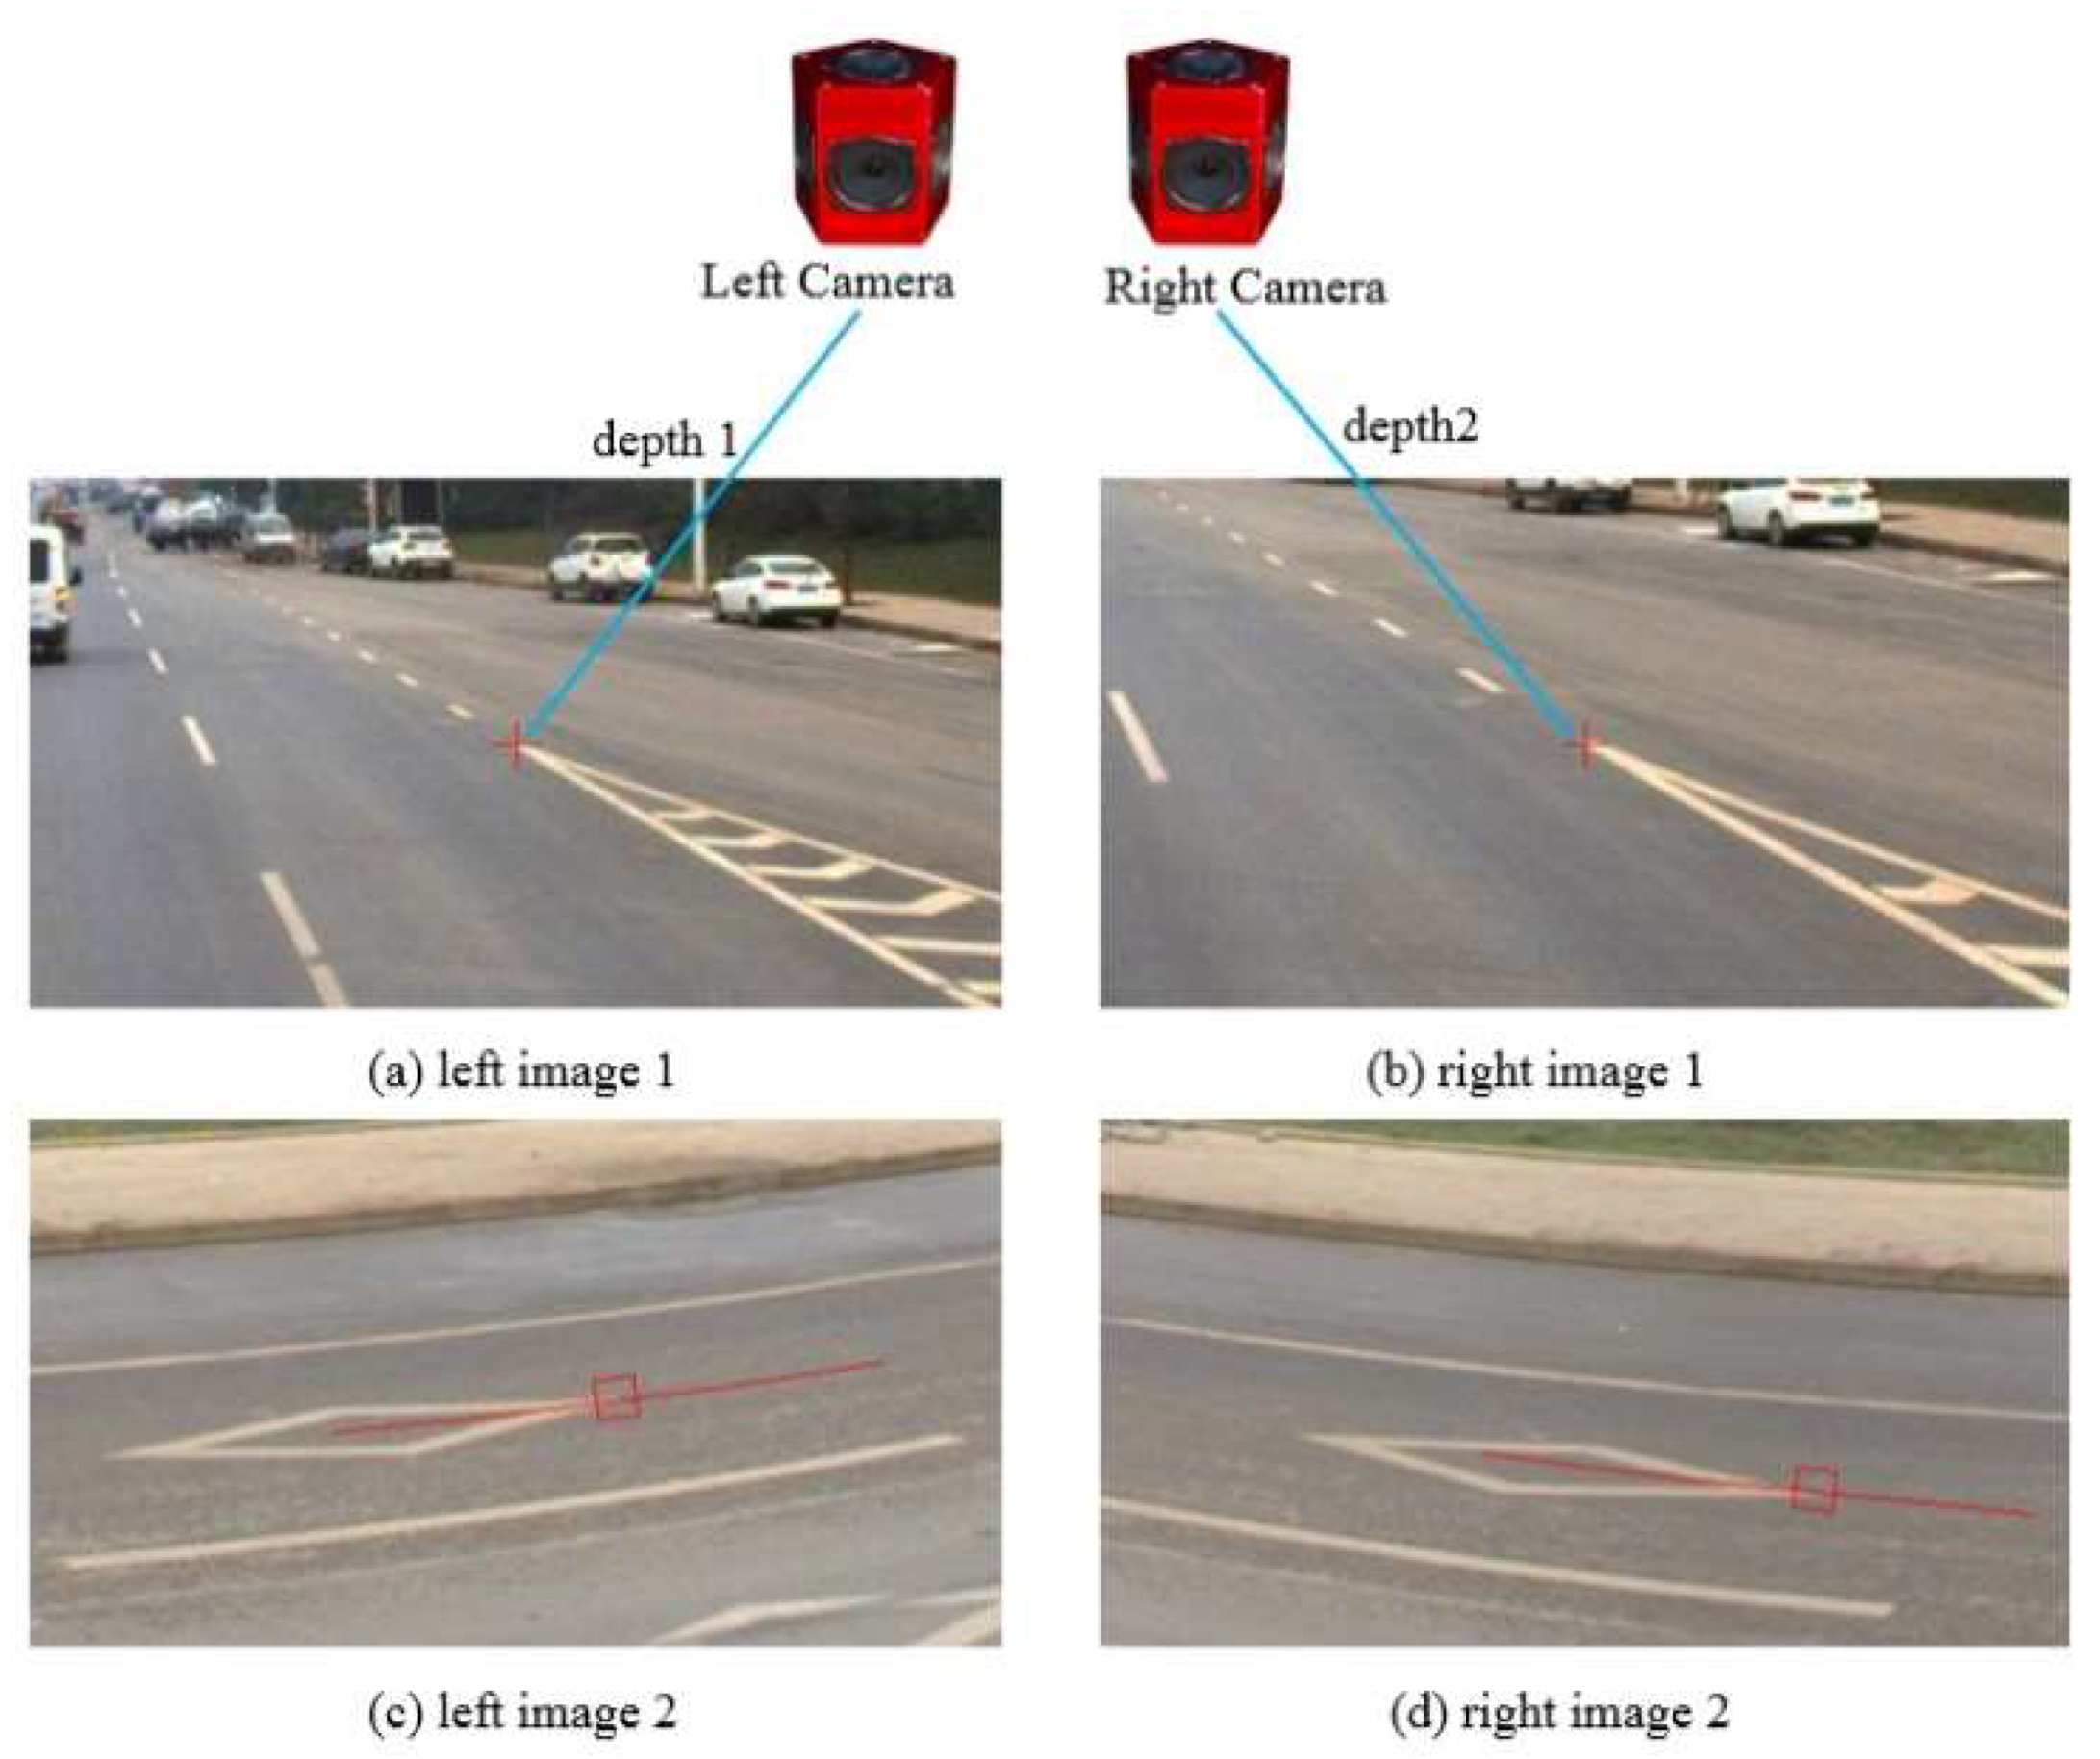
Regardless of what kind of feature descriptor is used, scale changes that could not be completely compensated will affect the matching results. We resample images to the same scale according to the ratio of distances between the 3D object and the two camera stations. In
Figure 6a,b,
depth1 and
depth2 are distances of an interested point measured in different camera stations. If depth map is unavailable, we use empirical values of 0.8, 1, and 1.2 as scale factors and sample only the reference image patch. For those features as pixel intensity that would fail due to a rotation, we dynamically align and resample the patches to be matched to the tangential direction of the epipolar line (
Figure 6c,d).
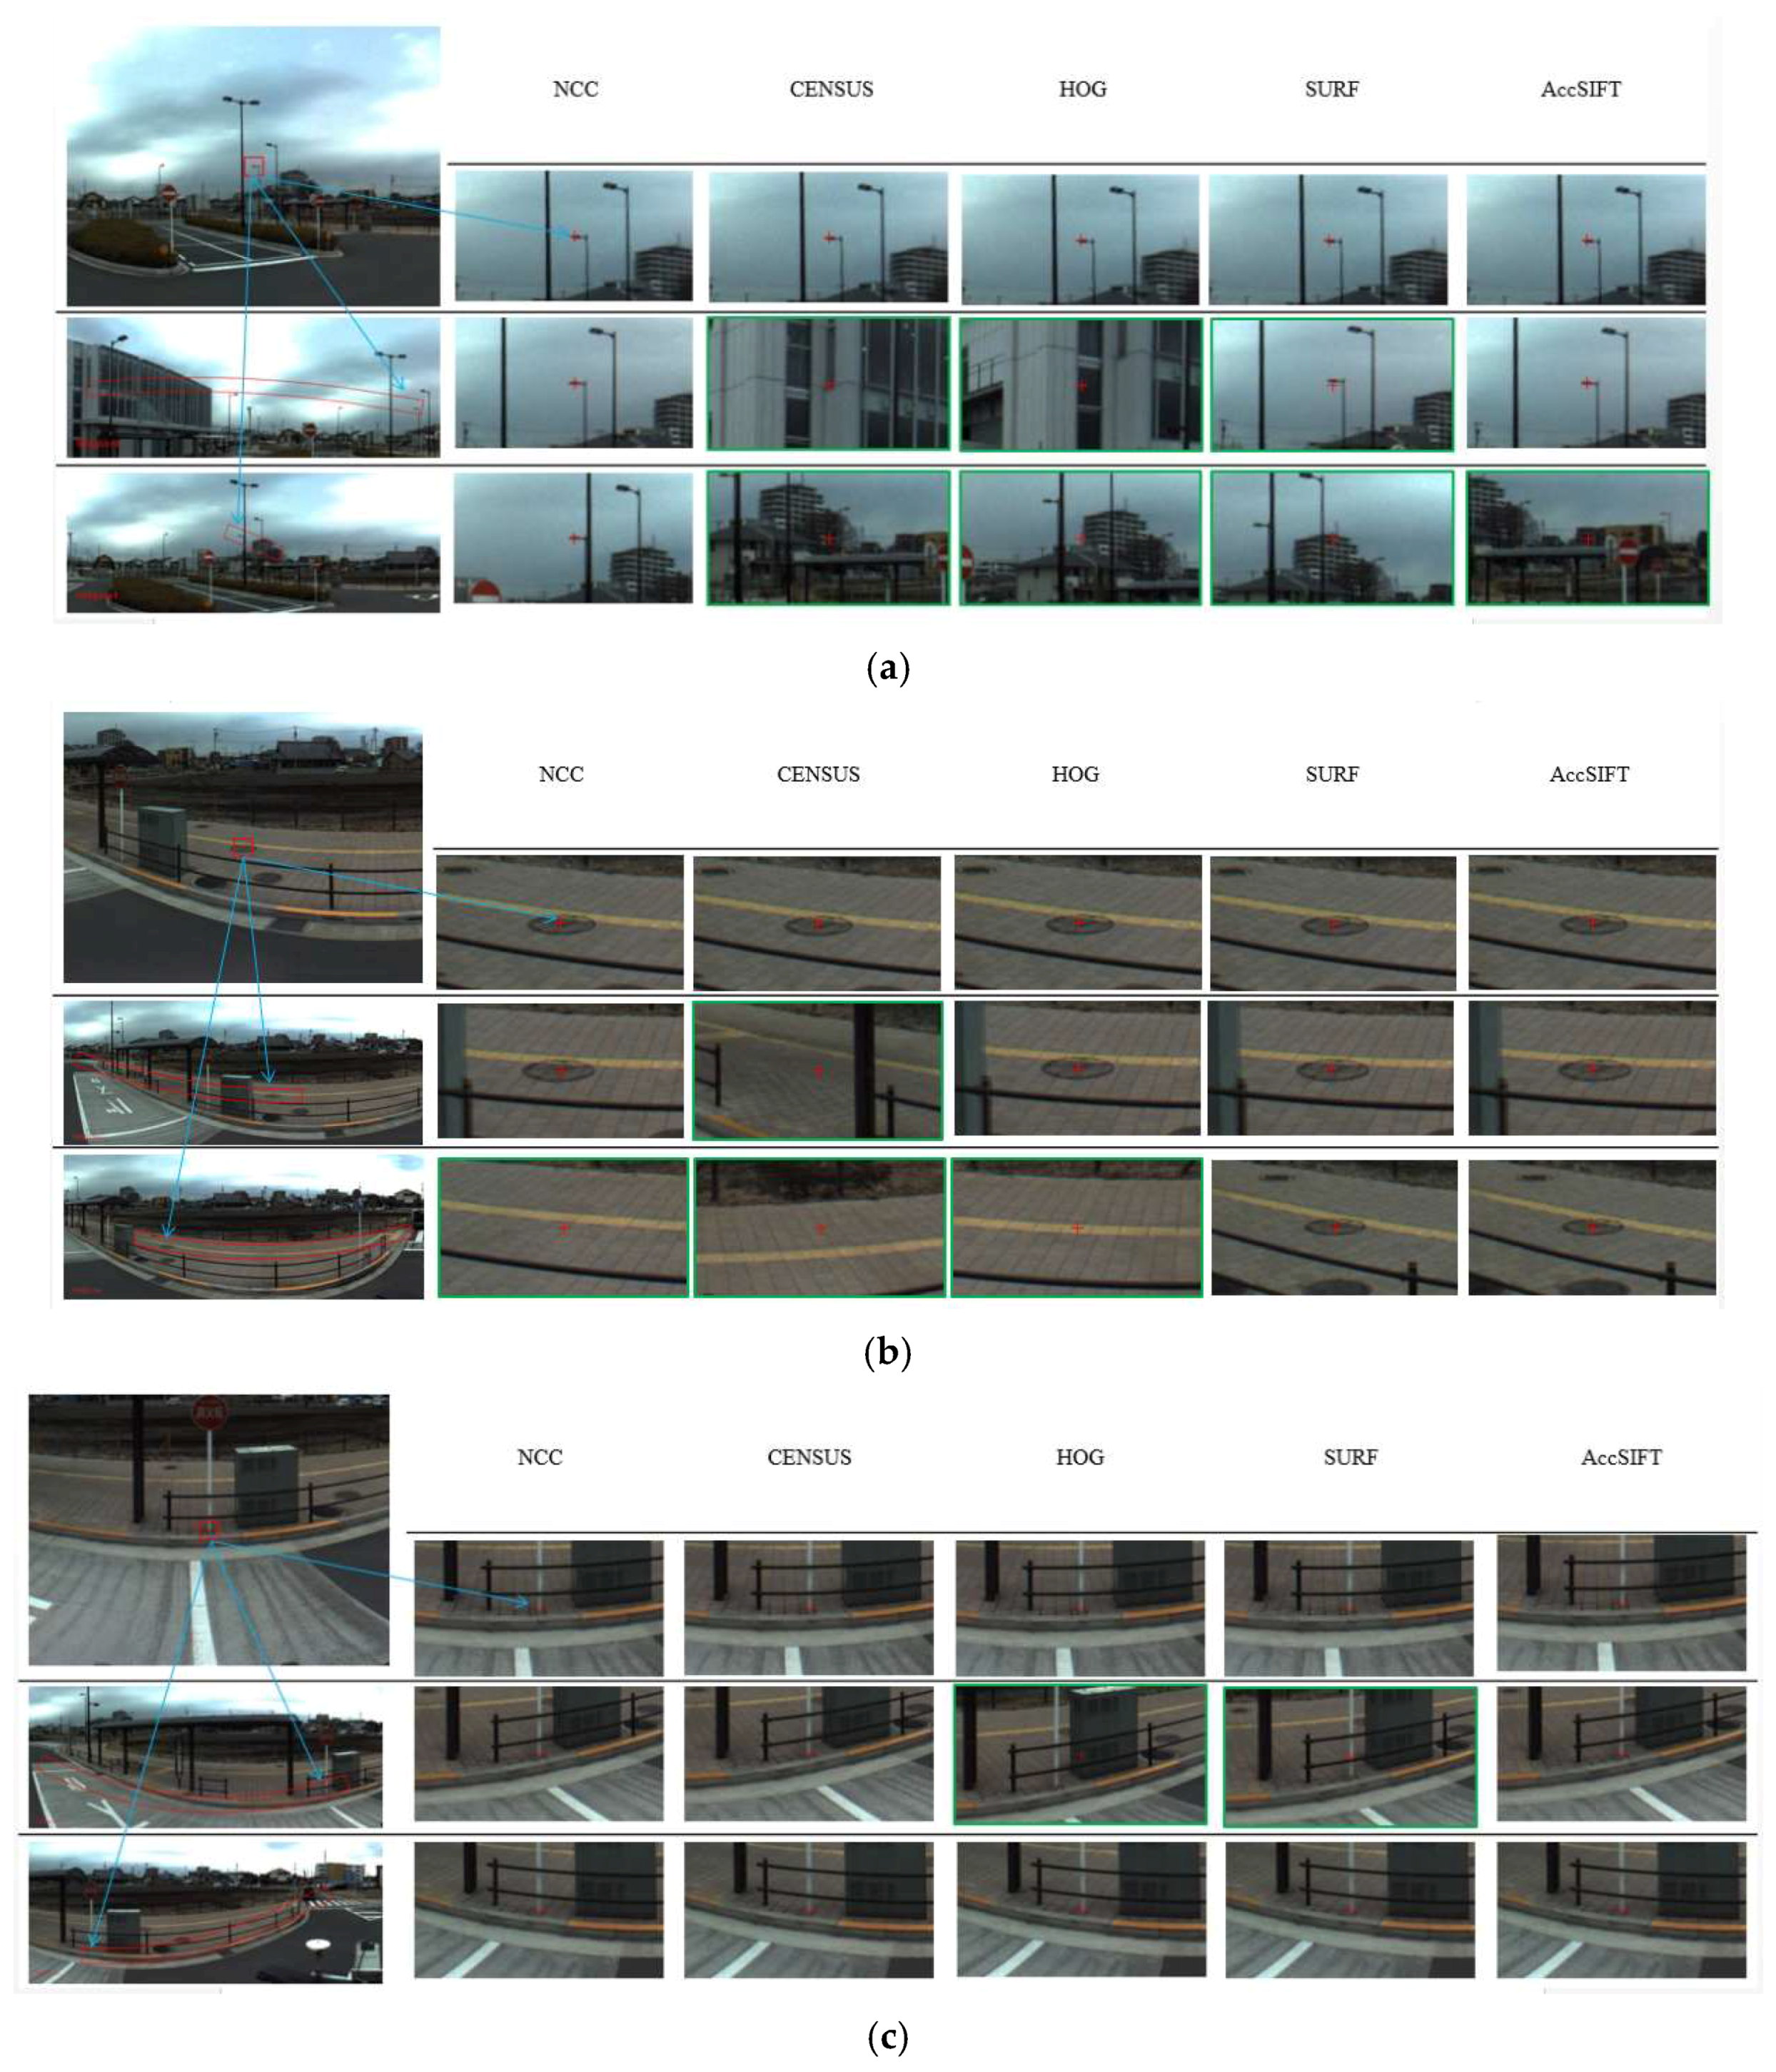
In this paper, descriptors listed below are evaluated in the template matching of wide baseline multi-view panoramic images.
Pixel values in dual space. Intensity of pixels is the most used feature in template matching. Except for intensity, we also utilize the phase information by transforming the image patch to the frequency domain with Fourier transformation [
20]. The patches in the dual image and frequency space are used to calculate correlation coefficients, and the largest one is considered an optimal candidate.
CENSUS descriptor. By comparing the intensity of a pixel with its neighbor pixels within a 21 × 21 patch window after epipolar alignment, a CENSUS descriptor is an ordered sequence vector with its elements the binary number for representing “bigger” or “smaller”. The similarity between two CENSUS descriptors is calculated by the normalized Hamming distance.
HOG (Histogram of Oriented Gradient) descriptor [
34]. Depending on the quality of the reference and target images, Gamma normalization is selectively executed first. Then, within the 16 × 16 pixels block, the gradient magnitude and orientation of each point are computed, and the block is divided into 2 × 2 cells and aligned to the dominant gradient orientation. Afterwards, a tri-linear interpolation is used to calculate 9 orientation bins for each cell. At last, the L2-Hys (Lowe-style clipped L2 norm) scheme is used to normalize the 36-dimentional vector of the block. The similarity depends on the normalized distance of two HOG vectors.
SURF descriptor. After aligned to the tangent direction of the epipolar line, a 20 × 20 patch centered on the current point is split into 4 × 4 sub-regions, and a four-dimensional feature vector is computed in each sub-region with 5 × 5 pixels inside. The four elements of the vector are the sums of Haar wavelet responses in horizontal and vertical directions respectively, as well as the sums of the absolute values of these responses. The normalized distance between the two SURF descriptors (i.e., the two 64-dimensional vectors), is used as the similarity measure.
SIFT descriptor. First, the gradient magnitude and orientation of each point within the 16 × 16 patch window are computed and the patch is aligned to the main orientation. The Gaussian kernel is then utilized to weight points by the distance to the center point. Second, the gradient magnitude and orientation of each pixel in the 4 × 4 sub-window are accumulated into an orientation histogram with eight directions to make up a local eight-dimensional vector. A complete SIFT descriptor consists of a 128-dimensional vector of 16 sub-regions after a maximum suppression of larger gradients. The normalized distance between the two SIFT vectors is used as the similarity measure.
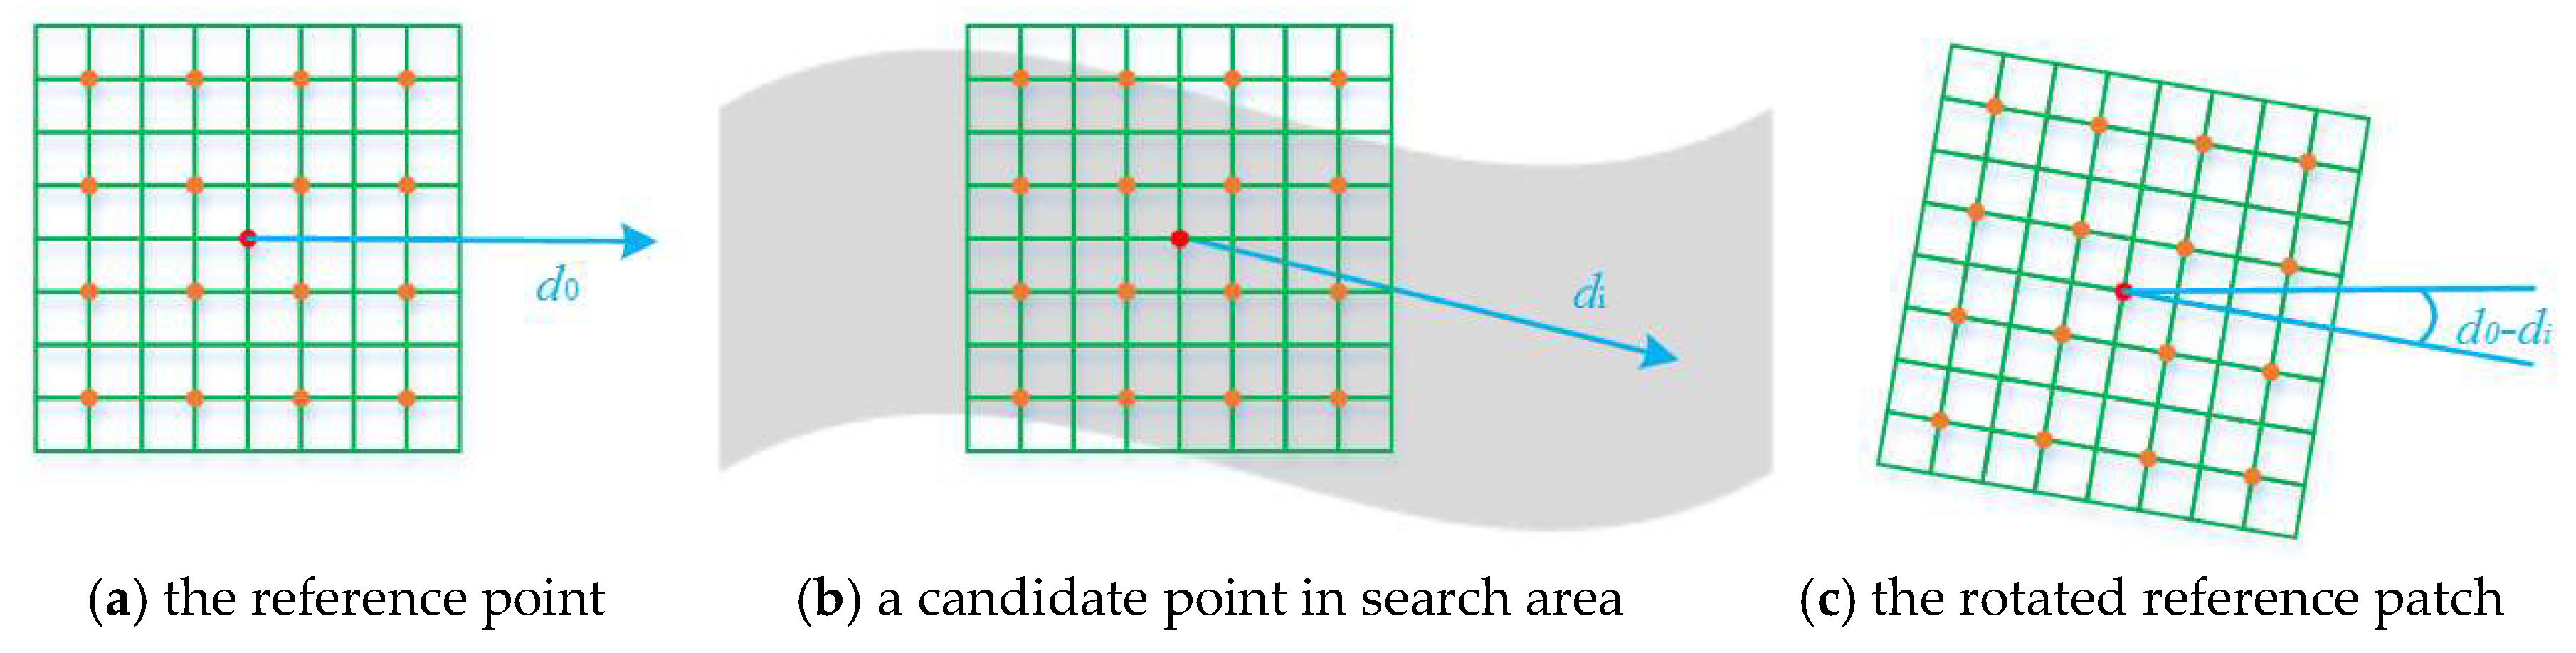
Accelerated SIFT descriptor. As the calculation of the pixel-wise SIFT descriptor could be very slow for template matching especially with large search range, we developed a method that dramatically reduces the calculation load of the SIFT descriptor (referred in this study as accelerated SIFT descriptor). The SIFT descriptor consists of 4 × 4 components each of which includes 4 × 4 pixels and is described by an eight-dimensional vector. Hence, we can calculate this vector for every pixel via its 4 × 4 region in advance (2 × 2 region for simplicity in
Figure 7a). In the search range, we finally produce a map with the elements of the vector. This guarantees the calculation of the SIFT descriptor performed only once and we only need to read the descriptor of a candidate from memory instead of re-calculation. Then, a Gaussian window is applied to weight pixels with distance to the current search point. For orientation bias, we rotate the reference image patch instead of the searched patch. To achieve this, we firstly calculate the tangent direction of the epipolar line
di of the current candidate point
i (as every point on the panoramic epipolar has its own tangent direction as shown in
Figure 7b), and then obtain the direction difference between
di and the tangent direction of the reference epipolar line
d0. The reference patch is rotated with
d0 −
di degree to compensate the angle bias (
Figure 7c). The calculation of the direction difference is not very rigorous and could introduce tiny direction bias however it is very slight and could be ignored for the tremendous efficiency improvement.


