Article

Analysis of Land Use Change and Expansion of Surface Urban Heat Island in Bogor City by Remote Sensing

Graduate School of Horticulture, Chiba University, Matsudo, Matsudo-Shi, Chiba 271-8510, Japan
*
Author to whom correspondence should be addressed.
ISPRS Int. J. Geo-Inf. 2018, 7(5), 165; https://doi.org/10.3390/ijgi7050165
Submission received: 23 March 2018 / Revised: 18 April 2018 / Accepted: 18 April 2018 / Published: 26 April 2018

Abstract

:
Bogor as one of the satellite cities of Jakarta Metropolitan experiences rapid population growth and urban development. The urban landscape that is changed by urban development affects the city expansion, the increase of land surface temperature (LST), and the urban heat island (UHI). Objectives of this study are to analyze the city expansion, to analyze the LST characteristic of each land use type, and to examine the correlation between LST change and land use change that is affected by the city expansion. We examined the development of the UHI through the city expansion and the increasing of LST. Landsat 5 TM in 1990, 1997, 2007, and Landsat 8 OLI/TIRS in 2017 were used in this study. For the land used classification, we used Local Climate Zone (LCZ) classification system. The result shows that Bogor has experienced city expansion in the last 27 years. According to the rate of city expansion in the different period, the highest city expansion occurred in 1997–2007 by 8213.7 ha in the analyzed area. In the analysis of relationship between LST and LCZ, there are differences of LSTs among LCZ categories. We also found the area that shows a high LST value expanded broadly towards suburban area with urban development. The temperature differences between urban and suburban were 1.36 °C in 1990, 2.33 °C in 1997, 2.97 °C in 2007, and 2.26 °C in 2017. We defined urban change degree to quantify the land use change, and it is compared with LST change. By the analysis, strong influence of urban expansion on the distribution of surface UHI was observed.

1. Introduction

Urban heat island (UHI) is a phenomenon where the urban area is warmer than the suburban area. Surface and atmospheric modifications that were caused by urbanization generally lead to the modified thermal condition that is warmer than the surrounding areas [1,2]. The atmospheric urban heat island is measured based on the air temperature. Surface UHI is measured based on the land surface temperature (LST). This study focuses on the surface UHI that has the adverse impact on the city expansion. Surface UHI can be observed by using remote sensing data and was described by Voogt and Oke [1] and Roth et al. [3].
Surface UHI mainly caused by urban development, which resulted in higher LST [4,5]. LST characteristics are mainly contributed by albedo, thermal, and heat capacity of urban surface cover [5]. In the case of urbanization, the replacement of land use into another has influenced the energy exchange between the urban surface cover and the atmosphere that affected the LST.
The development of thermal remote sensing has an advantage in the study of surface UHI. The advantage carries out the possibility of LST measurement in the large area. The utilization of thermal remote sensing to obtain the LST has been conducted in the previous studies [6,7,8,9,10,11,12]. The relationship between surface cover change and surface UHI in urban areas are also studied on the role of vegetation abundance that is related with UHI [13], landscape configuration, and UHI effect [14], growing population, which affect loss of green and water area [4], and impact of land surface characteristic on spatiotemporal pattern of LST [15]. Nevertheless, the relationship between LST and Local Climate Zone (LCZ) with the city expansion has not been studied to describe the development of surface UHI.
The interaction between the urban surfaces with the atmosphere is governed by the surface heat flux [6,16]. Based on the characteristic of the urban surface and its climate interaction, we used the LCZ classification system by Stewart and Oke [16]. They classified the urban surface that is based on the surface structure and surface cover characteristic related to the climate interaction. The principle workflow of LCZ classification is clearly described by Bechtel et al. [17].
UHI almost occurs in all urban areas at a large or small-sized city [13] and the urbanization has an impact on the land use change, which then results in the formation of UHI [1]. Regarding the urban development process, population growth has the important role in the city expansion. Population growth leads the changes of social characteristics and the intensity of its activities that lead to the rapid changes in urban utilization. The decreasing of vegetation coverage in the urban area due to the development of urban surface (buildings, pavements, etc.) is the environmental consequences that often occur in the city. Certainly, the rapid changes for urban development affected the development of surface UHI.
Bogor City as a satellite city of Jakarta is a comfortable city for residential purpose. Recently, Bogor City has experienced a rapid population growth and urban development. The population growths in Bogor City by census and statistic data are 272,251 (1990); 750,819 (2000); 950,334 (2010); and, 1,064,687 (2016) [18,19]. This rapid growth brings expansion of Bogor City and affected its UHI.
In this study, we focused on analyzing the city expansion and surface UHI in Bogor City using remote sensing. The aims of this study are: (1) examine the city expansion from the point of view of LCZ; (2) analyze the LST characteristic of each LCZ type; and, (3) examine the correlation between LST change and the land use change that was affected by the city expansion. We defined urban change degree to describe the change from non-urban to urban LCZ. Landsat data were used to analyze city expansion and the development of surface UHI in the last 27 years.

2. Materials and Methods

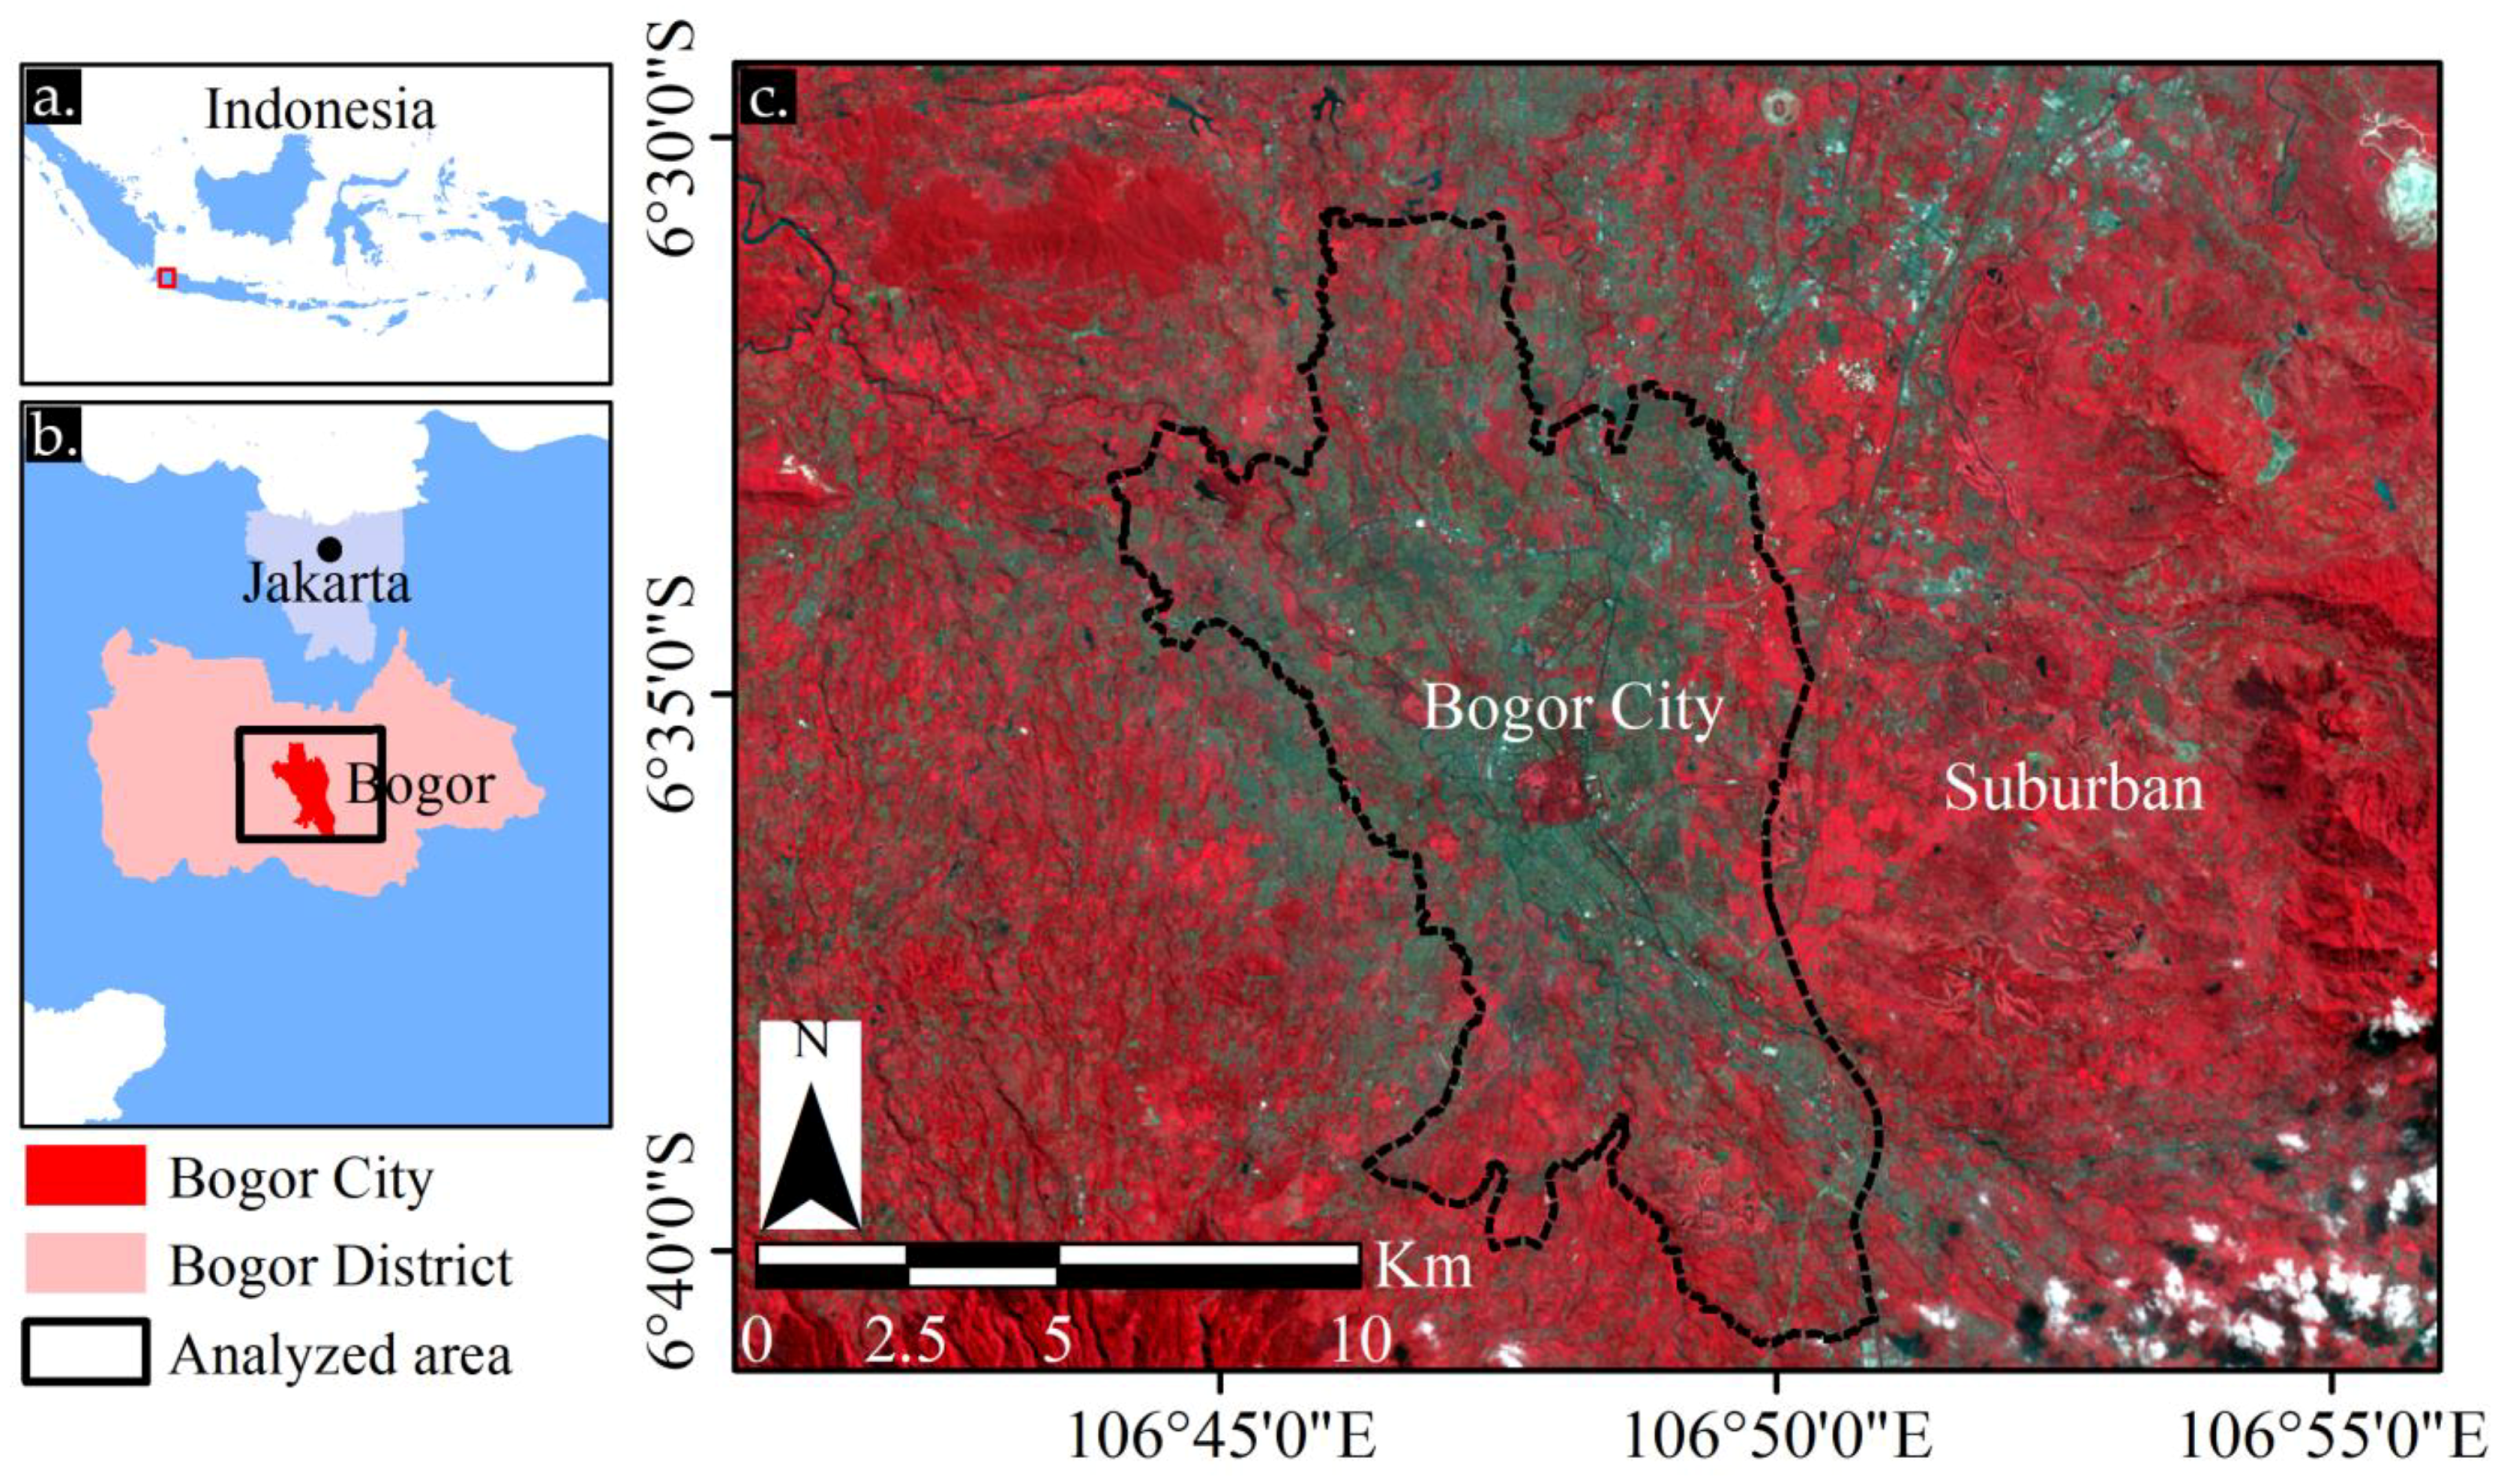
2.1. Study Area and Materials

The analyzed area is shown in Figure 1. Whole analyzed area (Figure 1c) consists of Bogor City and suburban area. We defined that Bogor City is inside of the city boundary that is shown in Figure 1c (red area of Figure 1b), and suburban area is the analyzed area except for Bogor City.
Landsat TM data in 1990, 1997, 2007, and Landsat 8 OLI/TIRS in 2017 have been downloaded from the United States Geological Survey web page (https://earthexplorer.usgs.gov/) with path 122 and row 065. The description of Landsat image is shown in Table 1. They have been geo-referenced to the WGS84/UTM 48 South projection system. Band 1–5 & 7 (Landsat TM) and band 1–7 (Landsat OLI) were used for LCZ. Band 6 (Landsat TM) and band 10 (Landsat TIRS) were used to analyze the LST.

2.2. Local Climate Zone (LCZ)

Local climate zones (LCZ), as developed by Stewart and Oke [13], is a new and systematic classification method of land use for UHI studies. The classification dividing the urban and rural area, which were defined as structure and land cover properties. LCZ was formally defined as regions of uniform surface cover, structure, material, and human activity that span hundreds of meters to several kilometers in horizontal scale. According to Stewart and Oke [13], each LCZ has a characteristic temperature regime that is the most apparent over the dry surface, on calm, clear nights, and areas of simple relief. The temperature regime is associated with the homogeneous environments or the ecosystem of cities. We conducted the classification process in Quantum GIS with Semi-Automatic Classification plug-in. Nine LCZs were used in this study: compact low-rise building, large low-rise building, roads and paved, dense trees, scattered trees and bush, low plants, bare soil, water, and cloud. Based on the ground features of the analyzed area and high resolution of Google Earth images in Bogor City, the LCZ types are divided into eight categories: compact low-rise building, large low-rise building, roads and paved, dense trees, scattered trees and bush, low plants, bare soil, and water. The illustration of LCZ categories is shown in Figure 2. Particularly, cloud category is directly determined based on interpretation in Landsat image without considering the feature in Google Earth image. Then, the training areas are determined for those nine categories. To determine the categories, maximum likelihood classification (MLC) algorithm was used in this study.
For further analysis of city expansion, we conducted merge processing of LCZ into big cluster. Compact low-rise building, large low-rise building, roads, and paved were merged and defined as an urbanized area. Dense trees, scattered trees and bush, and low plants defined as vegetated area. We defined that the urbanized area as the city area (impervious surface), while the suburban area is mainly covered by vegetated area (natural surface). Therefore, a merge processing of LCZ into big clusters is necessary.

2.3. Data Post-Processing and Accuracy Assessment of LCZ Classification

To identify the errors among the categories, we conducted accuracy measurement of LCZ classification. In the accuracy assessment of LCZ classification, confusion matrix, X, defined as follows, is used:
X = ( X i i X i n : : X n i X n n )
where i is classification of training data (i = 1~r), j is classification result, (j = i~r), and r is the number of category. The accuracy of classification for an individual category is measured by user’s accuracy and producer’s accuracy. The producer’s accuracy is the accuracy that is obtained by dividing the number of correct pixels of category i with the total number of training data of category i. The producer’s accuracy is often known with the term “omission error”. If the number of correct pixels of category i is divided by the total pixels of category i, this is called user’s accuracy, known as “commission error”. Kappa coefficient, K, which considers the omission error and commission error, is also used [20,21,22].
Several accuracy formulas used are as follows [20,22,23]:
X i + =   k = 1 r X i k
X + i =   k = 1 r X k i
Producer s   accuracy   of   r th   category = X i i X i +   ×   100 %
User s   accuracy   of   r th   category = X i i X + i   × 100 %
Overall   accuracy =   ( i = 1 r X i i N ) × 100 %
K =   N i = 1 r X i i i = 1 r X i + X + i N 2 i = 1 r X i + X + i
where Xii is number of correct observations in category i, X+i is marginal total of column i and Xi+ is marginal total of rows i, and N is the total number of observations.

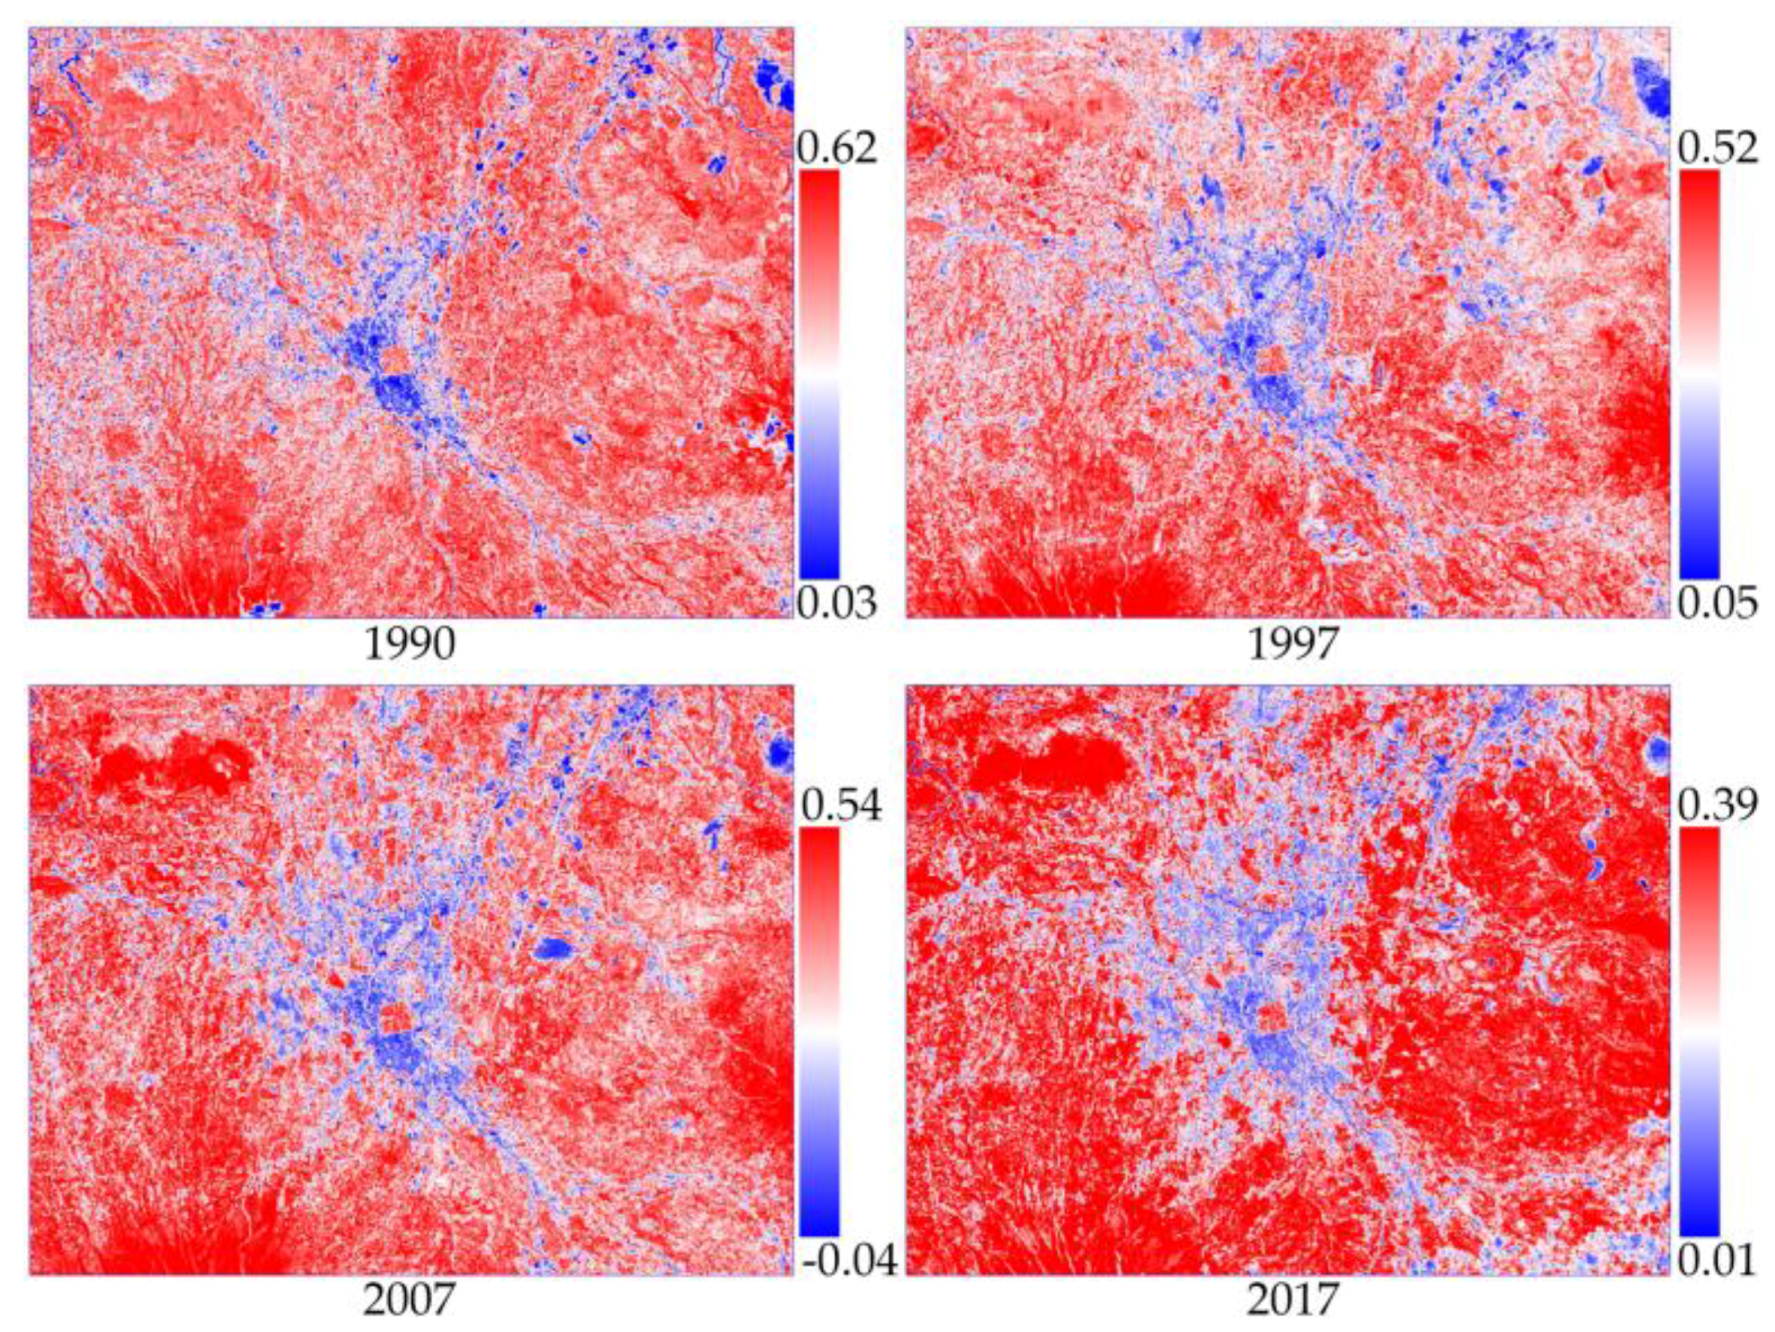
2.4. Normalized Difference Vegetation Index (NDVI)

The NDVI value indicates the presence of vegetation or vegetation condition. NDVI value can be obtained by using reflectance of the red band (band 3 in TM and band 4 in OLI) and surface reflectance of the near-infrared band (band 4 in TM and band 5 in OLI). The equation is as follows:
N D V I = N I R   b a n d     R e d   b a n d N I R   b a n d   +   R e d   b a n d

2.5. Derivation of Land Surface Temperature (LST)

The method for obtaining LST from Landsat data sets requires the conversion of the Digital Number (DN) values of the thermal bands (Band 6 in Landsat-5 TM and Bands 10 in Landsat-8 TIRS). At first step, spectral radiances () of the multispectral and thermal bands of the Landsat-5 TM and Landsat-8 TIRS imageries can be calculated using the Equations (9) and (10), respectively. The surface temperature (T) can be obtained from the spectral radiance () using the Equation (11) (http://landsat.usgs.gov):
L λ   ( Landsat   TM ) =   L m i n   + ( L m a x   L m i n 255 ) ×   D N
(Landsat 8 TIRS) = ML × DN + AL
T = K 2 ln [ ( K 1 L λ ) + 1 ]
where ML (0.0003342) represents band specific multiplicative rescaling factor, and AL (0.1) is band specific additive rescaling factor. For Landsat TM, Lmax and Lmin values are available in satellite header file (metadata). K1 and K2 are band specific thermal conversions constant in metadata (Landsat-5 TM: K1 is 607.76 and K2 is 1260.56 and Landsat 8 TIRS: K1 is 774.8853 and K2 is 1321.0789).

2.6. Urban Change Degree and UHI Development

The urban change degree is measured as the difference of urban pixels in 5 × 5 pixels between 1990 and 2017, as shown in Figure 3. In order to identify the changes of the area, the correlation between the LST change and urban change degree between 1990 and 2017 is calculated. The degree ranges from zero (0) to one (1). Zero means no change (from non-urban to the urban area) in all 25 pixels and one is the changes (from non-urban to the urban area) in all 25 pixels.
U r b a n   c h a n g e   d e g r e e   =   n u m b e r   o f   u r b a n   p i x e l s   d i f f e r e n c e 25
The LST change is also calculated for every 5 × 5 pixels between 1990 and 2017, like urban change degree. The LST change is expressed, as follows:
LST change = LST2017LST1990 (average of 25 pixels)

3. Results and Discussion

3.1. Accuracy Evaluation of LCZ

To validate the LCZ, 255 sampling points are compared with the corresponding point on Google Earth images in the same period. Table 2 shows the accuracy of LCZ’s validation, which is calculated by the same method of Estoque et al. [24] and Wang et al. [11]. The accuracy in all periods are more than 85%.
Table 3 shows the overall accuracy and the kappa coefficient for LCZ classification. The overall accuracy for each period is more than 90% and it is quite high for all periods of time. The accuracy in 2017 has the highest value. Generally, the Kappa coefficient was more than 0.75 for all of the images. When the Kappa coefficient is above 0.7, it indicates that the degree of agreement of accuracy is categorized as very good [25].

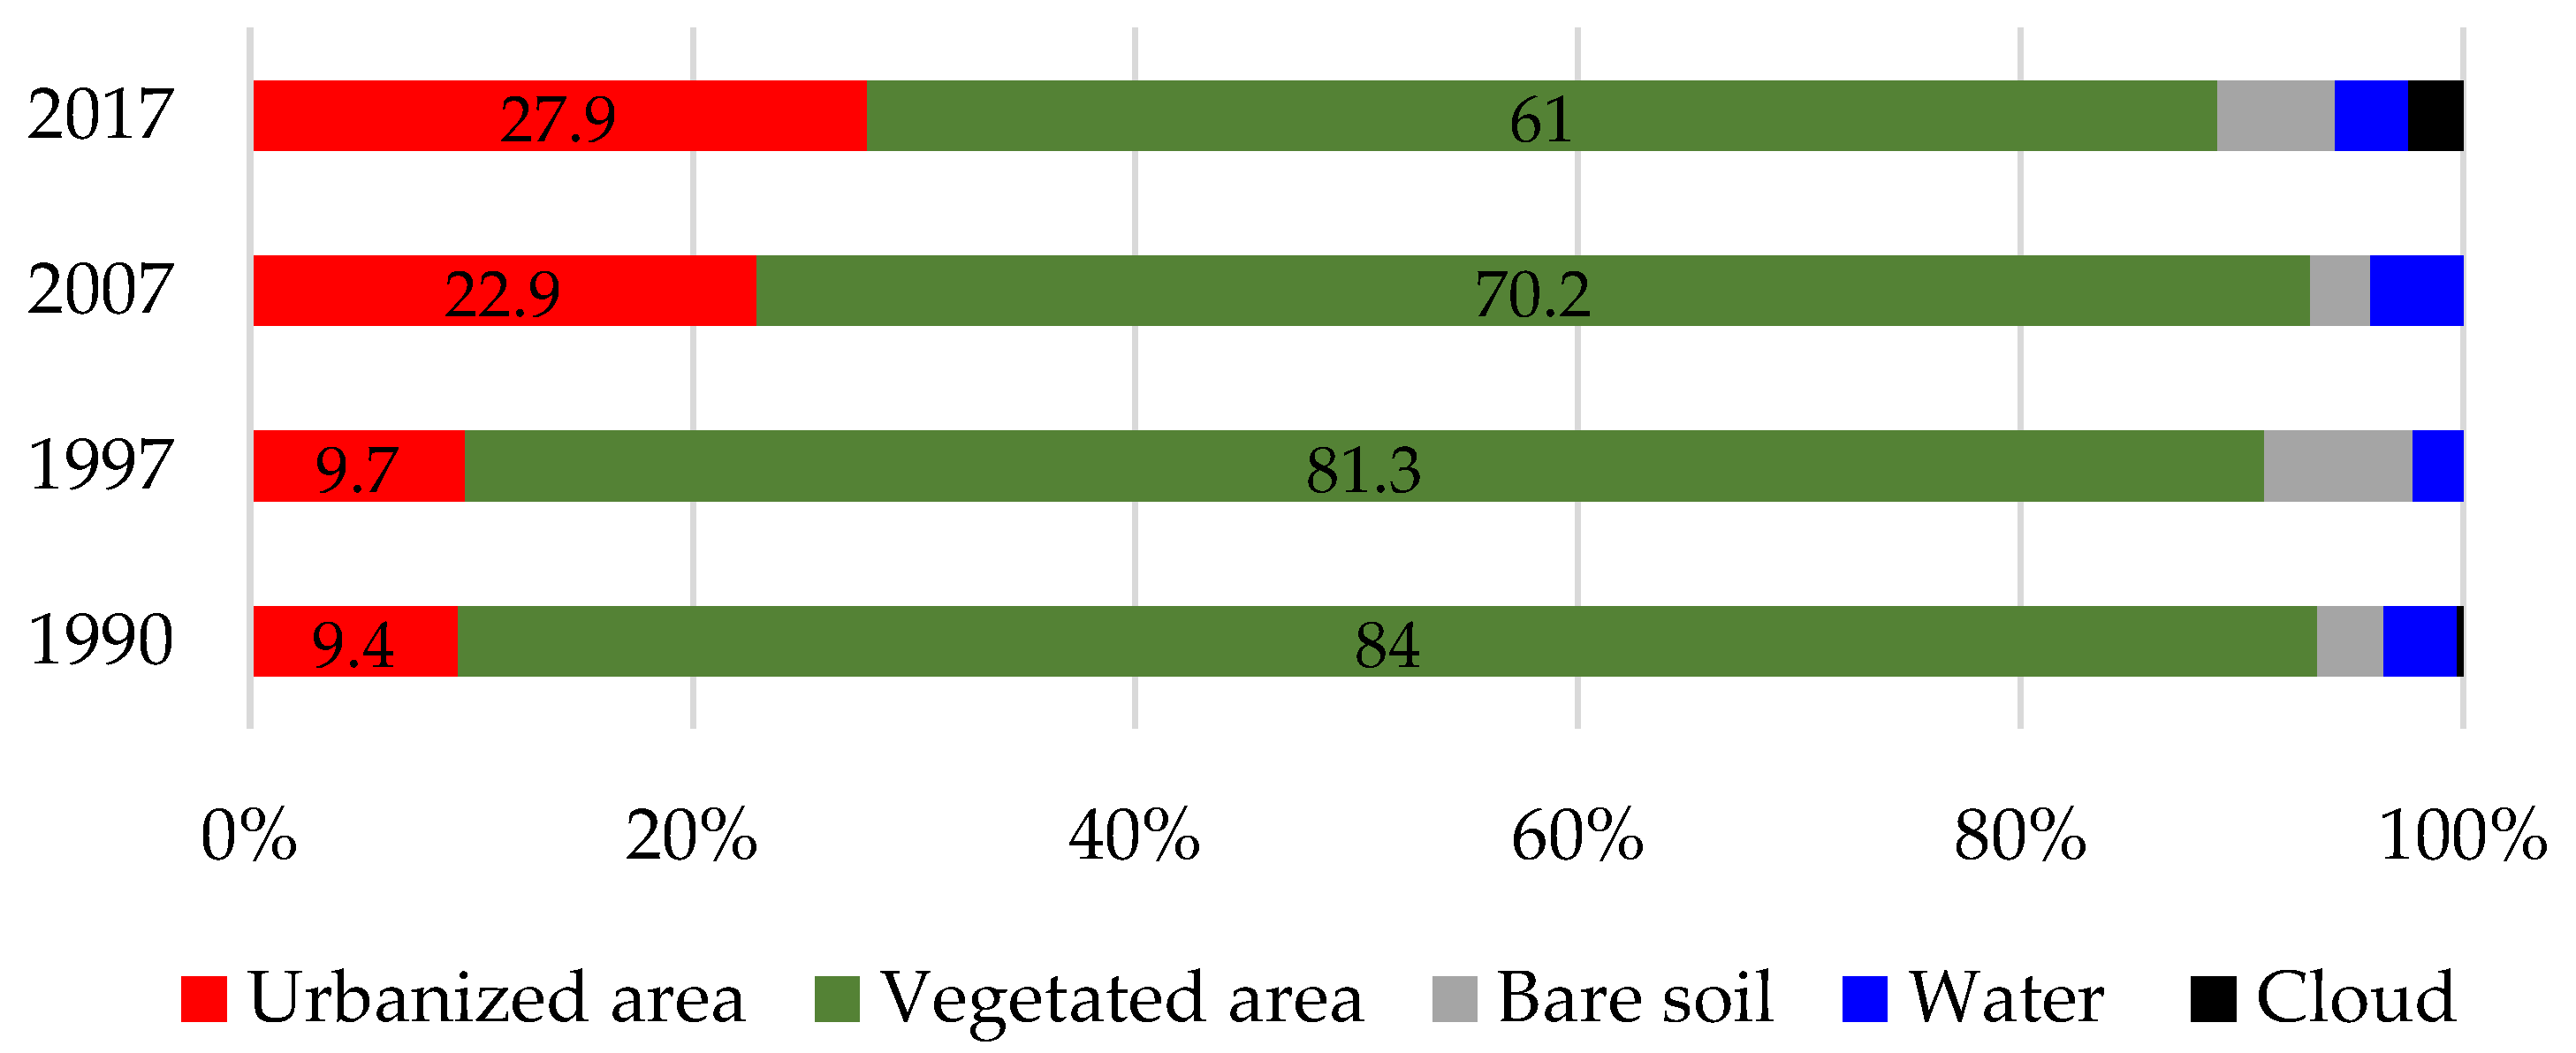
3.2. LCZ Characteristics
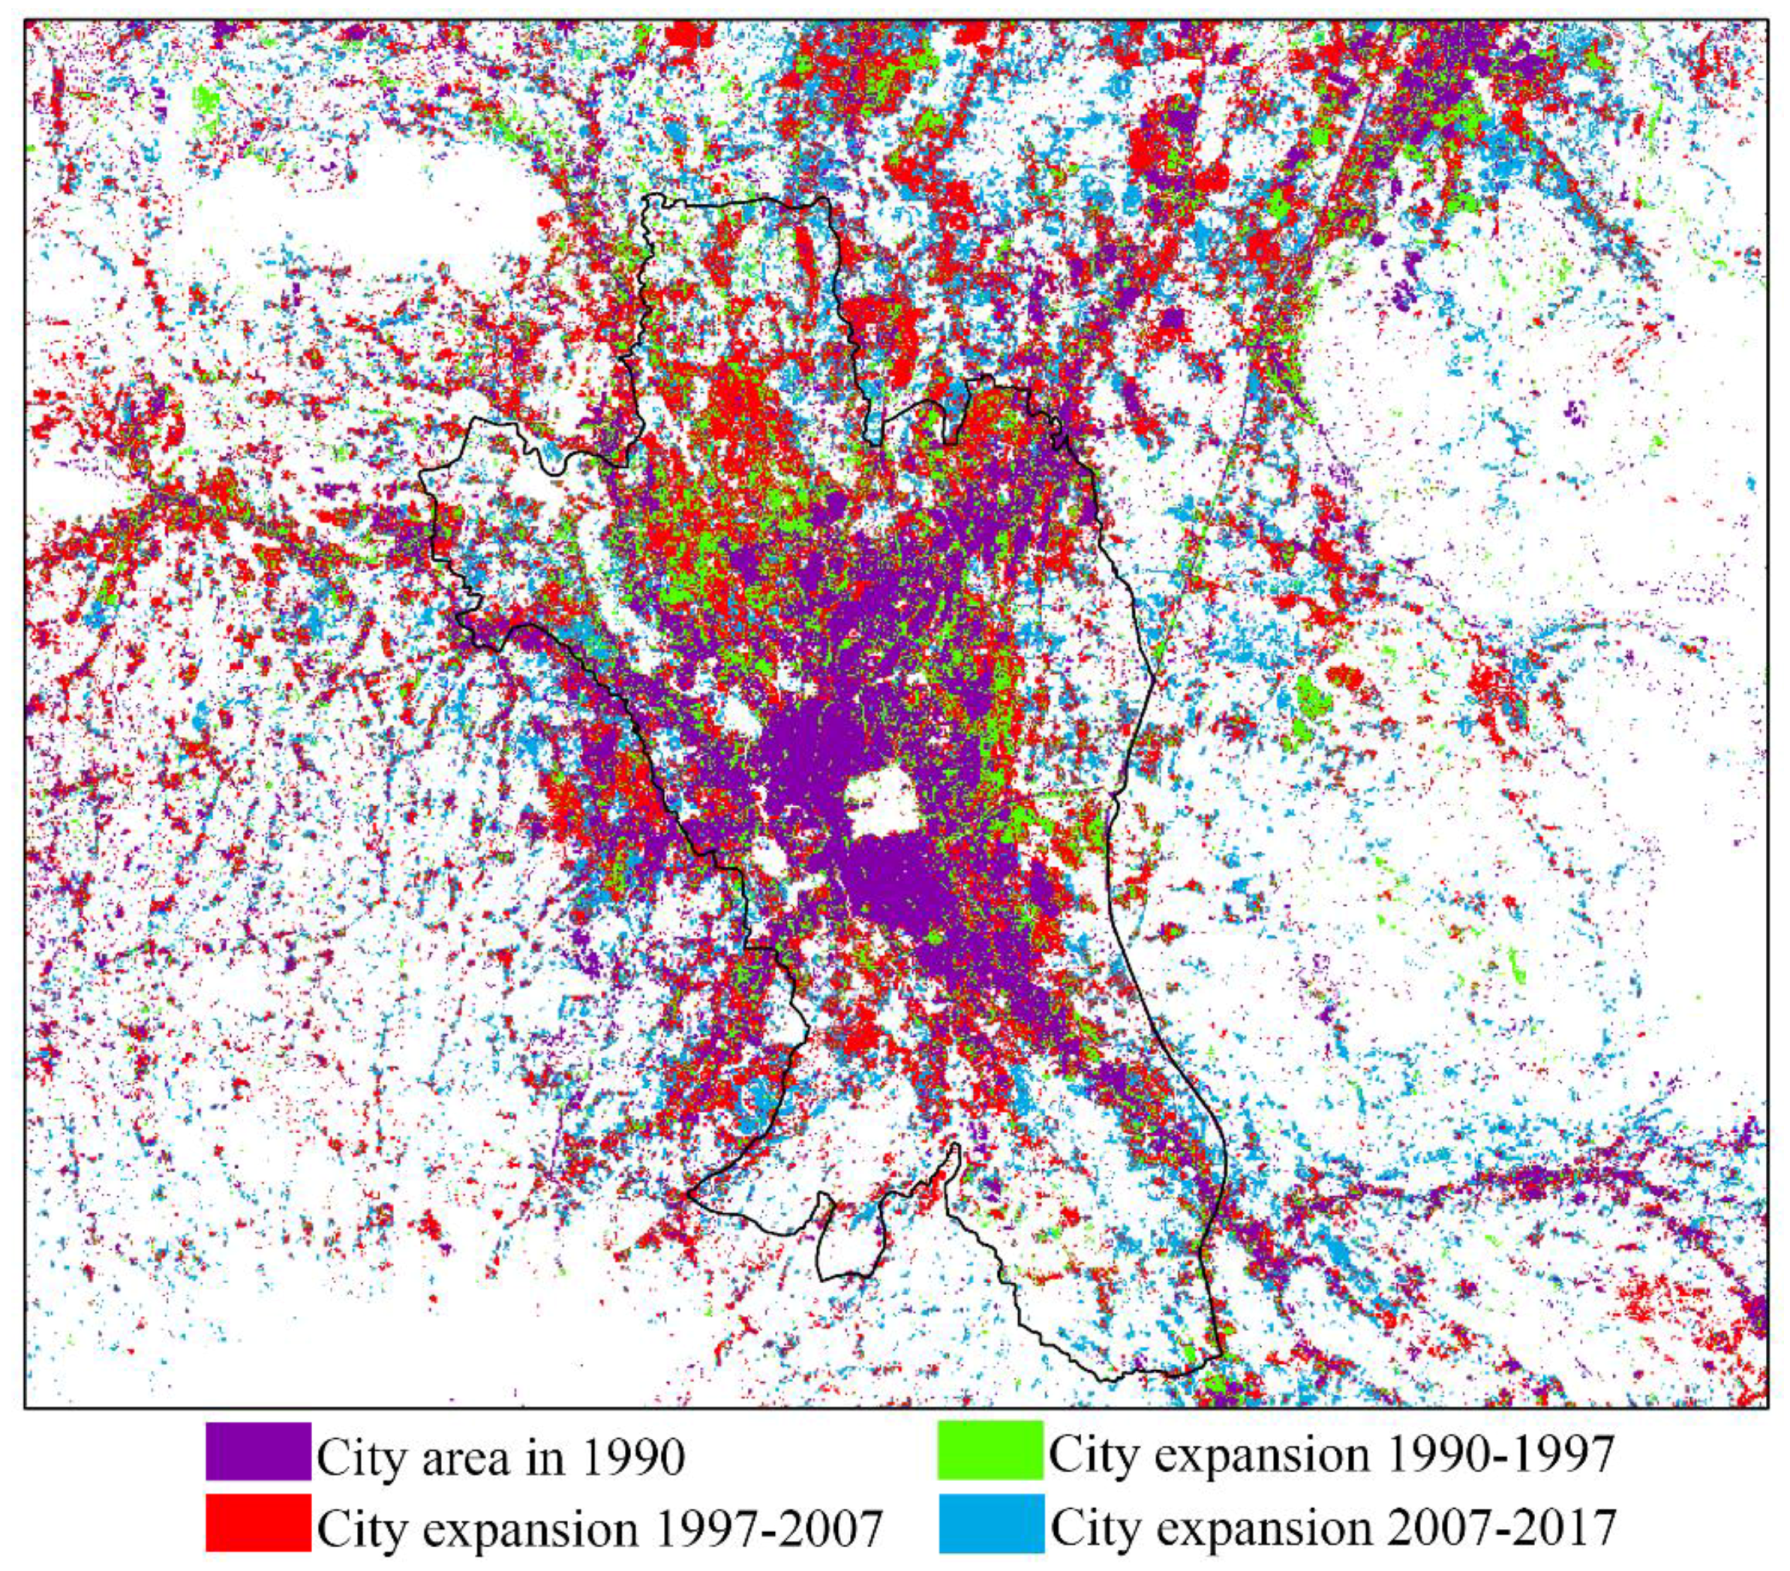
LCZ classification maps in all of the periods are shown in Figure 4. In detail, the total areas and proportion of LCZ results are illustrated in Table 4 and Figure 5. In 1990, the vegetated area (dense trees, scattered trees and bush, and low plants) is predominant land use type (84%), but it continuously decreases to 58.85% in 2017. On the other hand, the urbanized area (compact low-rise building, large low-rise building, roads, and paved) showed a significant increase (9.4% to 27.9%) since 1990–2017.
In the different periods (1990–1997; 1997–2007; and, 2007–2017), the urbanized area increased by 211.7 ha (0.03% of 1990), 8213.7 ha (135.57% of 1997), and 3132.5 ha (21.94% of 2007), respectively. There was double increasing of urbanized area in 1997–2007, and it was also followed by a significant decrease of vegetated area by 6910.5 ha. Thus, in the last period of 2007–2017, the urbanized area was still increasing.
Generally, vegetated area is the main resource of the city expansion. It was found that the city expansion that was synchronized with the decrease of vegetated area. In 1990, Bogor City was dominated by vegetated area, and in 2017, it was mostly covered by urbanized area. In 1997, bare soil appeared in large scale and spread in many places, but then in 2007, it transformed into the urbanized area in 2007. By 2007, the urbanized area expanded broadly beyond the city boundary. In suburban area, the urbanized area sparsely distributed and its character expanded along the roads. In the case of land use change, bare soil is considered as a transition category from vegetated area to urbanized area. Loss of vegetated area has negative impact on conserving the water and ameliorating the micro climate.
In order to explore the changes between the different LCZ types over time, we compared the LCZ change between 1990 and 2017, and the transition matrix of LCZ change is obtained (Table 5). From Table 5, the expansion of the urbanized area was mainly at the expense of vegetated area. There were 12.2% of dense trees and 3.9% of scattered trees and bush that changed to compact low-rise building. This was mainly due to rapid population growth in the recent years. At the same time, there was conversion of dense trees to scattered trees and bush (13.4%), low plants (7.8%), and bare soil (2.6%). The decrease of dense trees means not only for the changes into urbanized area, but also for the conversion into the agricultural area. Generally, the urbanized area increased 18.5% from the total area (9.4% in 1990 and 27.9% in 2017). Vegetated area decreased 23% from the total area (84% in 1990 and 61% in 2017).

3.3. City Expansion

Figure 6 shows the city expansion from 1990 to 2017. The results showed that Bogor City has a rapid city expansion. In 1990–1997, the urbanized area is mostly located inside of Bogor City. In 1997–2007, the highest expansion was observed. In 2007–2017, city expansion spread out to suburban area. The rapid city expansion is expected to continue in the future. By the city expansion, vegetated area in the suburban area will be decreased.

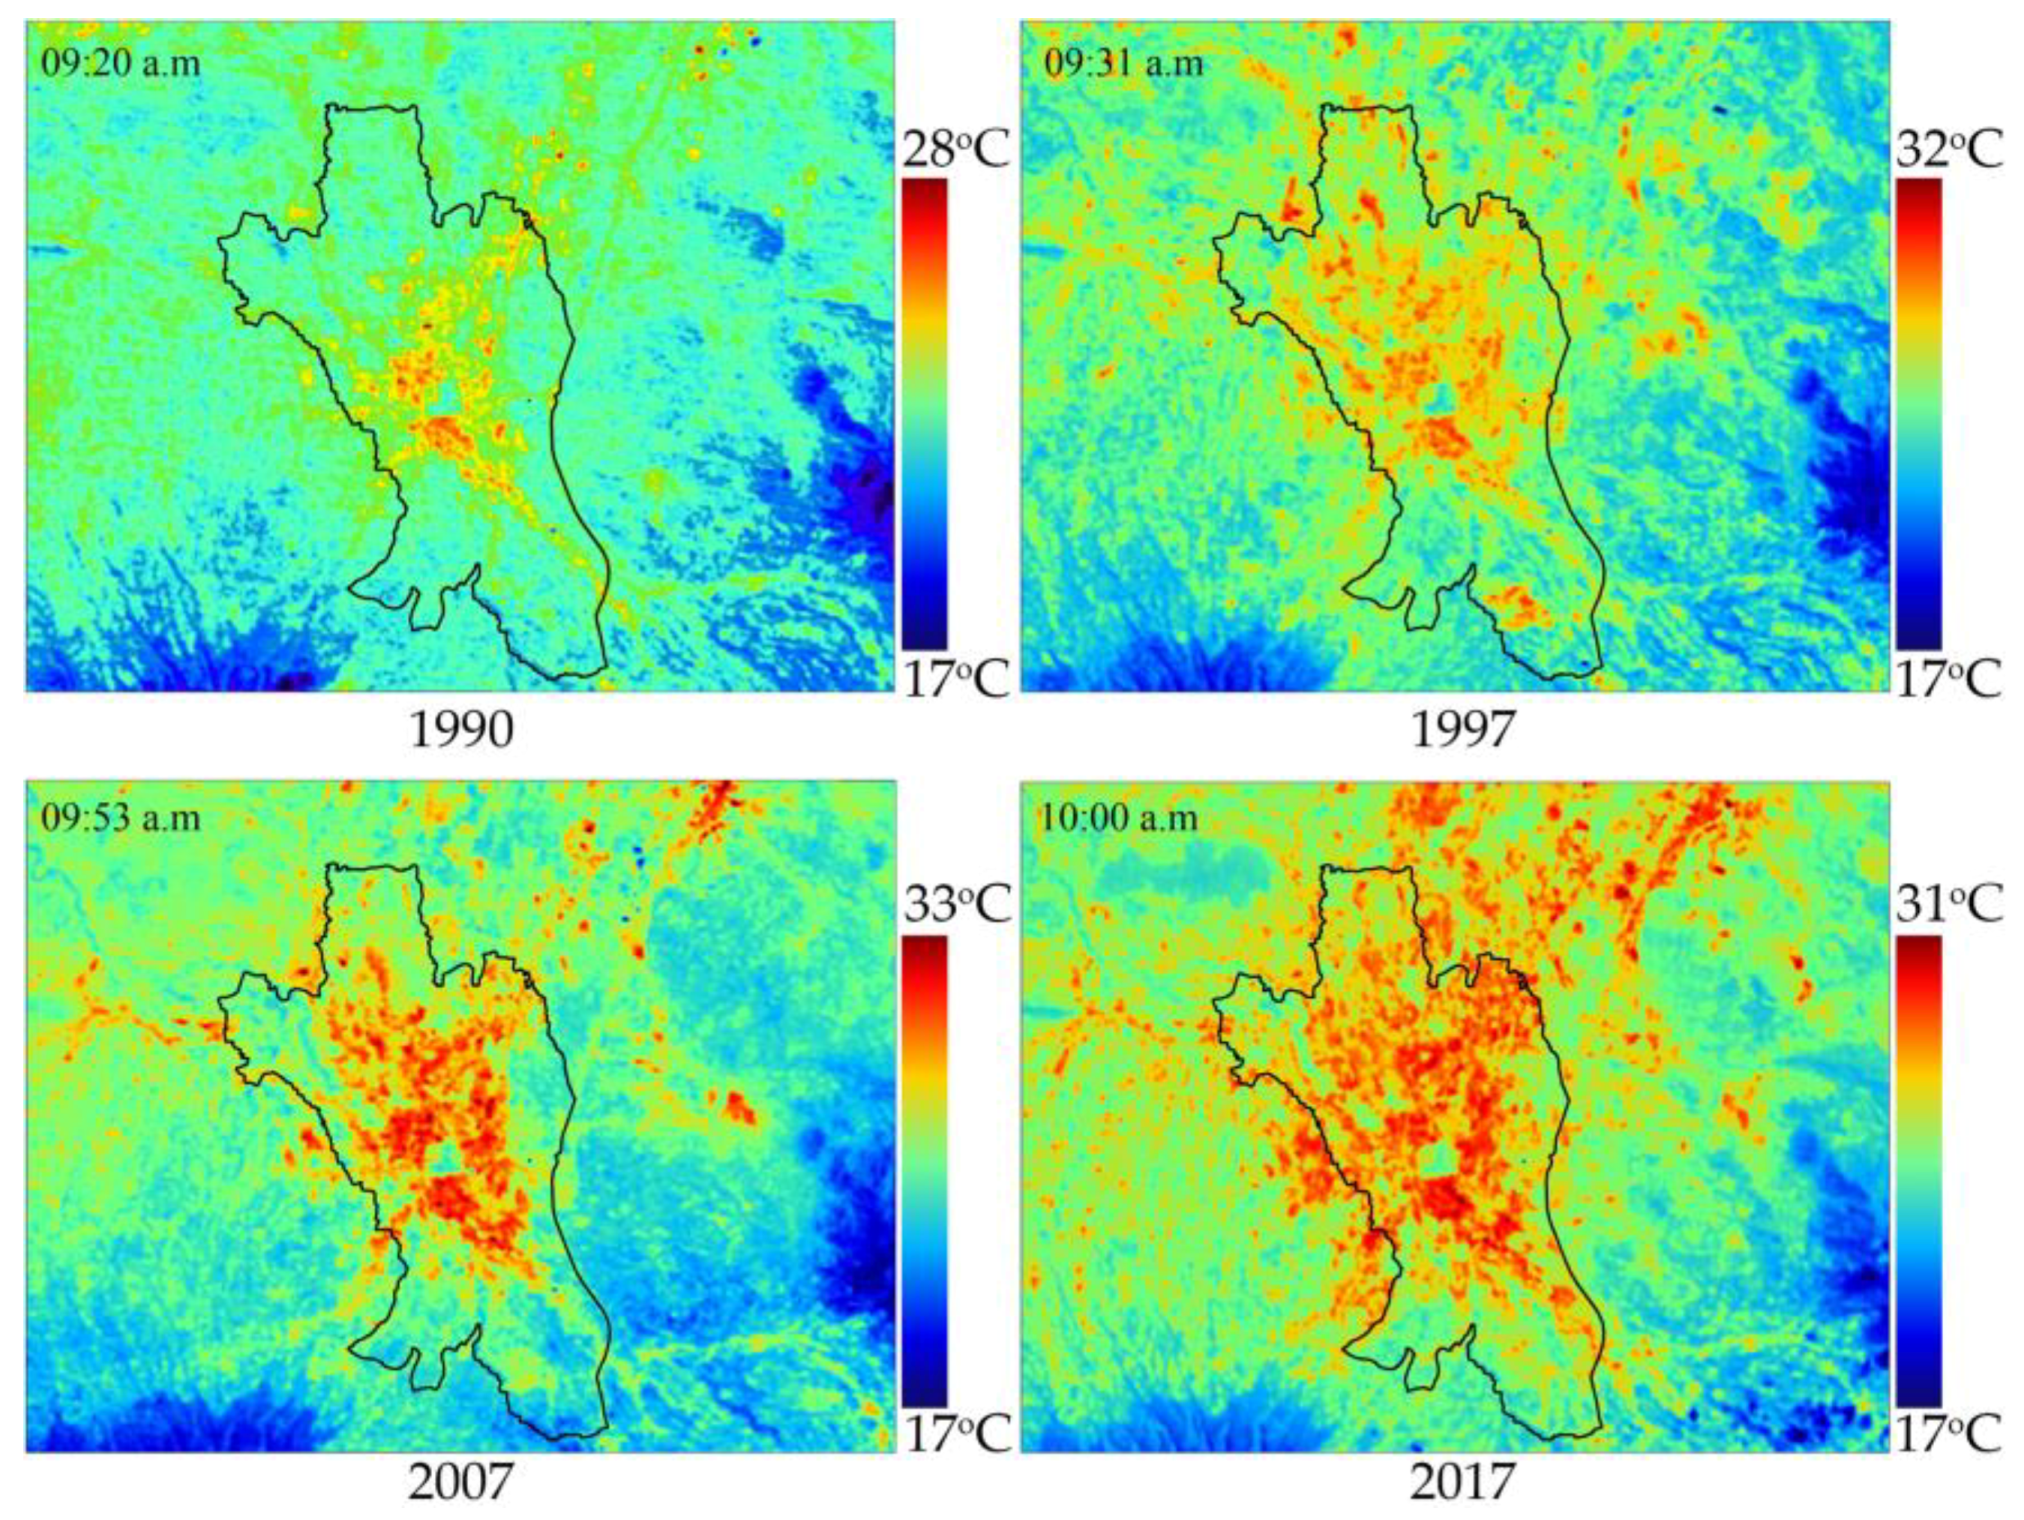
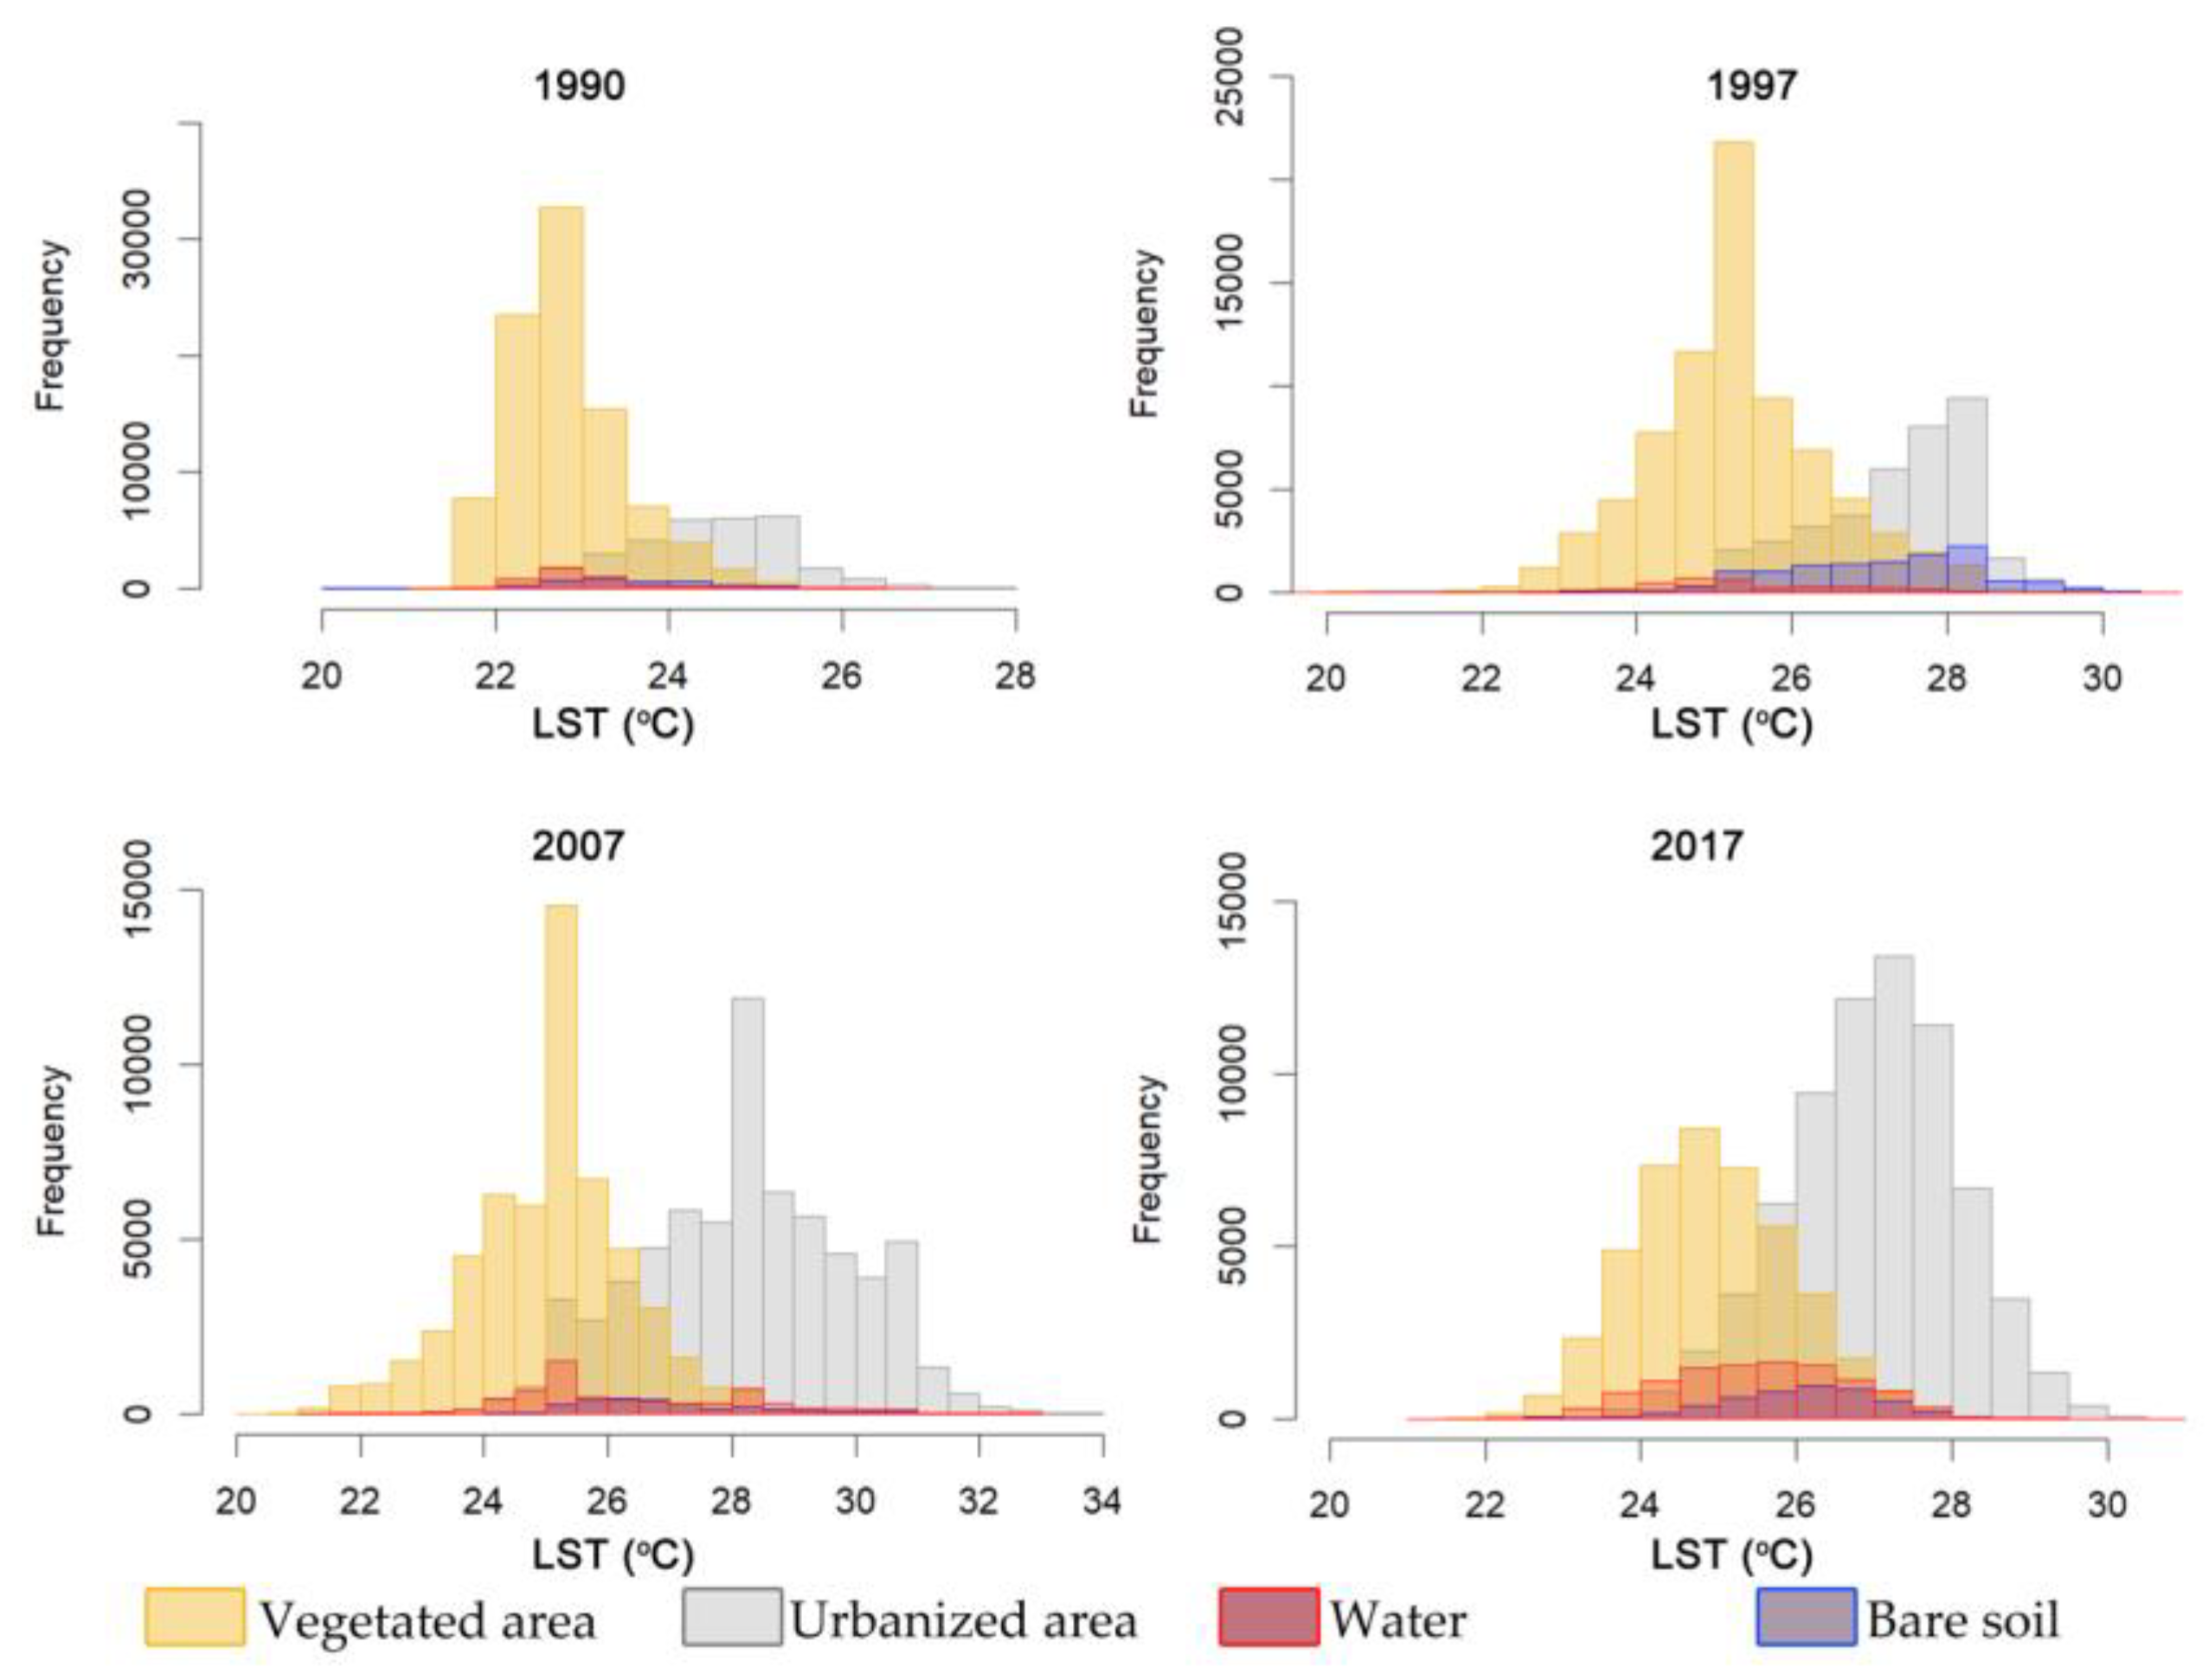
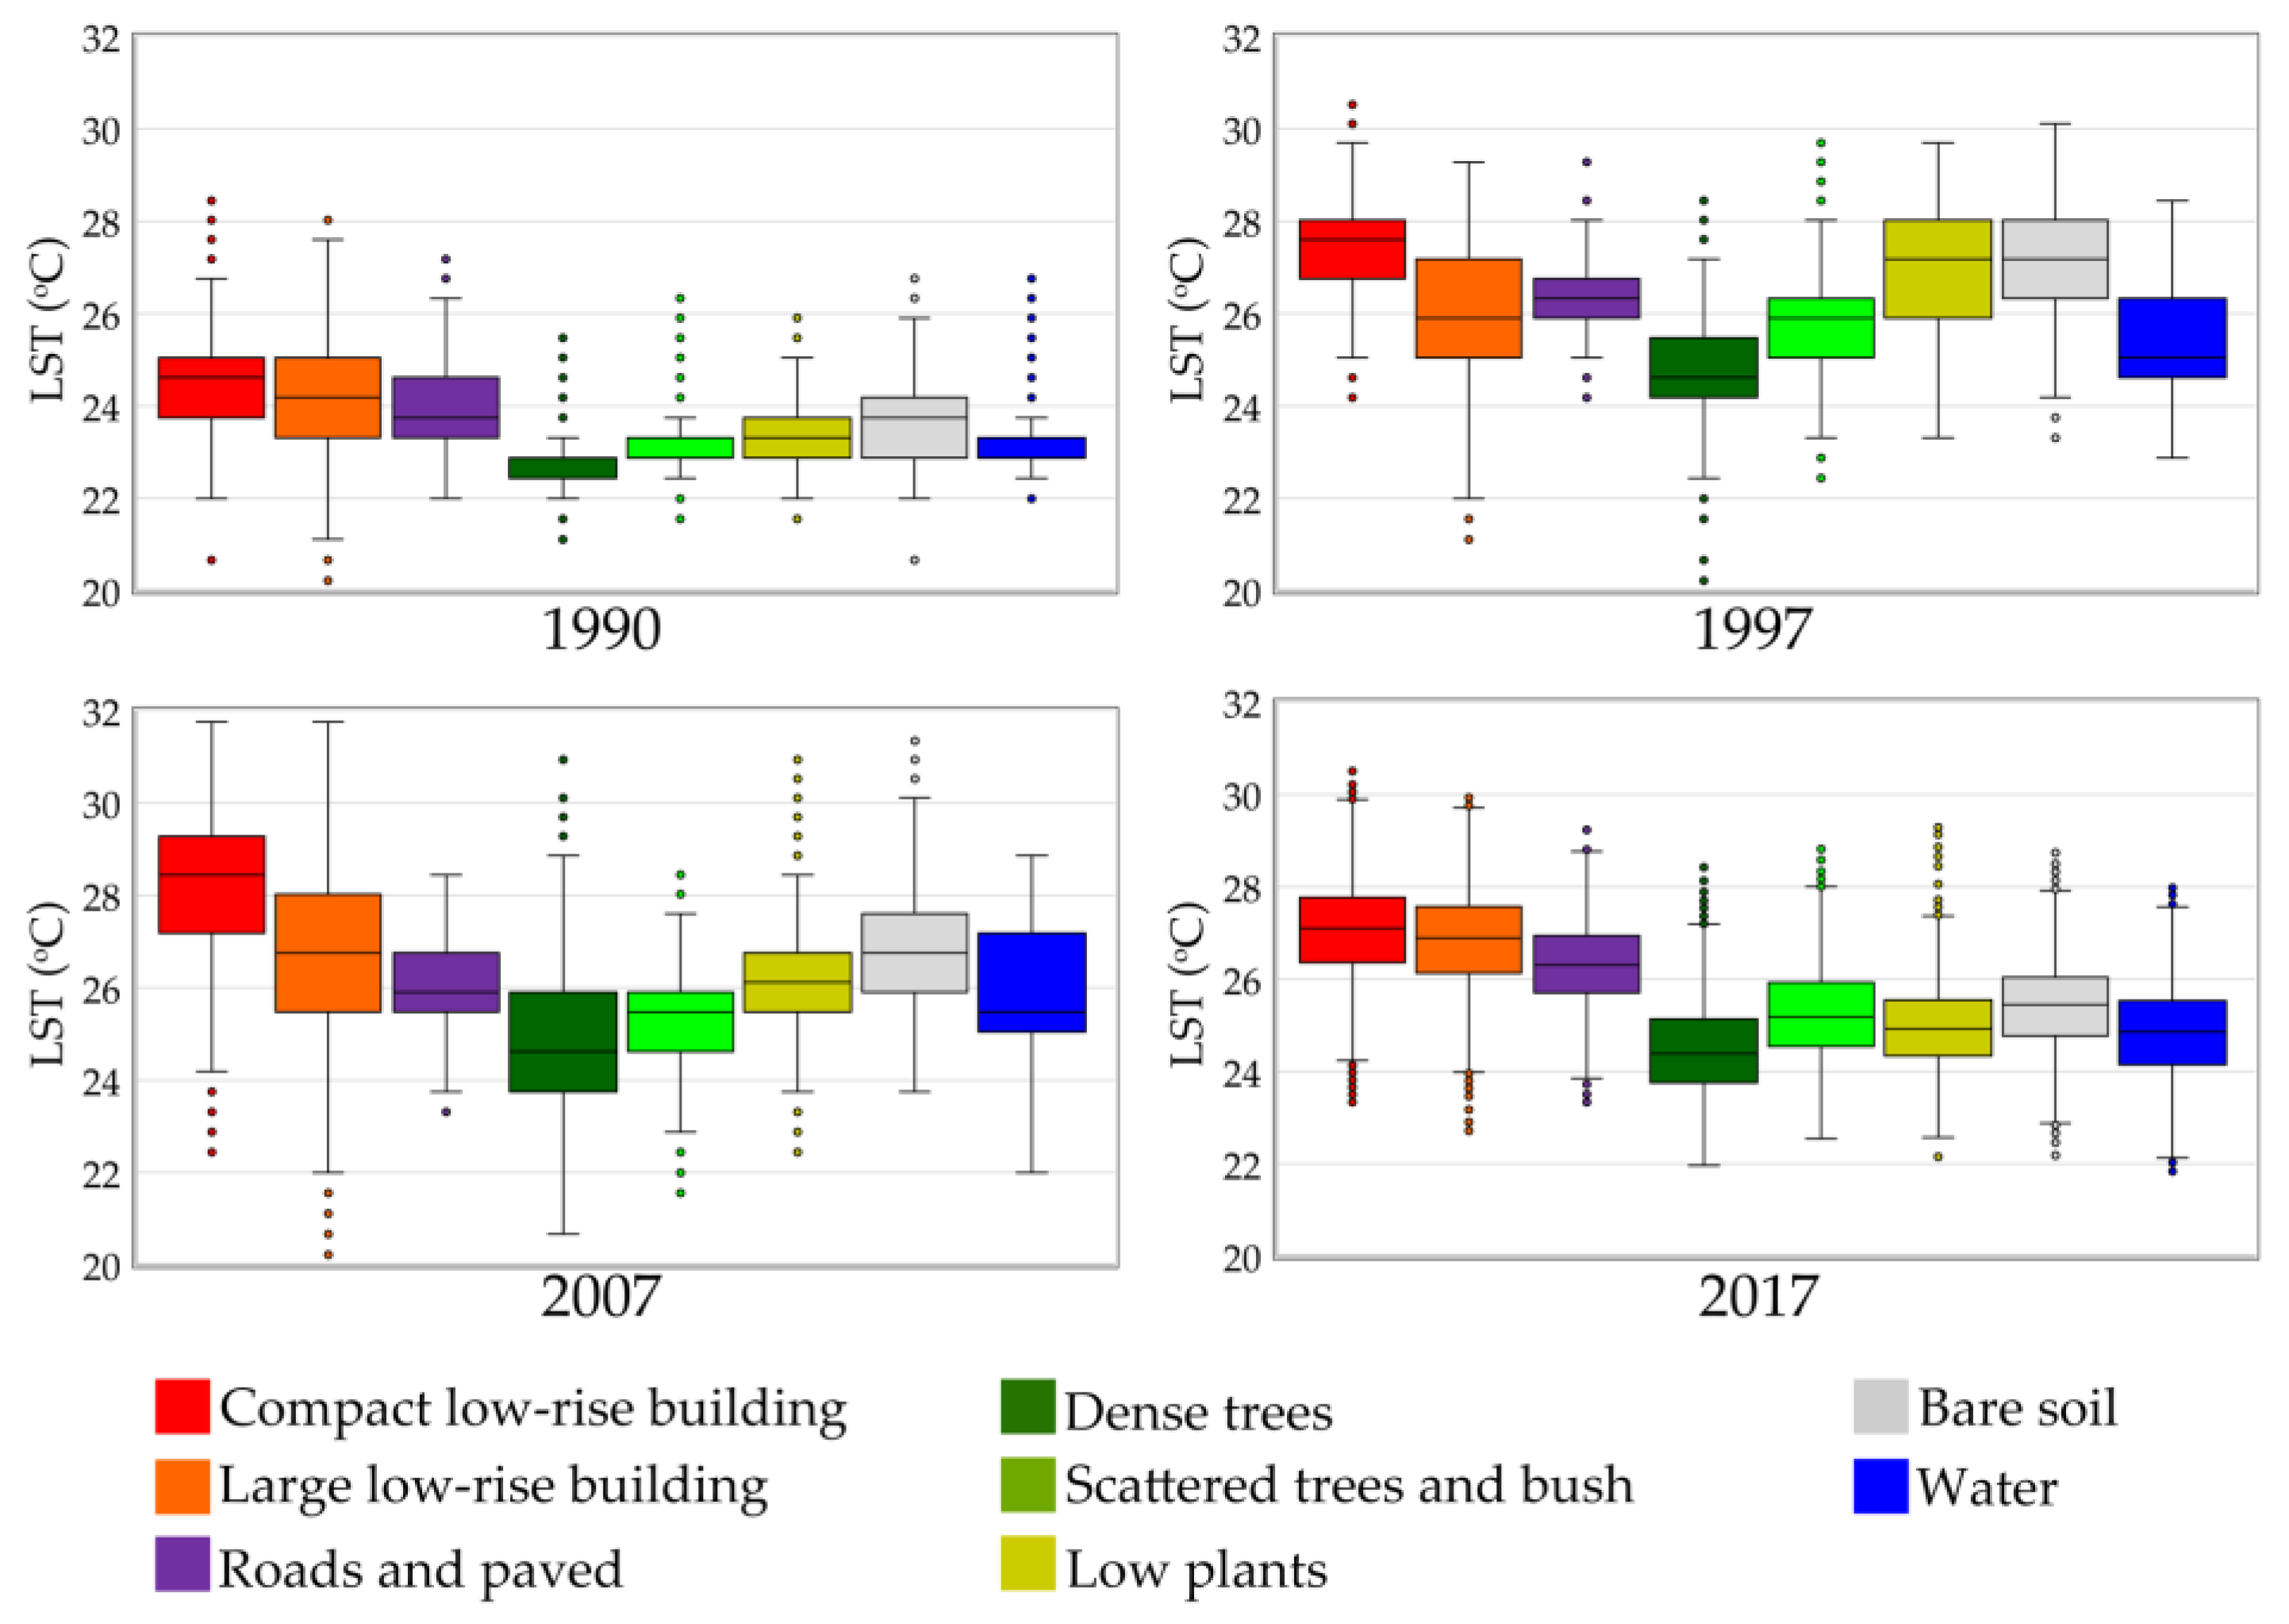
3.4. LST Characteristics and LCZ Type

The LST distribution maps are shown in Figure 7. Over the past 27 years, the high LST value expanded from the inner city to the suburban area. The areas with high LST were consistent with the observed LCZ of Figure 4. High LST is over the threshold value, which can be defined by fitting the urbanized area and LST value with best correlation. They were 23.8 °C in 1990, 26.4 °C in 1997, 26.4 °C in 2007, and 25.7 °C in 2017. In general, higher LST values were found mostly in the center of the Bogor City. By 2017, the area that show high LST value expanded broadly towards suburban area with urban development. The directions of city expansion is from Bogor City to other cities along the roads.
To analyze the phenomenon of surface UHI, the average LSTs of urban and suburban area were calculated in the analyzed area and it was shown in Figure 8. The LST means of urban area in 1990, 1997, 2007, and 2017 were 23.90 °C, 26.69 °C, 27.38 °C, and 26.41 °C, respectively. The LST means of suburban area in the same periods were 22.54 °C, 24.36 °C, 24.40 °C, and 24.15 °C, respectively. The temperature difference between urban and suburban were 1.36 °C in 1990, 2.33 °C in 1997, 2.97 °C in 2007, and 2.26 °C in 2017, which show the intensity of the surface UHI.
Figure 9 shows box plots of LST in different LCZ category. There are significant differences among categories. The LST of each LCZ category have the same pattern. In all of the periods, the highest LST is compact low-rise building and the lowest LST is dense trees. Many studies are also reported that the built-up area showed a high LST [6,11,12,14,26].
The histogram that describes the relationship between LST and LCZ of Bogor City is shown in Figure 10. The LST characteristic and LCZ types at all periods showed that the urbanized area has the highest temperature followed by bare soil, water, and the vegetated area. In 1990, the frequency of the urbanized area is lower than the vegetated area. In 1997 and 2007, urbanized area continuously increased. By 2017, the frequency of urbanized area becomes higher than the vegetated area. It means that Bogor City is mainly covered by urbanized and high temperature area.

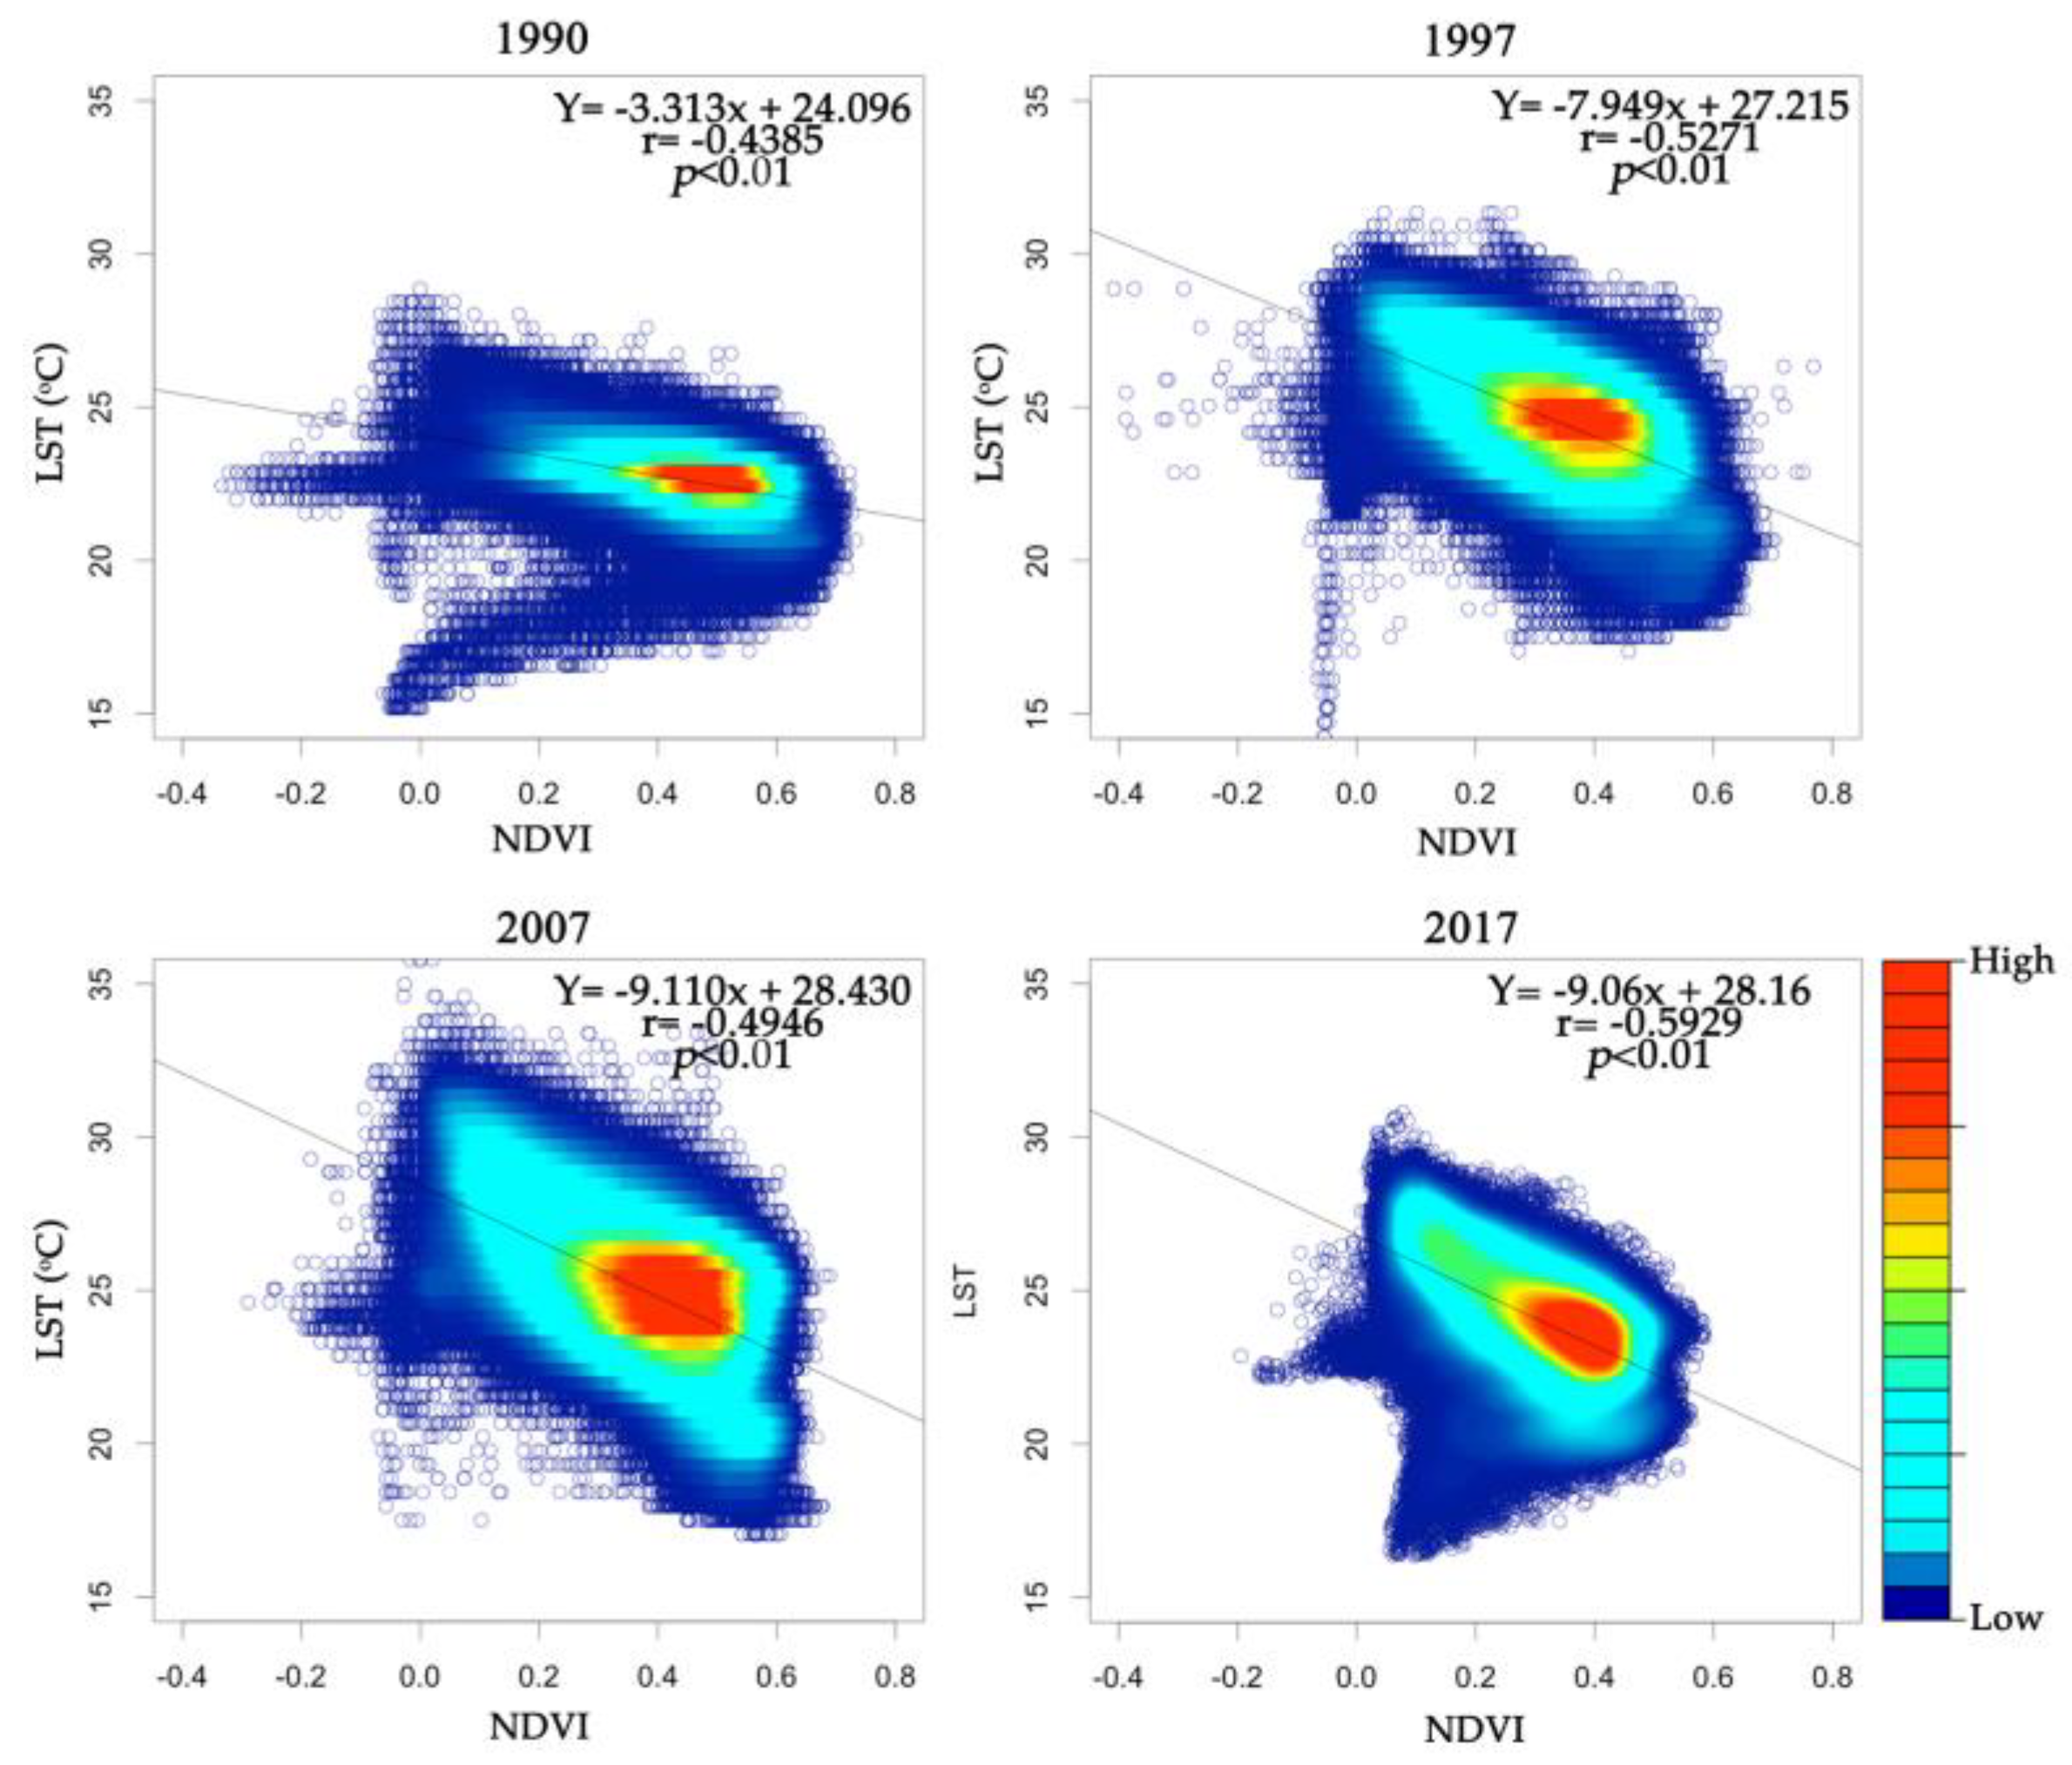
3.5. Relationship between LST and NDVI

Figure 11 shows NDVI distribution maps. In all periods, the areas with low NDVI value indicated the urbanized areas. By comparing the NDVI maps with LST maps (Figure 7), the spatial pattern of NDVI maps coincides with the spatial pattern of LST. The relationship between LST and NDVI is shown in Figure 12. The color of scatter plot represents the density. Red is the highest density and dark blue is the lowest density. Although the correlations between LST and NDVI are not high, they were all statistically significant (p < 0.01). The regression analysis shows that NDVI has a negative correlation with LST, where a low NDVI value is associated with a high LST value. Wang et al. [11], Yuwan et al. [5], and Ranagalage et al. [27] reported that NDVI has negative linear correlation with LST, but it was a weak correlation. It is consistent with our result in this study.
When NDVI value is less than zero, there are some data which shows low LST. These data are not urbanized area but represents water or wetland. With the city expansion, low NDVI and high LST area increase and this makes the negative correlation stronger. In Figure 12, there is a tendency that the correlation values decrease along the time.

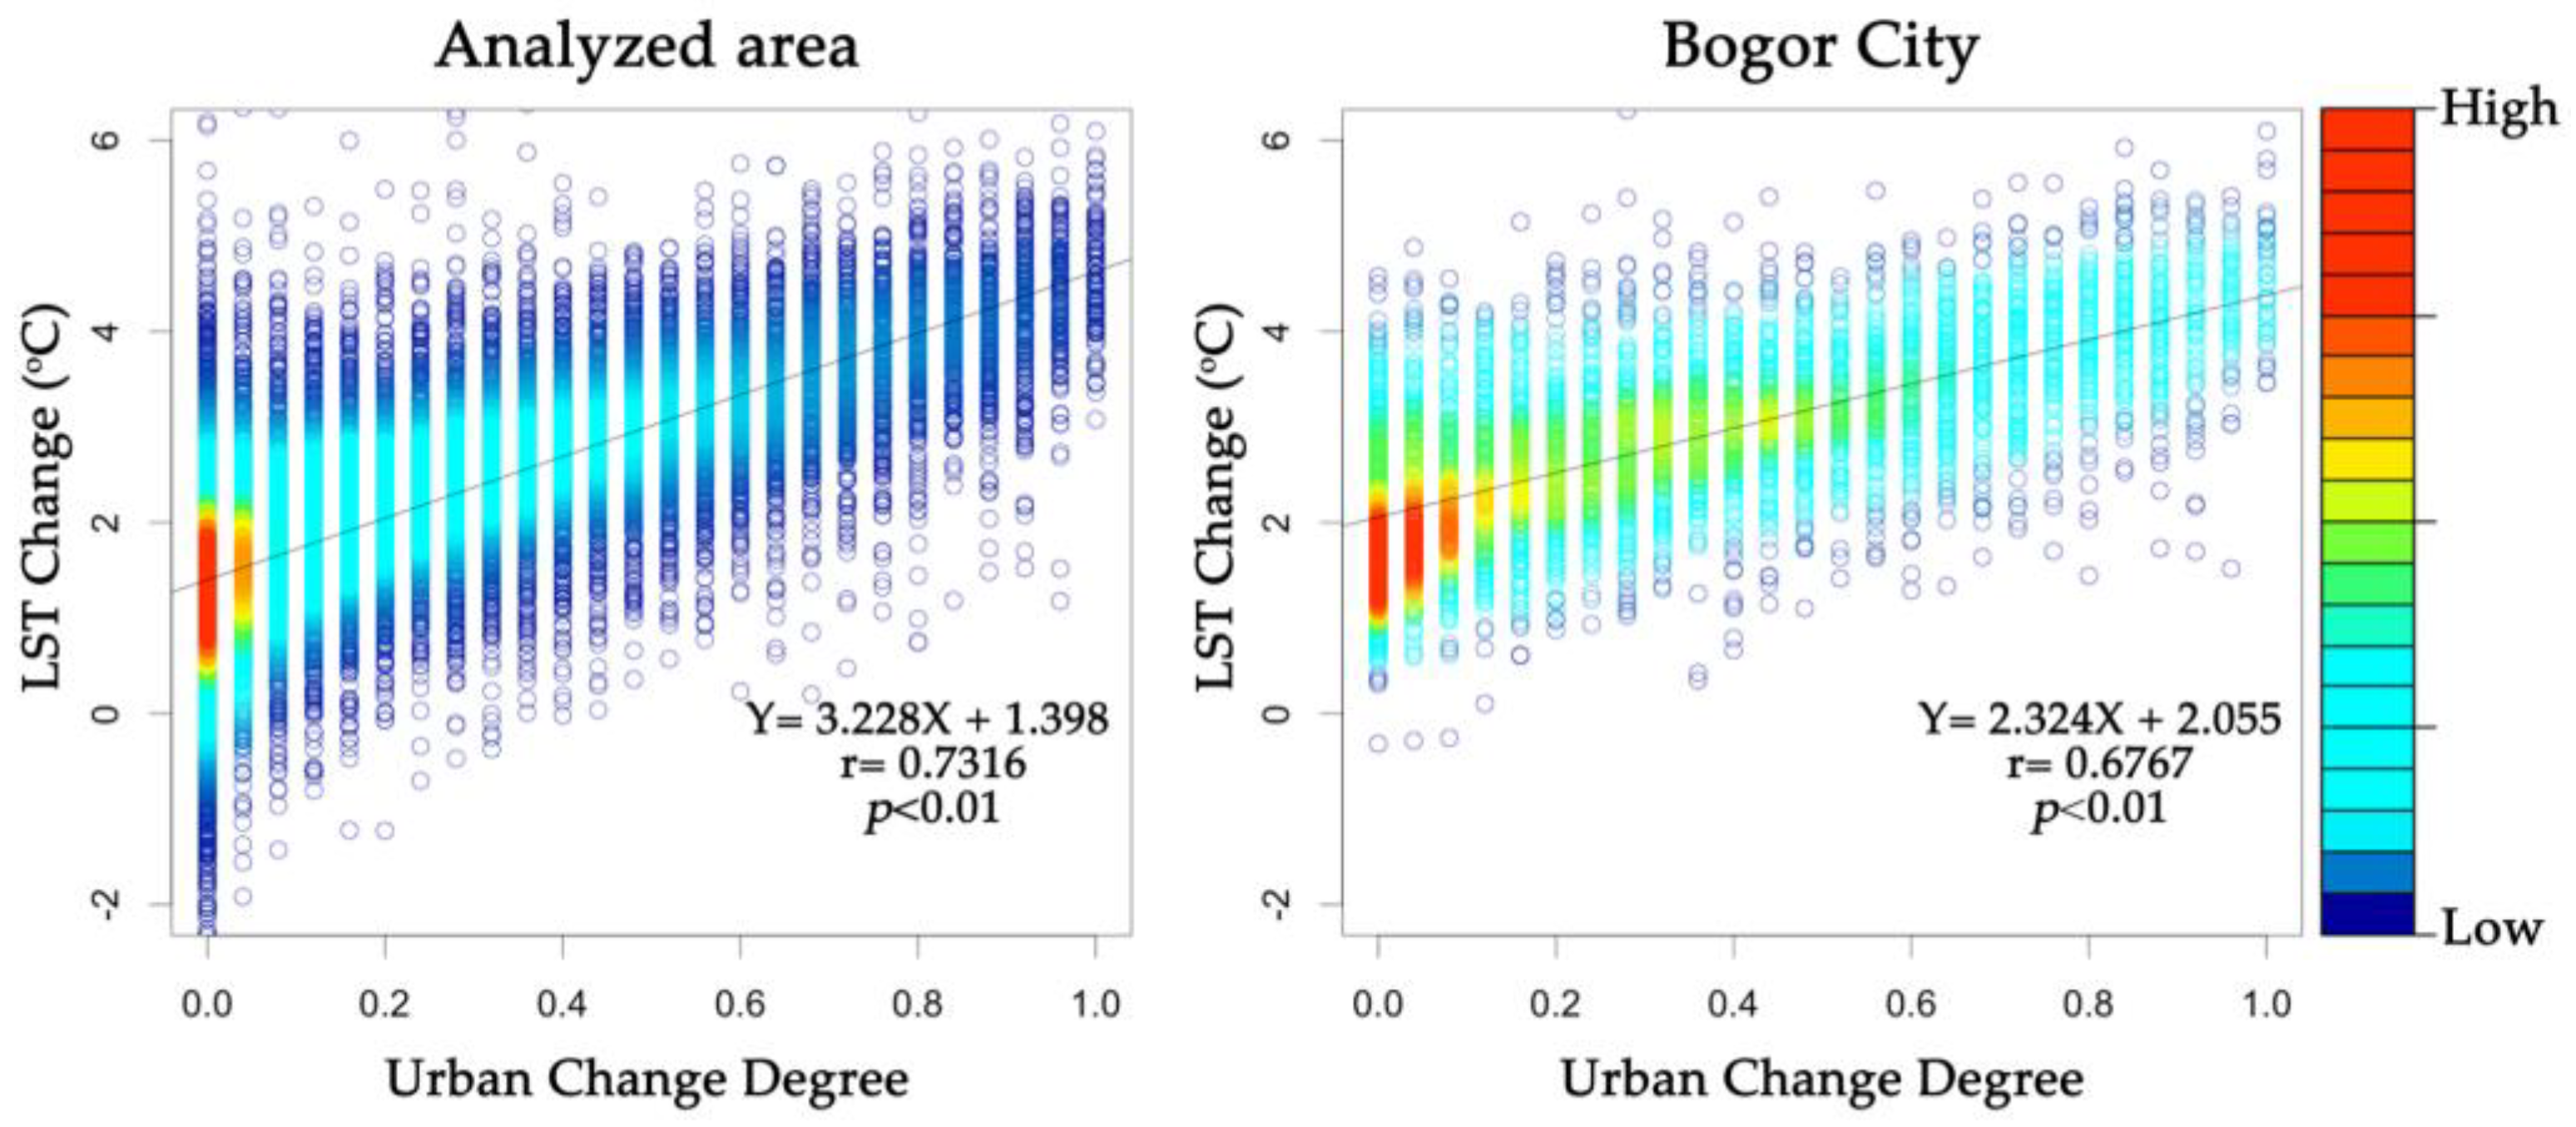
3.6. UHI Expansion and Urban Change Degree

The result of LST change and urban change degree is shown in Figure 13. Figure 13a,b show the LST change and the urban change degree between 1990 and 2017 in the whole analyzed area. Figure 13c,d show the extraction area of Bogor City. The area that shows high LST change corresponds to the urban change from non-urban to urban. The land use changes from non-urban to urban had an influence on the surface UHI.
Figure 14 shows the relation between LST change and the urban change degree. The regression analysis revealed that urban change degree is positively correlated with the LST change both in Bogor City and the whole analyzed area. It indicated that the urban change has an impact to increase the surface temperature. When the urbanized area expanded, it implies the increase of high surface temperature in the analyzed area.

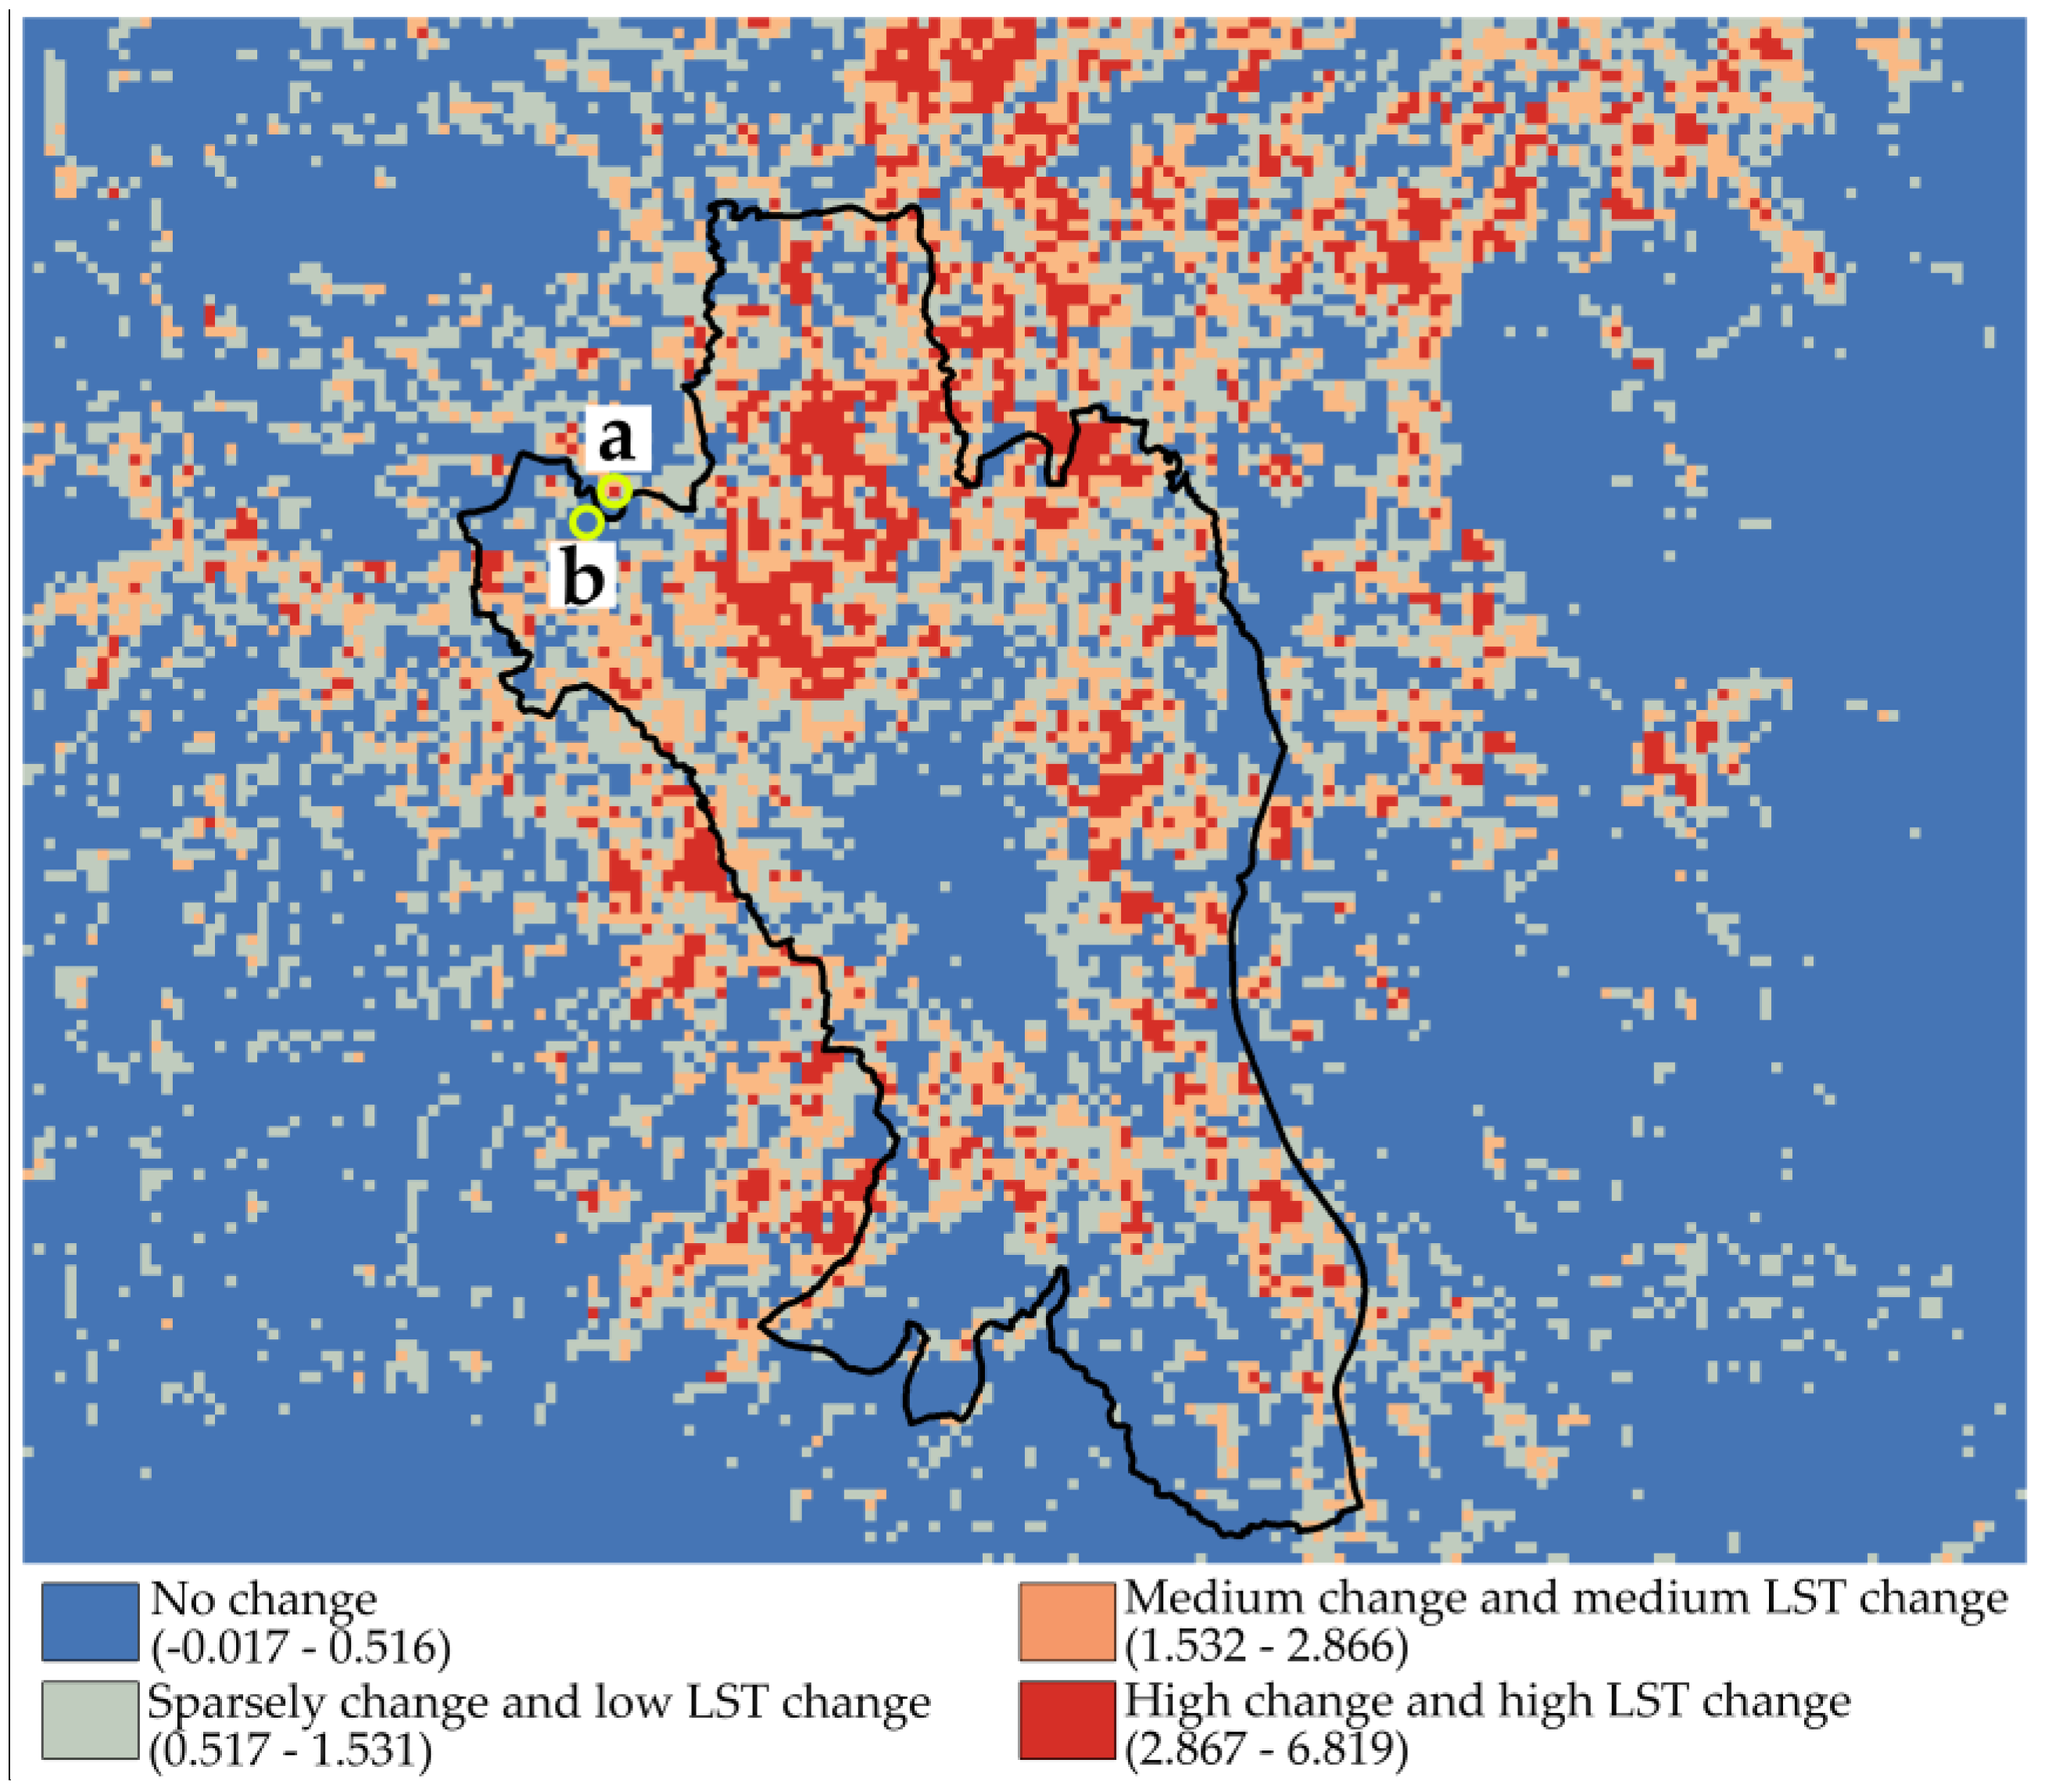
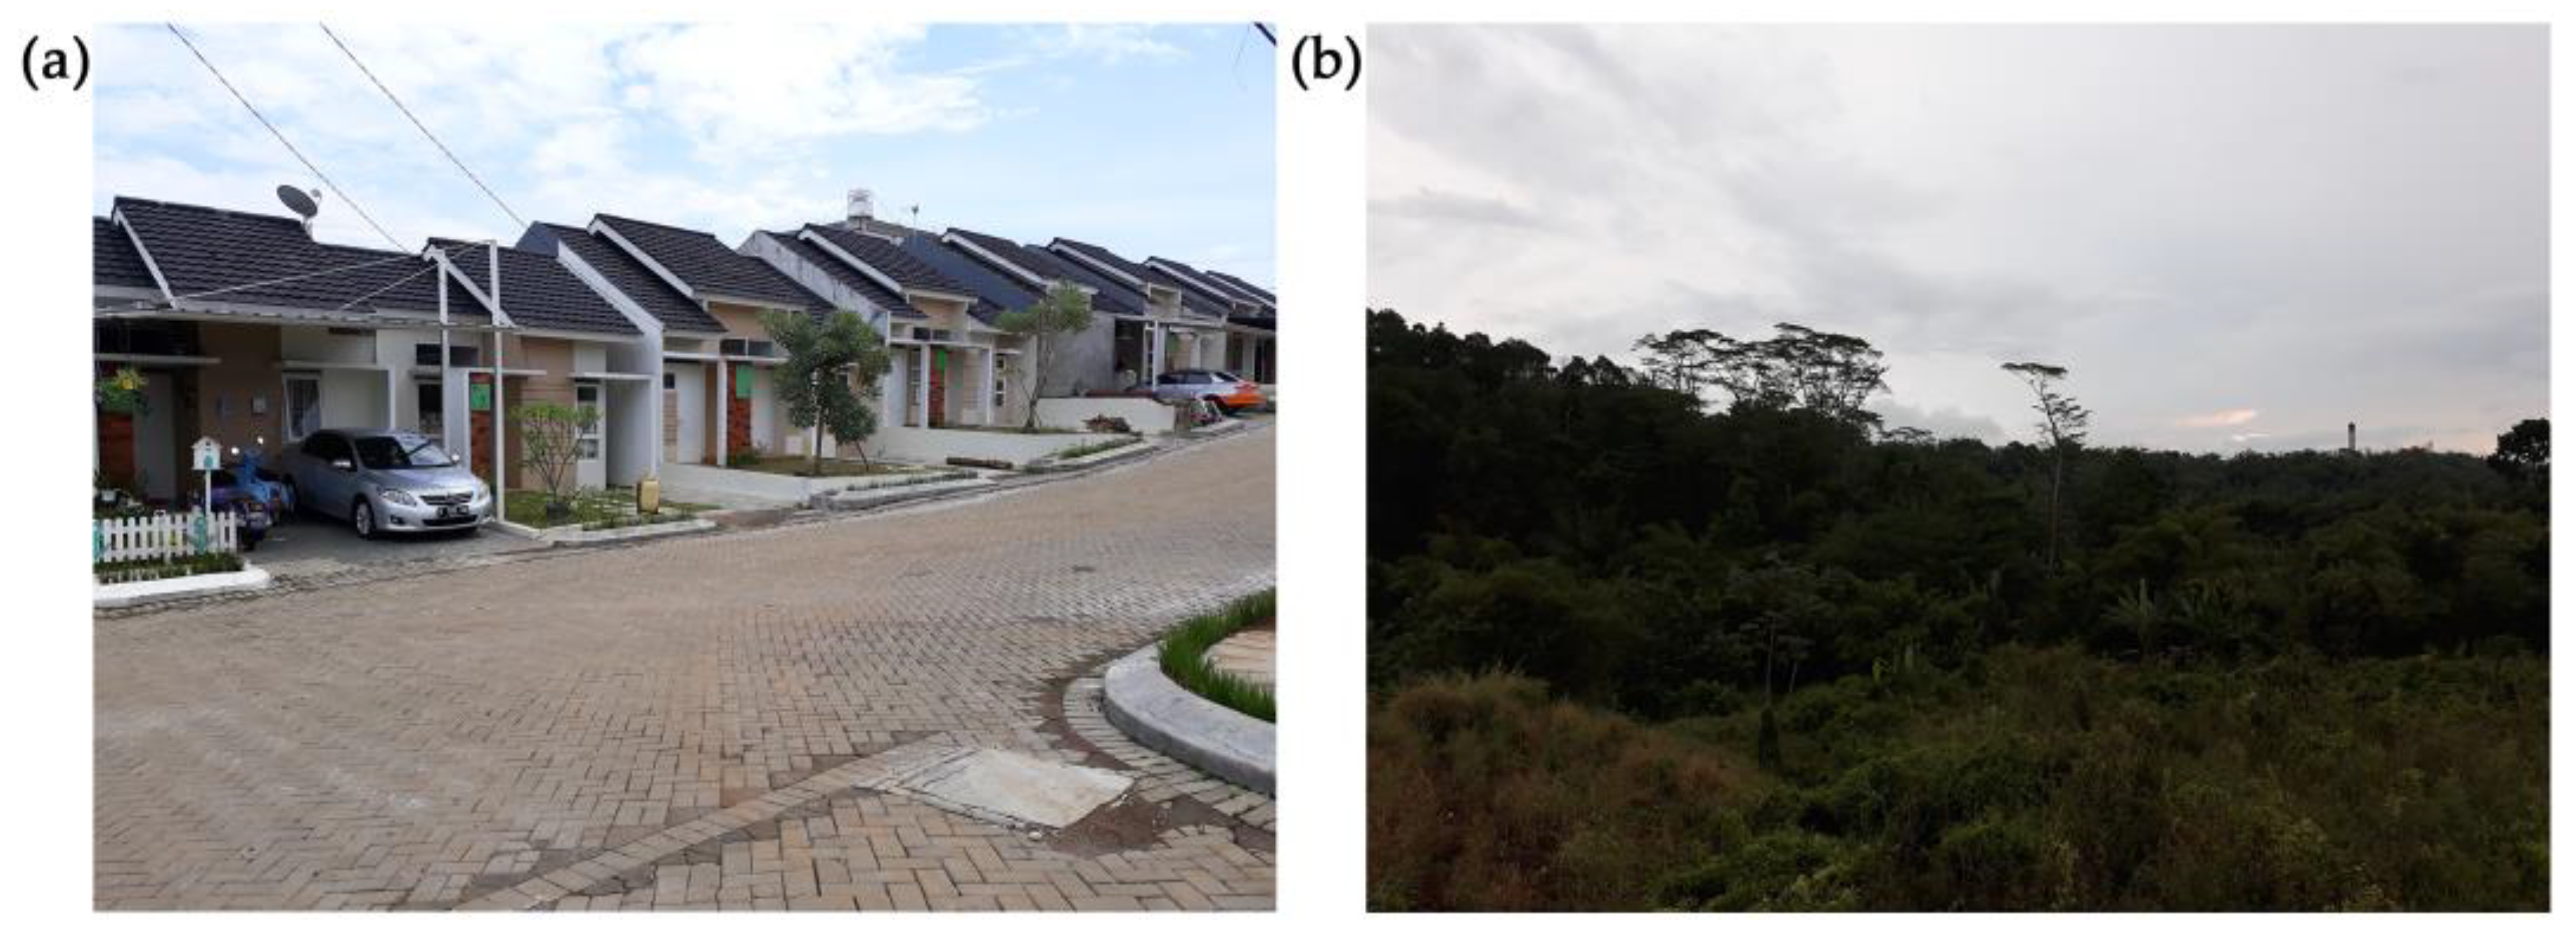
3.7. High Change Area

High change area is defined as the area of high urban change degree and high LST change shown as red pixels in Figure 14. High change area was detected from the multiplication value of the urban change degree and LST change between 1990 and 2017 (Figure 13a,b). Land use change and expansion of surface UHI are summarized in Figure 15. The red area generally corresponds to the changing area from the vegetated area to the residential area. The area represents rapid population growth of Bogor that is influenced by the urbanization of Jakarta. It is expected that Bogor will continuously experience the city expansion. The surface UHI will continuously expand in the suburban area of Bogor because the center area of the Bogor City was already developed.

4. Conclusions

Based on the analysis of LCZ types, it was found that Bogor had experienced city expansion in the last 27 years. In 1990, the vegetated area is predominant land use type, but it continuously decreases until 2017. On the other hand, the urbanized area showed a significant increase (9.4% to 27.9%), as shown in Figure 5. About the rate of city expansion in difference periods (1990–1997, 1997–2007, & 2007–2017), the highest city expansion occurred in 1997–2007 by 8213.7 ha. The city expansion was mainly in Bogor City and was later distributed in suburban along the roads that linked to other cities.
By analyzing the LST and LCZ categories, the spatial pattern of LST distribution has the relation with LCZ pattern in all of the periods. The characteristic of land use types from the highest temperature in sequence are the urbanized area, bare soil, water, and vegetated area. It indicated that the urban area is warmer than the suburban area because of the urban area is mainly covered by built-up area (compact low-rise building, large low-rise building, roads, and paved). Over the past 27 years, the surface UHI expanded from the inner city towards the suburban area. The temperature difference between urban and suburban due to the city expansion were 1.36 °C in 1990, 2.33 °C in 1997, 2.97 °C in 2007, and 2.26 °C in 2017. The LST change and urban change degree have strong positive correlation and we concluded that the urban expansion has an impact to increase the surface UHI. The result of this study provided valuable information for the future development and the spatial planning of Bogor City. In the further study, the analysis of UHI defined by air temperature and its relation with the LCZ is necessary for the application on urban planning.

Author Contributions

A.N. designed and performed the experiments, analysis, and wrote the paper; T.H. supervised and directed the research work.

Acknowledgments

The authors would like to thank the editor and the anonymous reviewers for their systematic reviews and valuable comments.

Conflicts of Interest

The authors declare no conflict of interest.

References

  1. Voogt, J.A.; Oke, T.R. Thermal remote sensing of urban climates. Remote Sens. Environ. 2003, 86, 370–384. [Google Scholar] [CrossRef]
  2. Streutker, D.R. A remote sensing study of the urban heat island of Houston, Texas. Int. J. Remote Sens. 2002, 23, 2595–2608. [Google Scholar] [CrossRef]
  3. Roth, M.; Oke, T.R.; Emery, W.J. Satellite-derived urban heat islands from three coastal cities and the utilization of such data in urban climatology. Int. J. Remote Sens. 1989, 37–41. [Google Scholar] [CrossRef]
  4. Estoque, R.C.; Murayama, Y.; Myint, S.W. Effects of landscape composition and pattern on land surface temperature: An urban heat island study in the megacities of Southeast Asia. Sci. Total Environ. 2017, 577, 349–359. [Google Scholar] [CrossRef] [PubMed]
  5. Yuan, F.; Bauer, M.E. Comparison of impervious surface area and normalized difference vegetation index as indicators of surface urban heat island effects in Landsat imagery. Remote Sens. Environ. 2007, 106, 375–386. [Google Scholar] [CrossRef]
  6. Dousset, B.; Gourmelon, F. Satellite multi-sensor data analysis of urban surface temperatures and landcover. ISPRS J. Photogram. Remote Sens. 2003, 58, 43–54. [Google Scholar] [CrossRef]
  7. Chen, X.L.; Zhao, H.M.; Li, P.X.; Yin, Z.Y. Remote sensing image-based analysis of the relationship between urban heat island and land use/cover changes. Remote Sens. Environ. 2006, 104, 133–146. [Google Scholar] [CrossRef]
  8. Rhee, J.; Park, S.; Lu, Z. Relationship between land cover patterns and surface temperature in urban areas. GISci. Remote Sens. 2014, 51, 521. [Google Scholar] [CrossRef]
  9. Liu, L.; Zhang, Y. Urban Heat Island Analysis Using the Landsat TM Data and ASTER Data: A Case Study in Hong Kong. Remote Sens. 2011, 1535–1552. [Google Scholar] [CrossRef]
  10. Zhang, X.; Estoque, R.C.; Murayama, Y. An urban heat island study in Nanchang City, China based on land surface temperature and social-ecological variables. Sustain. Cities Soc. 2017, 32, 557–568. [Google Scholar] [CrossRef]
  11. Wang, H.; Zhang, Y.; Tsou, J.; Li, Y. Surface Urban Heat Island Analysis of Shanghai (China) Based on the Change of Land Use and Land Cover. Sustainability 2017, 9, 1538. [Google Scholar] [CrossRef]
  12. Liu, W.; Feddema, J.; Hu, L.; Zung, A.; Brunsell, N. Seasonal and diurnal characteristics of land surface temperature and major explanatory factors in Harris County, Texas. Sustainability 2017, 9. [Google Scholar] [CrossRef]
  13. Weng, Q.; Lu, D.; Schubring, J. Estimation of land surface temperature-vegetation abundance relationship for urban heat island studies. Remote Sens. Environ. 2004, 89, 467–483. [Google Scholar] [CrossRef]
  14. Connors, J.P.; Galletti, C.S.; Chow, W.T.L. Landscape configuration and urban heat island effects: Assessing the relationship between landscape characteristics and land surface temperature in Phoenix, Arizona. Landsc. Ecol. 2013, 28, 271–283. [Google Scholar] [CrossRef]
  15. Chen, X.; Zhang, Y. Impacts of urban surface characteristics on spatiotemporal pattern of land surface temperature in Kunming of China. Sustain. Cities Soc. 2017, 32, 87–99. [Google Scholar] [CrossRef]
  16. Stewart, I.D.; Oke, T.R. Local climate zones for urban temperature studies. Bull. Am. Meteorol. Soc. 2012, 93, 1879–1900. [Google Scholar] [CrossRef]
  17. Bechtel, B.; Foley, M.; Mills, G.; Ching, J.; See, L.; Alexander, P.; Gál, T. CENSUS of Cities: LCZ Classification of Cities (Level 0)—Workflow and Initial Results from Various Cities. In Proceedings of the 9th International Conference on Urban Climate jointly with 12th Symposium on the Urban Environment, Toulouse, France, 20–24 July 2015. [Google Scholar] [CrossRef]
  18. BPS-Statistics of Bogor City. (2015). Bogor City in Figures. Bogor City: Statistics of Bogor City, Indonesia. Available online: https://www.westjavainc.org/wp-content/uploads/2016/04/Kota-Bogor-Dalam-Angka-2015.pdf (accessed on 19 August 2017).
  19. BPS-Statistics of Bogor City. (2016). Bogor City in Figures. Bogor City: Statistics of Bogor City, Indonesia. Available online: http://bappeda.kotabogor.go.id/images/slidertabs/90f869bc2bc1549f849cef02c06f84cd.pdf (accessed on 19 August 2017).
  20. Jaya, I.N.S. Digital Image Analysis: Perspective of Remote Sensing for Natural Resources Management; Bogor Agricultural University Press: Bogor City, Indonesia, 2007. [Google Scholar]
  21. Foody, G.M. On the Compensation for Chance Agreement in Image Classification Accuracy Assessment. Remote Sens. Brief 1992, 58, 1459–1460. [Google Scholar]
  22. Pal, S.; Ziaul, S. The Egyptian Journal of Remote Sensing and Space Sciences Detection of land use and land cover change and land surface temperature in English Bazar urban center. Egypt. J. Remote Sens. Space Sci. 2017, 20, 125–145. [Google Scholar] [CrossRef]
  23. Kalkhan, M.A.; Reich, R.M.; Czaplewski, R.L. Variance Estimate and Confidence Intervals for the Kappa Measure of Classification Accuracy. Can. J. Remote Sens. 1997, 23, 210–216. [Google Scholar] [CrossRef]
  24. Estoque, R.C.; Murayama, Y. Classification and change detection of built-up lands from Landsat-7 ETM + and Landsat-8 OLI/TIRS imageries: A comparative assessment of various spectral indices. Ecol. Indic. 2015, 56, 205–217. [Google Scholar] [CrossRef]
  25. Monserud, R.A.; Leemans, R. Comparing global vegetation maps with the Kappa statistic. Ecol. Model. 1992, 62, 275–293. [Google Scholar] [CrossRef]
  26. Bechtel, B. Multitemporal Landsat data for urban heat island assessment and classification of local climate zones. In Proceedings of the 2011 Joint Urban Remote Sensing Event, Munich, Germany, 11–13 April 2011; pp. 129–132. [Google Scholar] [CrossRef]
  27. Ranagalage, M.; Estoque, R.C.; Murayama, Y. An Urban Heat Island Study of the Colombo Metropolitan Area, Sri Lanka, Based on Landsat Data (1997–2017). ISPRS Int. J. Geo-Inf. 2017. [Google Scholar] [CrossRef]
Figure 1. Map of analyzed area. (a) Location in Indonesia; (b) Bogor District and surrounding area, and (c) analyzed area in this study (Bogor City and suburban area).
Ijgi 07 00165 g001
Figure 2. Illustration of Local Climate Zone. Corresponding LCZ images are reproduced from Stewart and Oke [16], American Meteorological Society, Used with permission.
Ijgi 07 00165 g002
Figure 3. Illustration of urban change degree. The value of 25 pixels are averaged to give the degree (original pixel is 30 m resolution).
Ijgi 07 00165 g003
Figure 4. LCZ maps of Bogor.
Ijgi 07 00165 g004
Figure 5. Diagram of LCZ proportion in 1900–2017.
Ijgi 07 00165 g005
Figure 6. City expansion in 1990–2017.
Ijgi 07 00165 g006
Figure 7. LST distribution maps.
Ijgi 07 00165 g007
Figure 8. Surface urban heat island (UHI) from 1990 to 2017.
Ijgi 07 00165 g008
Figure 9. Box plots of land surface temperature (LST) for different LCZ category.
Ijgi 07 00165 g009
Figure 10. Histogram of LST for LCZ cluster.
Ijgi 07 00165 g010
Figure 11. Normalized Difference Vegetation Index (NDVI) distribution maps.
Ijgi 07 00165 g011
Figure 12. Relation of LST and NDVI.
Ijgi 07 00165 g012
Figure 13. LST change and urban change degree. (a) LST change between 1990 and 2017, (b) Status of urban change (from non-urban to urban), (c) LST change between 1990 and 2017 in Bogor City, and (d) Status of urban change (from non-urban to urban) in Bogor City. One pixel is 150 m × 150 m (averaging value from 5 × 5 pixels of original image resolution 30 m).
Ijgi 07 00165 g013
Figure 14. Relation of LST change and urban change degree in the analyzed area and Bogor City.
Ijgi 07 00165 g014
Figure 15. Map of high change area. The black line indicates the boundary of the Bogor City. Points (a and b) show the location of photos in Figure 16.
Ijgi 07 00165 g015
Figure 16. The real condition of high change area (a) and no change area (b).
Ijgi 07 00165 g016
Table 1. Description of Landsat images that were used in this study.
Image Acquisition DateSensorBands for LCZ ClassificationThermal Band
9 July 1990Landsat 5 TM1–5, & 76
28 July 1997Landsat 5 TM1–5, & 76
26 September 2007Landsat 5 TM1–5, & 76
19 July 2017Landsat 8 OLI/TIRS1–710
Table 2. Accuracy of Local Climate Zone’s (LCZ’s) validation.
Year1990199720072017
Accuracy (%)92.54%88.62%85.09%85.88%
Table 3. Accuracy assessment of LCZ type.
YearOverall Accuracy (%)Kappa Coefficient
199095.020.83
199790.680.78
200793.290.87
201798.940.97
Table 4. LCZ results in different years (ha).
LCZ Types1990199720072017
Urbanized area *5846.96058.614272.317404.8
Vegetated area52337.550681.843771.337988.5
Bare soil1881.54160.71649.53286.0
Water2068.31421.42629.42065.1
Cloud188.30.00.01578.2
Total area = 62,322.48 ha. * Urbanized areas are defined as city expansion, which is discussed on Section 3.3 and Figure 6.
Table 5. The transition matrix of LCZ change between 1990 and 2017.
2017
Urbanized AreaVegetated Area
123456789Total
1990Urbanized area1. Compact low-rise building4.40.50.10.10.40.20.20.10.16.2 Ijgi 07 00165 i001
2. Large low-rise building0.30.20.00.10.20.10.10.00.51.5
3. Roads and paved0.90.10.10.10.20.10.10.10.01.7
Vegetated area4. Dense trees12.21.20.717.913.47.82.61.81.458.9 Ijgi 07 00165 i002
5. Scattered trees and bush3.90.70.34.16.24.21.50.60.421.8
6. Low plants0.40.10.00.80.90.80.30.10.03.3
7. Bare soil0.80.10.00.30.80.40.40.00.13.0
8. Water0.60.10.10.30.90.40.20.60.03.3
9. Cloud0.00.00.00.30.00.00.00.00.00.3
Total23.63.01.423.923.014.15.33.32.5100.0
Ijgi 07 00165 i003 Ijgi 07 00165 i004

