1. Introduction
The urban system is widely recognized as a complex process and is very dynamic due to its rapid change over time. Rapid urbanization is linked to population growth and human activities, which have become more frequent in recent years compared to the past [
1,
2]. Since most of the global population currently lives in cities, the nature of the cities contains a complex human settlement structure compared to rural portions [
3]. The population size is expected to increase in the future (i.e., greater than 5 billion by 2030) [
4,
5]. Most of this growth will occur in developing countries [
6], transforming natural ecosystems into urban areas. The increase in urban areas has massive environmental and ecological consequences, including landscape change, hydrological process altering and regional and global climate change [
7,
8].
Recently, Saudi Arabia, like other developing countries, has faced massive urban growth due to an increase in national economics [
9,
10], which have been used to support the public and private sectors to increase development across the country. This factor, along with natural demographic growth, has led to massive changes and increased complexity in the structure of cities as well as unsystematic development in the last three decades. According to the Central Department of Statistics and Information 2015, the population in large cities, such as Riyadh and Jeddah, has increased by 4,682,200 and 3,024,368 in Riyadh and Jeddah respectively between 1985 and 2014. With such rapid development, local authorities and planners are challenged to understand the urban growth process and associated consequences [
11]. The ability to manage urban growth lies in determining the past and present spatial dimensions and the driving forces behind the distribution of urbanization. Understanding the urban growth process and its driving forces is essential to secure sustainable development for future urban growth and to avoid environmental and ecological consequences.
Urban expansion is controlled by factors or variables that strongly affect urban distribution and forms [
12]. These variables include biophysical variables, such as climate and topography; proximity variables, such as distance to water, distance to the central business district and distance to roads or highways; socioeconomic variables, such as population and gross domestic product; and neighborhood variables, such as the density of agricultural land, water bodies and forestland. Several studies [
13,
14,
15,
16,
17,
18,
19] have emphasized the effects of these variables in describing urban patterns and to determine the probable urban growth in the future. There has been a considerable effort to identify the effect of driving variables of urban distribution. However, it is important to consider that driving factors may change over time due to the complexity of urban dynamics. Understanding the effect of these variables on urban growth is critical because their effect varies with time.
Geographic Information Systems (GIS) and Remote Sensing provide the required data and tools to spatially detect and model the past, current and future urban growth at the local, regional and global scales. Modeling urban expansion is crucial to understanding the current and future processes based on the driving factors. A wide range of statistical models have been developed and examined to identify the direction of urban distribution and to determine the expansion process [
20,
21,
22]. The statistical methods of urban expansion driving forces mainly include multiple linear regression [
23], geographically weighted regression [
21,
24], bivariate regression [
25], an autocorrelation model [
21], and a logistic regression model [
14,
15,
16,
17,
26,
27]. The logistic regression model is able to determine the trend of urban expansion in the future based on driving variables that affect the distribution of urbanization. However, most previous studies have used driving force factors to predict urban growth probabilities based on a single date of urban change [
16].
This paper aims to investigate the effect of four driving force factors, including elevation, slope, distance to drainages, and distance to major roads, to predict urban growth probabilities in five Saudi Arabian cities (Riyadh, Jeddah, Makkah, Al-Taif and Eastern Area) based on urban changes at two time periods: 1985 and 2014. This paper also examines the relative importance of the selected variables in determination of the shape and pattern of urban expansion in the selected cities. Finally, the paper discusses the environmental and ecological implications of urban growth in the selected cities and the expected impacts.
2. Materials and Methods
2.1. Study Area
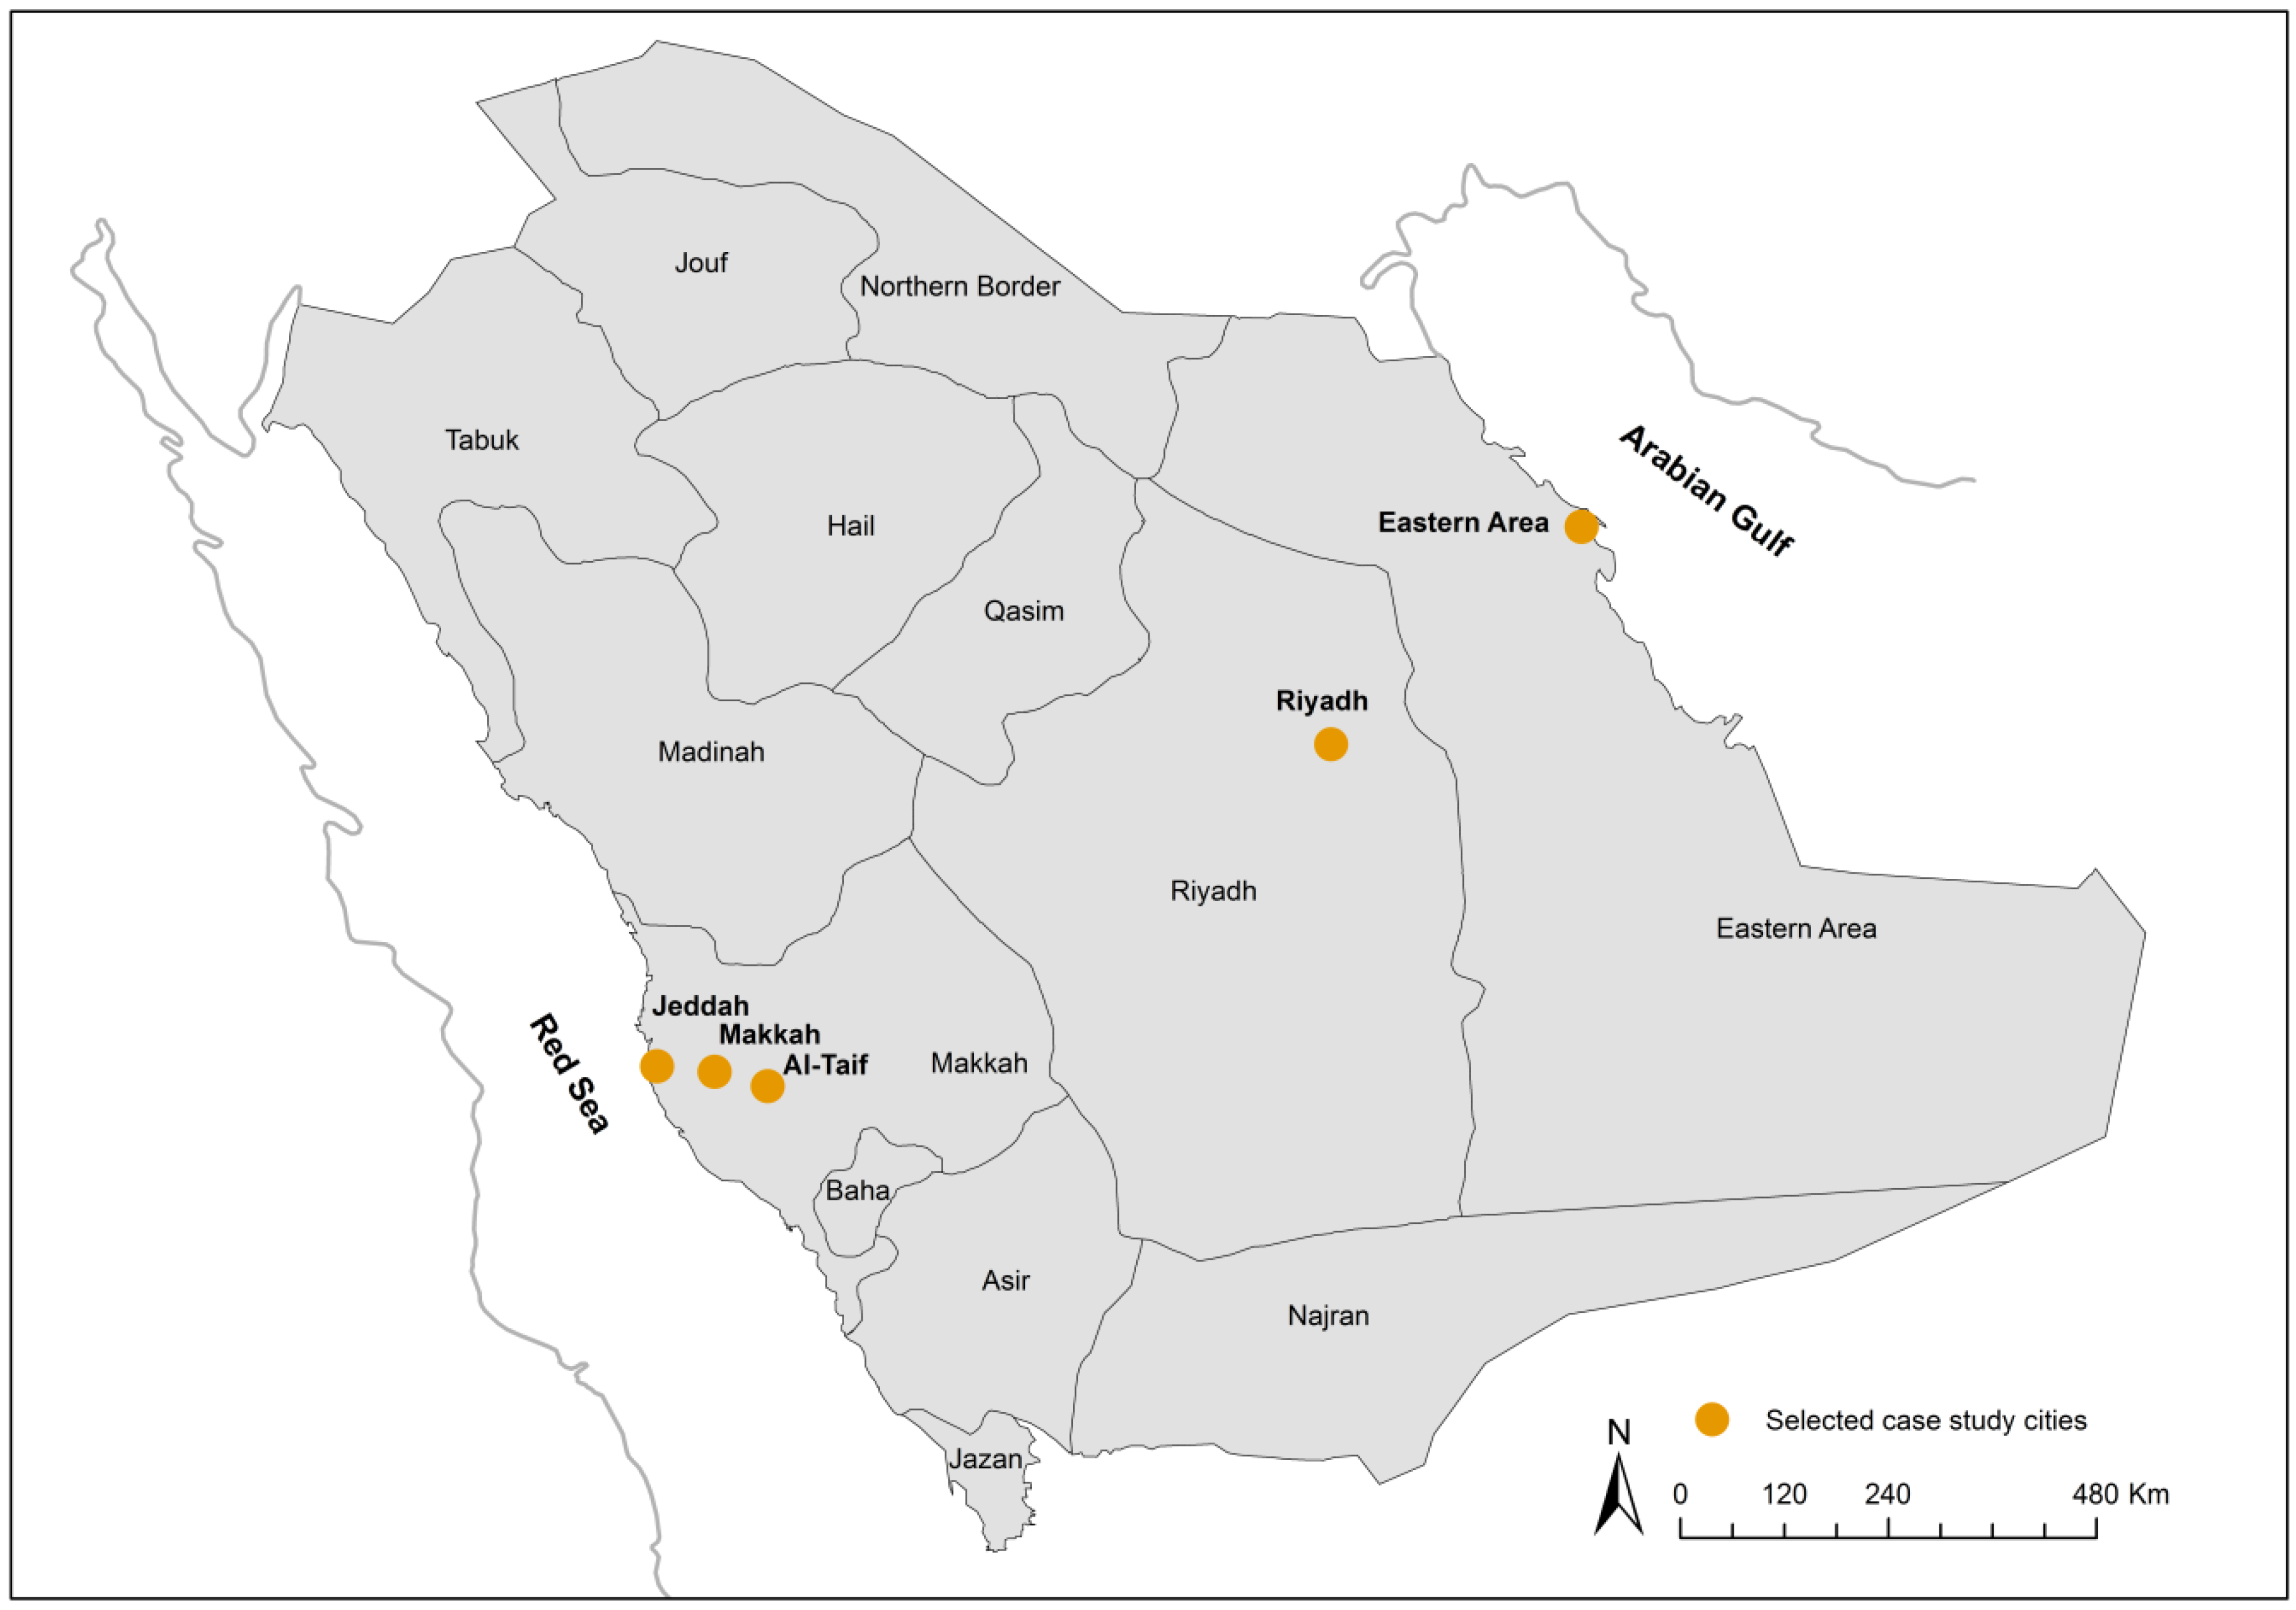
The selected study areas include five cities in Saudi Arabia: Riyadh, Jeddah, Makkah, Al-Taif and Eastern Area (
Figure 1). These cities are considered the most urbanized and populated in the country, with Riyadh being the capital and largest city. This city is situated in the central part of Saudi Arabia on the large Najd plateau and, according to 2013 census statistics, has a population of 6,079,295. This area includes the Al-Kharj Governorate. Jeddah is the largest sea port on the Red Sea coast, a major urban center of western Saudi Arabia and a nationally important commercial hub. With a population of 3,865,873, according to 2013 census, Jeddah is the largest city in the Makkah Region and the second largest in the country. Makkah is the holy place of the Muslim community and is located in the central part of the region, approximately 70 km inland from Jeddah. In 2013, Makkah had a population of 1,867,886. Al-Taif, which is considered the most important tourist city of Saudi Arabia, is the fourth study area used in our analysis and is located in the south-eastern part of the Makkah region. Al-Taif has a population of 1,083,693. Eastern Area is located in eastern Saudi Arabia on the Arabian Gulf and is home to most of Saudi Arabia’s oil production. Eastern Area includes 11 suburbs and governorates that are spread across the region. Only the most populated six suburbs, which are Dammam, Dhahran, Al-Khobar, Al-Qatif, RasTanura and Al-Jubail, are considered in this study. The population of these towns totaled 2,713,583 in 2013. Dammam city is in the central part and is the administrative city of the Eastern Area.
All five cities lie within a very dry climate with average temperatures of 25 °C, 28 °C, 30 °C, 20 °C and 26 °C for Riyadh, Jeddah, Makkah, Al-Taif and Eastern Area, respectively. All five cities experience very little rainfall. The annual precipitation varies from city to city, but not by much, with 92 mm, 61 mm, 111 mm, 120 mm and 90 mm in Riyadh, Jeddah, Makkah, Al-Taif and Eastern Area, respectively. The topographic structure is also varied among cities. While Jeddah is located in the coastal plain of the Red Sea (<5 m), the eastern part of the city contains an elevated terrain (Hijaz Mountains). Eastern Area is relatively flat, which is located in the coastal plain of the Arabian Gulf. Makkah lies in a corridor between the Hijaz Mountains, and the east portion is the most elevated land in the city. Al-Taif is the highest city among the five. It is located at an elevation of 2000 m on the slopes of the Hijaz Mountains. Riyadh has varied elevations, in which the south-west contains elevated terrains; the eastern part has a lower elevation.
During the last 40 years, the five cities have experienced a high rate of urbanization. The socioeconomic benefits provided in these cities were attractive to people who are seeking a better job or life. The different characteristics of each city have led to increases in both internal and external migration. Riyadh is the capital city and is attractive from internal migration due to job demand in the government sector. The commercial advantages in Jeddah have contributed to increasing urban growth in this city. Oil industry developments in Eastern Area, the growth of tourism sector in Al-Taif and the religious circumstances in Makkah have rapidly urbanized these cities.
2.2. Quantifying the Spatial Distribution of Urban Expansion from 1985 to 2014
2.2.1. Data and Pre-Processing
The data that were used to quantify the rate of urban expansion in the five cities were Landsat images from 1985 and 2014 (
Table 1). All of the images were obtained from USGS Global Visualization (GloVis) site. All of the images were georeferenced as level 1 products; however, the TM images path 164 and row 42 and path 165 and row 43 of Eastern Area and Riyadh, respectively, were not correctly georeferenced. An automatic image-to-image registration was applied using Landsat 8 images of the similar path and row as base images and Landsat TM images as wrap images. Mosaic processing was applied to merge two path and row images for Riyadh and Eastern Area. Finally, image subsets were extracted for the five cities, including all of the urban boundaries across the five cities. Subsets of the selected areas of the Makkah and Al-Taif images did not include the cloud cover in the scenes.
2.2.2. Image Classification and Accuracy Assessment
An automated hierarchical classification was applied separately for the ten images using a decision tree classifier. The design of the decision tree classifier was based on classes (land cover classes), feature sets used to derive these classes, and threshold values applied to distinguish certain categories in the Landsat imagery. An object-based image analysis was used in eCognition Developer 8.9 to produce the land cover maps of 1985 and 2014 for the selected five cities. Following the method proposed by Taubenböck, et al. [
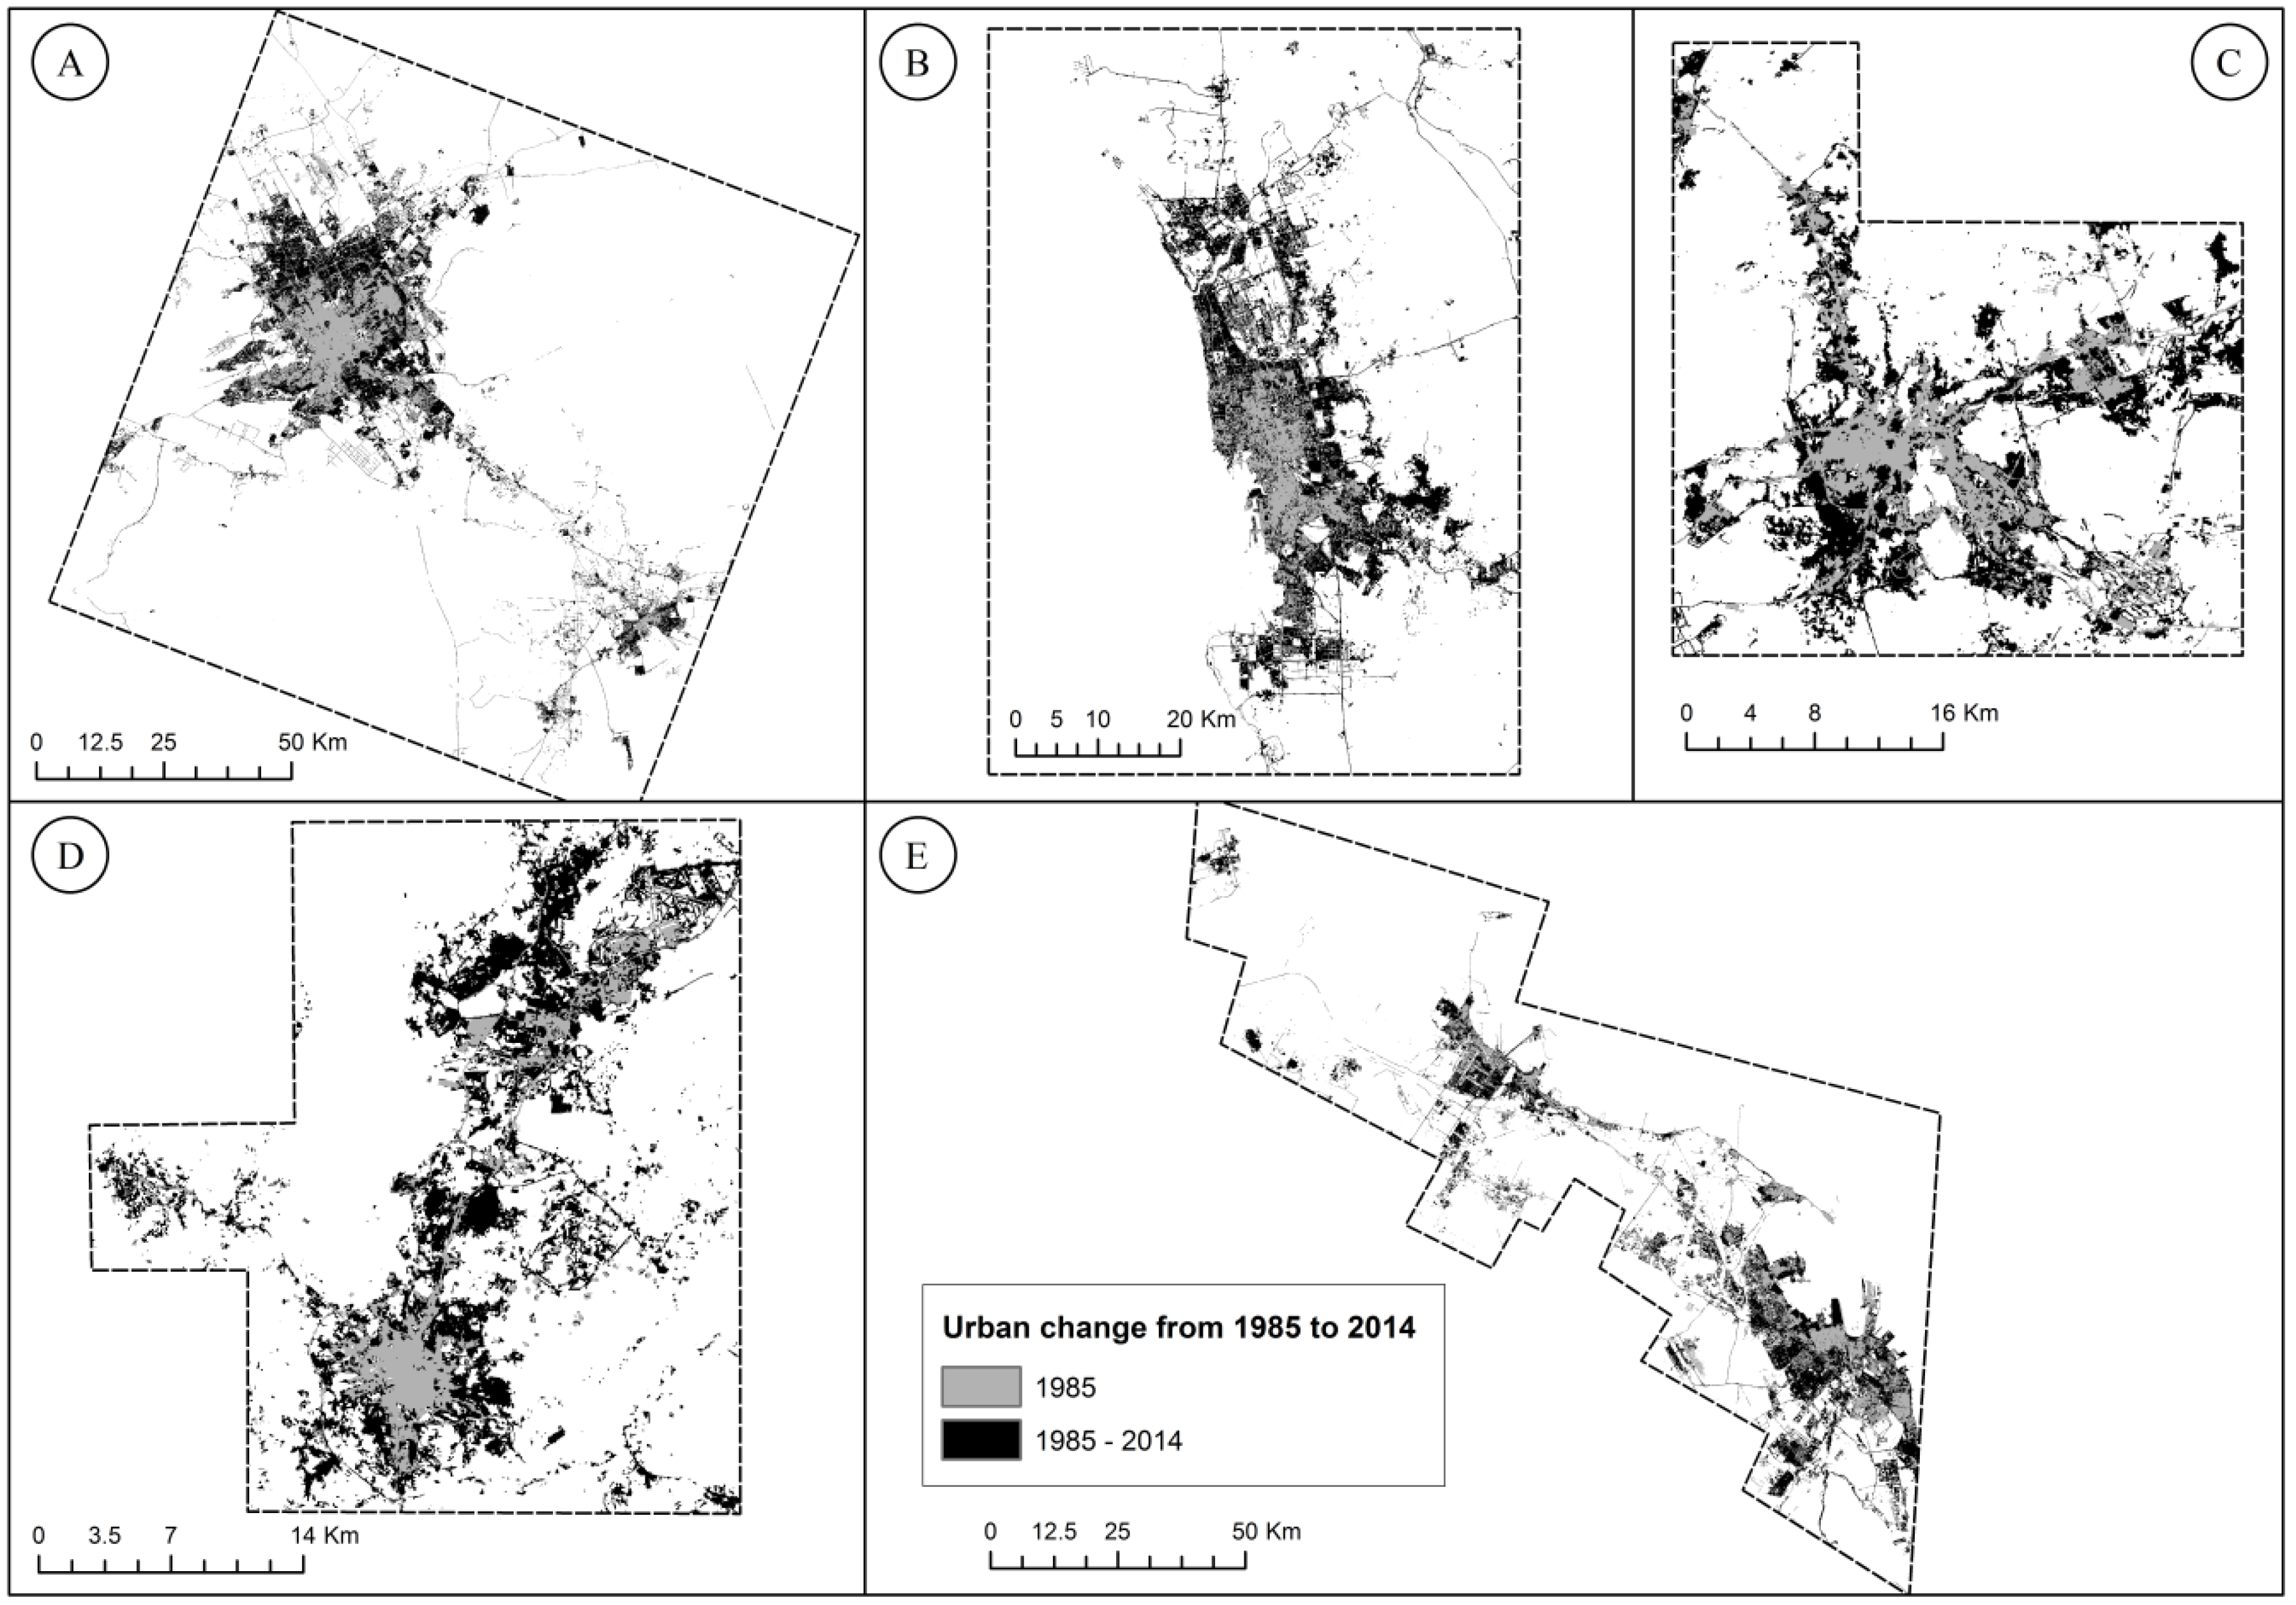
28], the image classification was divided into four categories, including water, vegetation, bare soil and urban land cover using decision tree method. The feature sets selected in this study to derive land cover classes were the spectral patterns of nine different features. Six features stemmed from the Landsat TM and OLI spectral bands. The remaining three features were Normalized Difference Vegetation Index (NDVI), Soil Adjusted Vegetation Index (SAVI), and Normalized Difference Water Index (NDWI). Since the aim of this paper was to analyze the urban process, the other three categories of water, vegetation and bare soil were reclassified as non-urban areas. Thus, the final results presented two categories, including urban and non-urban areas, which were then used in the statistical analysis (
Figure 2). The accuracy assessment of image classification was tested using stratified random sampling method. The results indicated a high overall accuracy (average overall accuracies were 89.15% and 90.84% in 1985 and 2014 respectively) and kappa coefficient (average kappa coefficients were 0.80 and 0.84 in 1985 and 2014 respectively) among the 10 images.
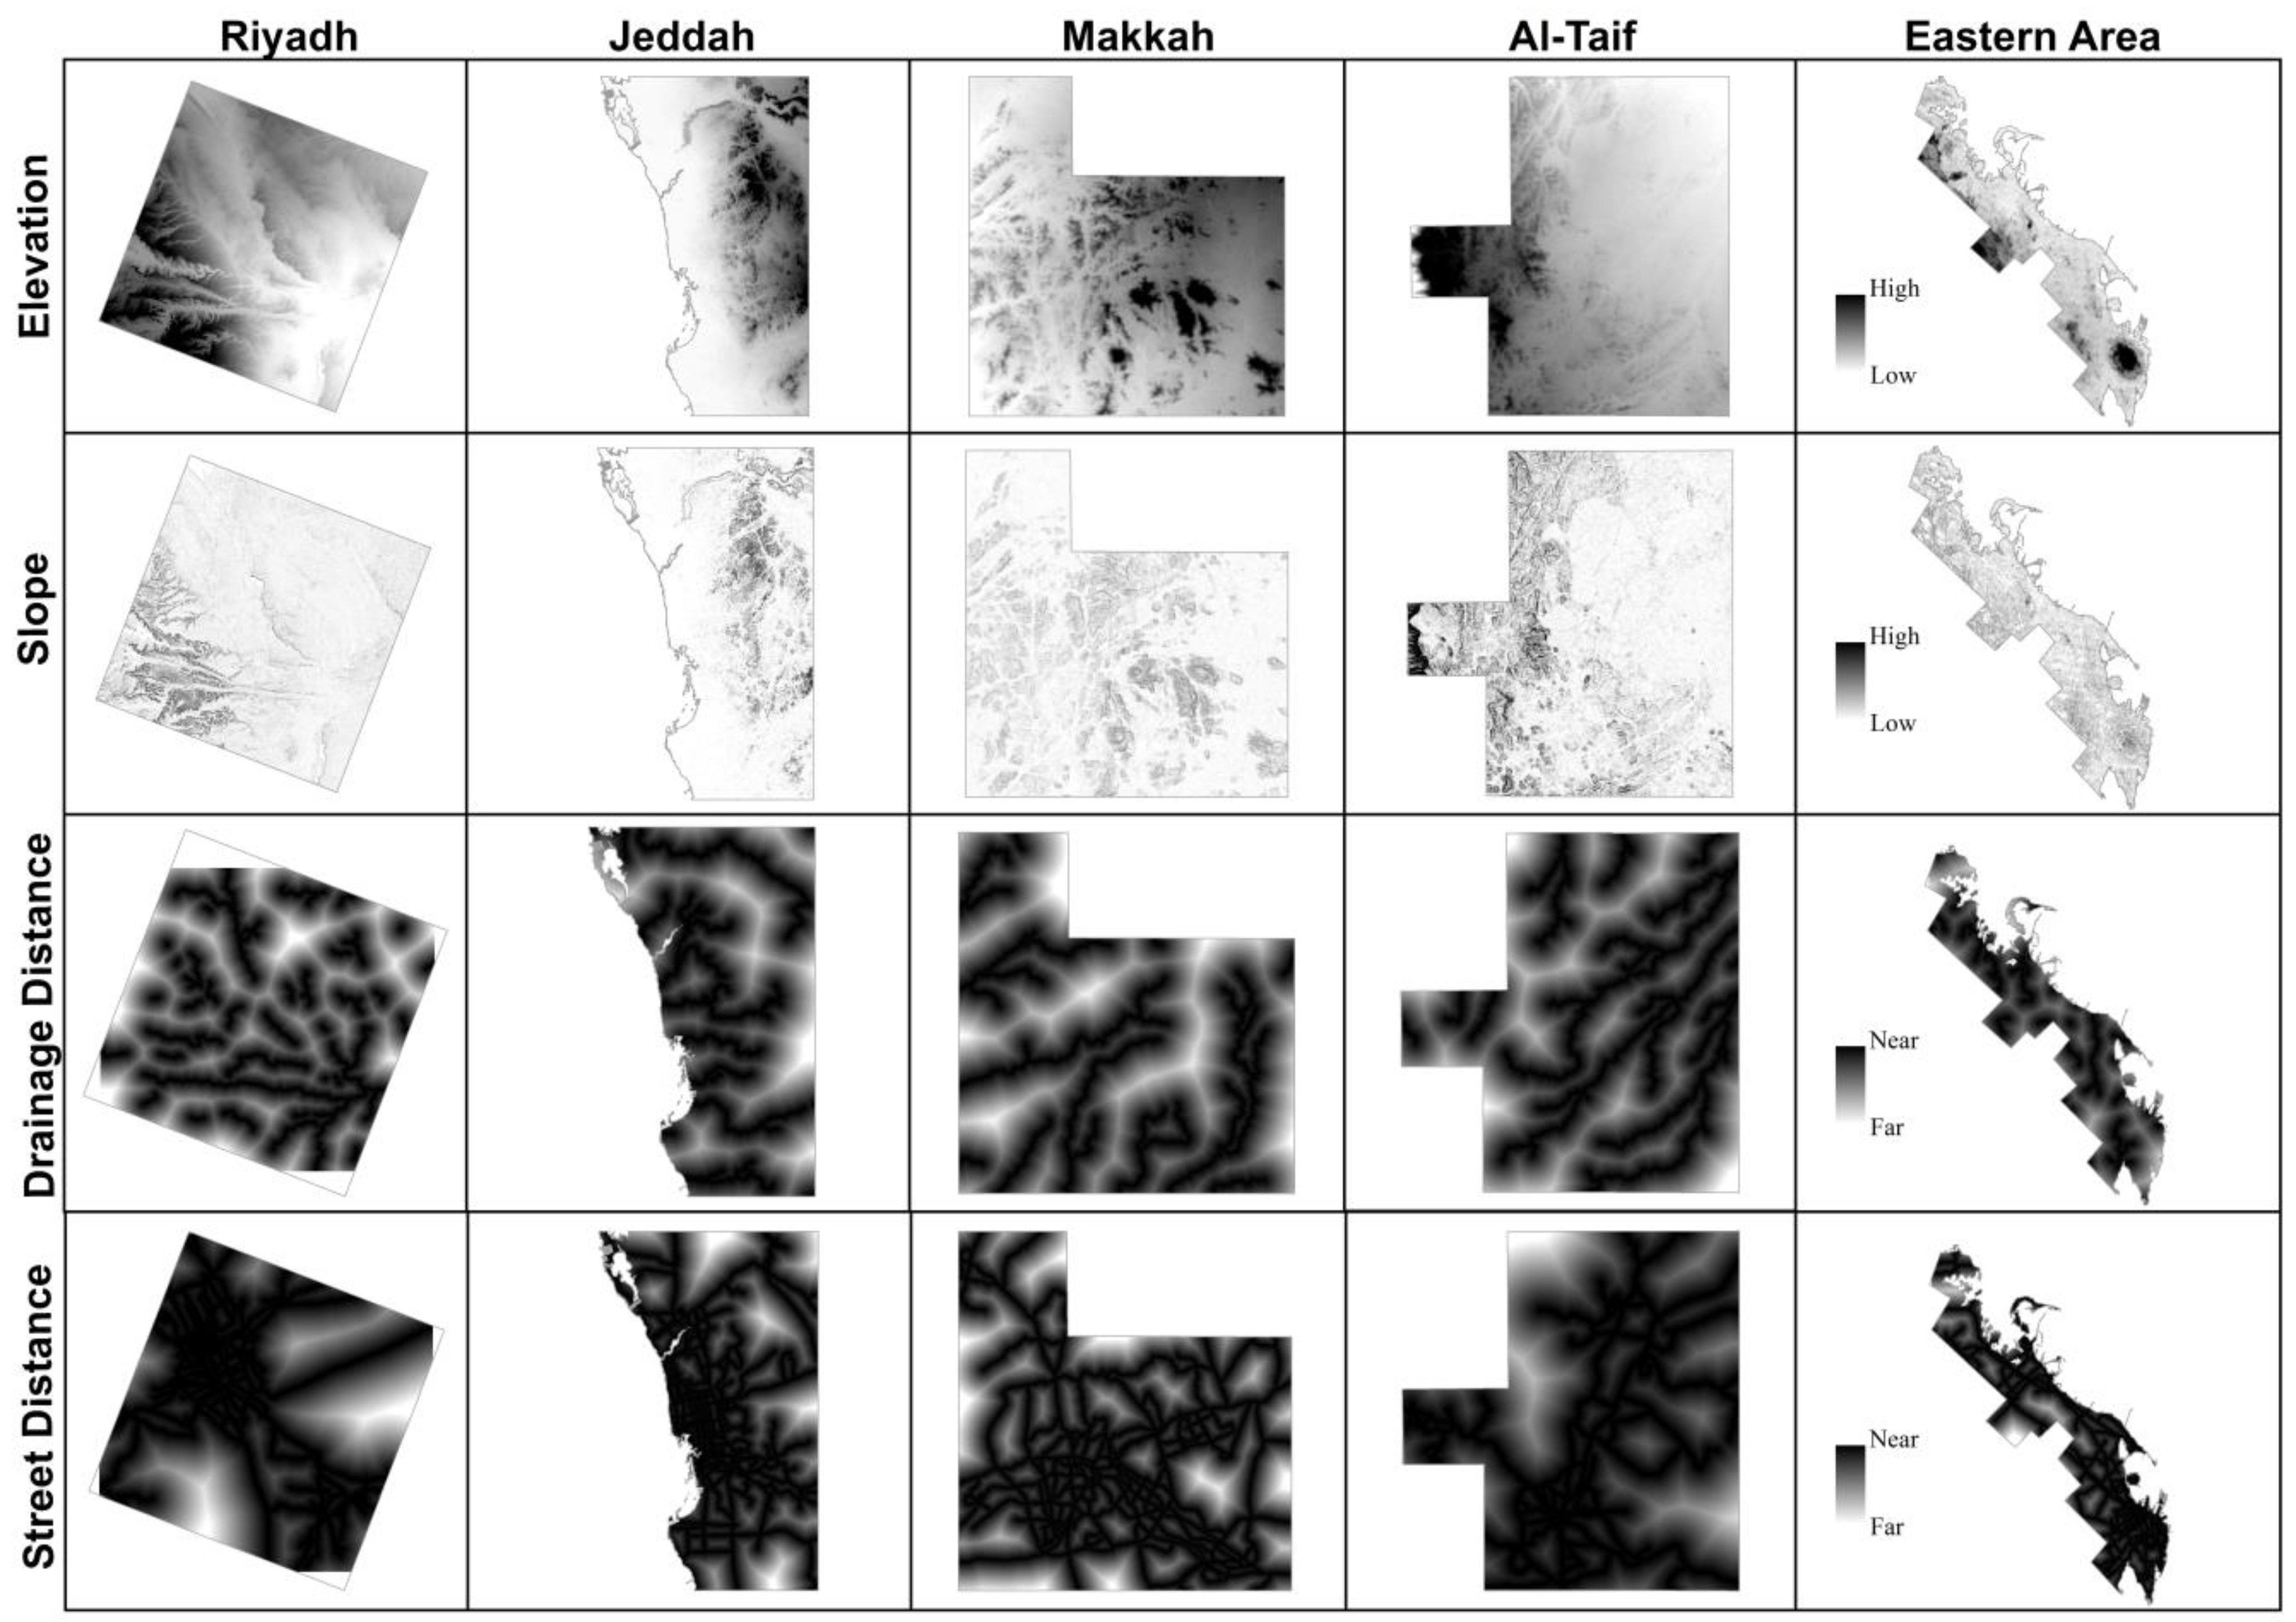
2.3. Potential Driving Factors of Urban Expansion
Typically, four types of driving variables have been considered in the previous studies of urban expansion [
17]. These types included the biophysical variables, socioeconomic variables, neighborhood variables, and proximity variables and showed considerable effects on urban expansion in other regions. As no data was available for other socioeconomic and neighborhood variables, four different independent variables were selected to examine the most effective variable in the determination of urban distribution in the selected five cities (
Figure 3). Two of these driving factors are biophysical variables and two are proximity variables. The two biophysical variables include the topographic factors of elevation and slope and the biophysical factors are the fundamental and natural drivers of the spatial expansion of urban land [
17]. Most previous studies (e.g., [
15,
16,
17]) have emphasized that biophysical factors, including topographical elements, strongly influence the distribution of urban form and control the shapes of cities. In this research, digital elevation model (DEM) layers were obtained from the USGS site for the five cities with a spatial resolution of 30 meters (SRTM data:
http://earthexplorer.usgs.gov/). Elevation and slope were evaluated using DEM layers. The slope was calculated as a percentage, dividing the rise by the run and multiplying by 100.
Another two driving factors were proximity variables, which included the distance from drainage network and distance to the major roads. Drainages were delineated from the DEM layers and compared to the topographic map of Saudi Arabia in order to determine the major drainage order. The Euclidean distance algorithm was used to calculate the drainage distance. The second factor is the distance to the major roads. Road networks strongly shape the urban form [
16] and play an important role in urban development [
26,
29]. The proximity of the major roads was measured as the straight-line distance to the major roads in the five cities. Roads were evaluated for the five cities in both 1985 and 2014 using heads-up digitizing in ArcGIS 10.2 for the Landsat TM of 1985 and Landsat OLI panchromatic bands for 2014. A visual comparison to a topographic map of Saudi Arabia was applied for both time periods in order to identify the major roads in the five cities. The Euclidean distance algorithm was used to calculate the street distance.
2.4. Statistical Analysis
2.4.1. Urban and Non-Urban Data Sampling
The data sampling was performed for urban and non-urban features for two reasons. First, the derived layers of urban expansion were very large, difficult to handle and time consuming. For example, it is difficult for computer systems to deal with a very large number of pixels for Riyadh (5290 × 5325) with a 30-meter resolution for dependent and independent variables [
14,
17,
30,
31]. Thus, the best way to handle such data in the later statistical analysis is to create a reliable feature set and systematic sampling. The second issue is to avoid spatial autocorrelation between both dependent and independent variables. Thus, we created random points for both urban and non-urban features, which coded 1 (presence) for urban and 0 (absence) for non-urban features. Since the extent of each city is different from each other, the total random points were different from city to city. For a large extent, such as Riyadh, Jeddah and Eastern Area, we created 30,000, 20,000 and 25,000 random samples, respectively. For a relatively small extent, such as Makkah and Al-Taif, 10,000 random sample points were created for both urban and non-urban features. However, samples of non-urban features were much larger than those of urban features. Therefore, we recreated sample points for non-urban features to be equal to the urban sample points.
2.4.2. Logistic Regression
Logistic regression is a mathematical model that can be used to model and describe the relationship between a binary dependent variable (Y) and several independent categorical and continuous variables (Xs) [
32,
33]. The logistic regression model is the most frequently used model in urban growth studies [
34]. The advantage of the logistic regression model over other linear regression models in urban studies is its ability to estimate the urban probability of the occurrence of a discrete response factor [
35]. As the computation process of logistic regression is less intensive than other urban prediction methods, it can empirically estimate the influence of independent variables on the dependent variable, and can provide a degree of confidence regarding their contribution [
16]. In this research, Equation (1) was used to calculate the binary logistic regression model in the urban growth of the five cities.
where
y is the probability of a cell being converted to urban area
1, x
𝜂 is an independent variable or driving force, 𝛽
0 is the intercept coefficient, 𝛽
𝜂 is the coefficient of variable x
𝜂, and
ε is the random error term (residuals).
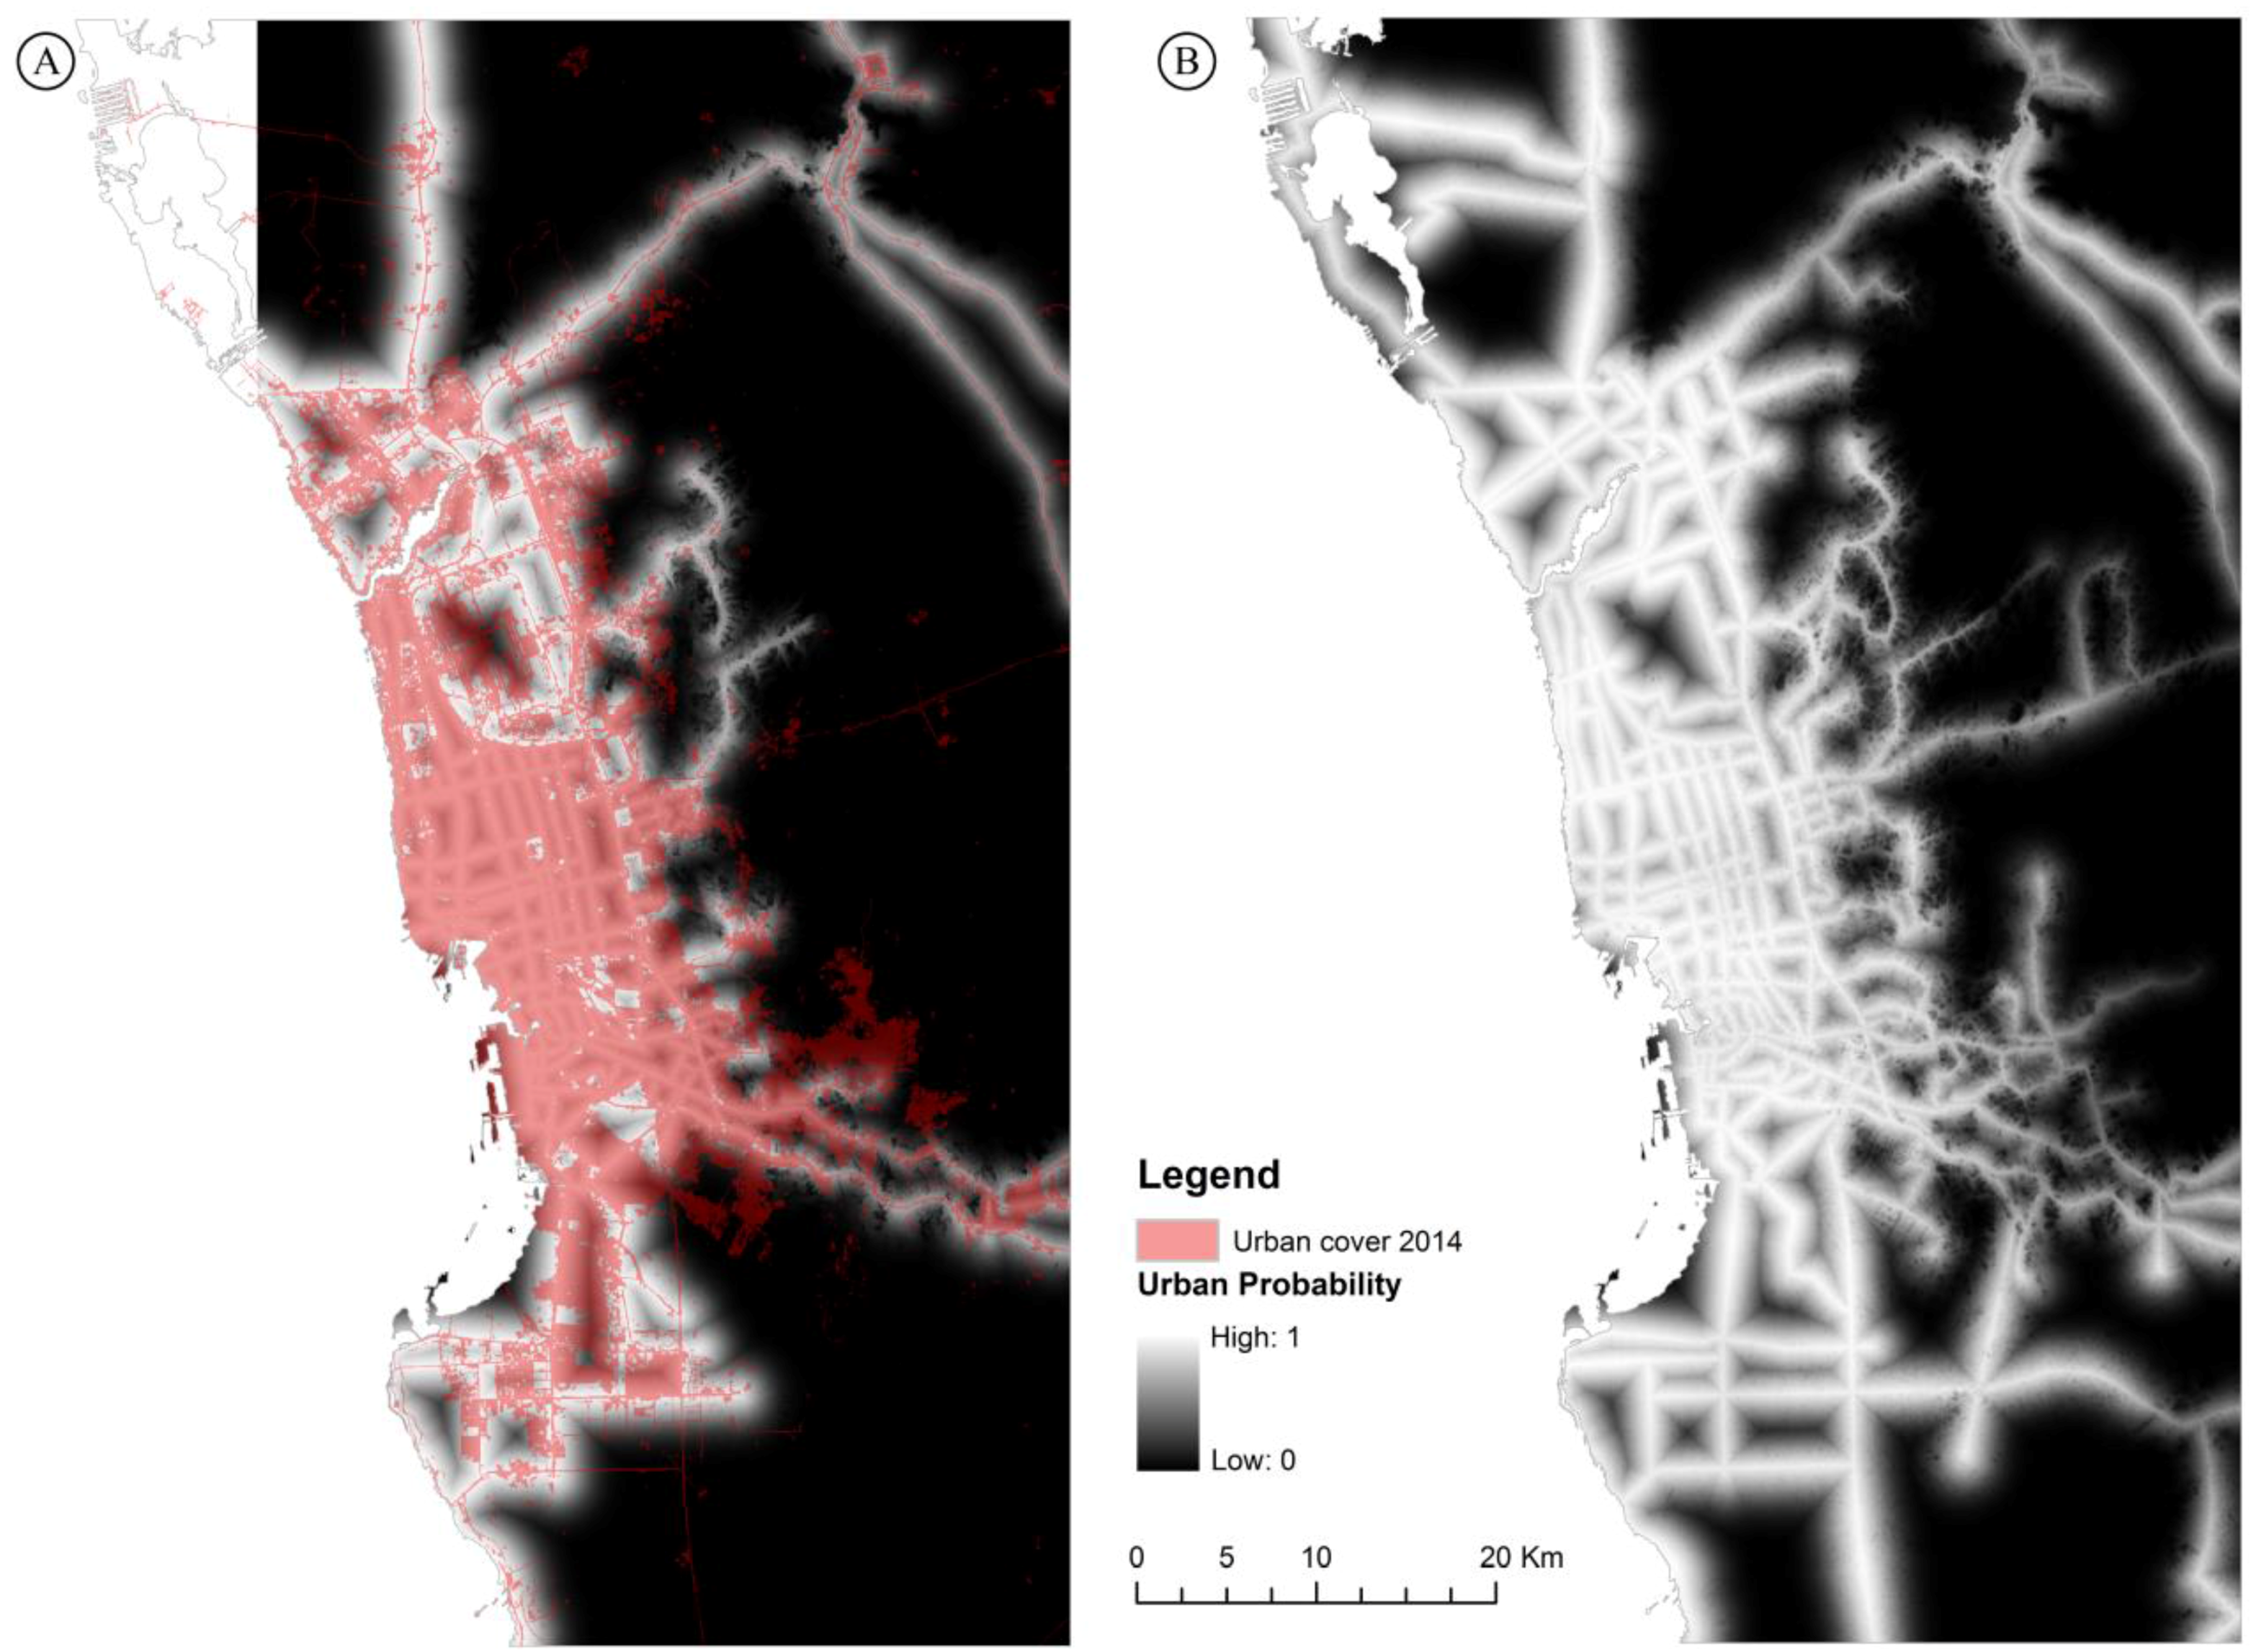
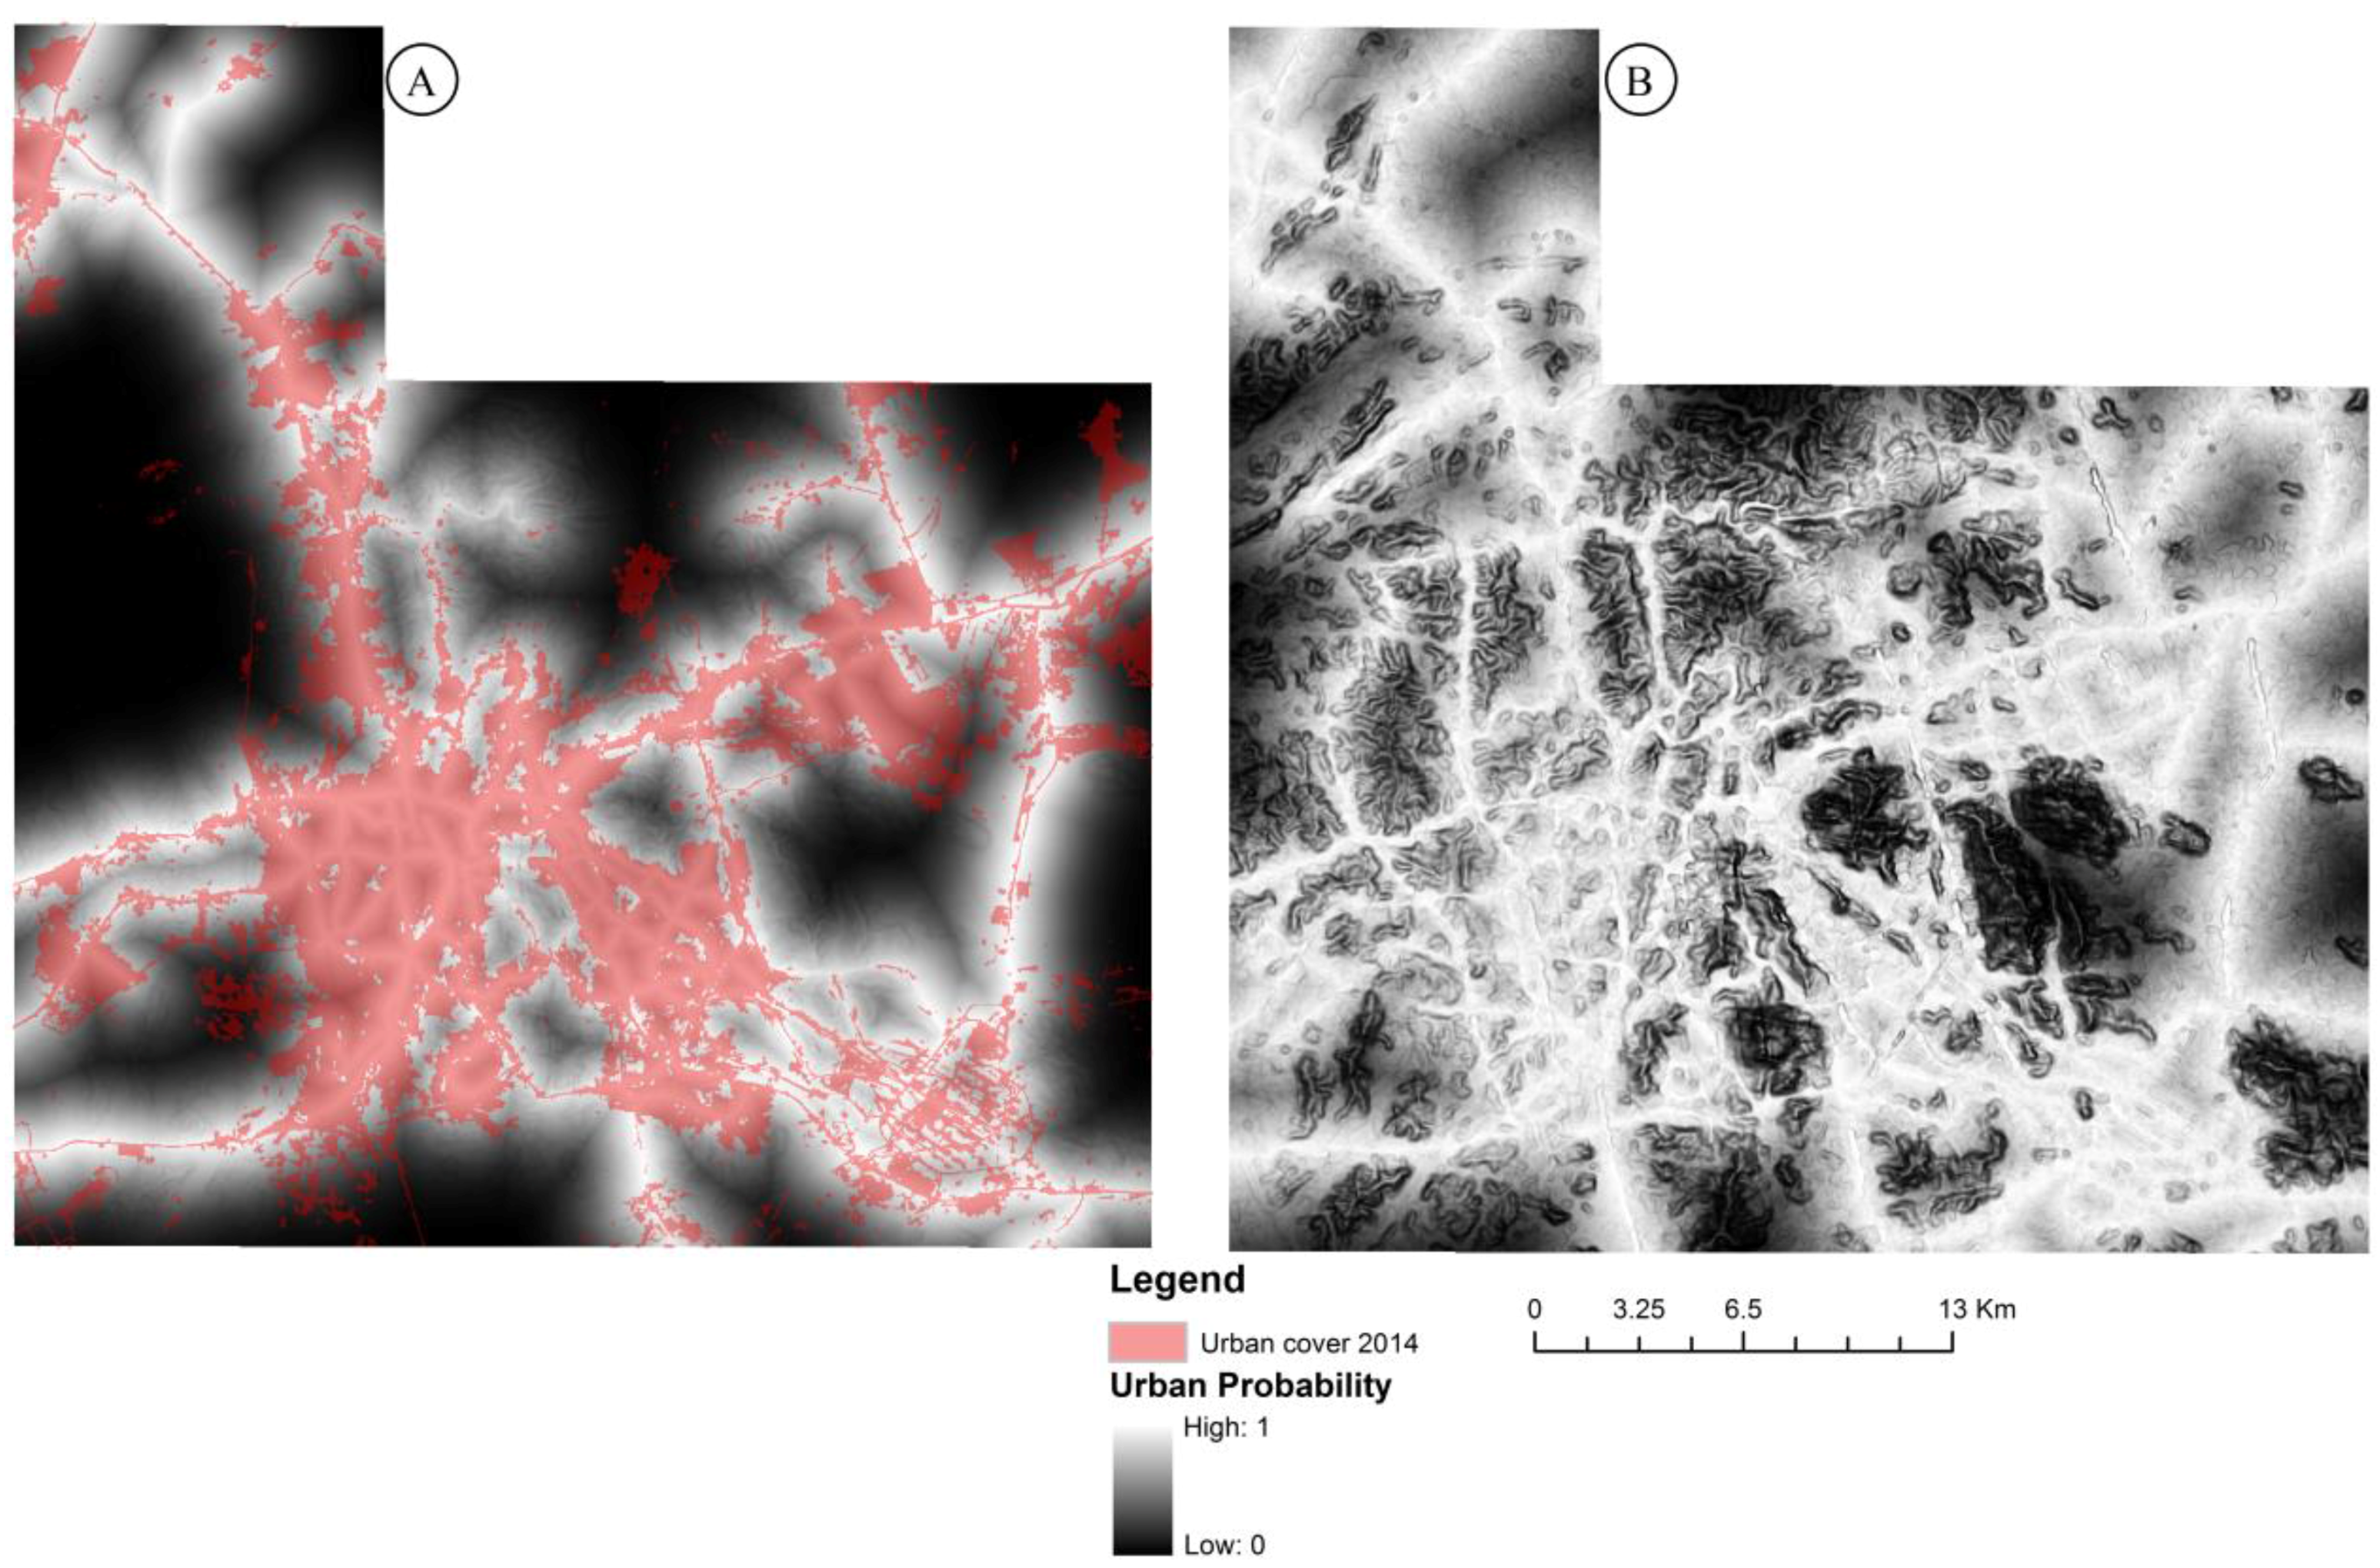
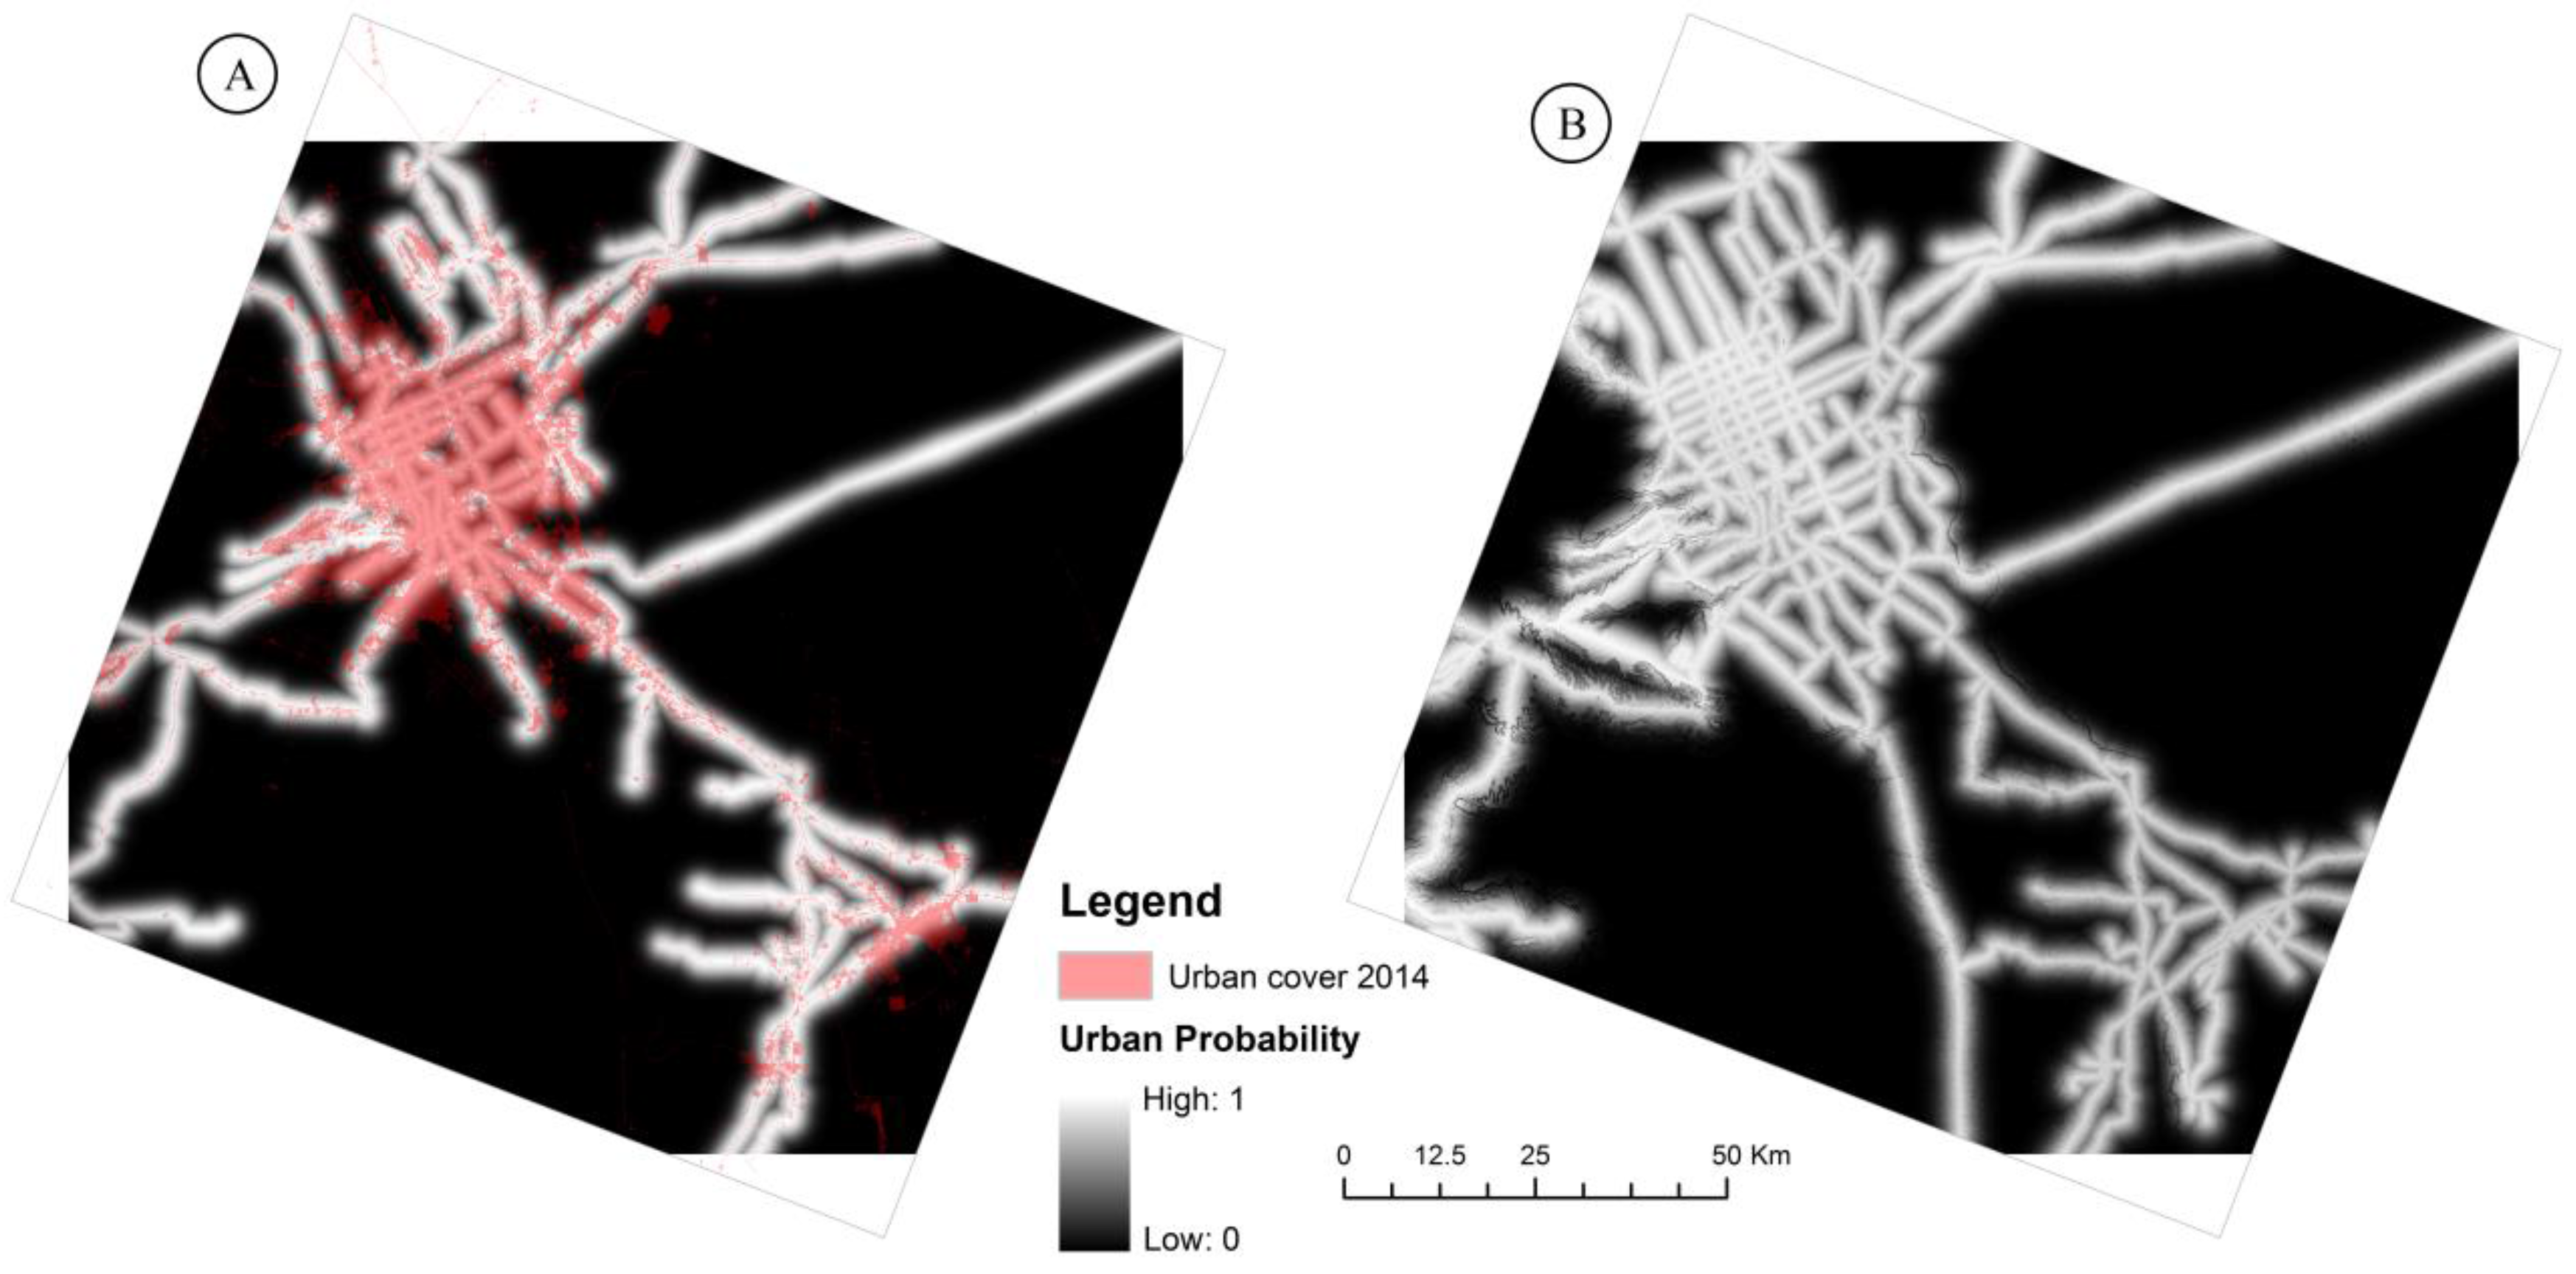
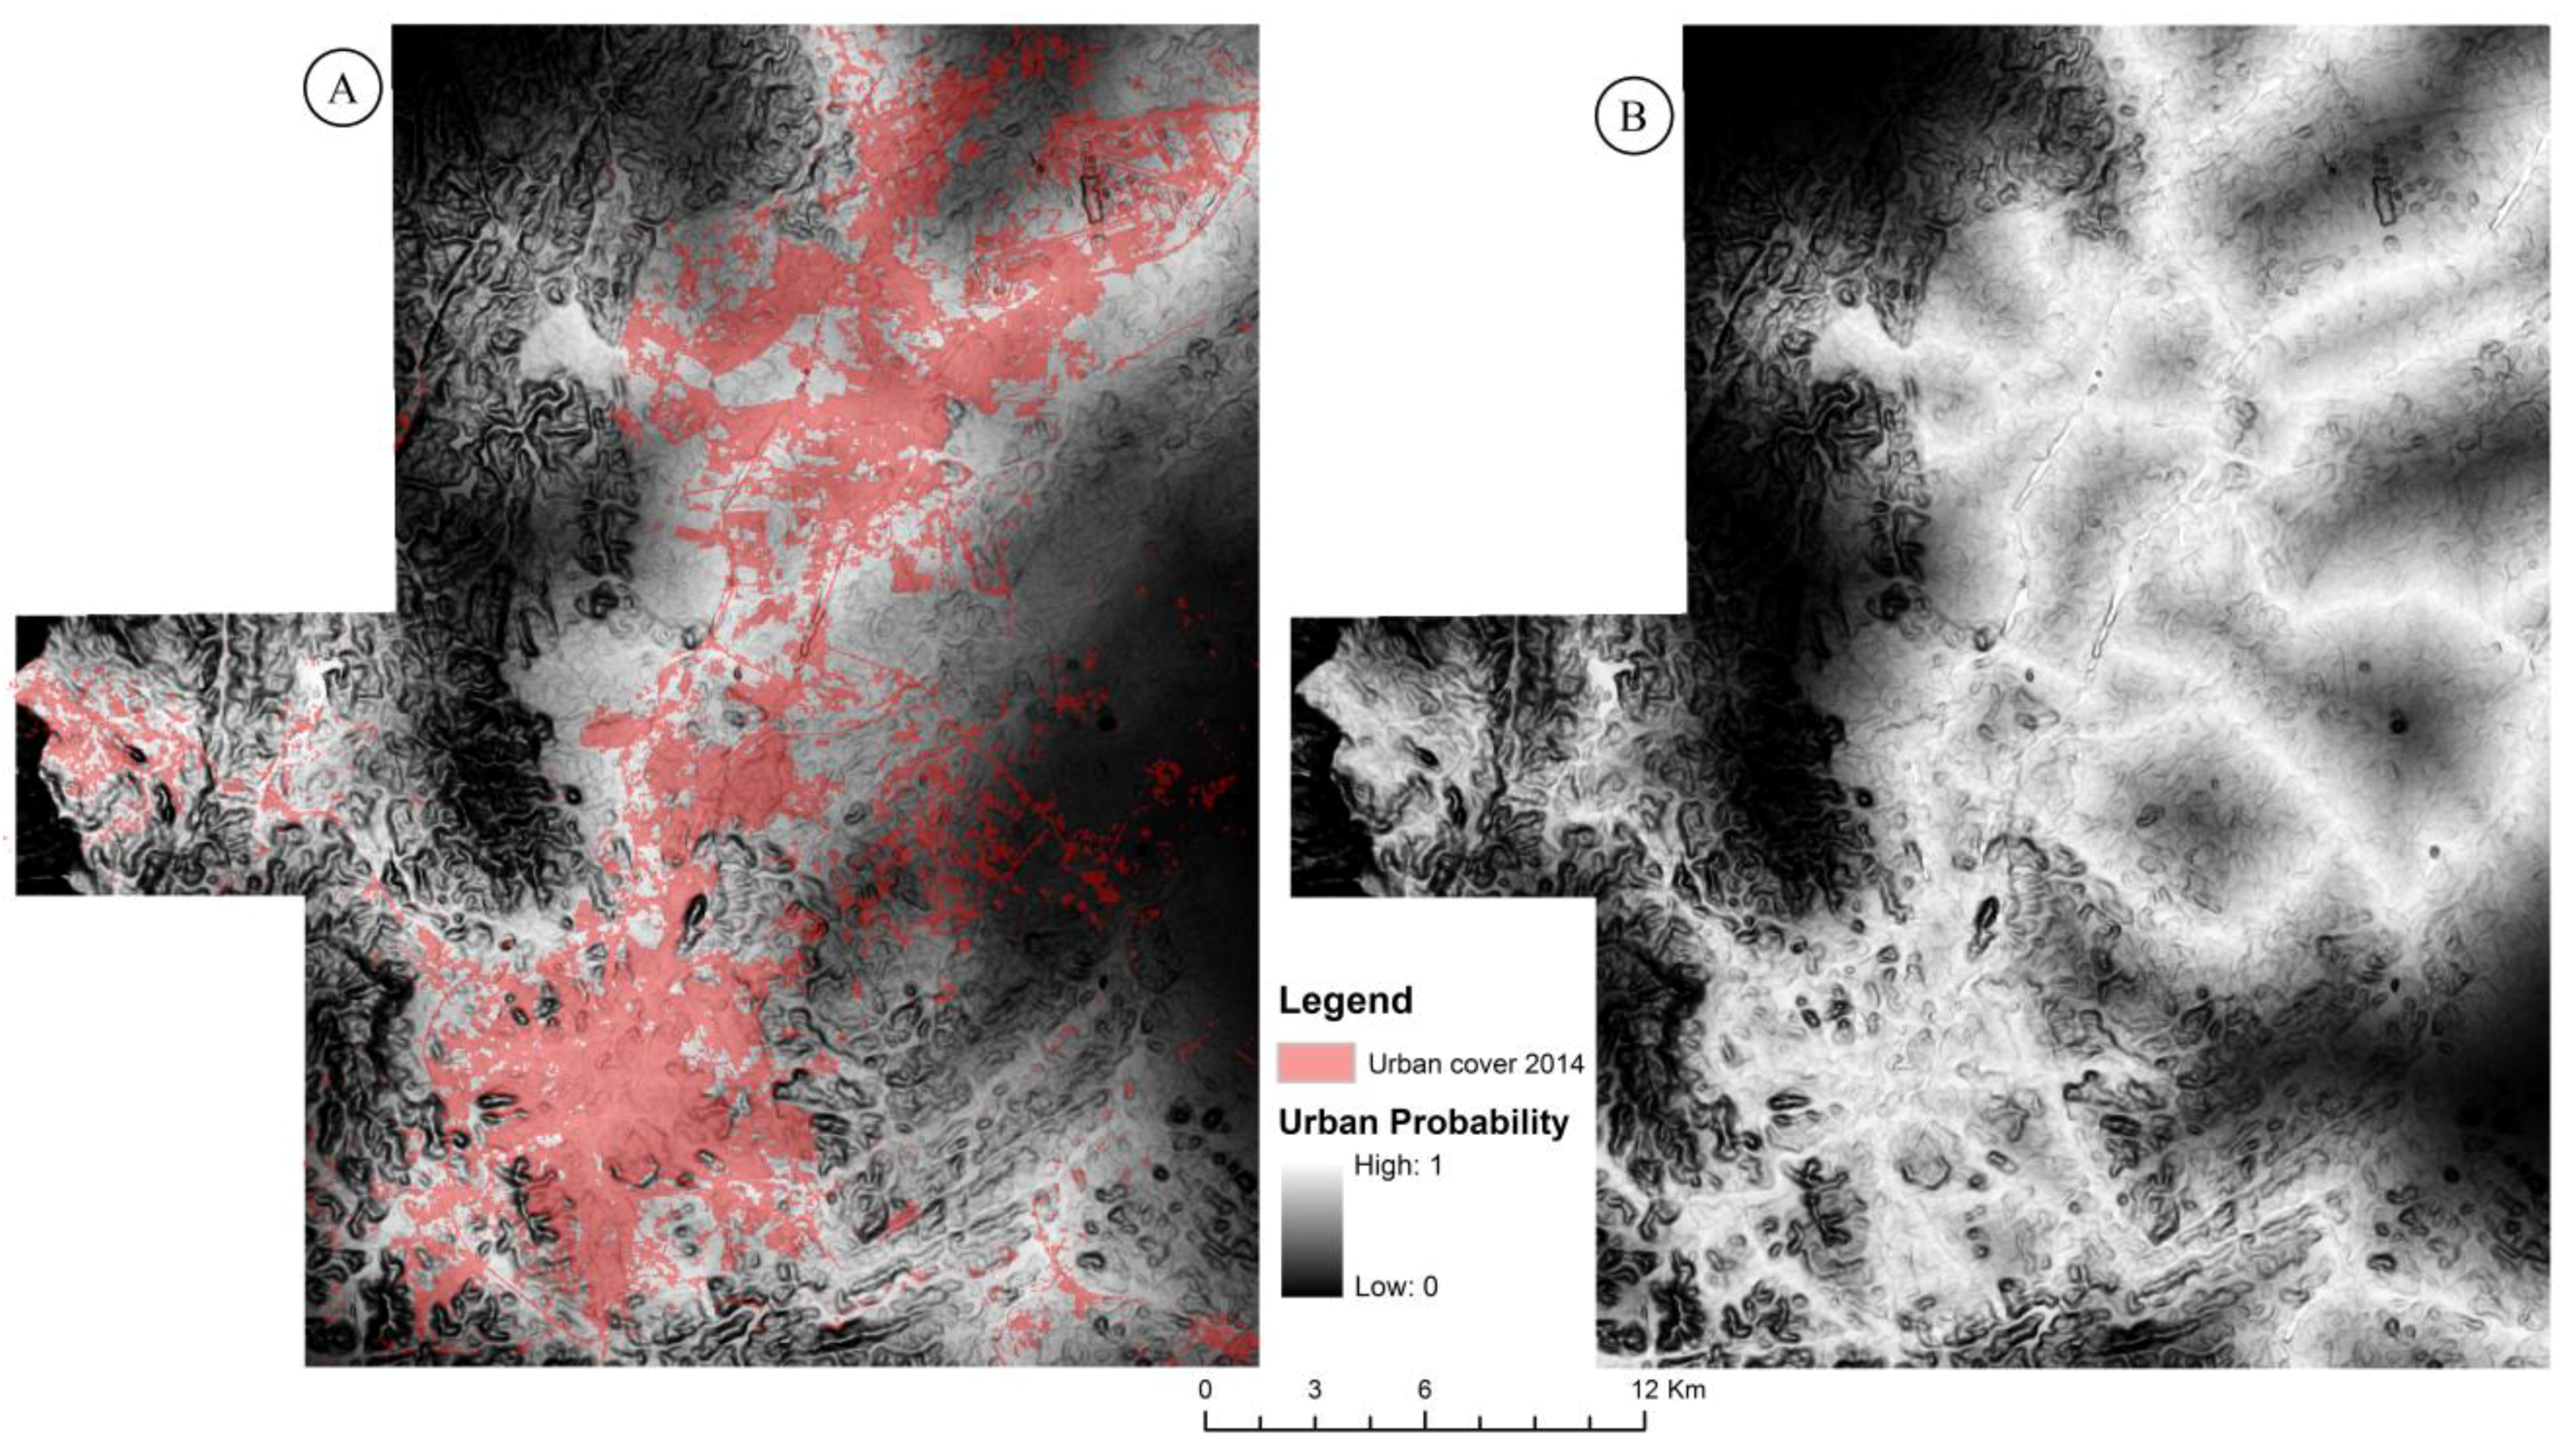
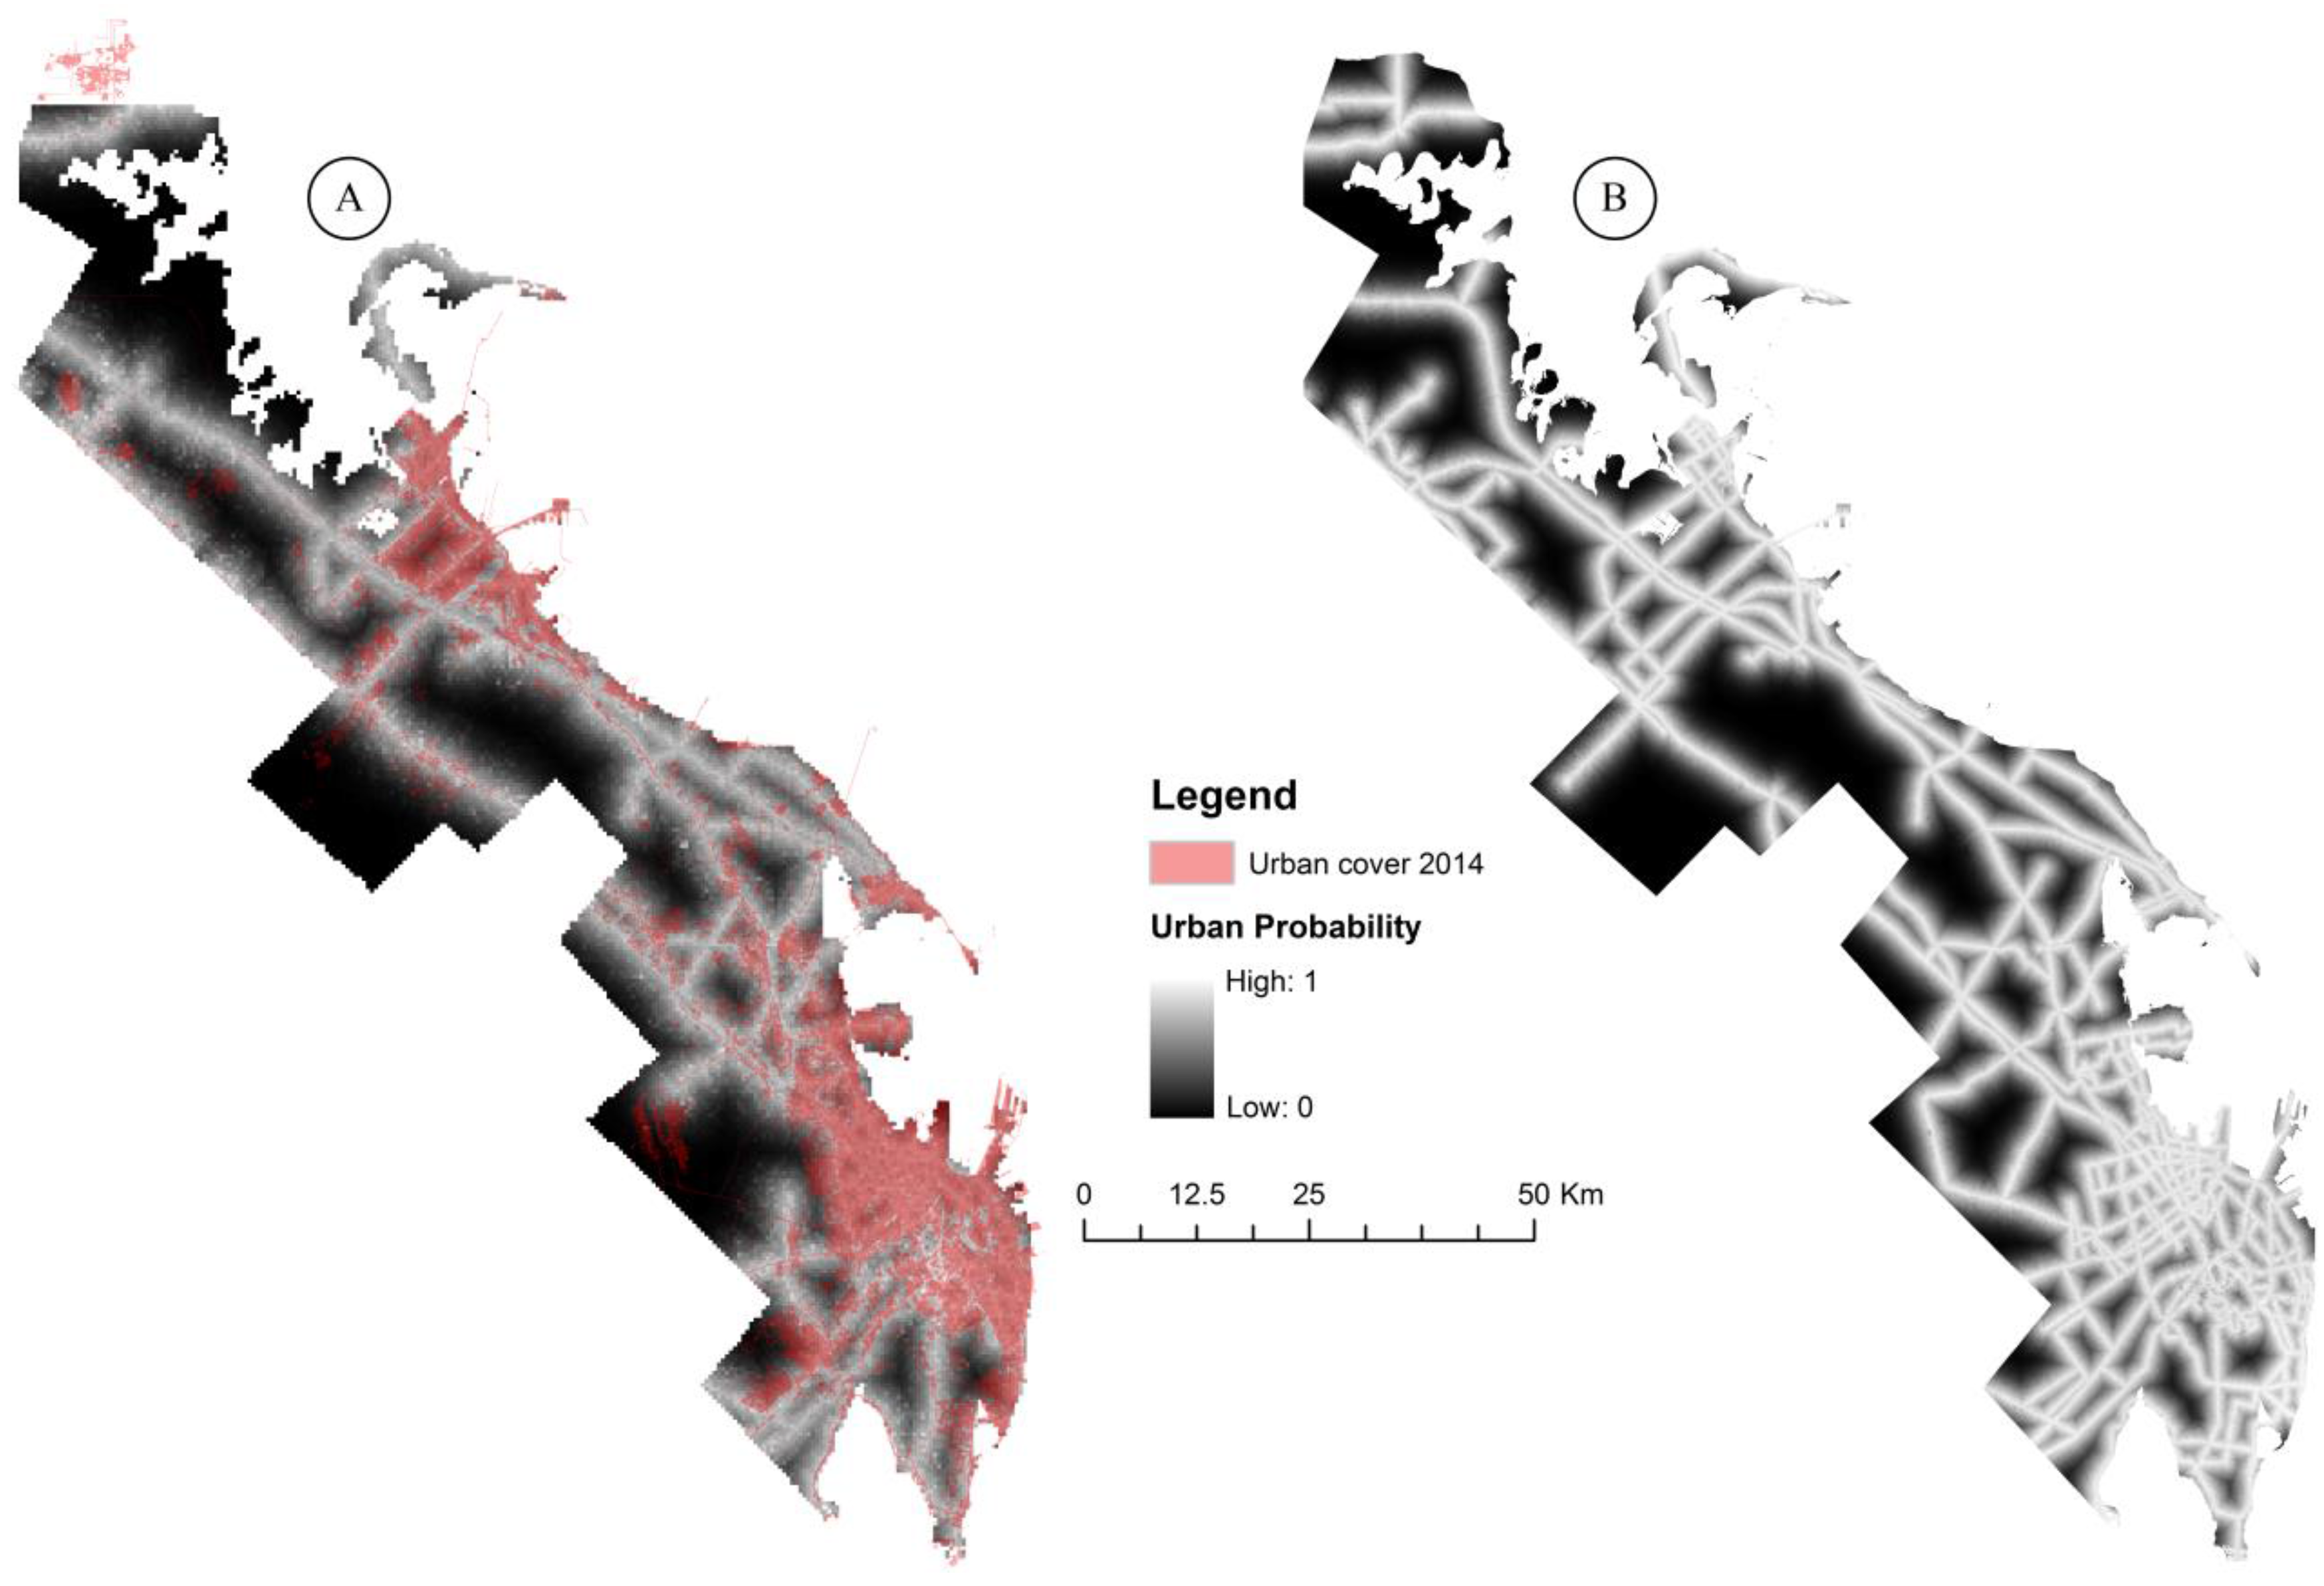
We used a binary logistic regression to associate urban growth with two biophysical factors (elevation and slope) and two proximity driving factors (distance to roads and distance to drainages) and to produce urban growth probability maps for the five cities. The binary logistic regression was used first in 1985 to estimate and compare the urban growth probability with urban maps of 2014 that were generated from satellite data. This regression was then applied for the urban growth of 2014 using Equation (1).
2.4.3. Prediction of Spatial Patterns of Urban Distribution
The probability maps for the five cities were derived using Equation (1). The coefficient values of the driving factors (elevation, slope, drainage distance, and road distance) and the intercept values were calculated in ArcGIS 10.2. The odds ratio of value 1 was used individually for each map of 1985 and 2014 across the five cities. The calculation was first applied to the 1985 data in order to validate the probability maps of 2014. A visual comparison was performed by overlaying the probability map of 1985 and the urban area maps of 2014 that were produced from the image classification of 2014 images. The logistic regression model was then applied to the 2014 data using the new road layer of 2014 for the street distance value.
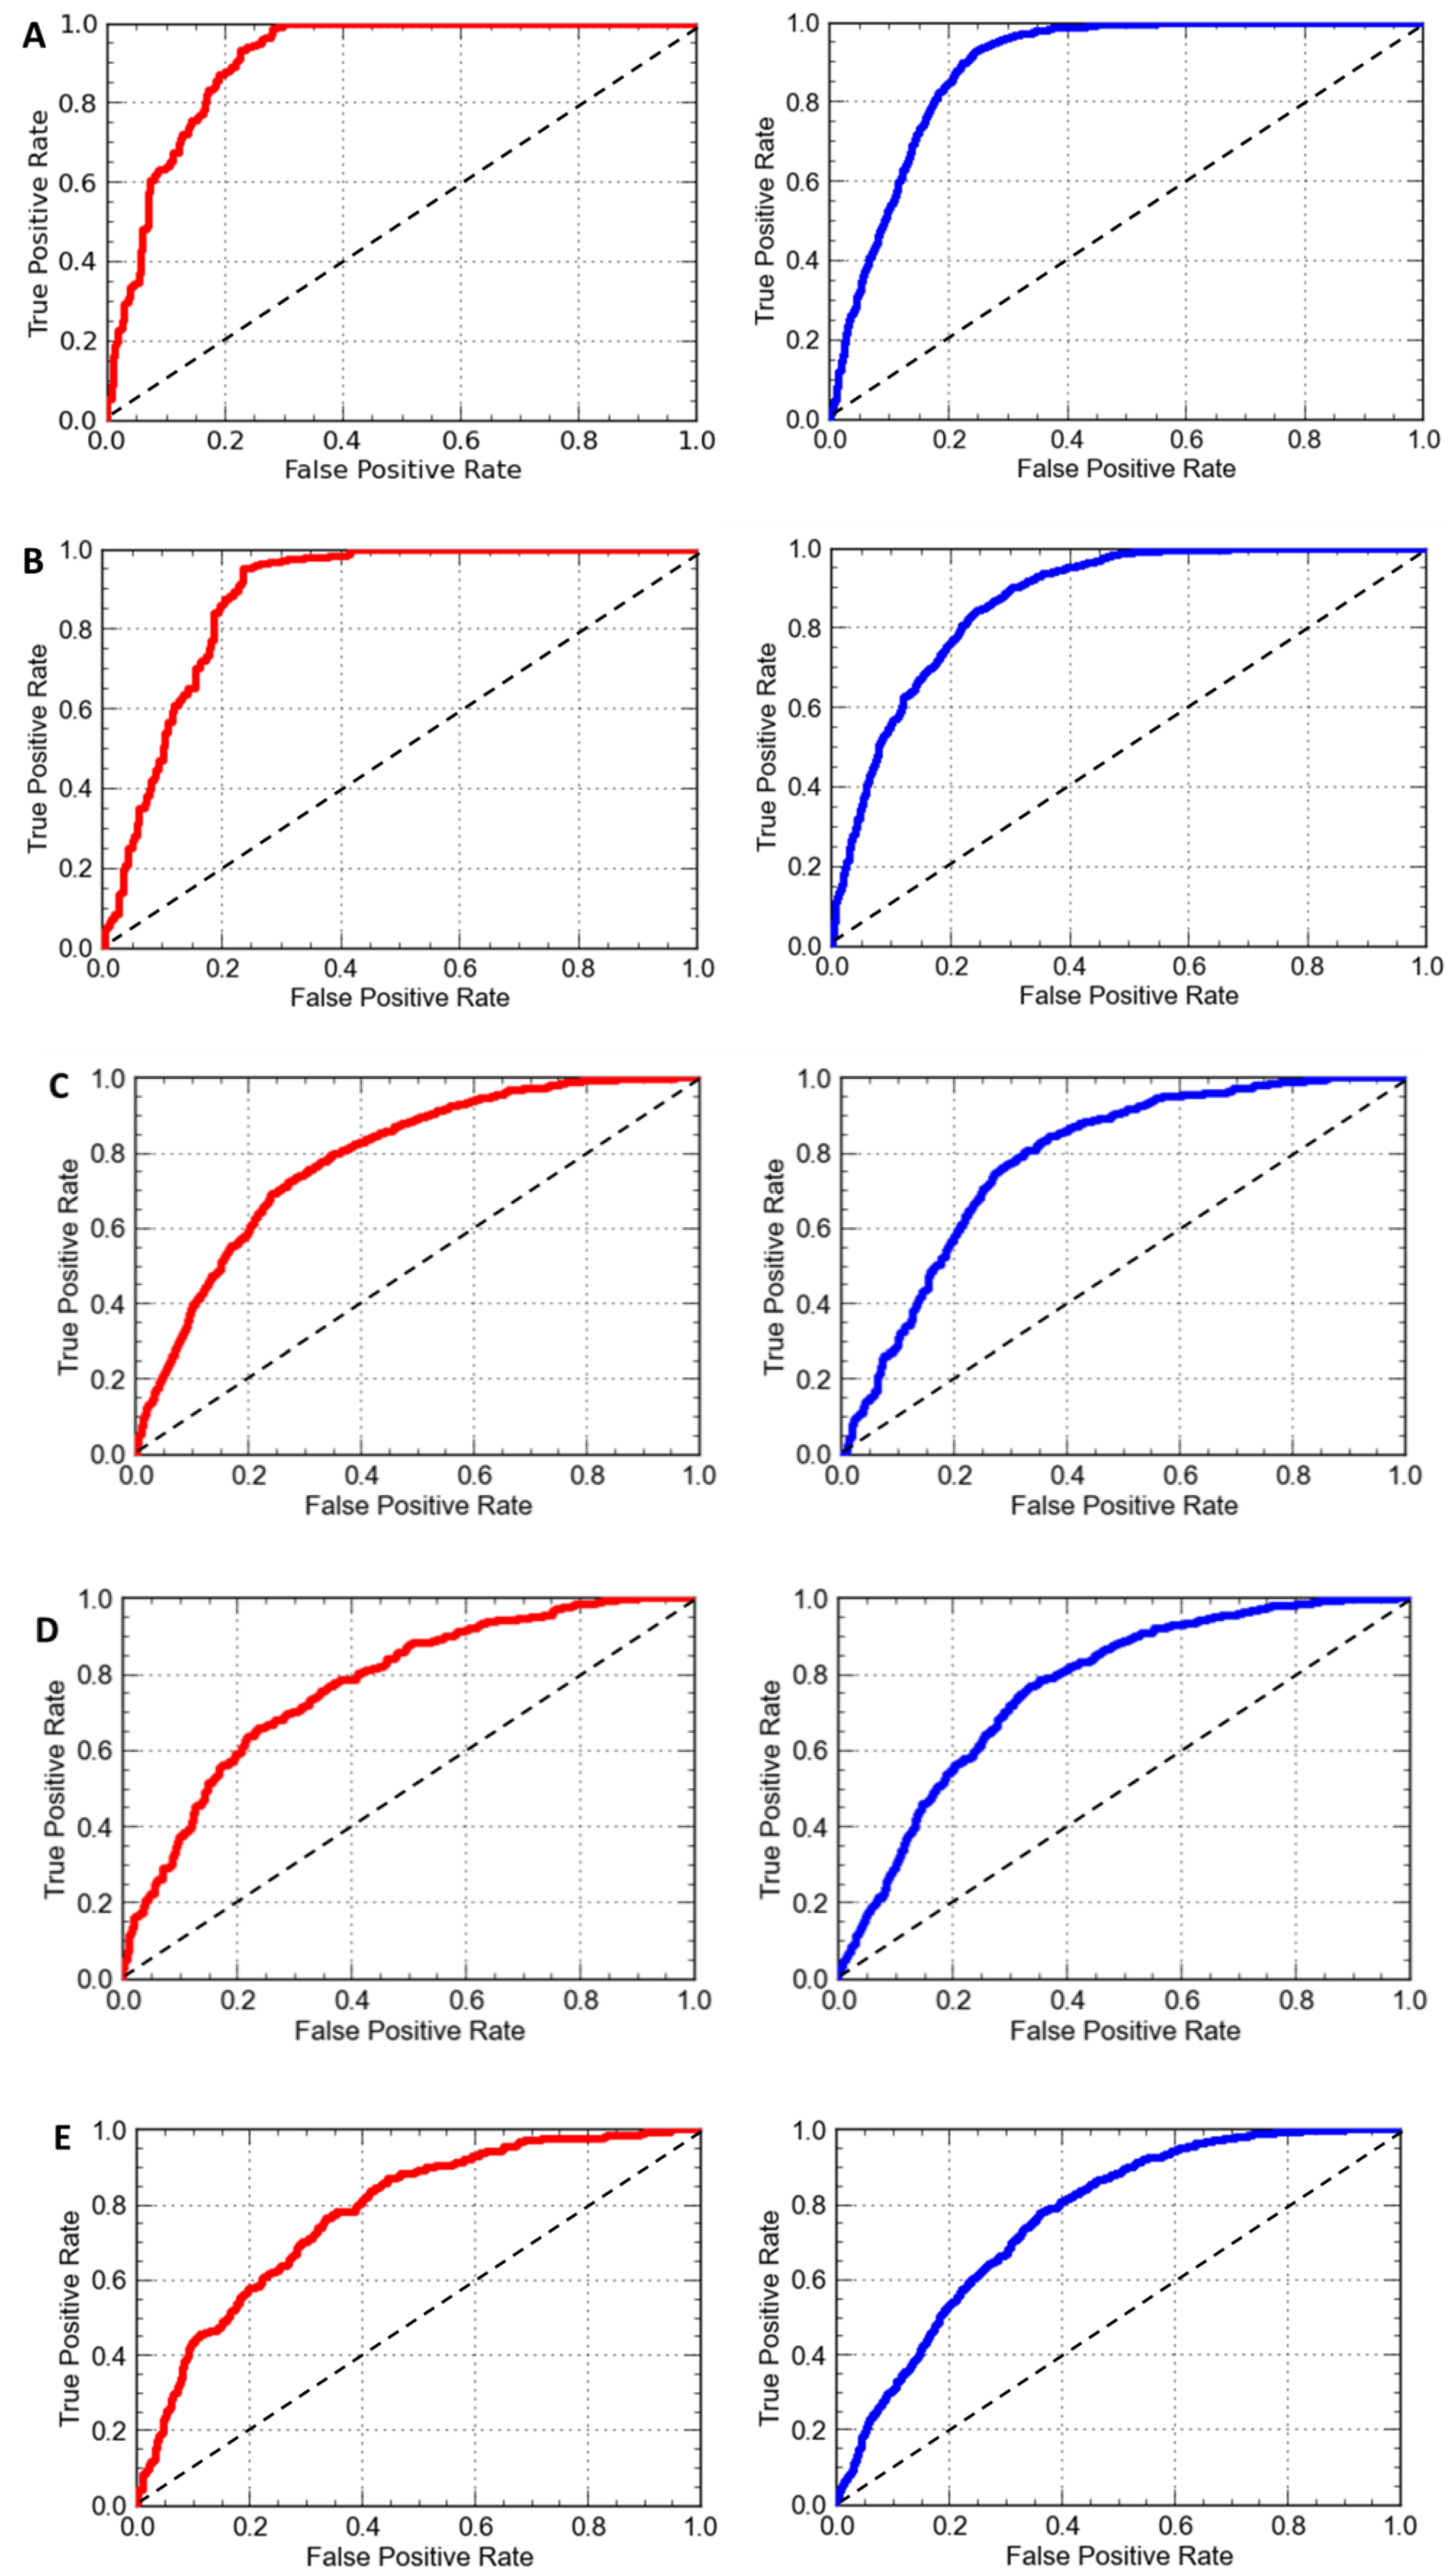
2.4.4. Model Validation
The logistic regression model performance was validated using the Relative Operating Characteristic (ROC) method. ROC is a widely used method to measure the relationship between simulated change and real change in the field of land use and land cover changes [
16,
36,
37,
38]. The statistical approach of the ROC method is the area under the curve that connects the plotted points. The equation that was used to calculate the area under the curve (AUC) was proposed by Pontius Jr and Schneider [
39] as:
where
xi is the rate of false positive for
i,
yi is the rate of true positive for
i, and
n is the number of suitability groups. The rate of false positive
xi and the rate of true positive
yi were obtained from the logistic regression analysis (Equation (1)).
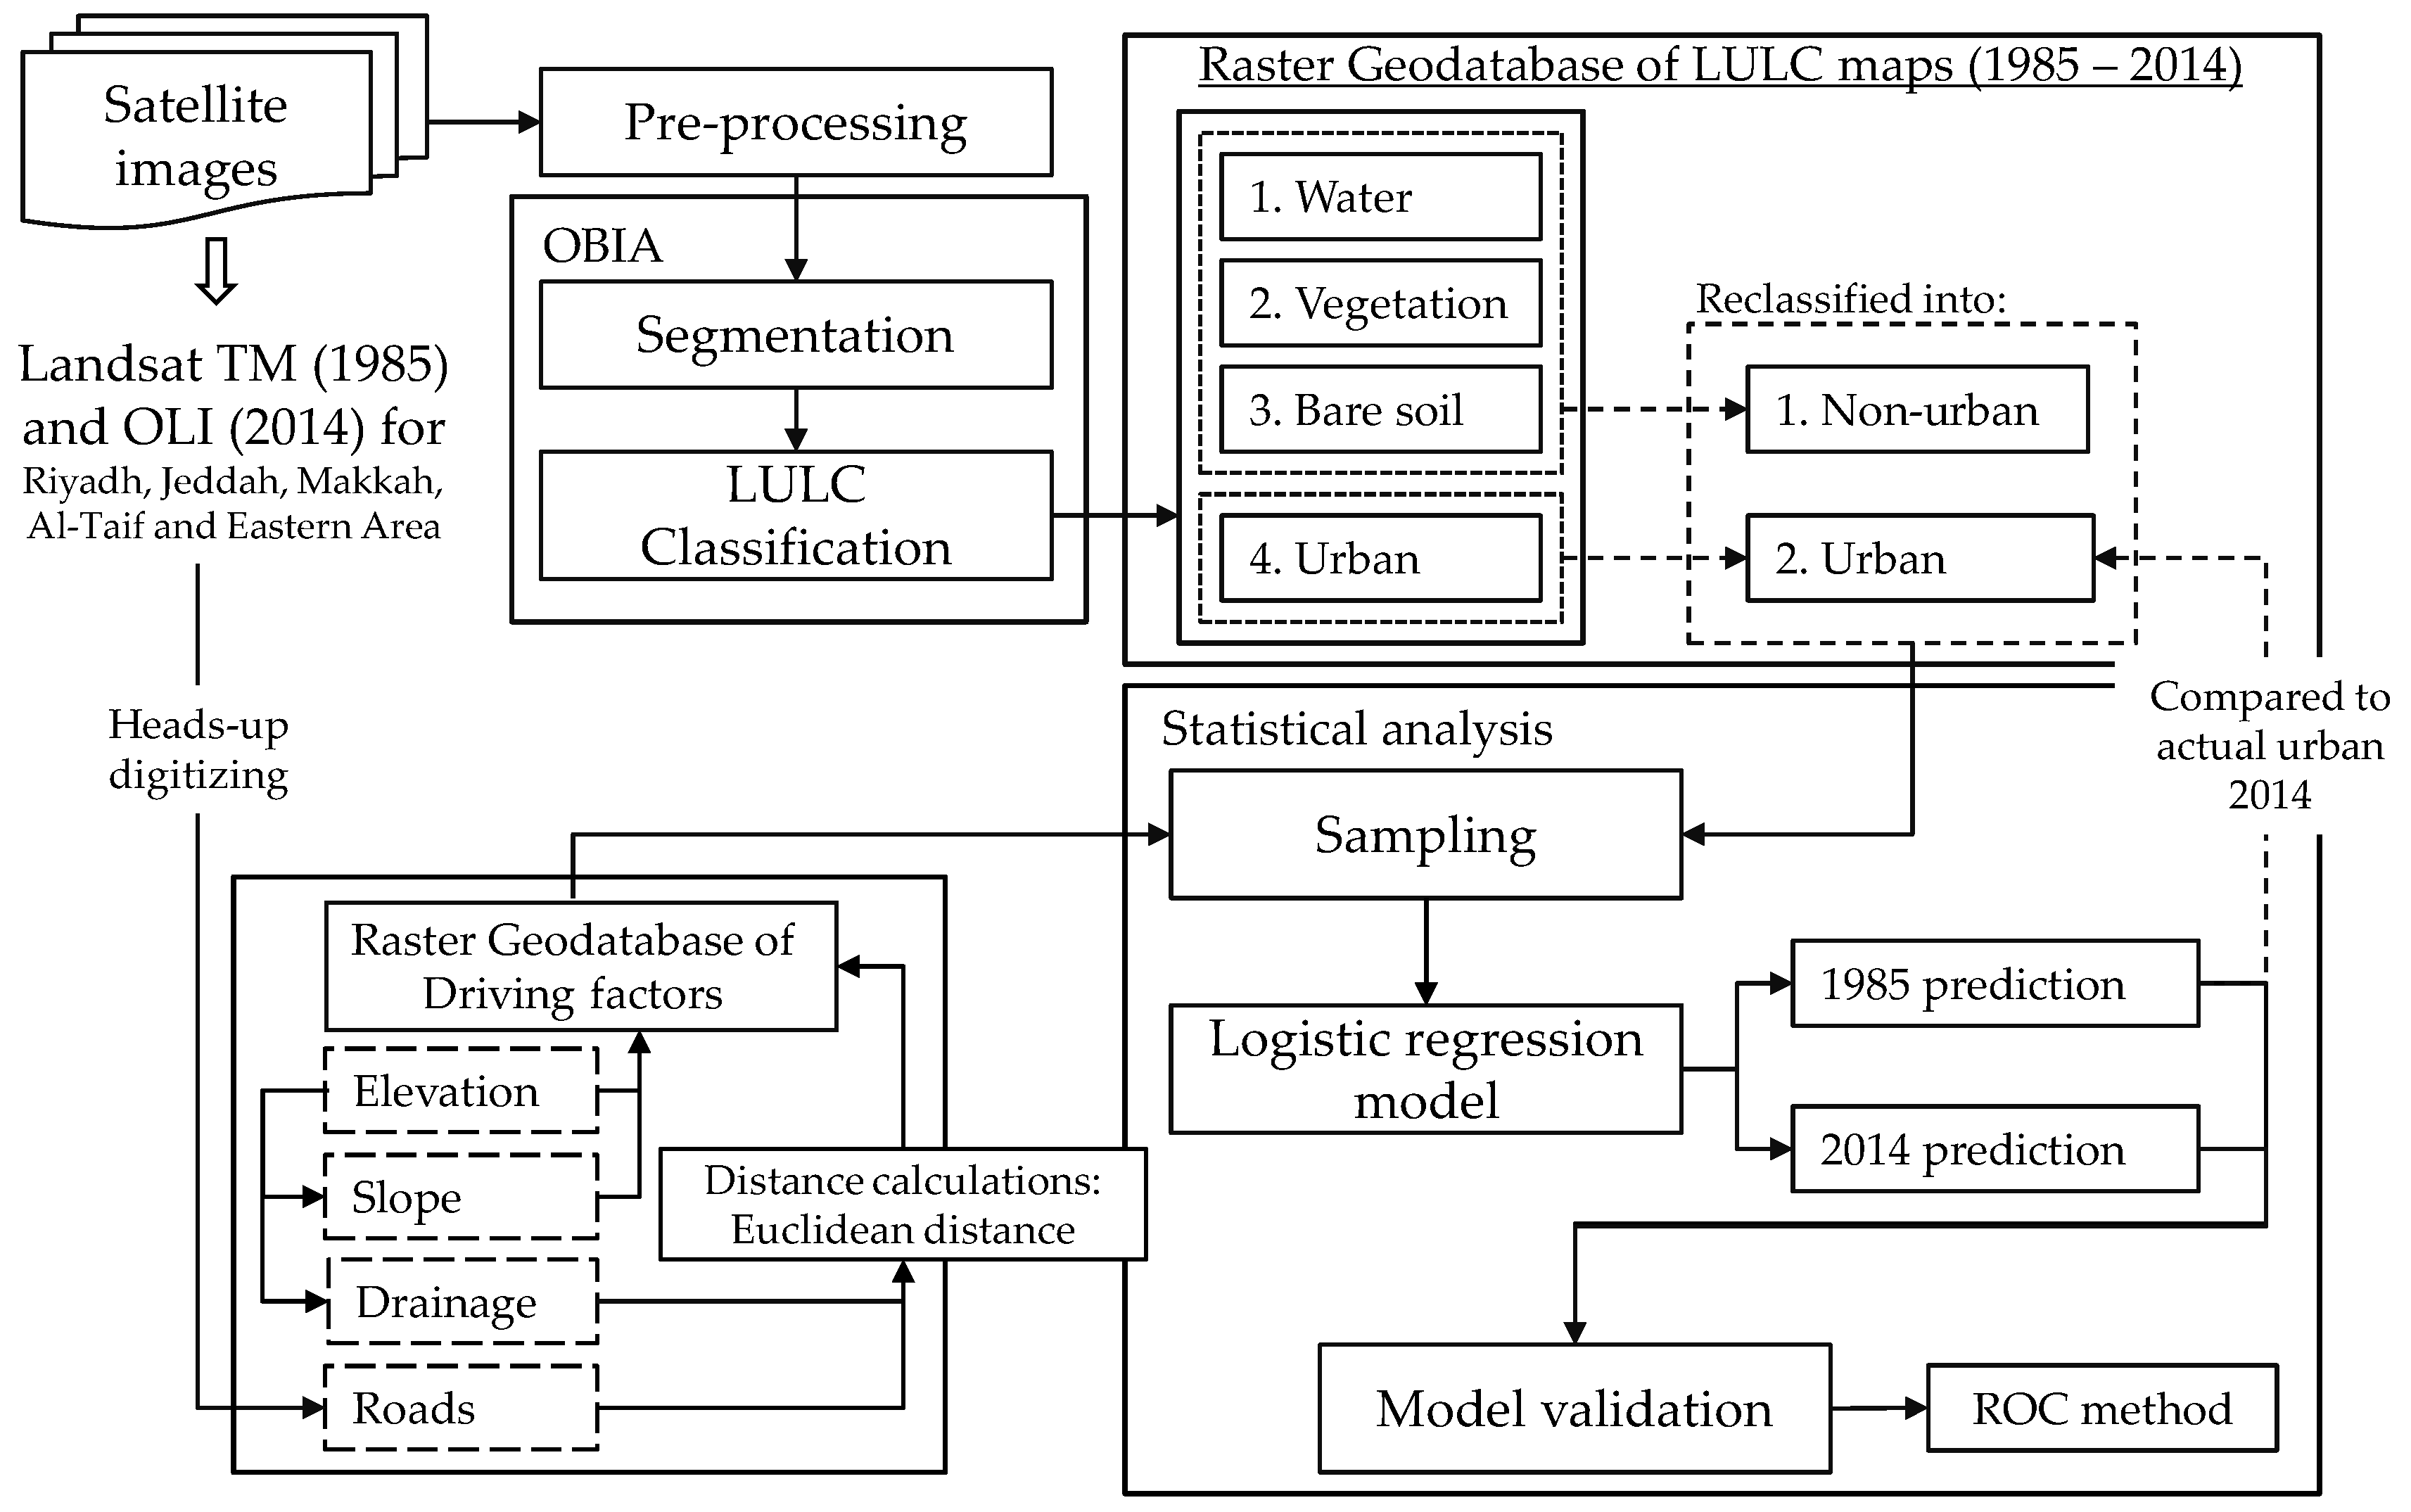
Figure 4 illustrates in brief the methods used in this research.
4. Discussion
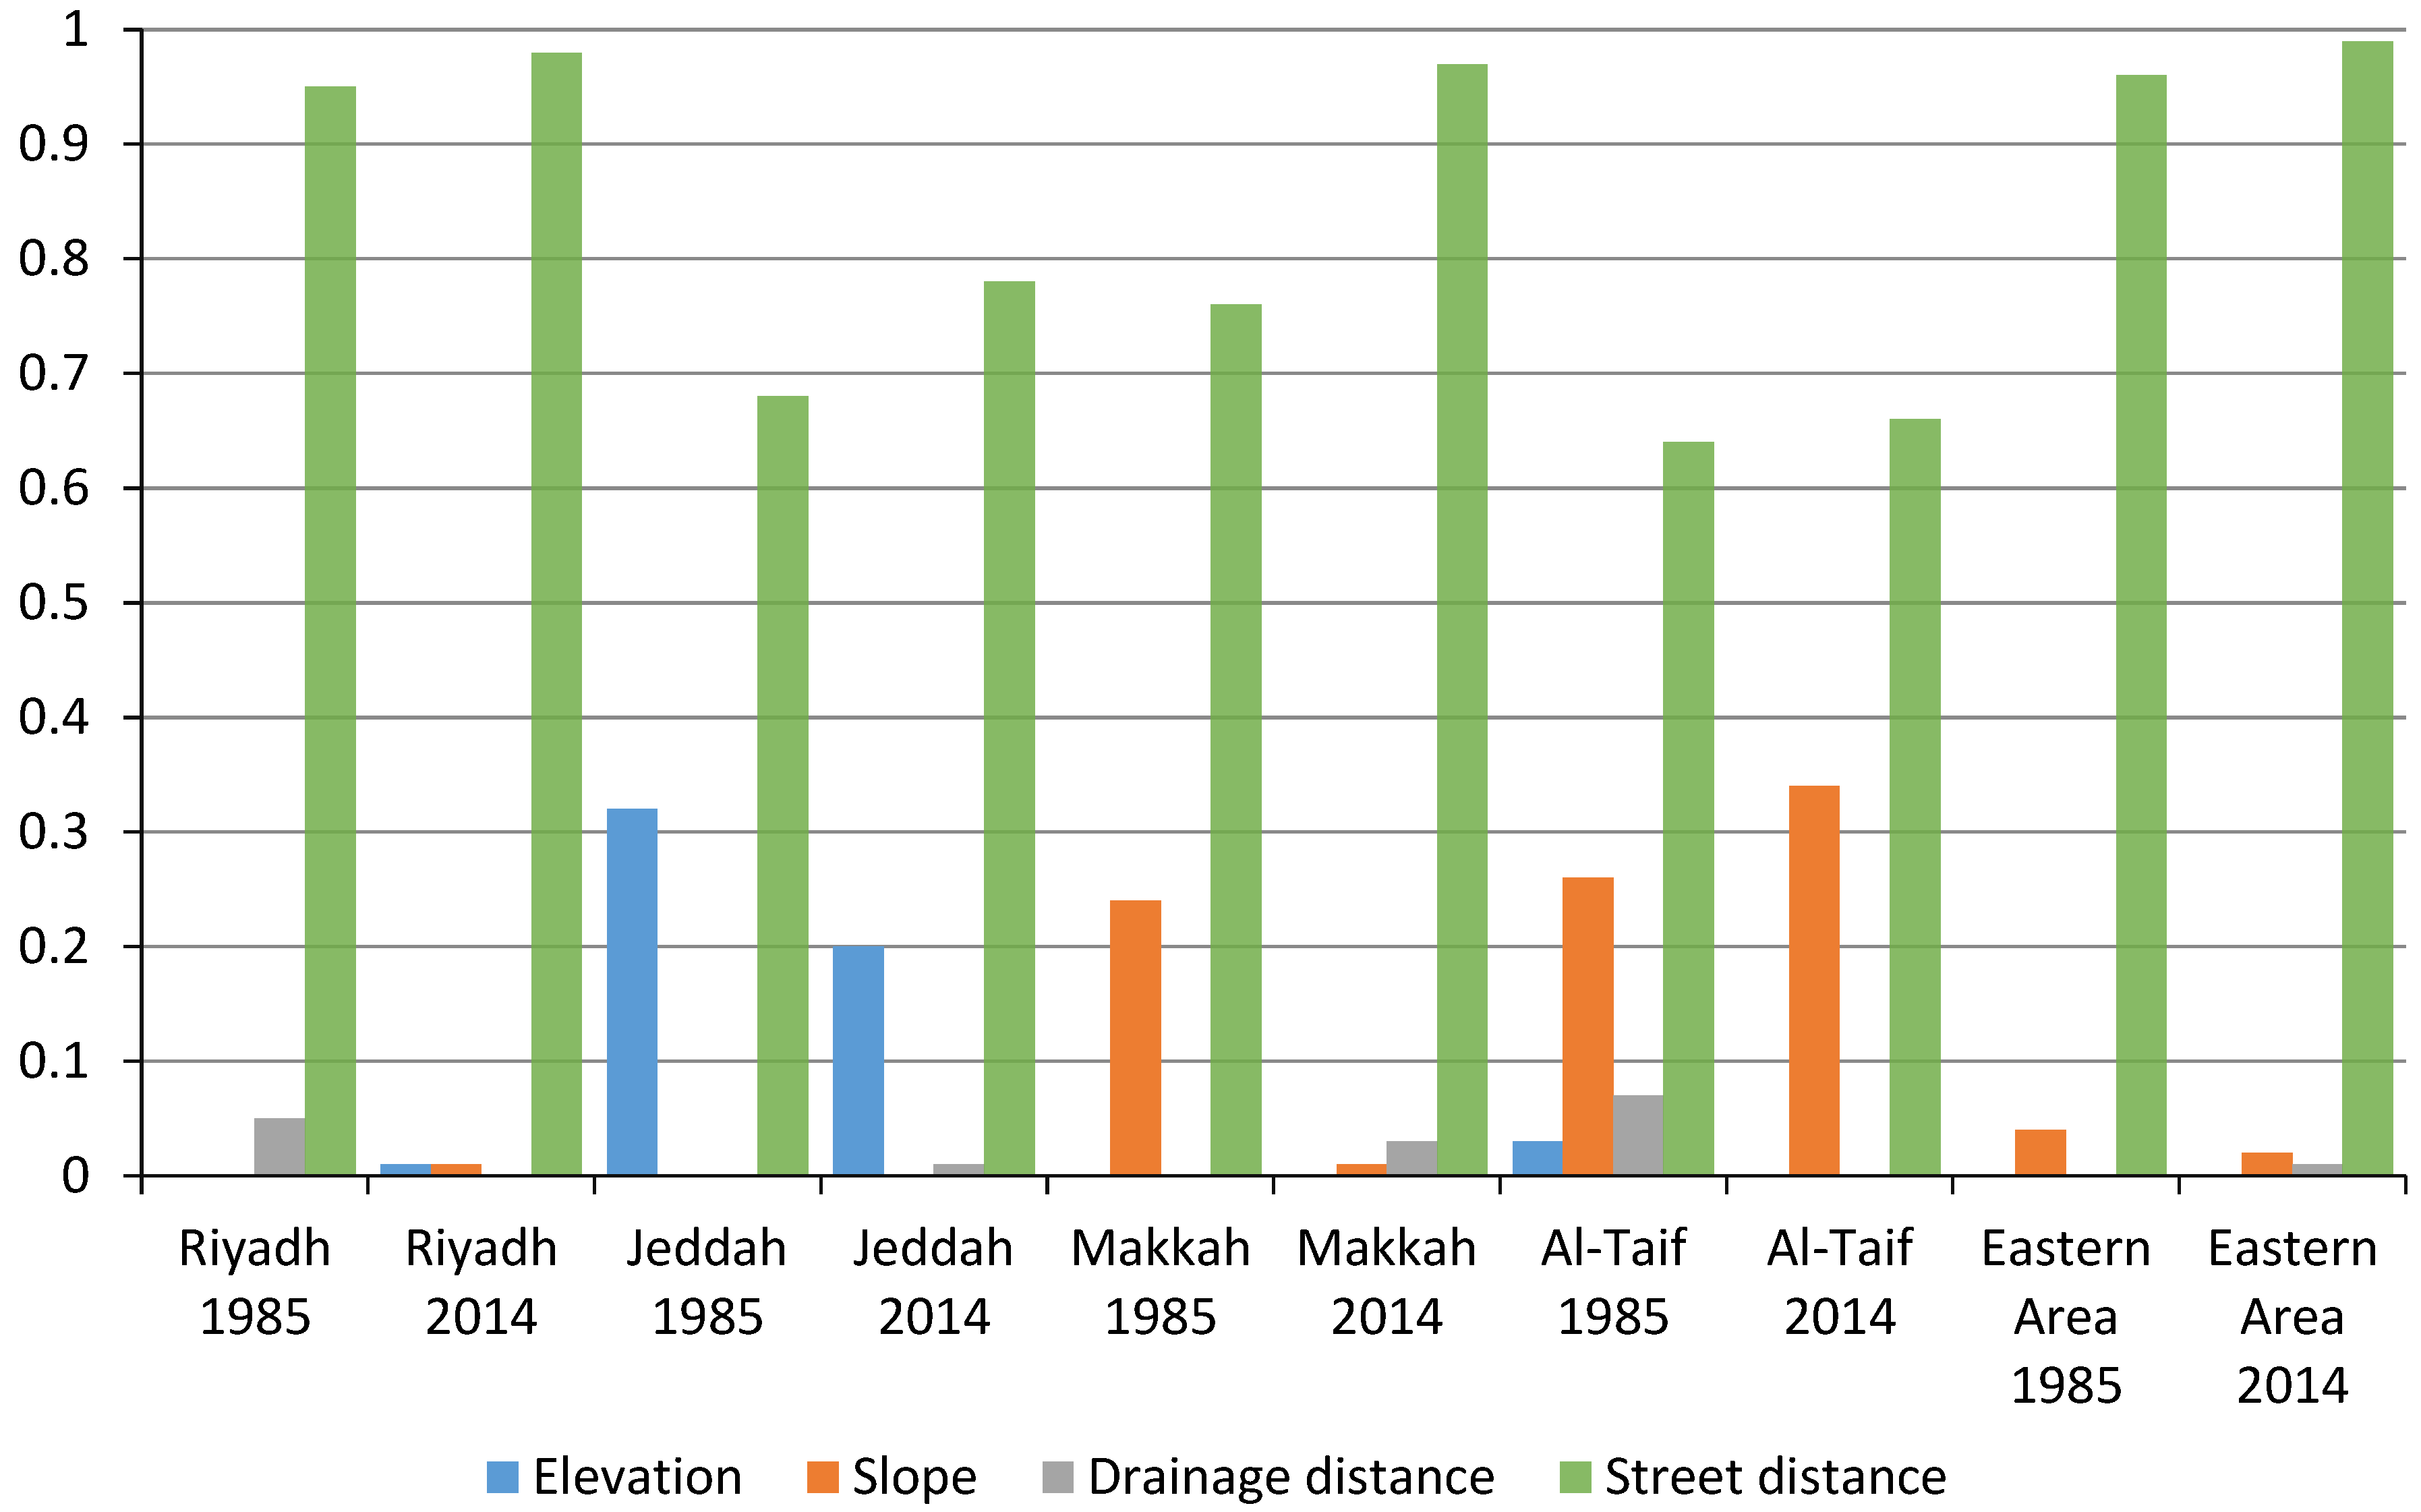
The results that are presented in this research indicate that road distance is the most important variable among the four selected factors in the five cities for the projection of urban growth. The analysis of data from both 1985 and 2014 showed a domination of the road distance factor because of the extensive transportation systems in Saudi Arabia that have been built in the five decades following 1950 [
40]. The transportation systems in the five cities significantly increased the probability of urban expansion and will likely contribute to the expansion of urbanization in the future. The significant effects of road distance indicate the probability of urban areas being close to major roads. Thus, locations close to roads are likely to be developed more than are locations that are far from the roads. The results of this study are consistent with the results presented by Müller
, et al. [
41] and Li, Zhou and Ouyang [
17], who reported the relationship between the distance to roads and the probability of urban expansion.
Biophysical variables, such as elevation and slope, showed variable effects among the five cities. While the elevation effects were lower in Riyadh in 1985, they were significantly positive in 2014. This result may be due to the increase in housing demands in recent years [
42], which prompted the government and housing agencies to build new construction without considering practical elevation of the land form. In addition, staying within the urban boundary close to the city center rather than in the margins is on demand, even though the construction cost is high. Jeddah was also affected negatively by elevation in both 1985 and 2014, but the effect in 2014 was greater than that in 1985 because urban growth was distributed in the east where the elevation is high. Thus, the elevation factors control the urban growth in the eastern portion of the city more than in the other parts. While Al-Taif was positively affected by elevation at a level of 0.05 in 1985, elevation had less effect in 2014. Other cities, such as Makkah and Eastern Area, were less affected by elevation in both 1985 and 2014.
Slope also had a significant effect in the five cities. All five cities showed a negative effect of slope, indicating that slope limited the distribution of urban expansion in these cities. However, there were variable effects between 1985 and 2014. While the slope negatively influenced urban expansion in Al-Taif in both 1985 and 2014 due to the complex topographic structure in Al-Taif, the effect of slope in cities such as Riyadh, Jeddah and Makkah was significant in 2014. The urban areas in Riyadh, Jeddah and Makkah expanded after 1985 from the center towards the outer boundary, which potentially contain steep slopes. For example, the analysis of urbanization in 1985 in Riyadh showed that the city expansion was limited and centered near the city center, while in 2014, the urban area expanded to reach the slopes, as is the case in the southern part of the city. Similarly, urban expansion in Jeddah in 2014 was distributed towards the eastern portion, which has relatively steep slopes. The influence of slope will continue to affect these cities in the future because urban expansion is likely to continue in the same direction. Thus, slope is an important factor in determining the distribution of urban areas. Other studies in different places have observed the effect of slope on urban expansion [
15,
17,
43].
While other studies indicated that distance to water has an effect on the urban growth, our results showed the opposite. Distance to drainage showed least effects on urban distribution among the selected variables. This is because of the climate condition in the desert areas. In such areas, water surfaces, except seas, are fed by rain, which is very little in these desert cities. Most of the water surfaces are dried out throughout the year due to rising temperature and evaporation. This condition also applies to the drainage lines. In Saudi Arabia, drainage lines are not permanent waterways. They are normally dry most of the year and fill after a heavy rain.
The analysis also indicates that the selected variables show variable effects over time. However, there is an exception in the distance to roads, which consistently showed an effect in both 1985 and 2014 in all five cities. The accessibility to urban facilities and services and security may be attractive for construction and expansion close to roads. The road distance factor may continue to influence urban growth in the selected cities and to determine the shape and spatial dimension of urban distribution in the future. The influence of biophysical factors, such as elevation and slope, may decrease in the future due to the advancement of technology that can reduce the cost of construction in these locations [
17,
43] as well as limited low-slope land being available. Thus, driving forces are variable over the time due to the increased urbanization rate.
The logistic regression model has the ability to provide an easily discernible prediction of urban growth [
16]. However, the ideal approach to test the reliability of the prediction model is to develop a model based on urban change over one-time period and to apply the model to predict the probabilities of growth after the second time period [
44]. Applying the model to predict urban growth in 1985 offered us an opportunity to test the ability of the model to predict urbanization probabilities based on 2014 urban growth. The results of urbanization probability maps based on 1985 urban change and the four driving forces showed higher predictors compared to the actual urban growth in 2014. This result means that the model that was applied to predict the probable areas of urbanization after 2014 provides consistent and accurate probabilities of urban growth. Therefore, multi-temporal datasets offer a technique to compare actual growth with a simulation model of the potential development of urbanization.
While logistic regression model is powerful for analyzing the future urban development based on the trends that were observed in the past [
15,
45], the limitations of the logistic regression model in the urban change prediction can be summarized in three points. First, the logistic regression method is not able to provide a transition matrix from different land cover areas to urban areas. Moreover, it may not be suitable to provide a detailed description of the temporal dynamics of the future urban growth and to address the correlation between independent variables [
46]. Finally, the prediction model of logistic regression ignores the effect of other land cover areas on the expected urban growth which may produce an error of the estimation of the future development. However, logistic regression model is useful to account for the dynamics of the past and future urban growth based on different driving factors.
Modification of the landscape in the five cities to expand construction has led to the loss of several environmental and ecological components, including vegetation cover, biodiversity and soil. The landscape problem in Saudi Arabia lies in that most urban areas have been built near or on sensitive environments, such as mountains, which increases the developmental pressure in these areas and decreases the available green spaces and associated biodiversity. Another issue is the increased karst collapse hazard. The increased karst collapse hazard, particularly in Eastern Area, is due to rapid urban development, which has produced larger buildings and much stronger foundations [
47]. The change in the landscape structure and landform of these cities to expand urban areas suggests an increase in the danger of such hazards. In addition to the karst collapse hazard, the higher level of urbanization and impervious surfaces has a significant impact on the hydrological systems and increases the potential hazard of flood risks [
48]. Recently, floods have become an annual disaster with a high impact in many places in Saudi Arabia [
49]. Thus, the measurement of urban expansion is essential for managing and assessing environmental and ecological impacts in order to avoid an increase in potential risks and to protect such sensitive environments. The analysis of urban change prediction provides a tool to manage and assess the environmental changes in the five cities and provides the needed information that can help planners and local authorities in possible future development.
5. Conclusions
Information on urbanization processes and their deriving factors should help planners to provide adequate strategies for further developments. Urban planners and environmental managers need an answer to the question as to which factors have an influence on the expansion of urban growth. Failure to understand the urbanization process and its driving factors in the past and present growth will result in unexpected expansion in the future. This research tried to address this question by analyzing urban expansion in five Saudi Arabian cities between 1985 and 2014 using satellite data and a logistic regression model.
This study emphasized that incorporation of satellite data and regression statistical analysis (e.g., logistic regression) is effective in improving our understanding of the trend and distribution of the future urban growth in Saudi Arabian cities. It also provides the essential information of the most affected variables on urban expansion in the past and future changes. The results indicate that the roads variable had the most effect on urban developments among the five cities. Urban cover in Saudi Arabian cities is likely to develop near and on the major roads. Slope and elevation considerably controlled urban growth during the past growth in some cities, but these effects are likely to be reduced in the future, especially in the low-slope lands, due to advancement in technology to build on sloping land and the scarcity of flat land.
In this study, we analyzed only four variables, including elevation, slope, drainage distance and street distance, and the main effects of such variables on urban distribution in five Saudi Arabian cities. Other variables, such as population, gross domestic product, distance to the socioeconomic centers, land use policy and master plan may have an important relationship with urban distribution in the selected cities. However, we did not include such variables due to limitations in the availability of these data. Incorporating such variables with the selected factors can provide more refinement of the urbanization process in Saudi Arabian cities. In addition, integrating logistic regression model and other regression models, such as geographically weighted regression (GWR), will be worthwhile to determine the heterogeneity in the estimated relationships among the independent and dependent variables [
50,
51]. In addition, incorporating logistic regression and cellular automata model may provide more detail regarding the future transition from other land cover areas to urban land cover.


