1. Introduction
1.1. Open Data Expectations
Since the 2009 Obama Executive Order [
1], the 2010 Digital Agenda of the European Commission [
2], the 2011 Open Government Partnership Initiative [
3], and the 2013 G8 Open Data Charter [
4] there has been an increasing trend of government datasets published as open data. Open government data are associated with realizing ambitions, such as a more transparent and efficient government [
5], reducing corruption [
6,
7]; increasing citizen trust in government decision-making [
8]; improving citizens’ participation [
9] and increasing democratic control [
10]; solving societal problems; increasing economic value due to companies creating innovative products and services with open data as a resource [
11,
12]; and efficiency improvements [
13,
14]. For this article, we consider open data to be data available for re-use without any cost and without any restrictions in use.
By re-using and sharing data between government organizations, it is expected that internal efficiencies will be realized as transaction costs will decrease, [
13,
15] as there will be no longer need for contract negotiations and policing between government organizations. In addition, by employing the principle of “collect once, reuse many times” governments can work more efficient and be more effective in decision-making. Open data may also contribute to higher data quality by fostering user feedback (incomplete data, errors,
etc.) [
16].
External benefits include solving societal problems (e.g., [
17,
18], as well as economic benefits [
11,
14,
19]. Companies can use open data to develop innovative products and services, which may not only contribute to their turnover, but also contribute to society in general. For instance, actual roads information may lead to more efficient route planning and, thus, to less CO
2 emissions and shorter travel time [
20].
1.2. Open Data Principles
To facilitate effective re-use, open data has to comply with a number of principles. In 2007, 30 open data advocates defined a list of criteria for open government data. In 2010, the Sunlight Foundation [
21] updated these original principles, which have become the basis for many open data policies:
- (1)
Completeness, including release of descriptive metadata, with the highest possible level of granularity, which will not lead to personally identifiable information;
- (2)
Primacy, collected at the source, including information on how and where data were collected to allow verification by users;
- (3)
Timeliness, i.e., data should be released as quickly as possible;
- (4)
Ease of physical and electronic access;
- (5)
Machine-readable, in formats that allow machine-processing;
- (6)
Non-discrimination, available to anyone with no requirement of identification or justification;
- (7)
Use of commonly-owned or open formats;
- (8)
Licensing, i.e., no imposition of attribution requirements and preferably labeled as part of the public domain;
- (9)
Permanence, i.e., data should remain online with appropriate version-tracking and archiving;
- (10)
Usage costs, i.e., data available preferably free of charge.
Although most of these principles were agreed upon for public sector data [
22], they should equally apply to private sector organizations with a mandated public task. There are ample private organizations mandated to perform a certain public task and generate data in the process, yet, these organizations are often exempted from open government data policies. However, it could be argued that data generated in the process of performing a public task are a public good [
18] and should, therefore, adhere to the same open data principles. Geographical data, such as topographical maps and the underlying Earth observation data, energy data, and health data are top-listed by the European Commission for release as open government data due to the high demand from re-users [
23]. However, as data holders of such data are often private companies or (semi) privatized government organizations, these organizations often fall outside the scope of the legal framework related to accessibility of public sector information. There are a number of open access initiatives for non-government data, such as publicly-funded research data [
24], earth observation data [
25], and health data [
26]. In addition, some private companies already adopting open data practices, often do so not for altruistic reasons but to market their products more effectively [
27] or to enable data-as-a-service business models [
28].
1.3. Assessment of the Effects of Open Data
Although there is ample anecdotal evidence [
11,
14] and case studies [
29] to demonstrate the benefits of open data, to date little is known about the underlying organizational mechanisms and implications of open data as most open data impact assessments are
ex ante [
30]. The impact of open data has been only recently addressed in macro-economic research projects. Detailed studies on the costs of the implementation are scant, results on the impact of open data on an organization’s workflow processes and from a user perspective are very limited, and a monitoring framework that supports the assessment of the impact in a scientifically solid way is lacking. This research aims to provide an
ex post assessment of open data effects for Liander, a private company responsible for energy network distribution and administration.
We have developed a monitoring framework to assess open data effects and have applied the framework to Liander’s small-scale energy consumption and generation dataset. This research is performed through a literature study on open data and the performance of open data. The developed assessment framework is applied to the open data of Liander. The benchmark was performed through structured interviews with selected Liander staff and users of Liander data, and analyzing web statistics. The follow-up was performed through structured interviews with Liander staff, questionnaires to users and analyzing web statistics.
In
Section 2, we explain the potential of open energy data and describe structure of the Dutch energy sector. We provide a description Liander data flows and data services prior to open data implementation in 2013. We also briefly describe the Open Data and Beyond projects.
Section 3 provides the theoretical basis of impact assessment frameworks, and present indicators required for such a framework. We present transactions costs theory, and the organizational effects of implementing open data. In
Section 4, we provide the assessment outcomes related to internal effects, external effects and relational effects. We describe the results of applying the framework to monitor the effects of opening a geographic dataset. We conclude in
Section 5 with our recommendations.
2. Liander Data
2.1. Importance of Open Energy Data
Many countries and organizations are implementing or thinking of implementing open data policies for their data in line with open data agendas, such as the G8 Open Data Charter. In the European Union, the Digital Agenda for Europe of DG Information Society [
2] provides an extra stimulus to start open data projects. In the Netherlands, the Dutch Digital Agenda of the Ministry of Economic Affairs [
31], the National Open Data Agenda (NODA) [
32] of the Ministry of the Interior and Kingdom Relations and the Open Data Roadmap [
33] of the Ministry of Infrastructure and Environment are examples of national open data agendas. In addition to the public sector, the private sector recognizes potential benefits of making their datasets available as open data (cf.) [
28].
It is widely recognized that open energy data can make a valuable contribution to inform consumers better about energy reduction and improved energy efficiencies [
11,
12,
14,
34]. Energy efficiencies are necessary, as fossil fuels become a limited resource. In addition, to meet the targets set in the Paris Agreement, a significant reduction in emissions as part of the method for reducing greenhouse gas is required [
35].
Liander, an energy network administrator in the Netherlands wants to take the lead in the open energy data field as a trailblazer. Liander views open data as a contributing factor to energy conservation and the reduction of carbon emissions. Liander expects that it will benefit from open data in more than one way. Open data will not only lead to societal benefits and a more efficient operational management but also to a better image as a transparent monopolist and an open data trail blazer leading the way for other network companies.
2.2. Dutch Energy Sector
The Dutch energy sector was liberalized in 1998,
i.e., the formerly public sector utilities became private organizations mandated to execute certain public tasks. The sector was unbundled into four pillars: production, transmission (high voltage), distribution (low and medium voltage), and supply. Transmission and distribution are regulated public tasks, whereas production and supply are liberalized to allow for more competition. Although it could be argued that liberalization of the Dutch energy sector has its drawbacks [
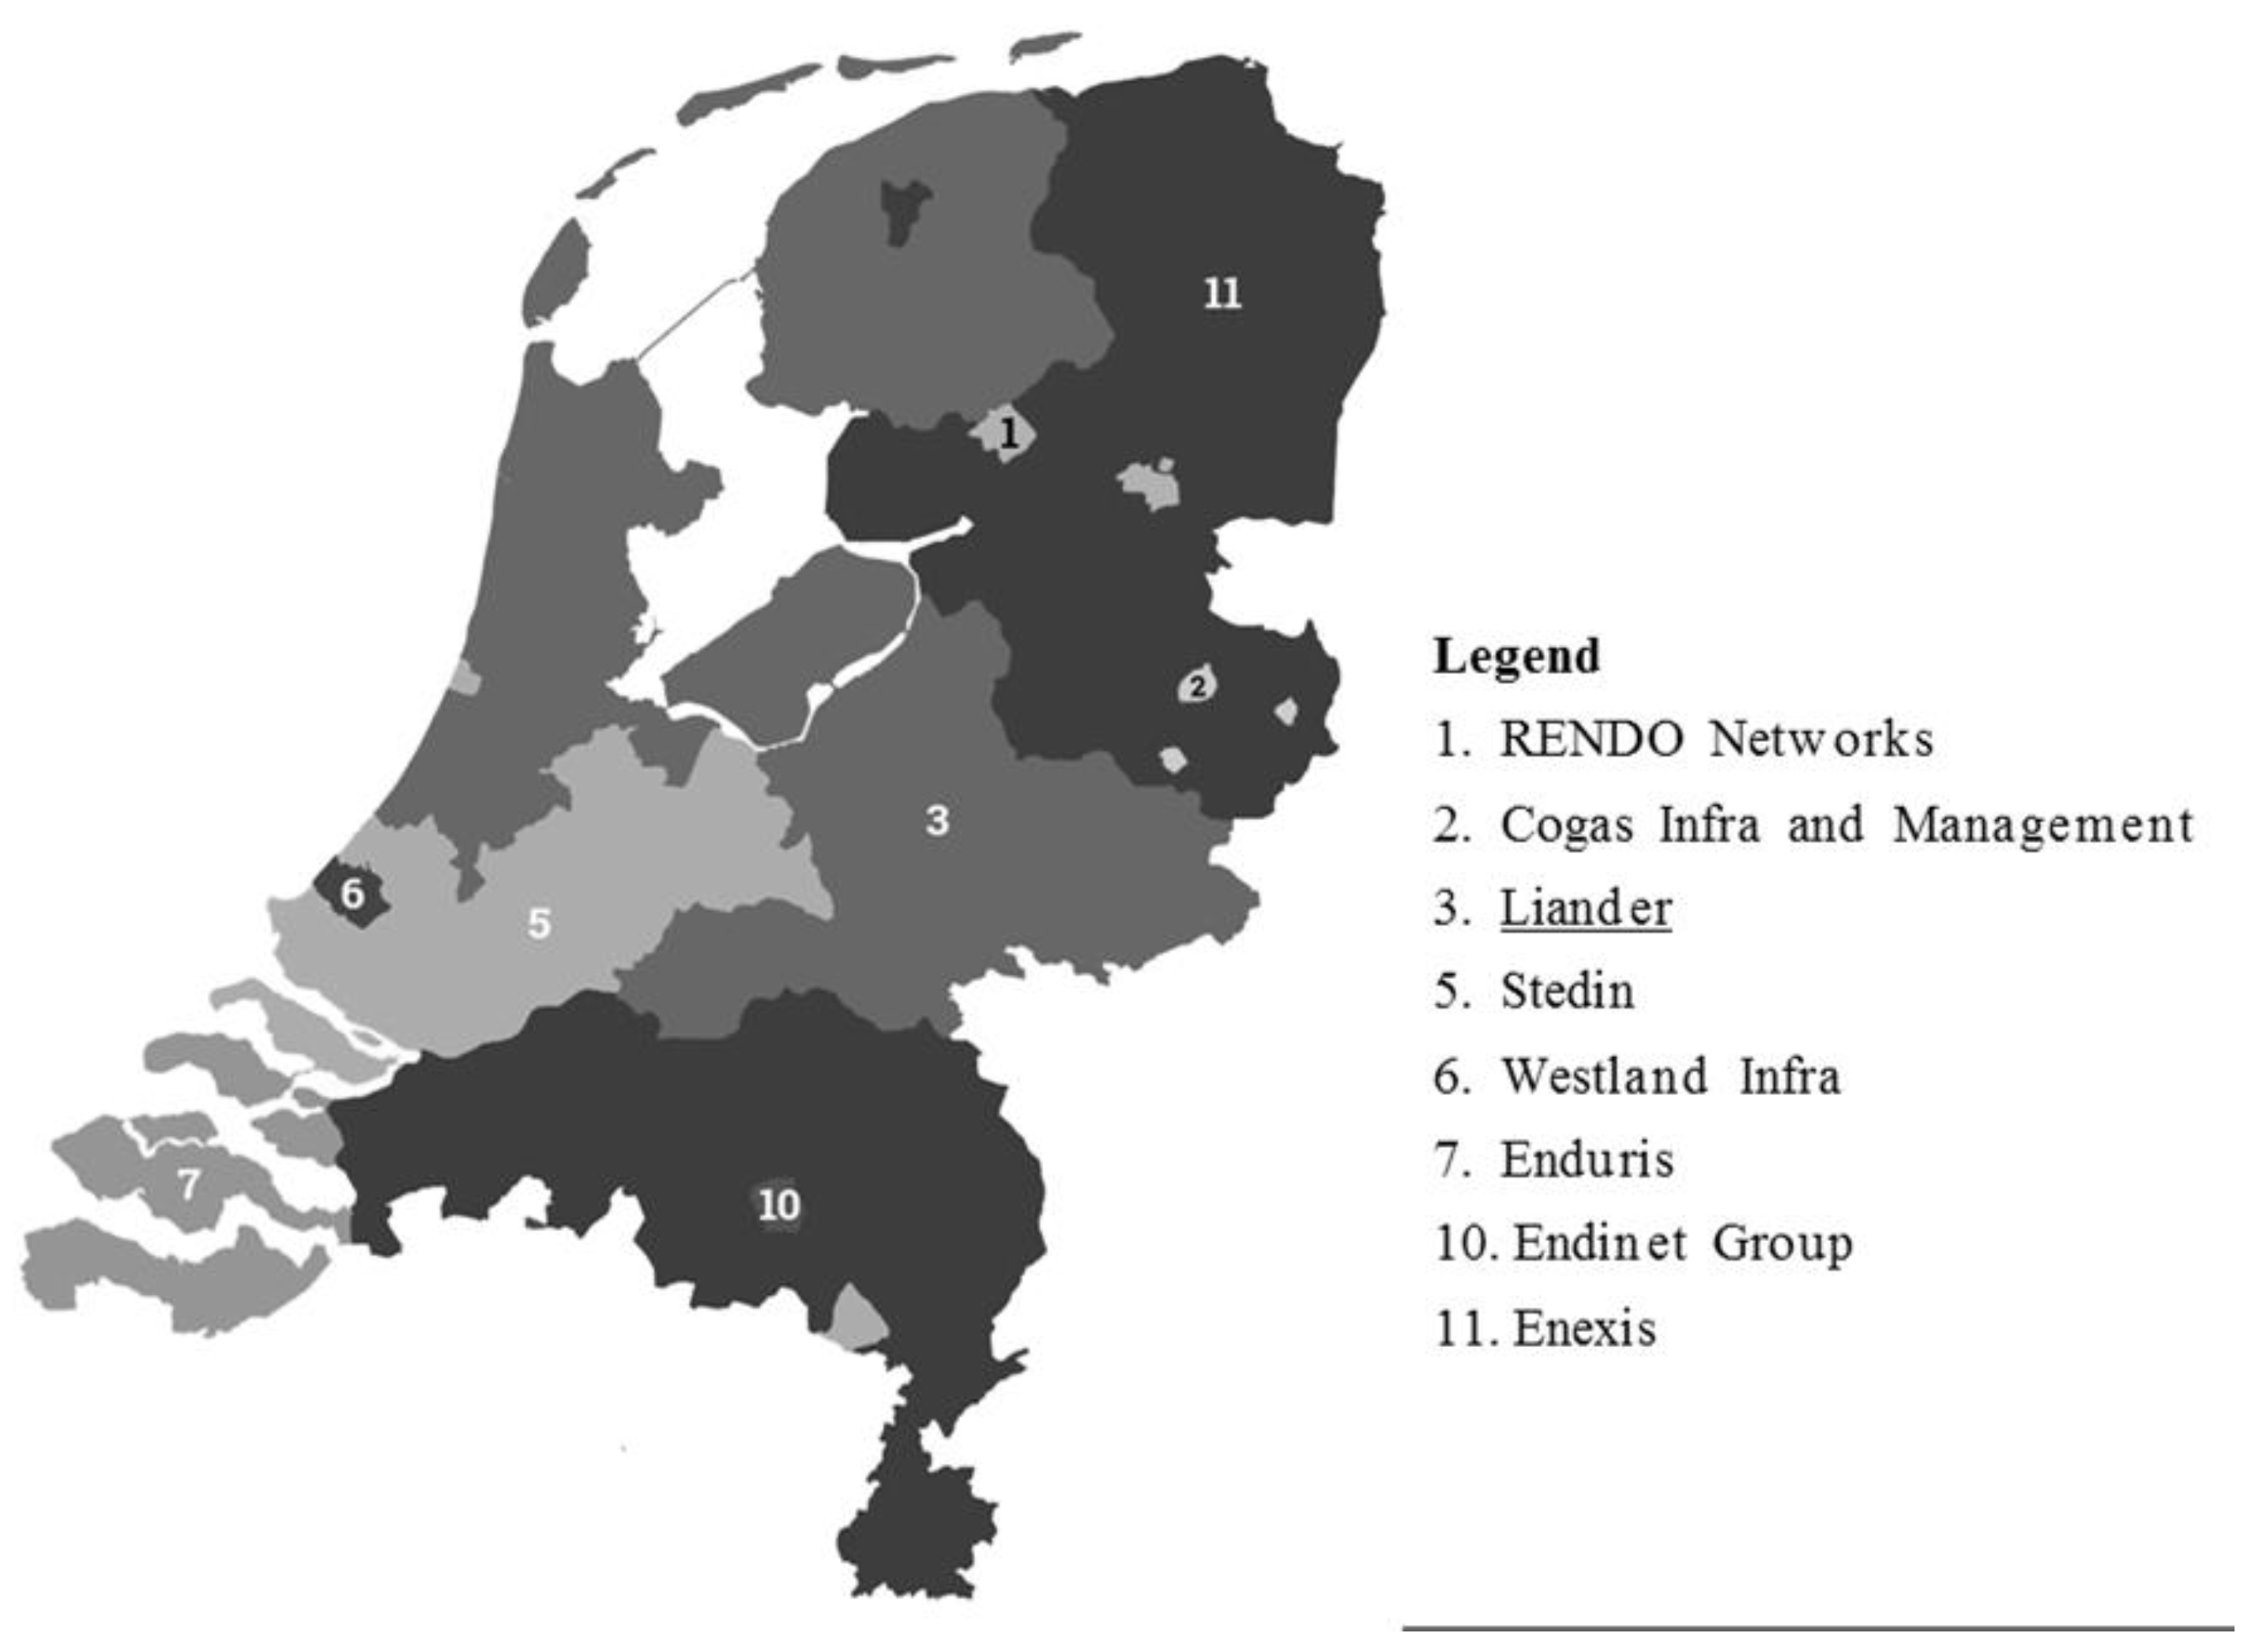
36], this discussion is not within the scope of this article. Currently, the national high voltage grid is administered by TenneT, a government-owned company. The regional low to medium voltage networks are managed by eight privatized distribution network companies, of which Liander is one of the largest network administrators.
2.3. Liander Data and Services
Liander is the largest Dutch energy network administrator covering five out of 12 provinces in the Netherlands, transporting electricity and natural gas to 5.2 million connections (households and businesses). The coverage of Liander’s network is about 37% of the Netherlands (see
Figure 1). Although Liander is a private company in the legal sense of the way, it has a regulated public task to administer and maintain energy networks, which significantly influences the way Liander is doing business. According to the Energy Act 1998, network administrators have an obligation to share and exchange their data between network administrators and TenneT. However, there is no legal requirement to disseminate energy data to the general public, other than general information related to, e.g., tariffs.
Within Liander, core data chains are established to streamline work processes. Within a core data chain, only the departments concerned have access to the specific datasets; departments outside the chain have no access to the data.
Liander has a legal obligation to supply large-scale (businesses) and small-scale (households) energy consumption and generation data to some government agencies, such as Statistics Netherlands (CBS). CBS receives monthly and quarterly reports on large-scale and small-scale energy consumption and generation. These reports are based on raw data (connection level), i.e., they contain addresses. CBS receives the data under strict conditions that the raw data must not be made available as open data.
Liander supplies companies (most often engineering firms) with customized data (at the connection level) under contract conditions and for a fee. The contract terms prohibit further distribution of the data. Liander also supplies energy consumption and generation data to local governments (municipalities and provinces) and building corporations. Local governments can obtain data in two ways: either by lodging a request directly to Liander or by using EnergieInBeeld.nl (Energy in Focus), a web service developed by Liander in cooperation with the other energy network administrators, Local governments can visualize and download aggregated data via EnergieInBeeld.nl free of charge. If the raw data at the connection level are required, local governments can send an automated request via EnergieInBeeld.nl to Liander; as such data contain personal data.
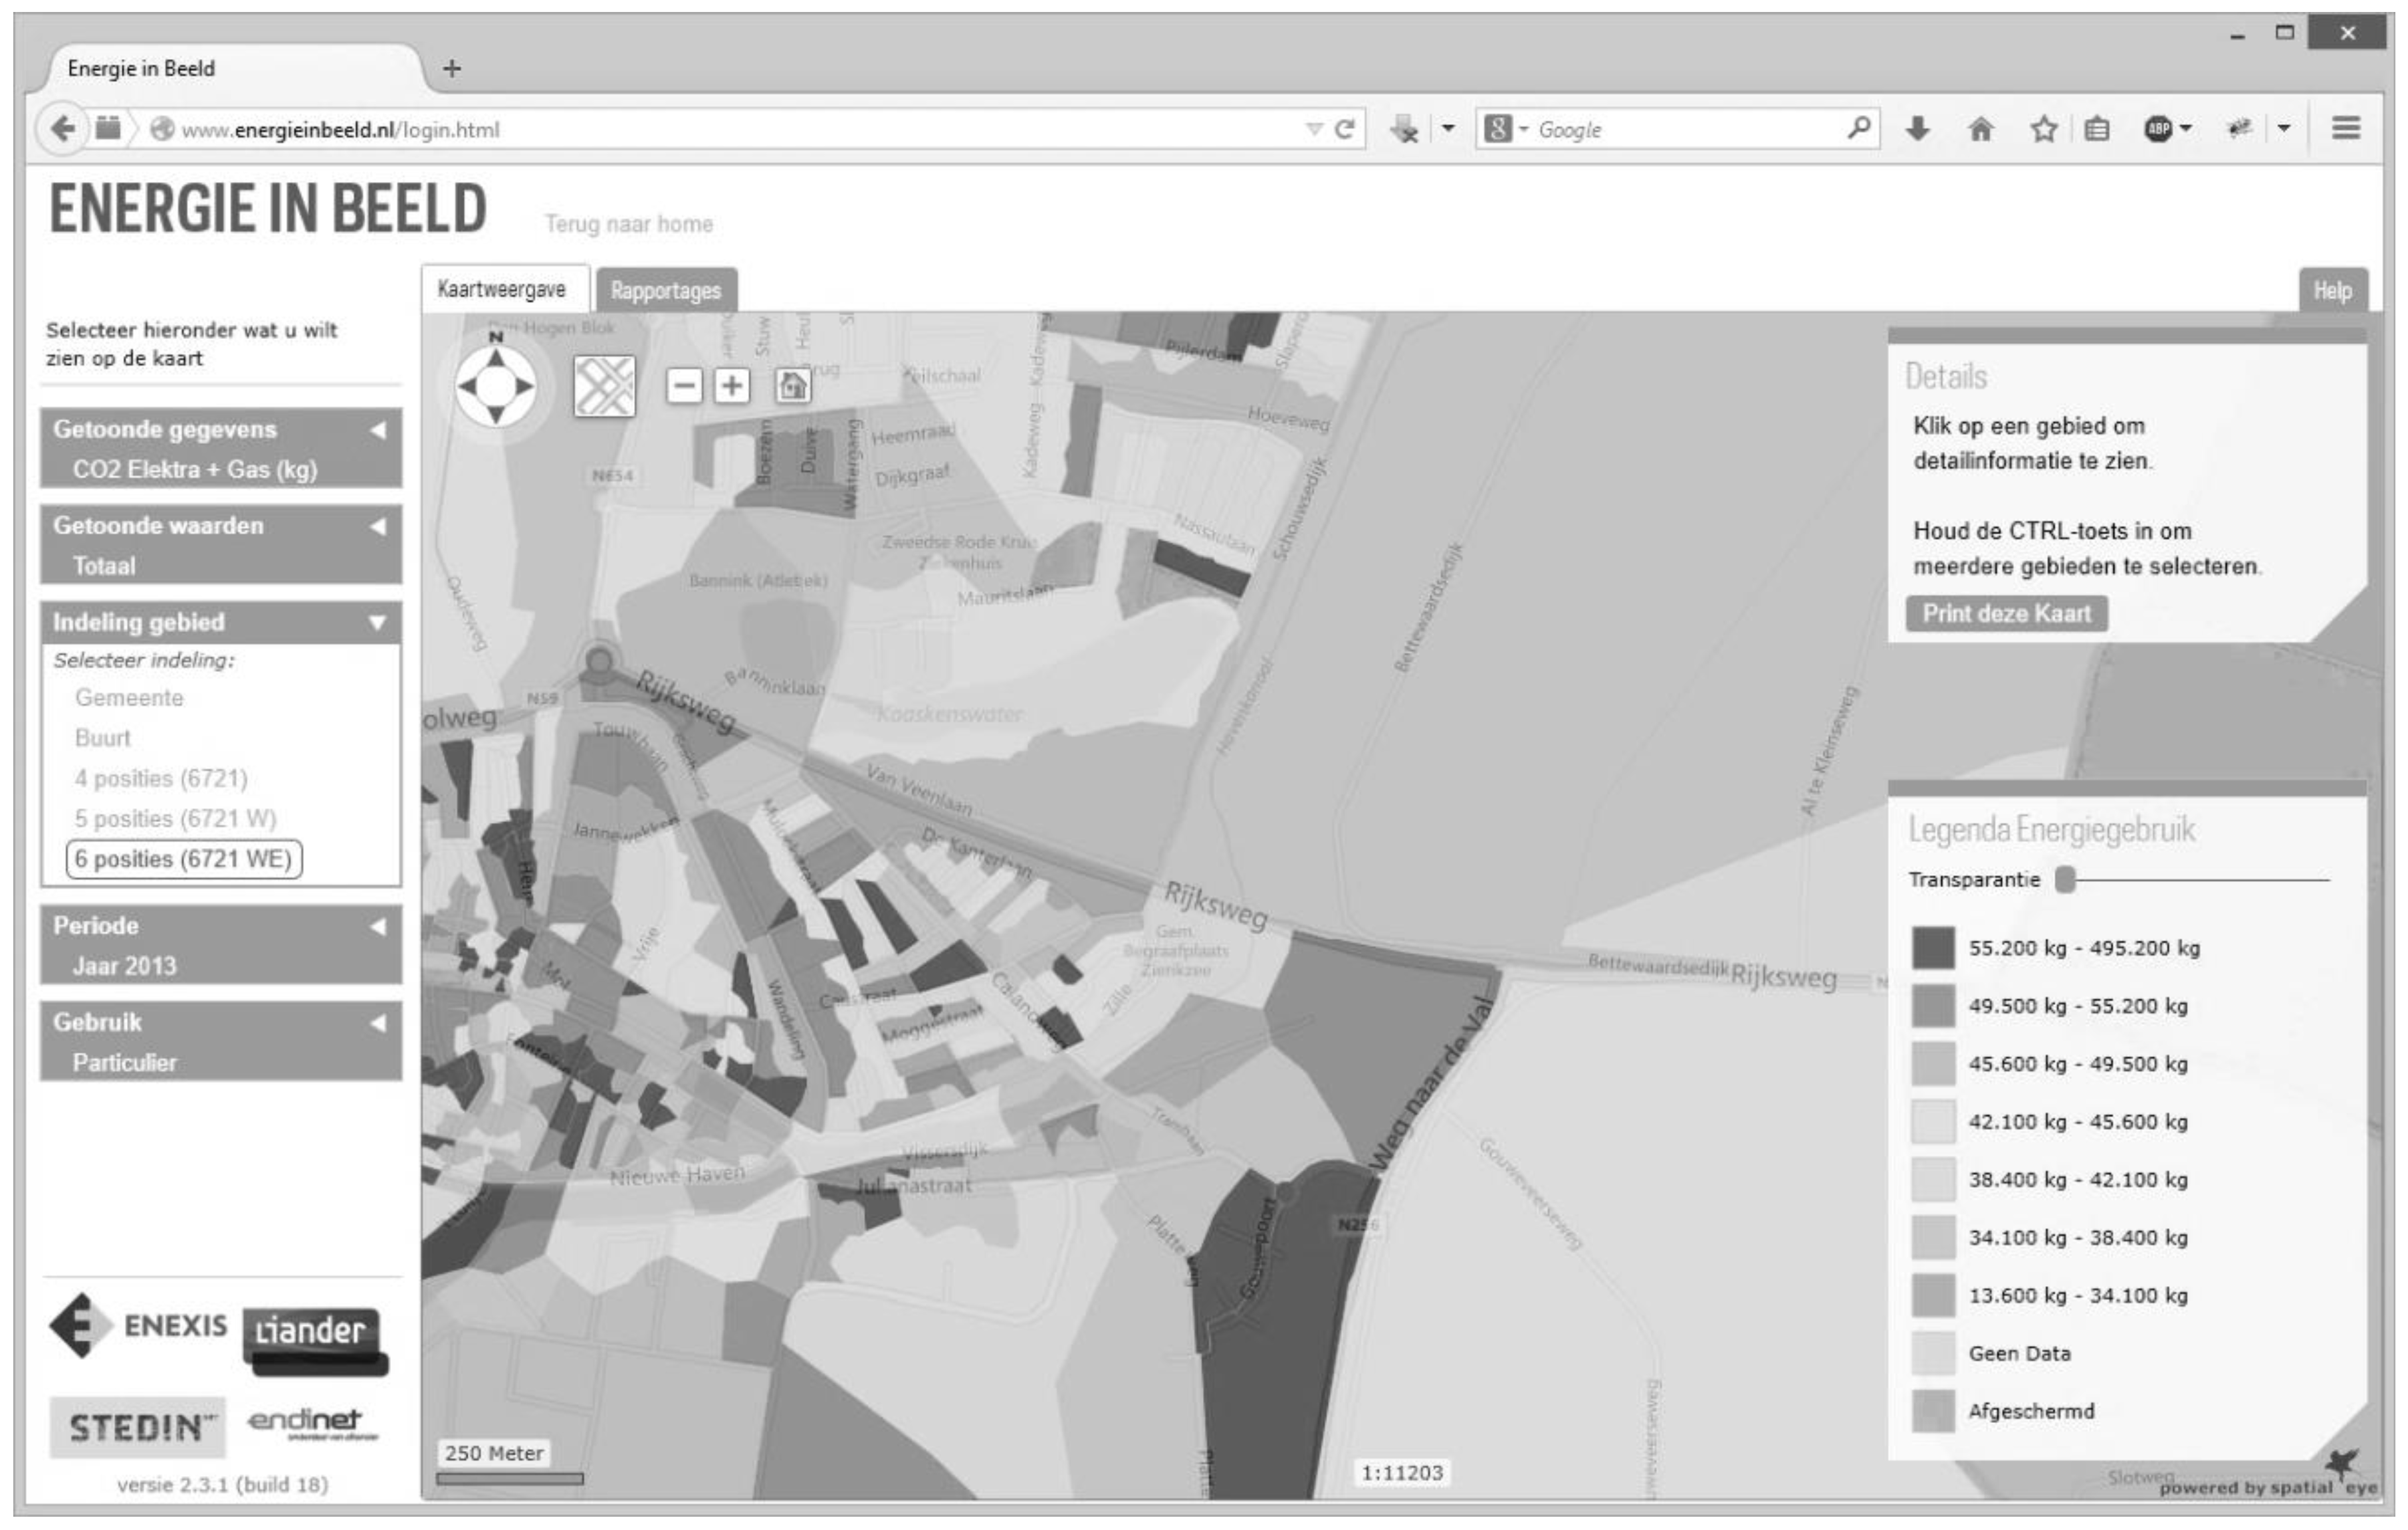
Until December 2013, the subscription fee for EnergieInBeeld.nl was around €6000 per annum for local governments. Since 2014, EnergieInBeeld.nl can be used free of charge, although local governments must still register in advance to receive login details required to download data. Since October 2015, everybody can use EnergieInBeeld.nl with a public login code. To ensure the free downloadable data do not contain personal data (data at the connection level), the aggregation level for the general public is set to a five-digit postcode, and for local governments to a six-digit postcode; see
Figure 2. A standard Dutch postcodes consists of four numbers and two letters and covers about 10–20 households. To publish data at a more aggregated level, postcodes may be limited to the first five-digits (about 1–2 blocks) or to the first four-digits (about a neighbourhood).
2.4. Open Data and Beyond Projects
As part of the Next Generation Infrastructures Program in the Netherlands, a consortium consisting of Liander, Delft University of Technology, and Wageningen University carried out a number of projects. Liander intended to release a number of datasets as open data. The first project “Open Data and Beyond I” was carried out in 2012 and focused on legal, technical, and organizational preconditions for implementing open data.
The “Open Data and Beyond II” project (July 2012 until March 2015) was established to develop a framework to monitor the effects of open data. Before opening (aggregated) small-scale energy consumption data and other datasets at a later date as open data, Liander wanted to assess the impact of open data on the organization ex ante.
The assumption is that by implementing open data transaction costs will be reduced, as there are no more transaction costs incurred during contract negotiations and policing license conditions. However, implementing open data will incur implementation costs, such as extra server capacity and human resources.
Most of the expected effects of releasing data as open data will only be visible in the long term. To be able to measure the effects, a benchmark measurement was carried out before releasing the dataset as open data.
3. Monitoring Framework to Measure Impact of Open Data
3.1. Theoretic Framework
Monitoring the effects of a policy change can be carried out several ways. One such way for monitoring is using performance indicators. For performance indicators to provide precise and accurate performance information, they should be designed and implemented within a performance management system [
38]. Developing a framework for such a monitor framework consists of seven steps.
- (1)
Develop a performance framework to describe what the program is about, description of the organization’s mission and strategic goals;
- (2)
Identify the most important elements, or key performance areas which are most critical to understanding and assessing your program’s success;
- (3)
Select the most appropriate performance measures;
- (4)
Determine the “gaps between what information you need and what is available;
- (5)
Develop and implement a measurement strategy to address the gaps;
- (6)
Develop a performance report which highlights what you have accomplished and what you have learned;
- (7)
Learn from your experiences and refine your approach as required.
These steps are iterative.
3.2. Indicators
Monitoring is usually carried out using indicators. Performance indicators will provide a view of the impact of an activity, and should be [
38]:
Specific: clearly defined and easily understood;
Measurable: quantifiable to facilitate comparison
Attainable/feasible: practical and cost-effective to implement;
Relevant: true representation;
Timely and free of bias;
Verifiable and statistically valid;
Unambiguous: a change in an indicator should result in clear and unambiguous interpretation;
Comparable and time-bound.
In addition, an indicator should be communicable. For this project, we selected five core requirements: specific, measurable, practical, relevant, free of bias, and communicable.
It is important to distinguish between output, outcome, and impact.
Output concerns the products and services provided. Ultimately, the outcome of a program should relate to the mission and the mandate of the program provider [
39].
Outcome is the result of an activity.
Impact relates to the way the outcomes contribute to the (strategic) goals of an organization or effects in society.
Table 1 shows an example of the relation between activity, output, outcome, and impact for Liander.
3.3. Potential Effects of Open Data
Implementation of open data incurs costs for the data supplier, such as extra server capacity to facilitate higher download traffic and to host open data on a separate server. In addition, the data has to be made suitable for release as open data. For instance, the data must be aggregated from the household level to the postcode area level to comply with requirements for protection of personal data. Investments must also be made to optimize open data usage, such as setting up systems to make use of user feedback, a help-desk, user-friendly interfaces, etc. These costs are counted as internal data supply effects. Most of the costs are incurred in the start-up phase. Once preparing open data for publication has become part of the workflow processes, the additional transaction costs of the data supplier are expected to go down. The expectations are that once data are released as open data, the transaction costs for internal users within Liander but outside the core data chains will go down. The monitor will measure internal user transaction costs to test these expectations.
Costs are only one aspect of monitoring the effects of open data. The expectation is that data policy change will also cause effects that are intangible. Examples of such effects are more effective decision-making related to energy saving measures, development of innovative applications, and more transparency, thus increasing the public image of Liander. These effects are hard to monetize, however, they are a real part of open data effects. In addition, implementation of open data will require a change in the organization’s culture, as not only work processes have to be amended, which require costs and efforts to maintain data suitable for publication. There may also be a reluctance to open data for fear of inadequate interpretation of data [
40], embarrassment over content or quality, and worries about privacy and liability [
28].
3.4. Transaction Costs
One way to measure the impact of a policy change, is to compare transaction costs before the policy change with transaction costs after the policy change. Transaction costs theory deals with the cost of transacting. Every exchange of the product entails costs that result from both parties attempting to determine the valued characteristics of the good [
41]. It takes resources to measure these characteristics and additional resources to define and to measure the rights that are transferred to the user with the exchange of the goods. The costs associated with these efforts are considered part of the transaction costs [
41,
42,
43,
44].
According to [
45], information trade is a transaction which involves data and service providers, on one hand, and data users, on the other hand. In the process of exchanging data, the potential users and providers have to agree on the characteristics of the data, and on the conditions of exchange. In this process of communication, costs occur on both sides. A user (both internal and external) will typically undertake the following activities that incur transaction costs:
Activity 1: searching for the data supplier;
Activity 2: inquiring about the general conditions of exchange;
Activity 3: inquiring about specific conditions related to price and availability;
Activity 4: defining the exact characteristics of the data;
Activity 5: acquiring and testing (a sample of) the product for fitness of use;
Activity 6: reading and understanding the documentation related to the license and fees;
Activity 7: obtaining the actual dataset;
Activity 8: uploading the data into the software, harmonizing, adapting the format.
The data supplier incurs transaction costs related to making data and metadata available; setting up a portal and a contact point/help desk; negotiating, drafting, and exchanging contracts; and collecting fees and enforcing conditions [
46].
3.5. Effects of Releasing Data
According to its formulated mission, Liander wants “to strive for proving a service that gives everybody access on equal conditions to reliable, affordable and sustainable energy” [
47]. Although this is a lofty and abstract mission, we translated this ambition into the following strategic goals:
- (1)
Continuously optimize performance on services, security of supply, and costs;
- (2)
Improve management of energy flows and insight into energy consumption;
- (3)
Help customers save energy and switch over to renewable energy sources.
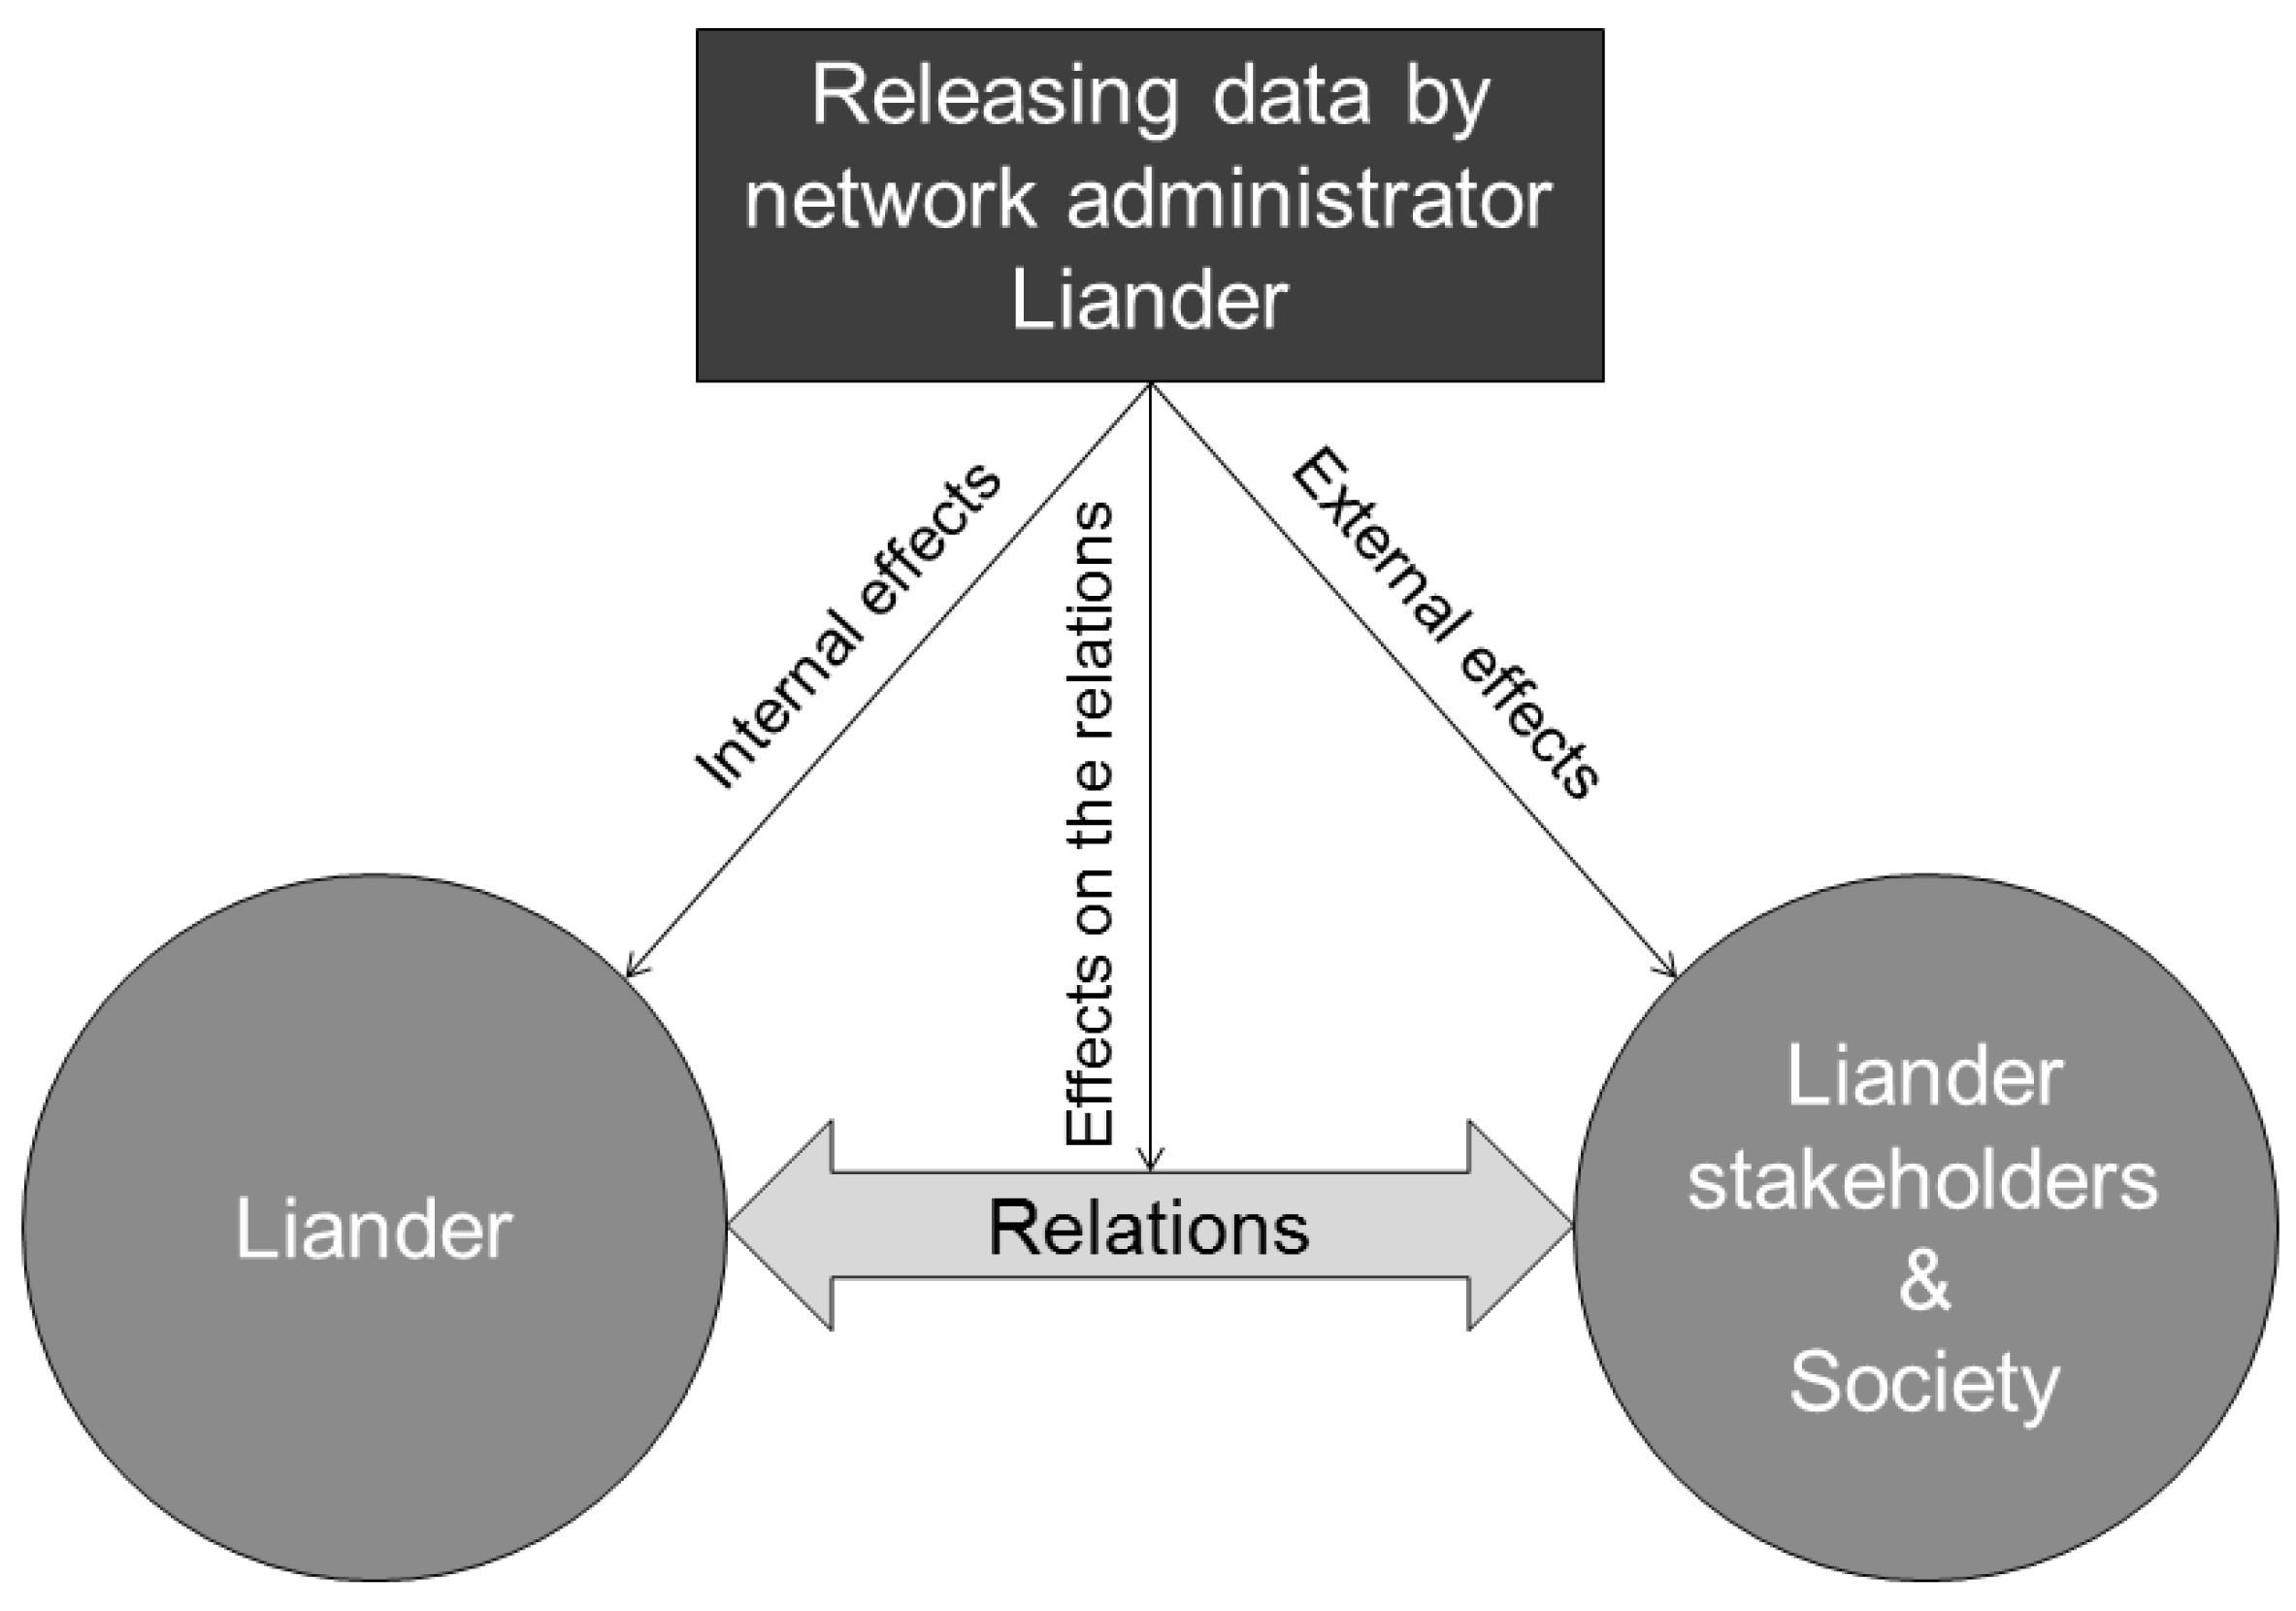
We expect to distinguish three different effects related to the release of open data.
Figure 3 shows the relation between the different effects.
In order to be able to measure and monitor the effects of open data, an indicator framework was developed. The proposed indicator framework was fine-tuned by Liander stakeholders during a workshop on 20 September 2012. In addition, Liander actively participated in brainstorm sessions and by making the dataset available as a pilot during hackathons. Feedback received from these events contributed to assessing what the user needs were and how best to present the data.
After the Open Data and Beyond pilot project, it was decided that—according to the open data principles—Liander would not require prior registration of re-users. This means that it will not be possible to track re-users that download the data. Instead, the developed framework focuses on measuring, inter alia, transaction costs, both for the supply of open data and for the users. We have distinguished between different types of costs. To ensure that transaction costs will be comparable between organizations and between years, we have expressed transaction costs in full-time equivalents (FTE) or man-hours (MH). For this research, the following effects were measured:
- (1)
The external effects of open data for Liander by measuring:
usage of Liander open data in society (numbers and types of users);
nature and intensity of use per type of user;
effects on transaction costs/hours of external user.
- (2)
The internal effects of open data for Liander by measuring:
effects on supply transaction costs/hours within Liander (preparation and operational use of data);
effects on data quality;
effects on customer service of Liander;
usage of Liander open data internally (numbers and types of users);
nature and intensity of use per type of user;
saved transaction costs/hours by internal users.
- (3)
The relational effects of open data for Liander and society by measuring:
effects on communication from society to Liander;
effects on communication from Liander to society;
effects on the image of Liander as a transparent energy network administrator.
Table 2 presents the monitor framework consisting of 10 indicators. We applied the framework to the small-scale energy consumption dataset, which was released as open data in September 2013. The indicator framework monitors the outcomes once a year to assess the impacts. To provide a basis for comparison a baseline measurement to set a benchmark was carried out prior to releasing the dataset as open data in September 2013. The text in italics denotes the results of the follow-up assessment carried out in December 2014. The benchmark and the follow-up were carried out by the authors and by Liander. The transaction costs measured are expressed in man-hours (MH) and full-time equivalent (FTE) for human resources.
4. Benchmark Outcomes and Analysis
In 2012 and 2013, Liander participated in several open data hackathons (province of Flevoland, city of Amsterdam), whereby area samples of small-scale energy consumption data were made available as open data to the hackathon participants. In September 2013, Liander published the complete small-scale energy consumption dataset as open data, including historical data, and in several formats. Since then, Liander has released other datasets, such as energy failure data, as open data.
Prior to the release of open data, a benchmark was carried out using the monitor framework. In September 2014, the monitor was repeated. The repeat monitor only showed some short-term effects, which are analyzed below.
4.1. External Effects
Prior to releasing the dataset, external users consisted mainly of municipalities, building corporations, Statistics Netherlands (CBS), engineering firms, and a few organizations producing value added services for public sector bodies. CBS collects small-scale and large-scale energy consumption and generation data as part of their legal mandate. Open data did not have an effect on the transaction costs of CBS, as the data required are on household level and, therefore, not available as open data.
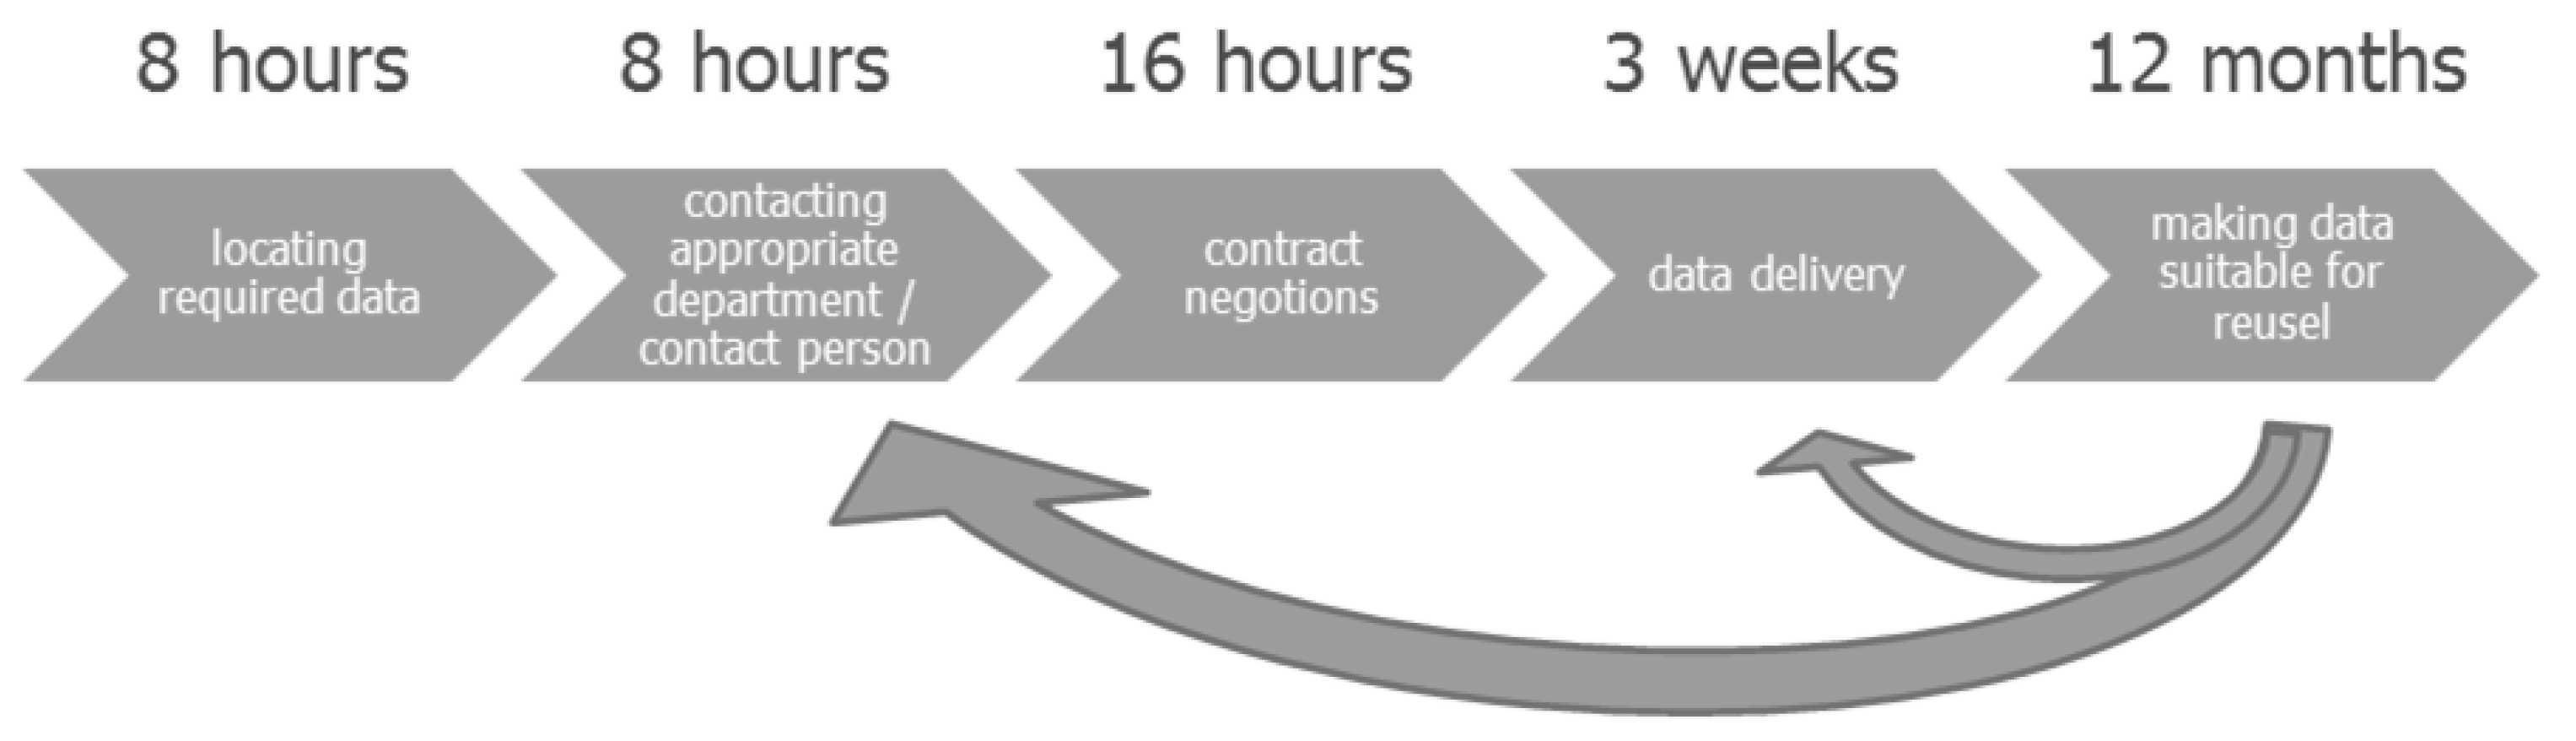
Municipalities and building corporations can now access small-scale energy consumption and generation aggregated data either via Liander’s open data portal or via existing web services, and large-scale data via channels in place prior to open data. Prior to open data in 2013, to obtain energy consumption and generation data on connection level, the average transaction costs for a municipality were about 32 man-hours to locate required data, contact the data holder, and to negotiate and exchange contracts, see
Figure 4. Municipalities could also opt to pay a subscription fee for EnergieInBeeld.nl to obtain aggregated data. It is expected that more municipalities will use open datasets in addition to EnergieInBeeld.nl. Building Corporations require data at the connection level and, therefore, it is not expected that their transaction costs will decrease due to open data.
One year after opening small-scale energy consumption and generation data, the transaction costs for external users have decreased somewhat. However, this is probably due to Liander streamlining its data processes and the removal of the annual fee for EnergieInBeeld.nl rather than to open data as such.
Prior to open data there were no regular re-users of the datasets apart from municipalities and building corporations. Within weeks of release, one company has re-used the data for energy usage apps and web services. Although the Liander open data portal contains a page showing samples of open data applications [
48], to date, only a few commercial companies have linked their products to this webpage. As Liander supplies datasets via the open data portal without prior registration, it is difficult to measure if and for what the datasets are used, a common problem with monitoring open data (cf.) [
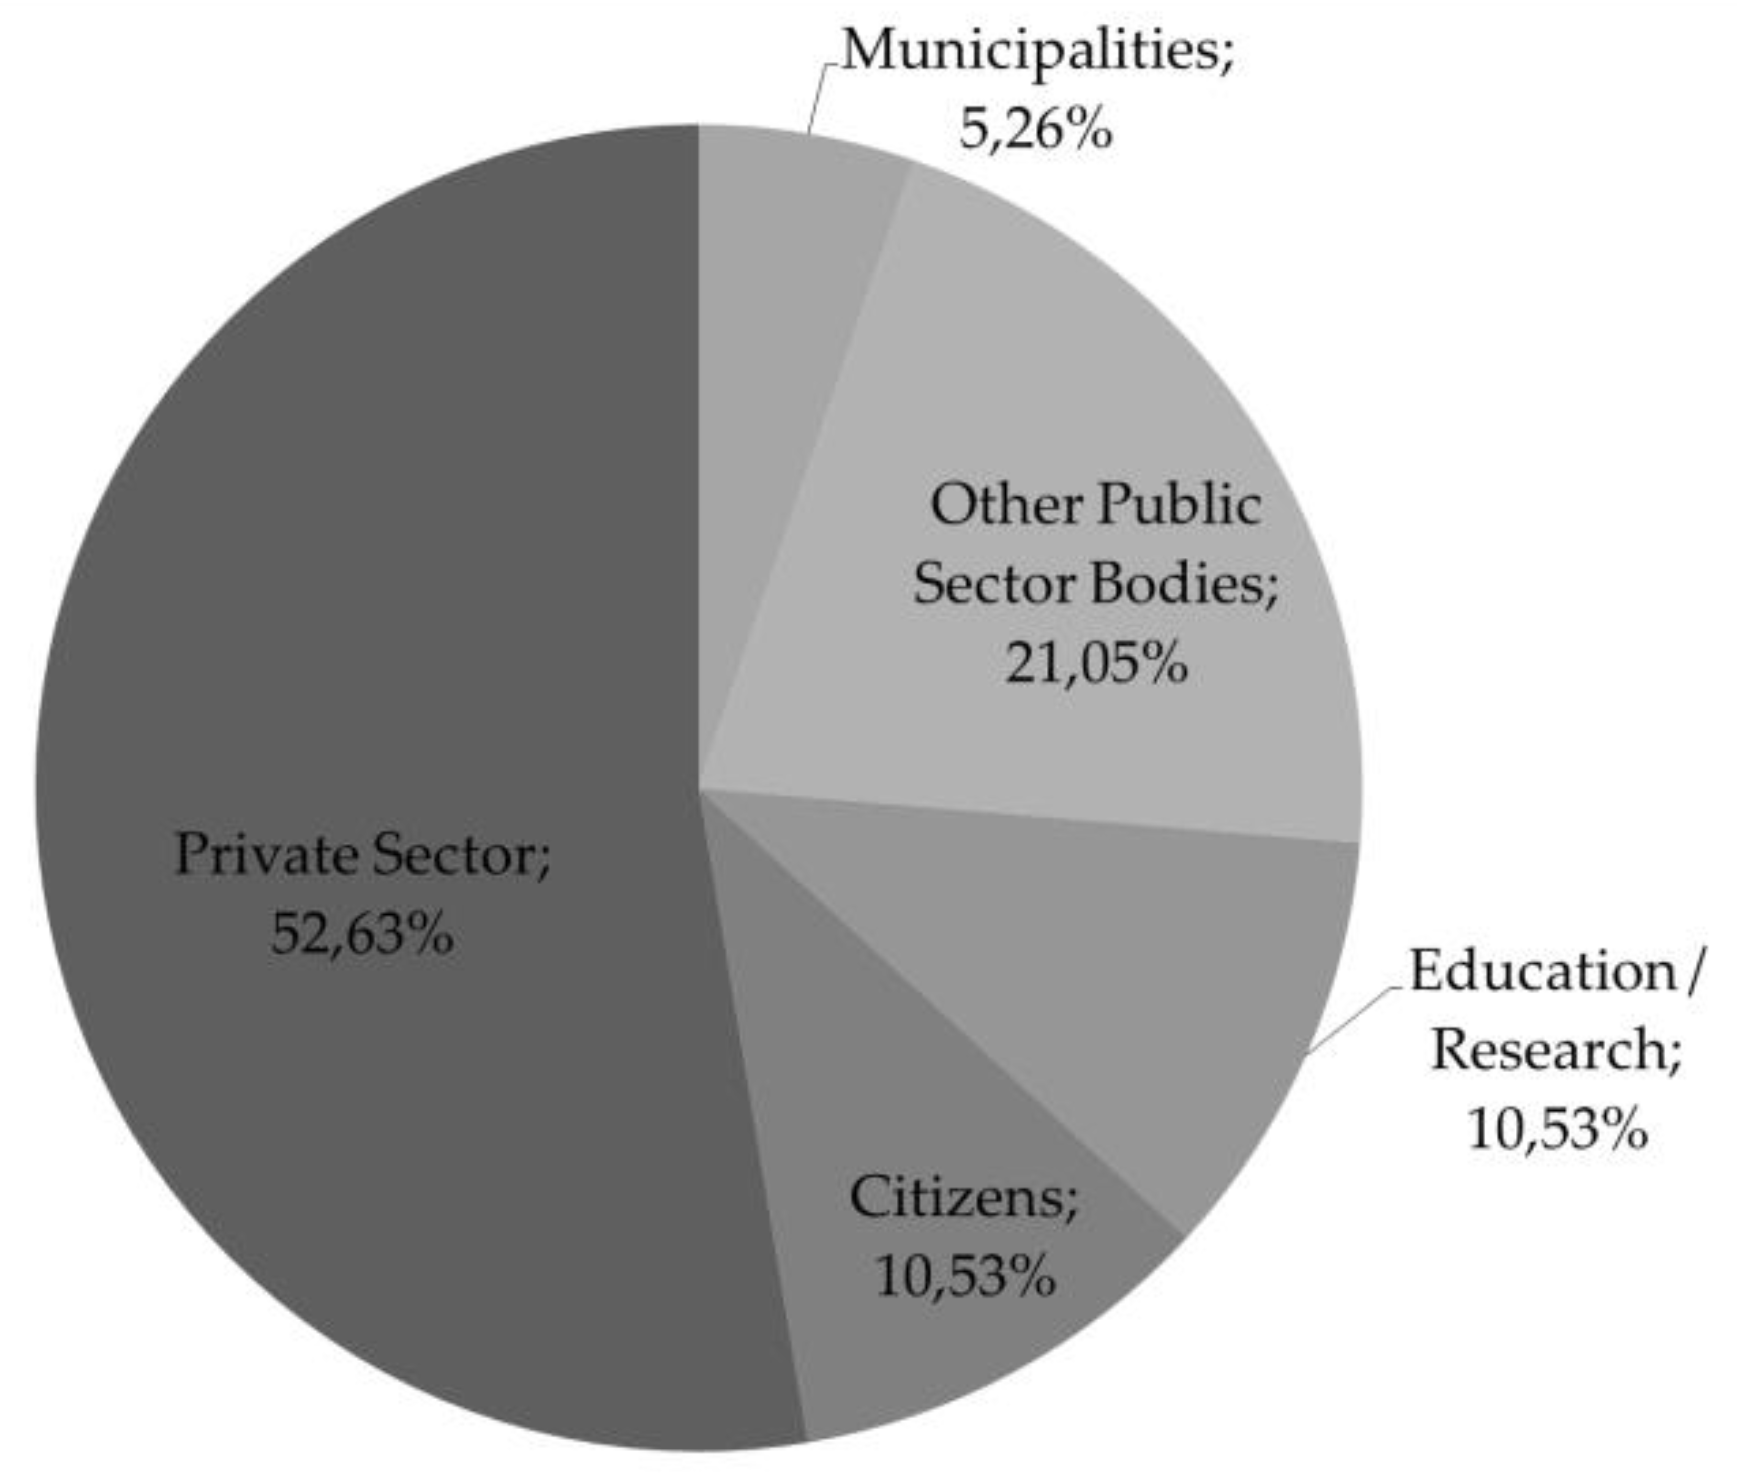
49]. During an Apps4Energy hackathon in 2015, (potential) re-users of Liander open data were surveyed as part of the follow-up.
Figure 5 shows the types of surveyed users as a percentage.
From the follow-up, it emerged that Liander open data are mainly used by external organizations for energy planning and policy advice. It appears that Liander data are used to improve the quality of existing applications, such as Energy Atlases, rather than for new applications. In general, Liander open data users appreciate the availability and quality of the open data, however, they would prefer the data to be timelier (near real-time). In addition, the users would like large-scale energy consumption open data to be available as well. However, the release of this dataset is not foreseeable in the near future as there are barriers related to data protection.
4.2. Internal Effects
For the benchmark, the transaction costs both for data supply and for internal users of Liander outside the core data chain were set to zero, in order to be able to show the effects in the future. Re-use of the datasets within the core data chain and outside the core data chain ran via existing procedures. Within the core data chain, the transaction costs are zero because users have a SAP authorization to access the data. Users without SAP-authorization must send a request to the Service Point. As the IT department does not distinguish between different types of requests and different datasets, these transaction costs are set to zero as well. The costs of releasing open data are primarily personnel costs related to the research projects. An extra server was purchased to host the dataset to prevent hackers from entering the main server. Liander opted to develop their own data platform rather than re-use an existing platform to maintain control, thus alleviating some of the concerns of the IT department.
In the short term, the main effect of releasing one open dataset was a significant increase in the number of page views and time spent online. However, it could not be assessed how many of these page views/downloads were due to internal or to external users. Since 2014, the number of visits has more or less stabilized with peaks during energy hackathons.
Another effect is that releasing one dataset has paved the way for releasing more datasets. The technical and operational lessons learned from the pilot phase have been taken onboard in the processes for releasing more open datasets. There have been no discernible internal effects on the transaction costs of data supply. Liander is streamlining its data supply services by having added a Datashare Service, in which data requests (both for open and for closed data) be automated. Open data has become embedded in Liander’s primary processes and the Open Data team has been disbanded without consequences for the sustained availability of open data.
4.3. Relational Effects
The benchmark measured the relation effects prior to the release of open data. Liander makes only limited use of social media. Communication to society is mainly related to innovations, end usage, and sustainable energy generation, and is limited to Facebook. Energy failure inquiries and reports are mainly communicated via Twitter. There was no communication related to small-scale energy consumption prior to the release of open data.
Since the release of the dataset as open data in September 2013, Liander has communicated via social media and via the Dutch LinkedIn Open Data group. Initially, the reactions were positive until it emerged that the dataset did not comply to the open data criterion of being available without a license, or with an “open” license, such as a Creative Commons BY (For more information on Creative Commons licences, see
https://creativecommons.org/licenses/) license, requiring only source attribution. Instead, the dataset was released with a license prohibiting derived products to be used for commercial purposes, or to alter the dataset. After a small storm of protests, the license was changed to a Creative Commons BY license early October. In spite of the somewhat heated discussion, Liander received 17 Likes out of 21 reactions.
After the release of open data, Liander has become better known in the open data community and has become an active participant in various Smart City projects.
4.4. Benchmark Outcomes Summary
Table 2 shows a summary of the selected indicators and outcomes. Not all indicators will be measurable in the follow-up, as once open data is published, it is almost impossible to track the actual numbers and types of external users. Even if registration prior to downloading would be employed, users can still set up shadow datasets. It is expected that the number of internal users will remain stable. It is also expected that, once established, the operational costs of open data will be negligible.
The repeat monitor in December 2014 showed that providing open data has had significant relational effects. The open data tools and interfaces initially provided by Liander were not viewed as very user-friendly. Liander used the feedback to make improvements to its open data platform. In addition, Liander has made the EnergieInBeeld.nl web service more user-friendly in close cooperation with the City of Amsterdam and private sector organizations, and made the service available to the general public. As Liander has become part of the Dutch open data community, they are a sought-after party to participate in various Smart City projects and other energy projects. Liander has become an open data champion paving the way for other energy administrators in the Netherlands.
5. Conclusions and Recommendations
To develop both quantitative and qualitative indicators to assess the success of a policy change is a challenge for open data initiatives. In the orientation phase of this research project, indicators were proposed but not tested. Releasing multiple datasets as open data permanently by Liander offers an excellent opportunity to fine-tune the proposed framework, apply it, and provide insight into the effects. As the dataset had not yet been released as open data, we were able to carry out a baseline measurement.
Most of the effects of releasing data as open data will only be noticeable in the long term. Similar research in the Netherlands assessing the effects of releasing the large-scale topographic dataset [
10,
49,
50] and in the United Kingdom assessing the value of Ordnance Survey datasets to the economy [
51] show that the short-term effects are mainly more downloads and page views, and more communication between data suppliers and users, and between users. Liander has experienced similar short-term-effects. Within a couple of weeks after the open data was launched, the first app based on Liander data was launched.
The expected long-term effects were initially that more apps and web services would be developed, new user groups would be accessed, transaction costs would lower for existing customers and for the organization, and hopefully fewer questions about Liander’s activities (e.g., about energy failures). To date, only lower transaction costs have been realized. From the follow-up, it emerged that Liander open data are used by a wide range of users and have had a positive effect on energy consumption visualization applications. However, it remains a challenge to quantify such effects. It also remains a challenge to monitor re-users, as there is no registration.
The open data expectations of external users vary. Although the original small-scale energy consumption dataset is the most widely used open dataset of Liander, it has also created a demand for other datasets, such as large-scale energy consumption data and small-scale energy generation data (windmills, solar panels). The latter data were indeed added to the small-scale energy consumption data. More municipalities download the open datasets to supplement EnergieInBeeld.nl data. Both the private sector and the municipalities use Liander open data to improve existing applications and work processes rather than to create new products.
Liander has successfully demonstrated that private energy companies can release open data, and has successfully championed the other Dutch network administrators to follow suit. In 2015, the other network administrators in the Netherlands have also published their small-scale energy consumption data and Enexis, the second largest Dutch network administrator, has also published asset data as open data.
The monitoring framework developed in this project monitors the societal effects. Liander assessed the project to be very helpful and a key component in the process towards the successful implementation of the open data strategy at Liander. So far, the developed framework appears to be suitable to measure the open data effects.
Acknowledgments
We would like to thank the Next Generation Infrastructures Programme for making this research possible. In addition, we would like to thank Liander for their participation in this project.
Author Contributions
As part of the Open Data and Beyond Consortium, Bastiaan van Loenen carried out a substantial part of the work for the Open Data and Beyond project to establish the legal, technical and organizational preconditions for implementing open data. Arnold Bregt provided an input for establishment of the open data organizational preconditions. The established preconditions were used as main criteria for the Open Data and Beyond II project. Frederika Welle Donker, Bastiaan van Loenen and Arnold Bregt, jointly developed the assessment framework based on a conceptual model developed by Arnold Bregt. Frederika Welle Donker carried out the benchmark and analyzed the results. Frederika Welle Donker and Arnold Bregt carried out the follow-up and all three authors jointly analyzed the results. Frederika Welle Donker as lead author and Bastiaan van Loenen as second author wrote this paper. Arnold Bregt made useful suggestions to the final version of the paper.
Conflicts of Interest
The authors declare no conflict of interest.
References
- Obama, B. Transparency and Open Government: Memorandum for the Heads of Executive Departments and Agencies; The White House: Washington, WC, USA, 2009. [Google Scholar]
- European Commission. Communication from the Commission of 19 May 2010 to the European Parliament, the Council, the European Economic and Social Committee and the Committee of the Regions—A Digital Agenda for Europe; European Commission: Brussels, Belgium, 2010. [Google Scholar]
- Open Government Partnership. Open Government Declaration. Available online: http://www.opengovpartnership.org/about/open-government-declaration (accessed on 29 March 2016).
- G8 Open Data Charter and Technical Annex. Available online: https://www.gov.uk/government/publications/open-data-charter/g8-open-data-charter-and-technical-annex (accessed on 15 September 2015).
- Huijboom, N.; van den Broek, T. Open data: An international comparison of strategies. Eur. J. ePract. 2011, 12, 1–13. [Google Scholar]
- Granickas, K. Open Data as a Tool to Fight Corruption; ePSI Platform Topic Report No. 2014/04; ePSI Platform: Amsterdam, The Netherlands, 2014; p. 20. [Google Scholar]
- David-Barrett, E.; Heywood, P.M.; Theodorakis, N. TACOD: Towards a European Strategy to Reduce Corruption by Enhancing the Use of Open Data; Research Centre on Security and Crime (RiSSC): Turin, Italy, 2015; p. 102. [Google Scholar]
- Grimmelikhuijsen, S.G. Transparency and Trust: An Experimental Study of Online Disclosure and Trust in Government. Ph.D. Thesis, Utrecht University, Utrecht, The Netherlands, 2012. [Google Scholar]
- Jetzek, T. The value of open government data. Geoforum Perspect. 2013, 12, 47–56. [Google Scholar]
- Bregt, A.K.; Castelein, W.T.; Grus, L.; Eertink, D. De Effecten van een Open Basisregistratie Topografie (BRT); Wageningen University: Wageningen, The Netherlands, 2013; p. 40. [Google Scholar]
- Vickery, G. Review of Recent Studies on Psi Re-use and Related Market Developments; Information Economics: Paris, France, 2011; p. 44. [Google Scholar]
- Omidyar Network. Open for Business: How Open Data Can Help Achieve the G20 Growth Target. A Lateral Economics Report Commissioned by Omidyar Network; Omidyar Network: Redwood City, CA, USA, 2014; p. 84. [Google Scholar]
- WISE Institute. Big and Open Data in Europe. A Growth Engine or a Missed Opportunity? Warsaw Institute for Economic Studies: Warsaw, Poland, 2014; p. 116. [Google Scholar]
- McKinsey Global Institute. Open Data: Unlocking Innovation and Performance with Liquid Information; McKinsey Global Institute: New York, NY, USA, 2013. [Google Scholar]
- Houghton, J. Costs and Benefits of Data Provision. Report to the Australian National Data Service; Centre for Strategic Economic Studies, Victoria University: Melbourne, VI, Australia, 2011; p. 66. [Google Scholar]
- De Vries, M.; Kapff, L.; Negreiro Achiaga, M.; Wauters, P.; Osimo, D.; Foley, P.; Szkuta, K.; O’Connor, J.; Whitehouse, D. Pricing of Public Sector Information Study (Popsis)—Summary Report; Deloitte Consulting CVBA: Brussels, Belgium, 2011. [Google Scholar]
- Uhlir, P.F. The Socioeconomic Effects of Public Sector Information on Digital Networks. Towards a Better Understanding of Different Access and Reuse Policies—Workshop Summary; National Academies Press: Washington, DC, USA, 2009; p. 105. [Google Scholar]
- Attard, J.; Orlandi, F.; Scerri, S.; Auer, S. A systematic review of open government data initiatives. Gov. Inf. Q. 2015, 32, 399–418. [Google Scholar] [CrossRef]
- Pollock, R. Welfare Gains from Opening up Public Sector Information in the UK; University of Cambridge: Cambridge, UK, 2011; p. 4. [Google Scholar]
- Helbig, N.; Cresswell, A.M.; Burke, G.B.; Luna-Reyes, L. The Dynamics of Opening Government Data. A White Paper; Center for Technology in Government, University of Albany: Albany, NY, USA, 2012; p. 34. [Google Scholar]
- Sunlight Foundation. Ten Principles for Opening Up Government Information. Available online: https://sunlightfoundation.com/policy/documents/ten-open-data-principles/ (accessed on 31 August 2010).
- Kulk, S.; van Loenen, B. Brave new open data world? Int. J. Spat. Data Infrastruct. Res. 2012, 7, 196–206. [Google Scholar] [CrossRef]
- European Commission. Guidelines on Recommended Standard Licences, Datasets and Charging for the Reuse of Documents; European Commission: Brussels, Belgium, 2014; p. 10. [Google Scholar]
- Organisation for Economic Co-Operation and Development (OECD). OECD Principles and Guidelines for Access to Research Data from Public Funding; OECD: Paris, France, 2007. [Google Scholar]
- The Committee on Data for Science and Technology (CODATA). The Value of Open Data Sharing: A CODATA Report for the Group on Earth Observations; CODATA: Paris, France, 2015; p. 43. [Google Scholar]
- U.S. Department of Health & Human Services. Unleashing the Power of Data and Innovation to Improve Health. Available online: http://www.healthdata.gov/content/about (accessed on 29 March 2016).
- Herzberg, B. The Next Frontier for Open Data: An Open Private Sector, Voices. Perspectives on Development. Available online: http://blogs.worldbank.org/voices/next-frontier-open-data-open-private-sector (accessed on 7 March 2016).
- Deloitte. Open Data. Driving Growth, Ingenuity and Innovation; Deloitte: London, UK, 2012; p. 36. [Google Scholar]
- Hogge, B. Open Data: Six Stories about Impact in the UK; Omidyar Network: Redwood City, CA, USA, 2015; p. 61. [Google Scholar]
- Koski, H. The Impact of Open Data—A Preliminary Study; The Research Institute of the Finnish Economy (ETLA): Helsinki, Finland, 2015; p. 27. [Google Scholar]
- Ministerie van Economische Zaken; Landbouw en Innovatie. Digitale Agenda.nl—ICT voor Innovatie en Economische Groei; Ministerie van Economische Zaken: Den Haag, The Netherlands, 2011; p. 44. [Google Scholar]
- Ministerie van Binnenlandse Zaken en Koninkrijkrelaties. Nationale Open Data Agenda 2016 (NODA); Ministerie van Binnenlandse Zaken en Koninkrijkrelaties: Den Haag, The Netherlands, 2015; p. 7. [Google Scholar]
- Ministerie van Infrastructuur en Milieu. Beslisnota Open Data: Roadmap; Ministerie van Infrastructuur en Milieu: Den Haag, The Netherlands, 2012; p. 13. [Google Scholar]
- Danish Enterprise and Construction Authority (DECA). The Value of Danish Address Data: Social Benefits from the 2002 Agreement on Procuring Address Data Etc. Free of Charge; DECA: Copenhagen, Denmark, 2010; p. 8. [Google Scholar]
- United Nations. Adoption of the Paris Agreement; United Nations: New York, NY, USA, 2015; p. 12. [Google Scholar]
- Van Damme, E. Pragmatic privatization: The Netherlands 1982–2002. In Privatization Experiences in the European Union; Köthenbürger, M., Sinn, H.-W., Whalley, J., Eds.; CES-IFO with MIT Press: Cambridge, MA, USA, 2006; pp. 289–337. [Google Scholar]
- EnergieLeveranciers.nl. Overzicht Netbeheerders Elektriciteit. Available online: http://www.energieleveranciers.nl/netbeheerders/elektriciteit (accessed on 29 March 2016).
- Giff, G.A.; Crompvoets, J. Performance indicators a tool to support spatial data infrastructure assessment. Comput. Environ. Urban Syst. 2008, 32, 365–376. [Google Scholar] [CrossRef]
- Environment Canada. Manager’s Guide to Implementing Performance-Based Management; Environment and Climate Change Canada: Gatineau, QC, Canada, 2000; p. 55. [Google Scholar]
- Martin, S.; Foulonneau, M.; Turki, S.; Ihadjadene, M. Risk analysis to overcome barriers to open data. e-J. e-Gov. 2013, 11, 348–359. [Google Scholar]
- North, D.C. Institutions, Institutional Change and Economic Performance; Cambridge University Press: Cambridge, UK, 1990; p. 159. [Google Scholar]
- Williamson, O.E. The Economic Institutions of Capitalism. Firms, Markets, Relational Contracting; The Free Press: New York, NY, USA, 1985; p. 468. [Google Scholar]
- Williamson, O.E.; Masten, S.E. Transaction Cost Economics, Theory and Concepts; Edward Elgar Publishing Limited: Cheltenham, UK, 1995. [Google Scholar]
- Sholtz, P. Transaction costs and the social costs of online privacy. First Monday 2001, 6. [Google Scholar] [CrossRef]
- Van Loenen, B.; Crompvoets, J.; Poplin, A. Assessing geoportals from a user perspective. In Proceedings of the 2nd Workshop on Value of Geoinformation, Hamburg, Germany, 30 September–2 October 2010; pp. 29–38.
- Poplin, A. Methodology for measuring the demand geo-information transaction costs: Based on experiments in Berlin, Vienna and Zurich. Int. J. Spat. Data Infrastruct. Res. 2010, 5, 168–193. [Google Scholar]
- Liander. Missie en Strategie. Available online: https://www.liander.nl/over-liander/wat-doet-liander/missie-en-strategie (accessed on 29 March 2016).
- Liander. Voorbeelden Open Data. Available online: https://www.liander.nl/over-liander/innovatie/open-data/apps (accessed on 29 March 2016).
- Bregt, A.; Grus, L.; Eertink, D. Wat Zijn de Effecten van een Open Basisregistratie Topografie na Twee Jaar? Wageningen University: Wageningen, The Netherlands, 2014; p. 49. [Google Scholar]
- Grus, L.; Bregt, A.; Eertink, D. De Effecten van Open Data BRT na 3 Jaar; Wageningen University and the Kadaster: Wageningen, The Netherlands, 2015; p. 7. [Google Scholar]
- Carpenter, J.; Watts, P. Assessing the Value of OS Open DataTM to the Economy of Great Britain—Synopsis; UK Ordnance Survey: Southampton, UK, 2013; p. 32. [Google Scholar]
© 2016 by the authors; licensee MDPI, Basel, Switzerland. This article is an open access article distributed under the terms and conditions of the Creative Commons by Attribution (CC-BY) license (http://creativecommons.org/licenses/by/4.0/).


