Article

Spatio-Temporal Risk Assessment Process Modeling for Urban Hazard Events in Sensor Web Environment

State Key Laboratory of Information Engineering in Surveying, Mapping and Remote Sensing, Wuhan University, 129 Luoyu Road, Wuhan 430079, China
*
Author to whom correspondence should be addressed.
ISPRS Int. J. Geo-Inf. 2016, 5(11), 203; https://doi.org/10.3390/ijgi5110203
Submission received: 30 June 2016 / Revised: 27 October 2016 / Accepted: 4 November 2016 / Published: 9 November 2016

Abstract

:
Immediate risk assessment and analysis are crucial in managing urban hazard events (UHEs). However, it is a challenge to develop an immediate risk assessment process (RAP) that can integrate distributed sensors and data to determine the uncertain model parameters of facilities, environments, and populations. To solve this problem, this paper proposes a RAP modeling method within a unified spatio-temporal framework and forms a 10-tuple process information description structure based on a Meta-Object Facility (MOF). A RAP is designed as an abstract RAP chain that collects urban information resources and performs immediate risk assessments. In addition, we propose a prototype system known as Risk Assessment Process Management (RAPM) to achieve the functions of RAP modeling, management, execution and visualization. An urban gas leakage event is simulated as an example in which individual risk and social risk are used to illustrate the applicability of the RAP modeling method based on the 10-tuple metadata framework. The experimental results show that the proposed RAP immediately assesses risk by the aggregation of urban sensors, data, and model resources. Moreover, an extension mechanism is introduced in the spatio-temporal RAP modeling method to assess risk and to provide decision-making support for different UHEs.

1. Introduction

In recent years, most developing countries have experienced an expansion of urban areas. Frequent occurrences of urban hazard events (UHEs) such as natural disasters, transport accidents, and facilities accidents often result in many casualties and huge economic losses and may develop into larger accidents without timely treatment and suitable decision-making [1,2]. Additionally, facility, environment, population density, and other uncertain model parameters in risk assessment restrict the efficiency of emergency decision-making. Immediate risk assessment is challenging but is urgently needed for emergency response practices both before and after a UHE.
Risk assessment is a part of risk management that provides a process for determining the manner in which the target may be affected, and it analyzes the consequences and their probabilities before determining whether further treatment is required. International Standard ISO 31,000 Risk Management defines risk assessment as a process that includes three steps: risk identification, risk analysis, and risk evaluation [3,4,5]. Risk assessment for urban hazard events can be divided into two basic categories: qualitative and quantitative risk assessment. Each risk assessment method has unique advantages, limitations, and problems. Qualitative risk assessment usually considers expert opinions to determine and assess the probability and consequences of the hazard. This method relies mainly on the knowledge of experts; thus, the results of qualitative risk assessment are subjective. Quantitative risk assessment depends mainly on available sufficient data and quantitative assessment models. Therefore, the results of quantitative risk assessment are objective, and a standardized method can often be repeatedly used for a more detailed understanding of risks. Quantitative risk assessment can often be divided into two categories, probability risk assessment before an UHE and immediate risk assessment during an UHE, both of which include human health risk and economic risk. The former method has been the focus of research in previous studies and has formed the basis of numerous mature frameworks. For example, the Accidental Risk Assessment Methodology for Industries (ARAMIS) was created by the European Union in 2005 [6]. A quantitative risk assessment process (RAP) for industrial facility accidents triggered by seismic events has been developed [7]. However, these methods cannot provide decision support for emergency response because in reality, emergency response has specific constraints and requires immediate risk assessment in the assessment means, efficiency, results expression, and other parameters. For immediate risk assessment, the focus of future research is to develop an immediate method for monitoring and controlling risk. A geographic information system (GIS)-based immediate risk assessment framework for chemical spills has been designed for application to the Songhua River in China [8] based on UHE monitoring. An immediate risk assessment tool for wildfire suppression decision-making has been designed on the basis of several primary components of the Wildland Fire Decision Support System (WFDS) [9]. However, these risk assessment methods employ only space-time observations of a UHE based on a single-type sensor and do not include immediate workflow for risk assessment based on observations. Therefore, the integration management and sharing for multi-source heterogeneous sensors has become an important challenge for immediate risk assessment research.
Smart cities [10,11,12,13,14], a sustainable and intelligent method for integrating all infrastructure and services as a whole, have been discussed worldwide. Smart cities use intelligent devices for monitoring and control to ensure sustainability and efficiency. The main characteristic of a smart city is to achieve comprehensive sensing, greater depth, more extensive sensor connections and more thorough processing. Sensor webs have been proposed by the National Aeronautics and Space Administration (NASA) [15]. Sensor webs, which are a technical component of smart cities, is widely used for disaster warnings and the dynamic monitoring of the ecological environment, land, and ocean. A sensor web environment (SWE) [16] hosts sensor webs, including a series of standards from the Open Geospatial Consortium (OGC), which provides a suite of interoperability interfaces and coding metadata for the real-time integration of heterogeneous sensor webs into information infrastructures. The OGC web service standards include the Sensor Observation Service (SOS), the Web Processing Service (WPS), the Web Feature Service (WFS), the Web Coverage Service (WCS), Catalogue Services for the Web (CSW), and information models including Sensor Model Language (SensorML) [17,18] and Observation and Measurement (O & M). SensorML is a type of information encoding standard from OGC SWE that provides encoding and models to describe the processes related to sensors or a processing system. Any type of process is executable and discoverable. These processes are defined by the input, output, parameters and methods to provide the associated metadata. The process chain is a composite process from SensorML, which is used to connect the sub-processes. It can be used as a mechanism for describing the workflow from the perspective of the dataflow. Therefore, the distributed sensors, data, and models can be accessed through SensorML. However, methods for aggregating the scattered web services to determine uncertain model parameters in a RAP for UHEs according to risk assessment requirements and for providing immediate and reliable information services have become important challenges.
Integrated Environmental Modeling (IEM) is one common systematic approach for aggregating information and services. IEM integrates models and data to explore and interpret the complex relationships and interactions among social, economic and environmental system components including four interdependent elements: applications, science, technology, and community [19,20,21,22]. IEM considers the resource integration issue, computational model reuse, and decision-making by model connections. The models in IEM remain independent in function but cooperate with each other. Over the past several decades, significant effort has been dedicated to the technological development of IEM systems. With the advance of the spatial data infrastructure (SDI) and cyber-infrastructures, the model-as-a-service (MaaS) method is being used to provide a model web toward integrated modeling systems. The model web is a dynamic network that collects a multitude of models that interact through web services [23,24,25]. In this method, different models can be implemented as a service that can be coupled with the web service access interface and service-oriented workflows. Currently, UHE monitoring systems are based mainly on a single sensor network, and sensors provide only UHE discovery and preliminary space-time predictions. It is difficult to cooperate with sensors in different fields to improve the efficiency of risk assessment and decision-making [26,27,28]. For a sudden risk assessment mission, the user cannot obtain sufficient available information service resources to meet the requirements of sensors, computing models, and application services. Therefore, a resource-integrated management platform and workflow management architecture are required.
The Meta-Object Facility (MOF) [29], an Object Management Group (OMG) standard as a model-driven engine, is an integration framework for determining the definition, operation, and integration of metadata and data. Its meta-modeling language is useful for writing meta-models and models. A meta-model conforming to MOF specifications has the characteristics of openness, extensibility, and interoperability. MOF is designed as a typical four-layer modeling structure that provides a meta-meta-model at the top layer, which is known as M3 or the meta-meta-model layer. The main purpose of this layer is to define an abstract description scheme for describing the meta-models. The M2 layer, also known as the meta-model layer, is used to describe elements of the M1 layer. The M1 layer contains various types of models with a meta-model layer structure. The M0 layer is composed of real-world objects such as particular data or dataflow instances that are constructed by models in the M1 layer. Therefore, numerous workflows for RAPs benefit from a unified description and share based on an MOF with four-layer architecture.
As mentioned, there are three main objectives of this paper. First, to achieve dynamical monitoring of UHEs, we achieve the integrated management of multi-source heterogeneous sensors under an SWE. The second objective is the immediate execution of a risk assessment workflow during an UHE. We have designed a method to establish an executable workflow in the form of a process chain based on SensorML. The third objective is the design of an extendible meta-model framework to achieve the unified representation of RAP chains for multiple UHEs and the collaborative management and sharing of RAP chains.
This paper focuses on spatio-temporal RAP modeling for UHEs in an SWE and is organized as follows. Section 2 mainly introduces the RAP modeling method proposed for building a shared and interoperable RAP model based on an MOF with a 10-tuple information description structure. A gas leakage case and its related RAP are presented in Section 3. In Section 4, an experiment conducted using a process meta-model and the results of risk assessment are discussed. Section 5 analyzes the applicability and advantages of the process meta-model, and the conclusions and outlook are summarized in Section 6.

2. Method

The construction of a RAP contains four steps, which are described in detail in this section. First, a RAP meta-model is established on the basis of a four-layer MOF structure. Then, the basic metadata components and 10-tuple information description structure in the RAP meta-model are organized and explained. On the basis of the basic metadata components and 10-tuple information, we express the RAP and construct the workflow in four stages: sensing, recognition, analysis, and evaluation. Finally, the formalization of the RAP meta-model is introduced to achieve integrated management of multiple RAPs.

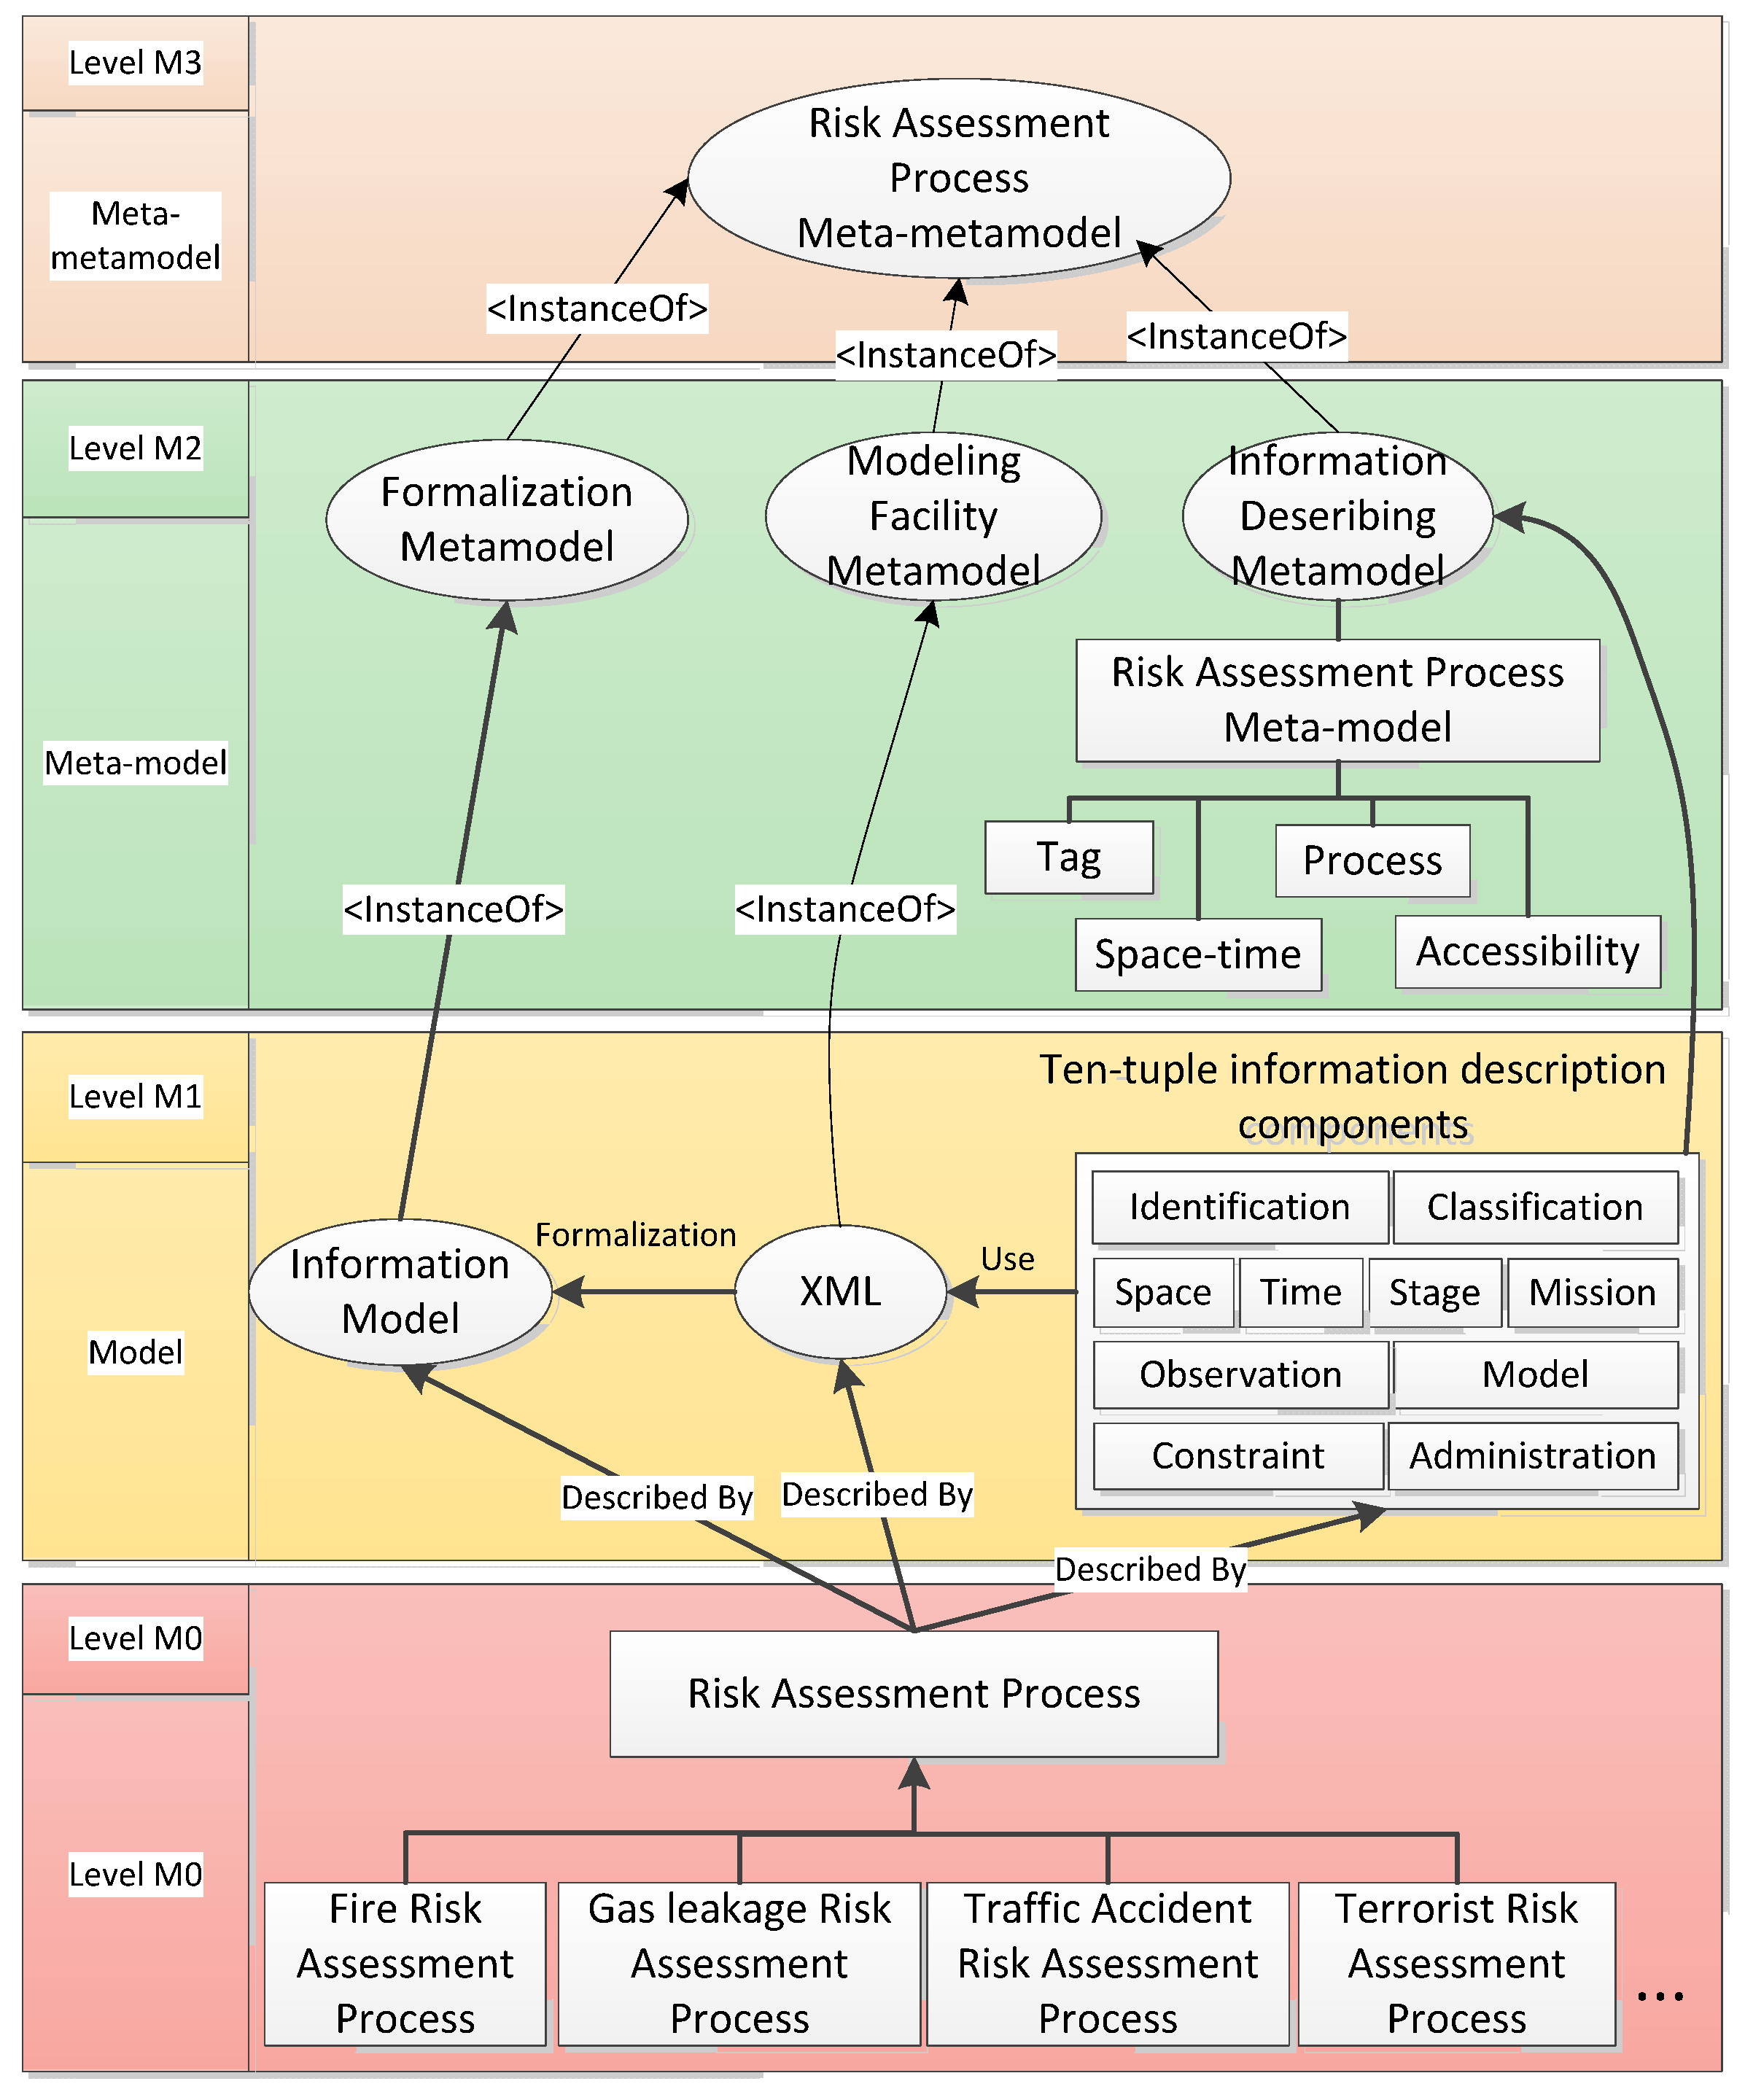
2.1. Meta-Modeling for a RAP

To describe a RAP for UHEs as a shareable information model in a specific architecture, we propose a RAP meta-model based on the MOF framework.
MOF is an OMG standard for meta-modeling with a four-layer structure that defines the modeling concepts and the relationships among them. The RAP modeling architecture consists of four typical layers based on the meta-layers of MOF, as shown in Figure 1. Each layer is represented as an instance of the layer above it and an abstraction of the layer below it. The top layer, M3, is commonly referred to as a meta-meta-model layer that includes the concepts of RAP meta-modeling and their relationships. The next layer, M2, is a meta-model layer that consists of the information describing the meta-model, the modeling facility meta-model, and the formalization of the meta-model. Layer M1 is an information description model layer that contains the information description model, the XML modeling language, and the content and structure of the meta-model in detail. The bottom layer, M0, holds a variety of UHEs related to RAP instances, including a gas leak RAP, a flood RAP, a traffic accident RAP, and a fire RAP.

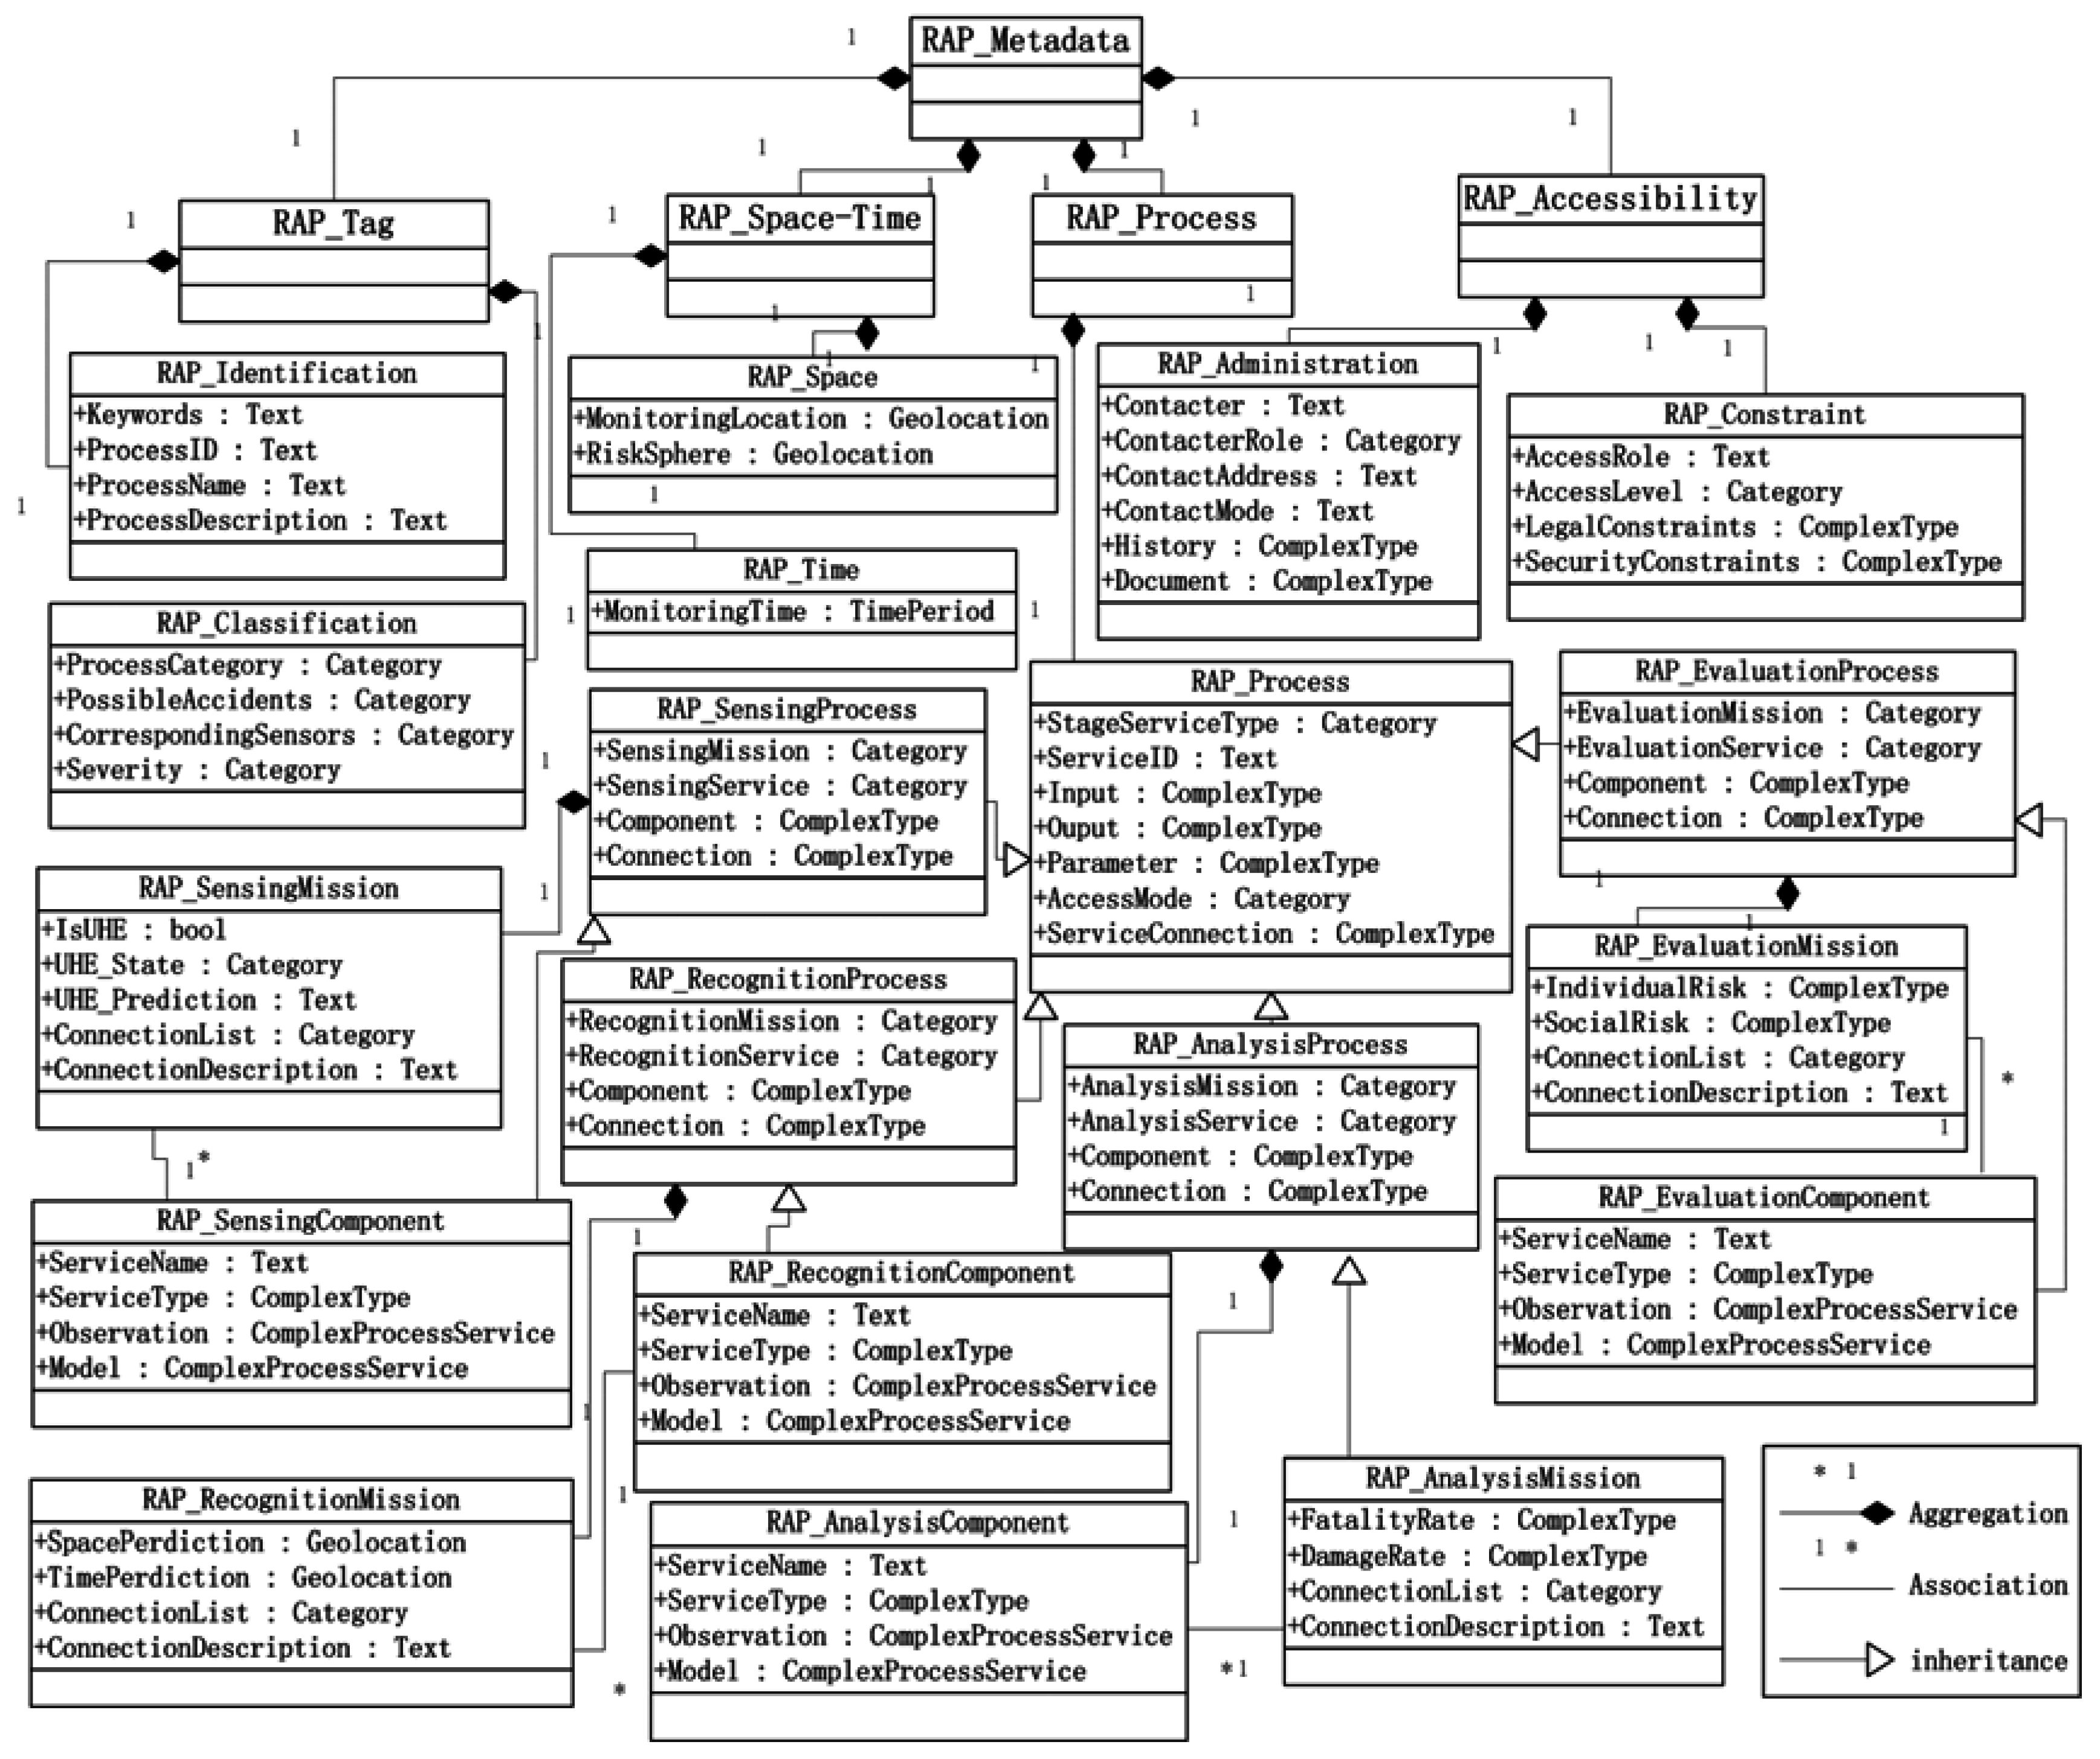
2.2. Basic Information Components of a RAP

The core of the four-layer architecture is the RAP information description meta-model, which describes the multifaceted characteristic information of a RAP. The RAP information description meta-model can be classified into four components according to their function: tag, space-time, process, and accessibility. Tag information plays an important role in characterizing the meta-models of various UHEs related to a RAP. Spatio-temporal information should be provided by the RAP when a UHE occurs because it serves as the foundation of immediate risk assessment results. The process information is composed of stage information, mission information, observation information, and model information. These components describe the risk assessment mission requirements, sensor requirements, and assessment model requirements at each RAP stage. Accessibility includes service information and constraint information, which determine service metadata information and the constraints provided by the RAP. Accessibility can also explain service objects and service types from RAP results. The four information components of the RAP meta-model can be further divided as follows.
  • Tag: Such information is composed of identification information and classification information. Identification information is used to describe the RAP name, ID, and other identifying elements. Classification information describes various UHEs under different classification criteria and is useful for RAP inquiry and discovery based on the related UHE.
  • Space-time: Such information represents the time and space information of the RAP. The RAP is based on spatio-temporal observations that provide the spatio-temporal range to risk assessment with the occurrence of abnormal observations.
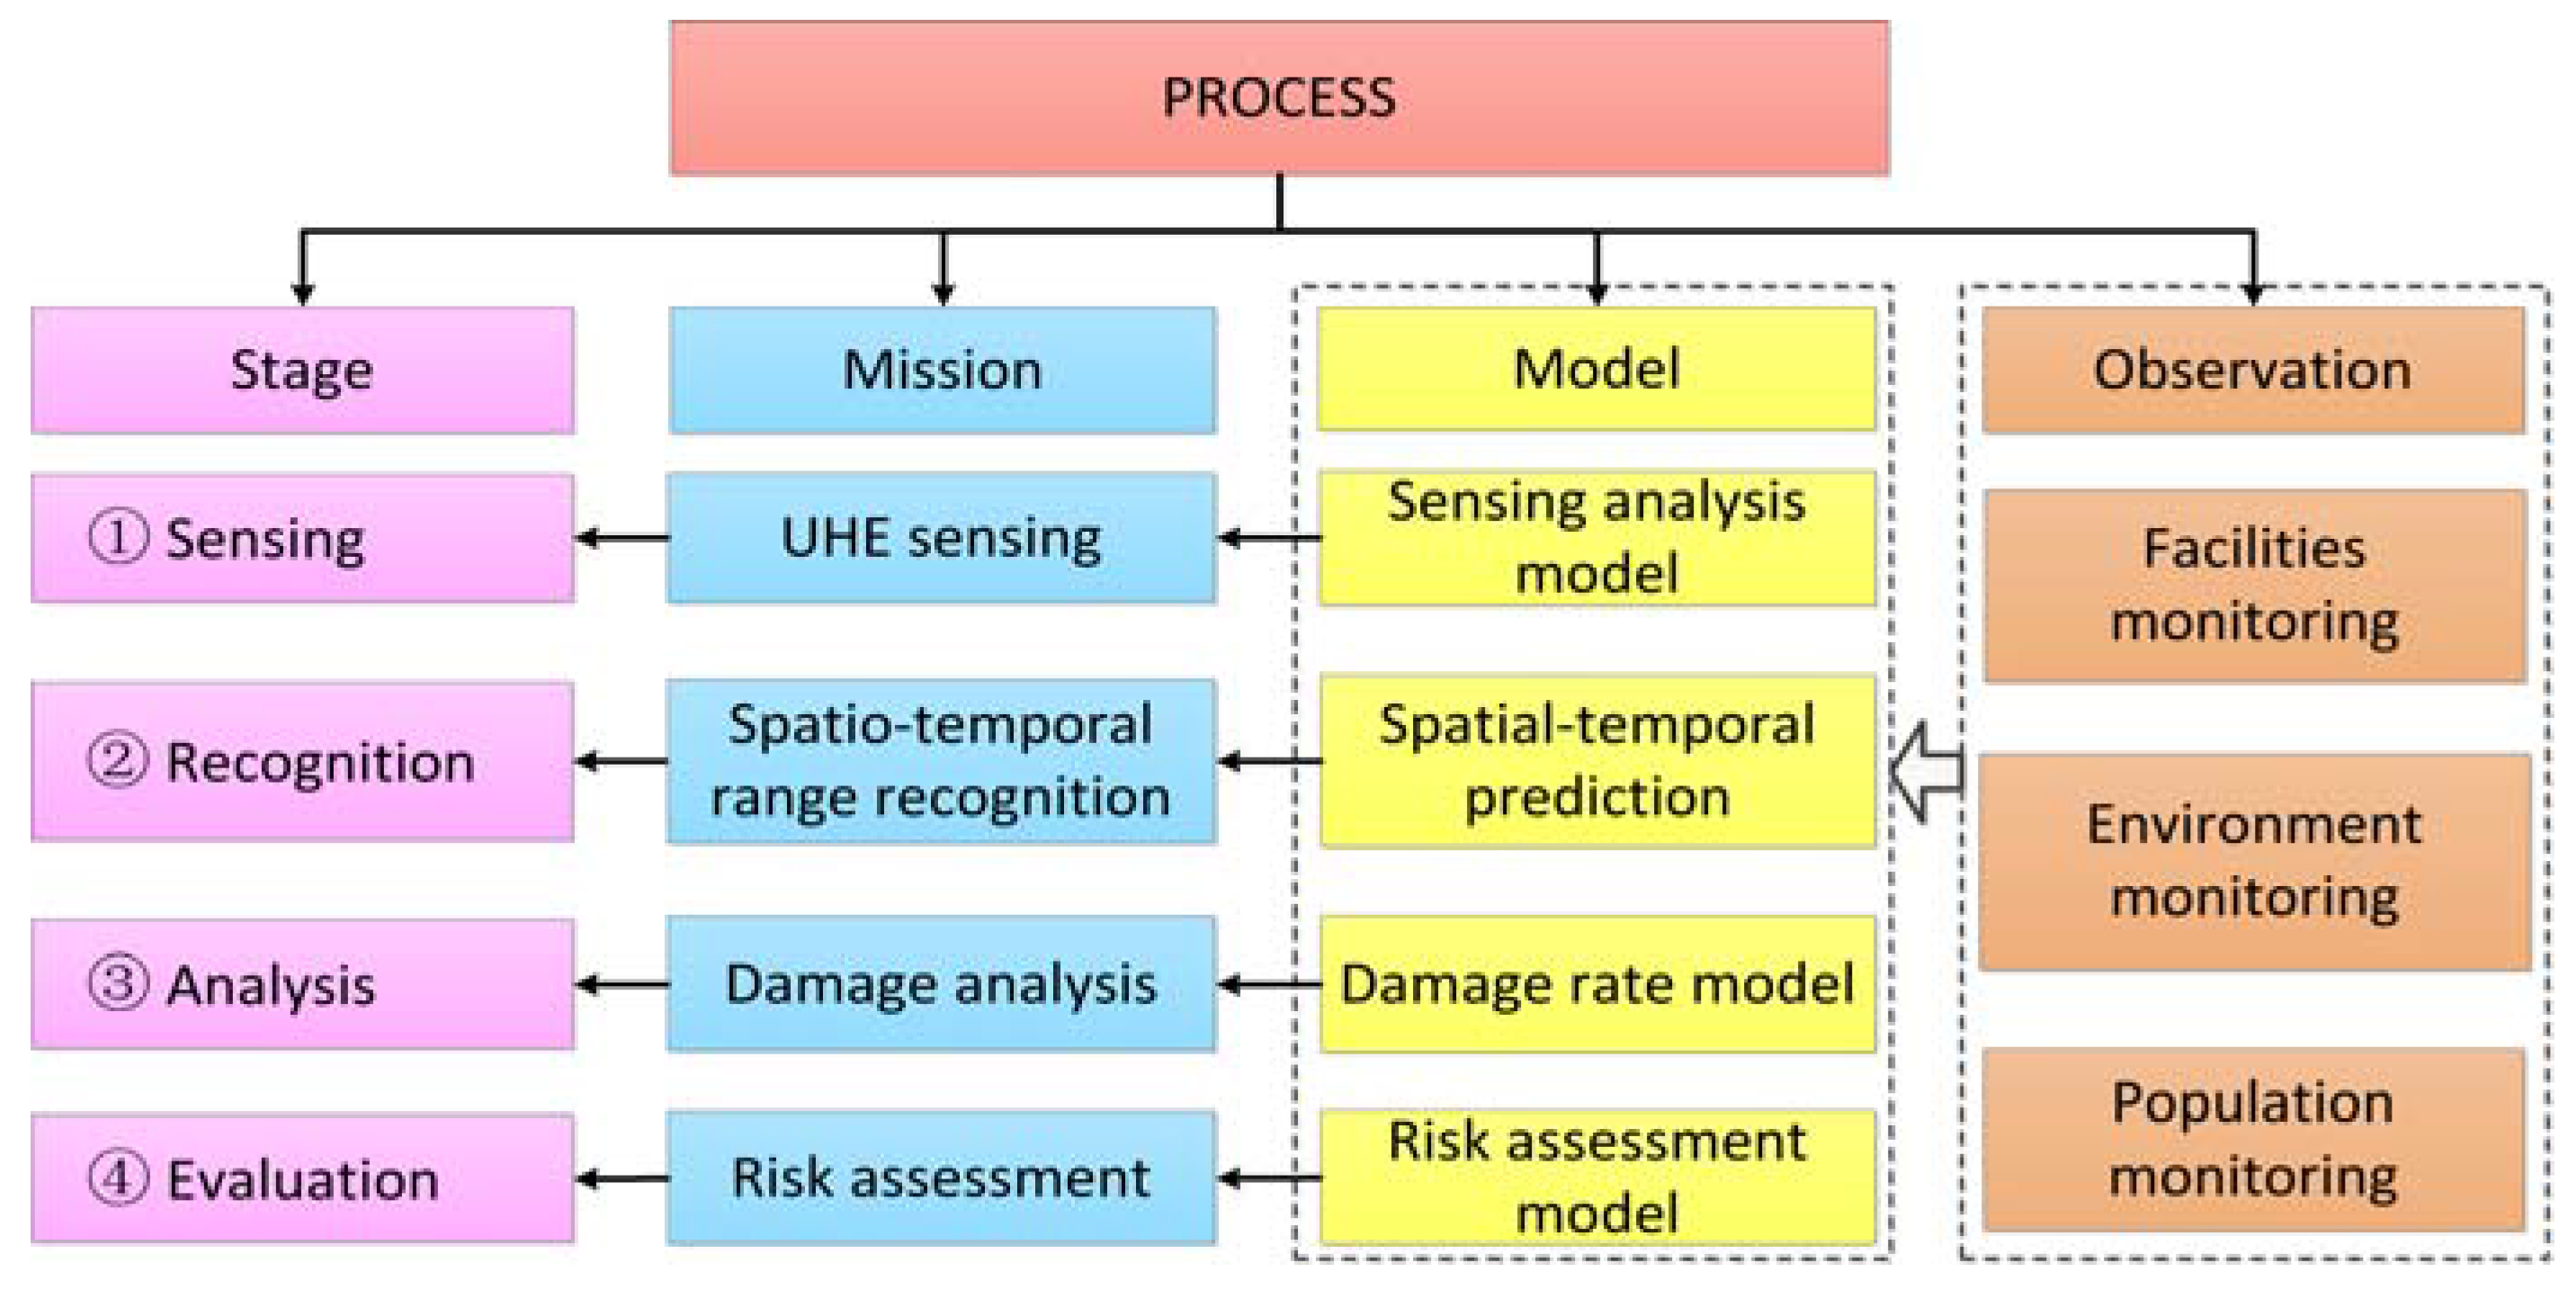
  • Process: Process represents the abstract description of a workflow, which describes the execution sequence of observations and models in four stages: sensing, recognition, analysis, and evaluation.
  • Accessibility: Accessibility information includes administration information and constraint information. Administration reflects an association or organization that is responsible for a UHE. Constraint information includes several legal and security restrictions that are critical for users to efficiently organize the data resource information that a RAP requires for UHEs.
In summary, the four types of basic metadata information (tag, space-time, process and availability) constitute a common information model for a reusable process. More specifically, there are 10-tuple information aspects (10 aspects of RAP information) in total that give a detailed structure description including identification, classification, space, time, stage, mission, observation, service (model), administration, and constraint. The relationships among RAP metadata components and 10-tuple information description are shown in Figure 2.
The 10-tuple information, composed of 10 aspects of RAP information shown in Figure 2, is specifically described as follows.
  • Identification information includes the keywords, name, type, and characteristics of a RAP that describe the common process information to uniquely recognize a process.
  • Classification information describes mapping from a variety of RAPs to UHEs. When monitoring sensors receive abnormal values, one can quickly determine the RAP that matches the UHE based on the mapping, which makes quick discovery of UHEs and immediate risk assessment possible.
  • Space information covers the spatial extent and spatial reference information used to describe the locations of UHEs. The spatial extent of a RAP is two-dimensional (2D) because UHE risk assessment focuses primarily on 2D spatial analysis.
  • Time information can describe the progress of the UHE, and it provides a basis for an immediate RAP.
  • Stage information describes the different required missions, models, and observations in each stage. Stage information can also describe the input, output, and parameter information for each stage. Additionally, temporal uncertainty problems occur that may be caused by delay sensor data or network problems during RAP execution time. The designed stage information can describe the execution state, stage, and incoming time of the sensor data. Stage information abstracts the time threshold range. When the execution time exceeds the threshold range, the error will be returned.
  • Mission information represents specific assessment missions for each assessment stage. It describes the connection sequence for service resources, including the sensor observations and model services in a RAP.
  • Observation information represents the binding of sensor observations according to mission information. Different types of sensors are often required in different assessment stages. This information contains basic information on the binding sensor observations.
  • Model (service) information represents distributed models according to the mission information requirements for each assessment stage. The service name, service address and service type are provided to mission information.
  • Administration information represents contacts, history, documents, and other data that play important roles in the administration and improvement of RAPs.
  • Constraint information describes the access permissions, security rules and legal constraints of a RAP.
A unified modeling language (UML) diagram of a RAP for gas leakage is shown in Figure 3.

2.3. Construction of a RAP Based on Stages

On the basis of the basic metadata components and the 10-tuple information description structure, we constructed a RAP with four risk assessment stages: sensing, recognition, analysis, and evaluation. Different risk assessment stages hold different mission requirements for different observations and models in the RAP. The proposed assessment process includes these four stages. The stage, mission, observation, and model requirements for all risk assessment stages are shown in Figure 4. In the sensing stage, the basic mission is routine monitoring; therefore, the most immediate disaster-inducing factors should be recorded in real-time. If the monitoring value is continuously abnormal, it must be analyzed according to the abnormal value. Once the UHE is identified, its severity is immediately calculated and analyzed. In the recognition stage, the main mission is to recognize the possible secondary events and to predict the spatio-temporal influence range using a related prediction model. The spatial and temporal scales of the UHE can be determined according to the spatio-temporal information of sensors that record abnormal values, which is useful for the next risk assessment and for determining a warning area. In the analysis stage, the main mission is to calculate and analyze the damage triggered by the UHE. Different possible secondary events often correspond to different damage rates, which are useful for the individual risk and social risk calculations in the next stage. In the evaluation stage, the main mission is to evaluate individual risk and social risk. The integration of the damage rate and the density of population observation data provide the results of individual risk and social risk based on correlation assessment models.
On the basis of the aforementioned description of the stages and the corresponding missions, information resources can be integrated, and services can be extracted from the correct RAP to immediately execute the RAP. This will provide the decision-making basis and decision support for UHE emergency management.

2.4. Formalization of a RAP Meta-Model

A RAP meta-model is formalized using the SensorML standard, which defines a model and XML encoding to implement sensor network discovery and observation data assessment. Moreover, it allows developers to define models and XML templates for describing observations and sensors post-processing. The main properties of a process chain involve the metadataGroup, inputs, outputs, parameters, connections, and components. We can formalize a RAP meta-model on the basis of these properties. The first property is the basic metadata information, including identification, classification, space, time, administration, and constraint information, which directly maps into metadataGroup in SensorML. The second group of properties is the stage information, including sensing, recognition, analysis, and evaluation, which maps into the main exposure elements of a process chain, including input, output, and parameters. The next group is the mission information used to describe the link sequence from multiple sub-processes to the composite process and to map into the connections in SensorML. The observation and model service map into the last property, corresponding to the component in SensorML. The mapping from the RAP meta-model to the process chain of SensorML is shown in Figure 5. The basic elements of a process chain are divided into data nodes and processing nodes. The connection between different nodes is also defined. Thus, the logical structure of the process chain has been described.

3. Case Studies Based on Gas Leakage

In developing countries, the unprecedented growth in urbanization, especially in large cities, has led to an increased demand for natural gas and for building a dense urban gas pipeline network. This increased demand translates into a corresponding increase in potential safety hazards and risks [30,31,32]. Natural gas is flammable and carries a serious risk of fire and explosion. Unless timely emergency treatment is provided, the consequences of accidents caused by gas leakage can be severe. The density distribution of urban populations and buildings may complicate evacuation and thus lead to huge losses of life and property. Therefore, to prevent accidents and to minimize such losses, we take a gas leakage case as a case study to verify the feasibility and adaptability of the proposed RAP approach.
To make risk assessment timely and to quantitatively estimate the individual and social risks, we developed a RAP for an urban gas leakage event including the proposed four stages. The goals of each stage include the calculation of the leakage rate, the recognition of physical effects, fatality and casualty rate analyses, and individual and social risk calculations. The missions depend on real-time sensing data and assessment models from the abstract observation and model components. The relationships among the specific missions, observations, and models are shown in Figure 6. The risk assessment task in each stage is specifically described in the mission information, and the corresponding risk assessment models are described in the model information. An example of the recognition stage in the main mission is the recognition of the spatio-temporal influence range based on possible derivative disasters such as gas diffusion, fires, and gas cloud explosions. The parameters of the related models, including the Gaussian diffusion model, the fire model, and the overpressure explosion model, are described in the model information. When the RAP is executed, the gas leakage rate as input in the sensing stage is transmitted, and the spatio-temporal influence range is calculated by these three models. The range is transmitted to the next stage as the output. The process and calculation details of each stage are presented in the following sections.

3.1. Risk Sensing for Gas Leakage

RAP is an evaluation process based on real-time monitoring that reports the occurrence of UHEs. For a gas leakage event, pressure sensors deployed in gas pipelines sense the daily supply pressure and filter abnormal values in real-time. A gas leakage event is declared when abnormal values are received from continuous monitoring. Moreover, the first leakage point location needs to be a primary consideration. The negative pressure wave equation shown in Figure 7 is provided to solve this problem. If a gas leak occurs at a particular point in a pipeline, the pressure is reduced at that point. At the same time, a negative pressure wave is formed and transmitted to both ends of the pipeline. Thus, we can rapidly determine the leakage point location of a gas pipeline according to velocity and the time at which the negative pressure wave is transmitted from the leakage point to both ends of the pipeline.
The negative pressure wave equation is shown in Equation (1):
X = L + a Δ T 2 ,
where X is the distance from the leakage point to the inlet point in m; L is the pipeline length in m; a is the dissemination velocity of pressure wave in the pipeline medium in m/s; and Δ T is the time difference of the reception of pressure waves at the inlet and outlet sensors in s.
The abnormal values can be used for spatio-temporal prediction, which is useful for determining the location of the leak and calculation of the leak rate that will be input to the next stage. In this study, the small hole model [33] was selected to evaluate the gas leakage rate, as described below.
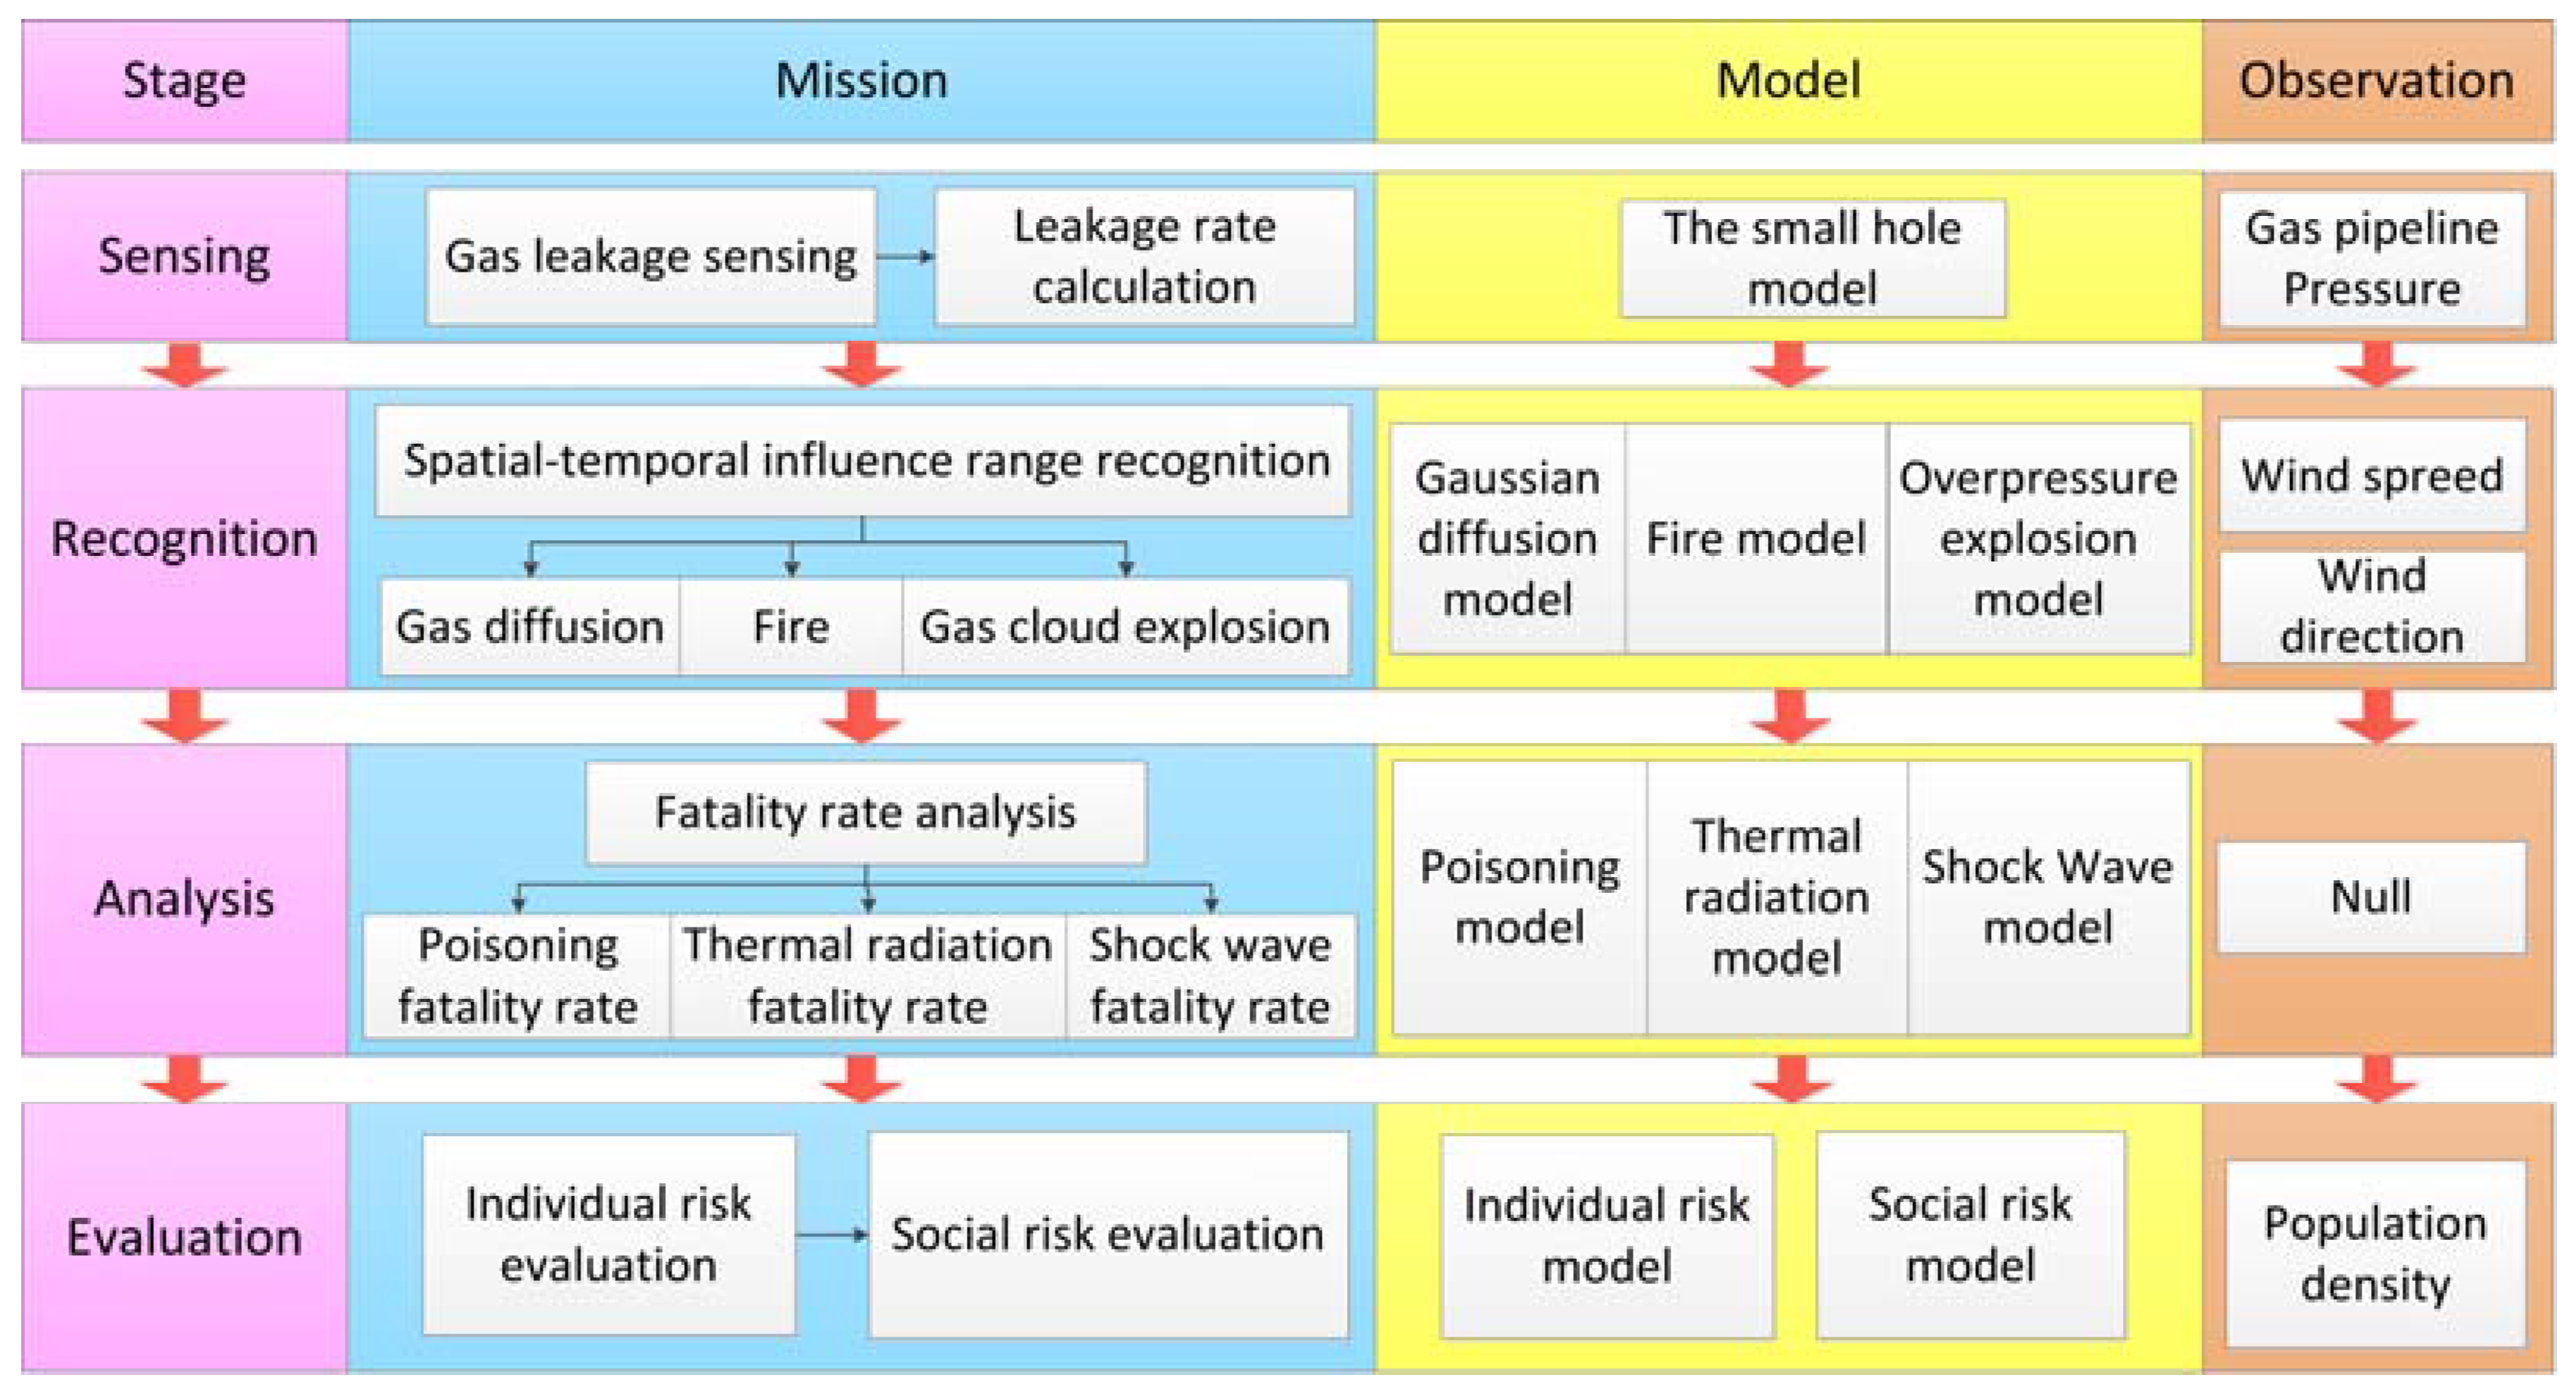
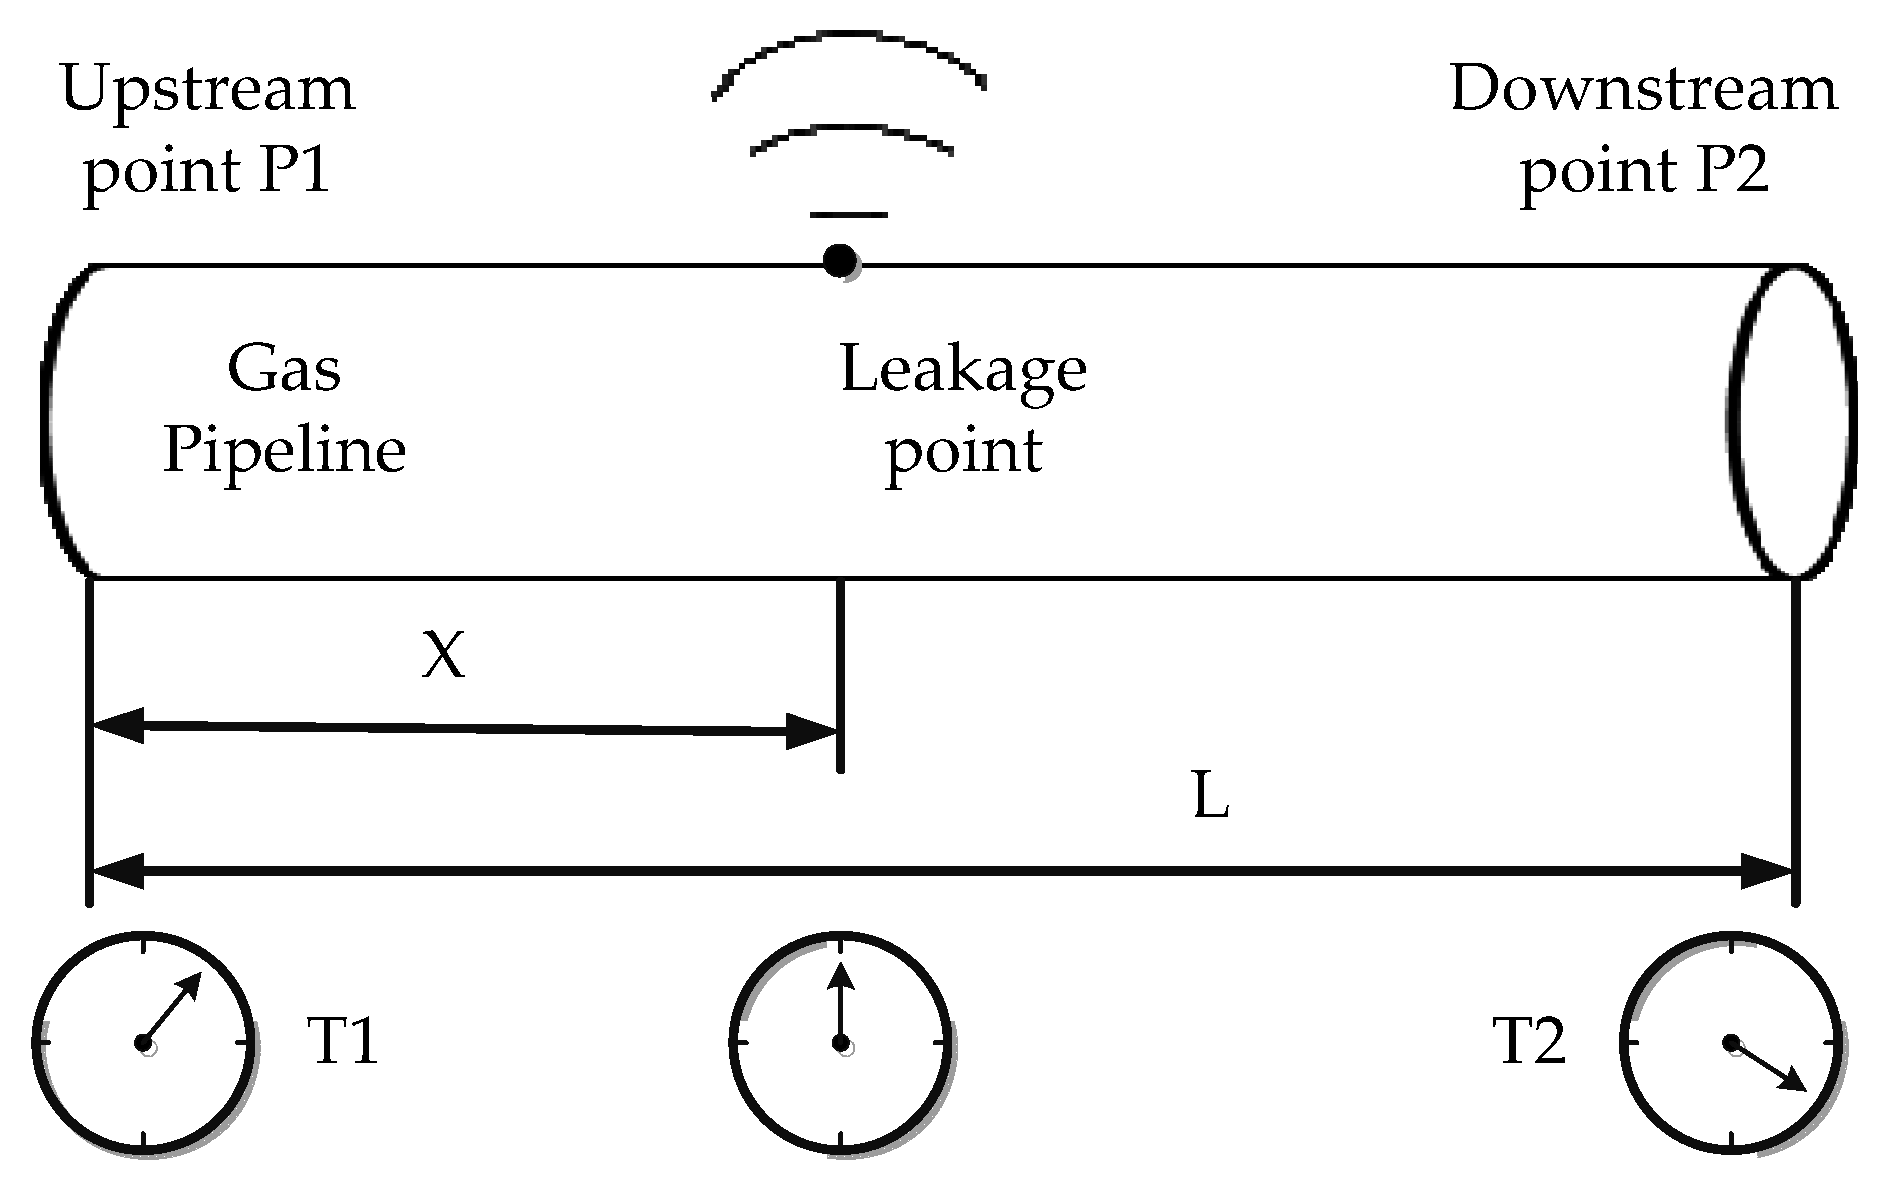
  • Small hole model: Gas leakage states are often divided into two types: sonic speed and subsonic speed. To simplify the calculation, a uniform model is adopted to calculate the leak rate caused by small or medium-sized hole failure. The model is shown in Equation (2):
    Q = A o r P 2 2 M R T 2 · k k 1 [ ( P a P 2 ) 2 k ( P a P 2 ) k + 1 k ] ,
    where Q is the gas leakage rate in kg/s; A o r is the area of the leak opening in m2; M is the molecular weight of the gas in kg/mol; R is the gas constant (8.314 J/mol·K); T 2 is the temperature of the gas inside the pipeline in °K; k is the adiabatic index or the ratio of the isobaric heat capacity to the isochoric heat capacity (1.28 for natural gas); P a is the environmental pressure outside the gas pipeline in Pa; and P 2 is the pressure inside the gas pipeline in Pa.

3.2. Risk Recognition for Gas Leakage

After timely risk sensing, it is important to immediately recognize the potential secondary events and their spatio-temporal sphere of influence. A gas leakage event may cause gas diffusion, fires, vapor cloud explosions, and other secondary events. In this paper, we discuss three main types of secondary events caused by gas leakage. The model component in the stage involves a Gaussian diffusion model, a fire model, and an explosion model. Additionally, real-time meteorological observation data are provided for input to the Gaussian diffusion model [34] to identify the diffusion direction and intensity. The model types are described below.
  • Gaussian diffusion model: A Gaussian diffusion model is divided into plume and puff types. The plume diffusion model is suitable for partial continuous leak diffusion, and the puff model is used for instantaneous gas leak diffusion. The former is more appropriate for a gas leak event. The concentration distribution of the Gaussian diffusion model is shown in Equation (3):
    c ( x , y , z , H ) = Q 2 π σ y σ z u ¯ · exp ( y 2 2 σ y 2 ) · { exp [ ( z H ) 2 2 σ x 2 ] + exp [ ( z + H ) 2 2 σ x 2 ] } ,
    where c ( x , y , z , H ) is the concentration near the source of the gas leakage in kg/m3; Q is the mass flow rate of gas leakage in kg/s, which is determined by the output of the small hole model in the sensing stage; H is the height of the leak source in m; ( x , y , z ) are the coordinates of any point in the downwind region; u ¯ is the average wind speed in m/s, which is determined by the observation result of wind speed sensors; and σ x , σ y , and σ z are the diffusivities of downwind, cross wind, and vertical wind in m, respectively, which are calculated on the basis of the observation results of the wind direction sensors and the level of atmospheric stability.
  • Fire model: Fire can affect the surrounding environment through thermal radiation. Surrounding objects can be burned and deformed in a radiation environment of high intensity. High-temperature radiation may burn equipment and even cause casualties. The existing fire models are divided by fire types and include the fireball model, the jet fire model, and the flash fire model; their usage depends on the potential concerns based on the released material and context. In this paper, the fireball model, described in Equation (4), is used as an example:
    q ( x ) = Q t o t a l T c 4 π x 2 ,
    where q is the radiative heat flux at the specific position in W/m2; Q t o t a l is the leakage gas mass in kg, which is determined by the leakage time and the output of the small hole model in the sensing stage; T c is the thermal conductivity; and x is the distance between the center of the flame zone and the target point.
  • Vapor cloud explosion model [35]: A vapor cloud is formed when a large number of gas leaks quickly spread into the air. If a vapor cloud is ignited at an explosion limit density, an explosion will be generated with a shock wave. The vapor cloud explosion model is shown in Equation (5):
    Δ P = 0.71 × 10 6 | R m T N T 3 | 2.09 ,
    where Δ P is the incident overpressure of the blast wave; R is the distance from a certain point in the explosion field to the explosion source; and m T N T is calculated by Equation (6):
    m T N T = m d Δ H d Q T N T ,
    where m T N T is the trinitrotoluene (TNT) equivalent in kg in the center of the explosion; m d is the mass of the gas participating in the explosion in kg, which is determined by the leakage time and the output of the small hole model in the sensing stage; Δ H d is the explosion heat of the gas in J/kg; and Q T N T is the calorific value of a standard TNT explosion source (4.2 MJ/kg).

3.3. Risk Analysis for Gas Leakage

Secondary events caused by a gas leakage event can be identified from the outputs of the preceding stage. The calculation results of the models are useful for fatality rate analysis, which is the main mission in the risk analysis stage. The effects of gas leakage on humans, which include fatal poisoning, thermal radiation flux, and shock waves, can be represented by the fatality rate within a certain time period. The fatality rate is the percentage of injured people exposed to the gas leakage, which is related to the damage factor. The fatality rate model is shown in Equation (7):
P T = a + b I n I f ,
where P T is the percentage of susceptible injured persons or objects in the environments, I f is the harm-causing factor, and a and b are constants that map different values according to three types of secondary events: gas diffusion, fire, and vapor cloud explosions.

3.4. Risk Evaluation for Gas Leakage

This stage quantitatively calculates urban risk, including casualties and property losses, for the gas leakage event based on the outputs of the preceding stage. In this paper, the main assessment mission is the risk assessment of casualties, which is quantitatively measured on the basis of individual and social risks, as defined below. Real-time mobile base station data are provided to calculate the population density surrounding the event location, which is useful for calculating social risk. The results of risk assessment are used to determine the risk conditions for gas leakage pipelines.
  • Individual risk model [36]: An individual risk model is defined as the frequency of injuries and, in particular, deaths of people caused by a specific hazard excluding protective measures. For a gas leakage event, individual risk can be represented as the integration of the gas pipeline failure probability and the fatality rate of the people in the specific location of the event. The individual risk is given by Equation (8):
    I R = i φ i 0 L P i d L ,
    where I is the assumed fault type; φ i is the pipeline failure rate per unit length; L is the length of the pipeline in m; P i is the fatality rate of the failure accident, which is determined by the output in the analysis stage; and i is the failure mode of the pipeline.
  • Social risk model [37]: The social risk model is used to describe the relationship between the probability an accident and the number of casualties caused by the accident. Social risk refers to the risk of catastrophic accidents that affect many people simultaneously. Social risk is related not only to individual risk but also to the population density near the leakage region. Social risk can be calculated by Equation (9):
    N i = A i ρ p P i d A i ,
    where A i is the affected area of the assumed failure accident; ρ P is the population density in the region, which is determined by the calculation of the mobile base station data; and P i is the fatality rate of a certain accident type, i , which is different from the three secondary events. A frequency and number (F–N) curve is used to formally express social risk.

4. System Implementation

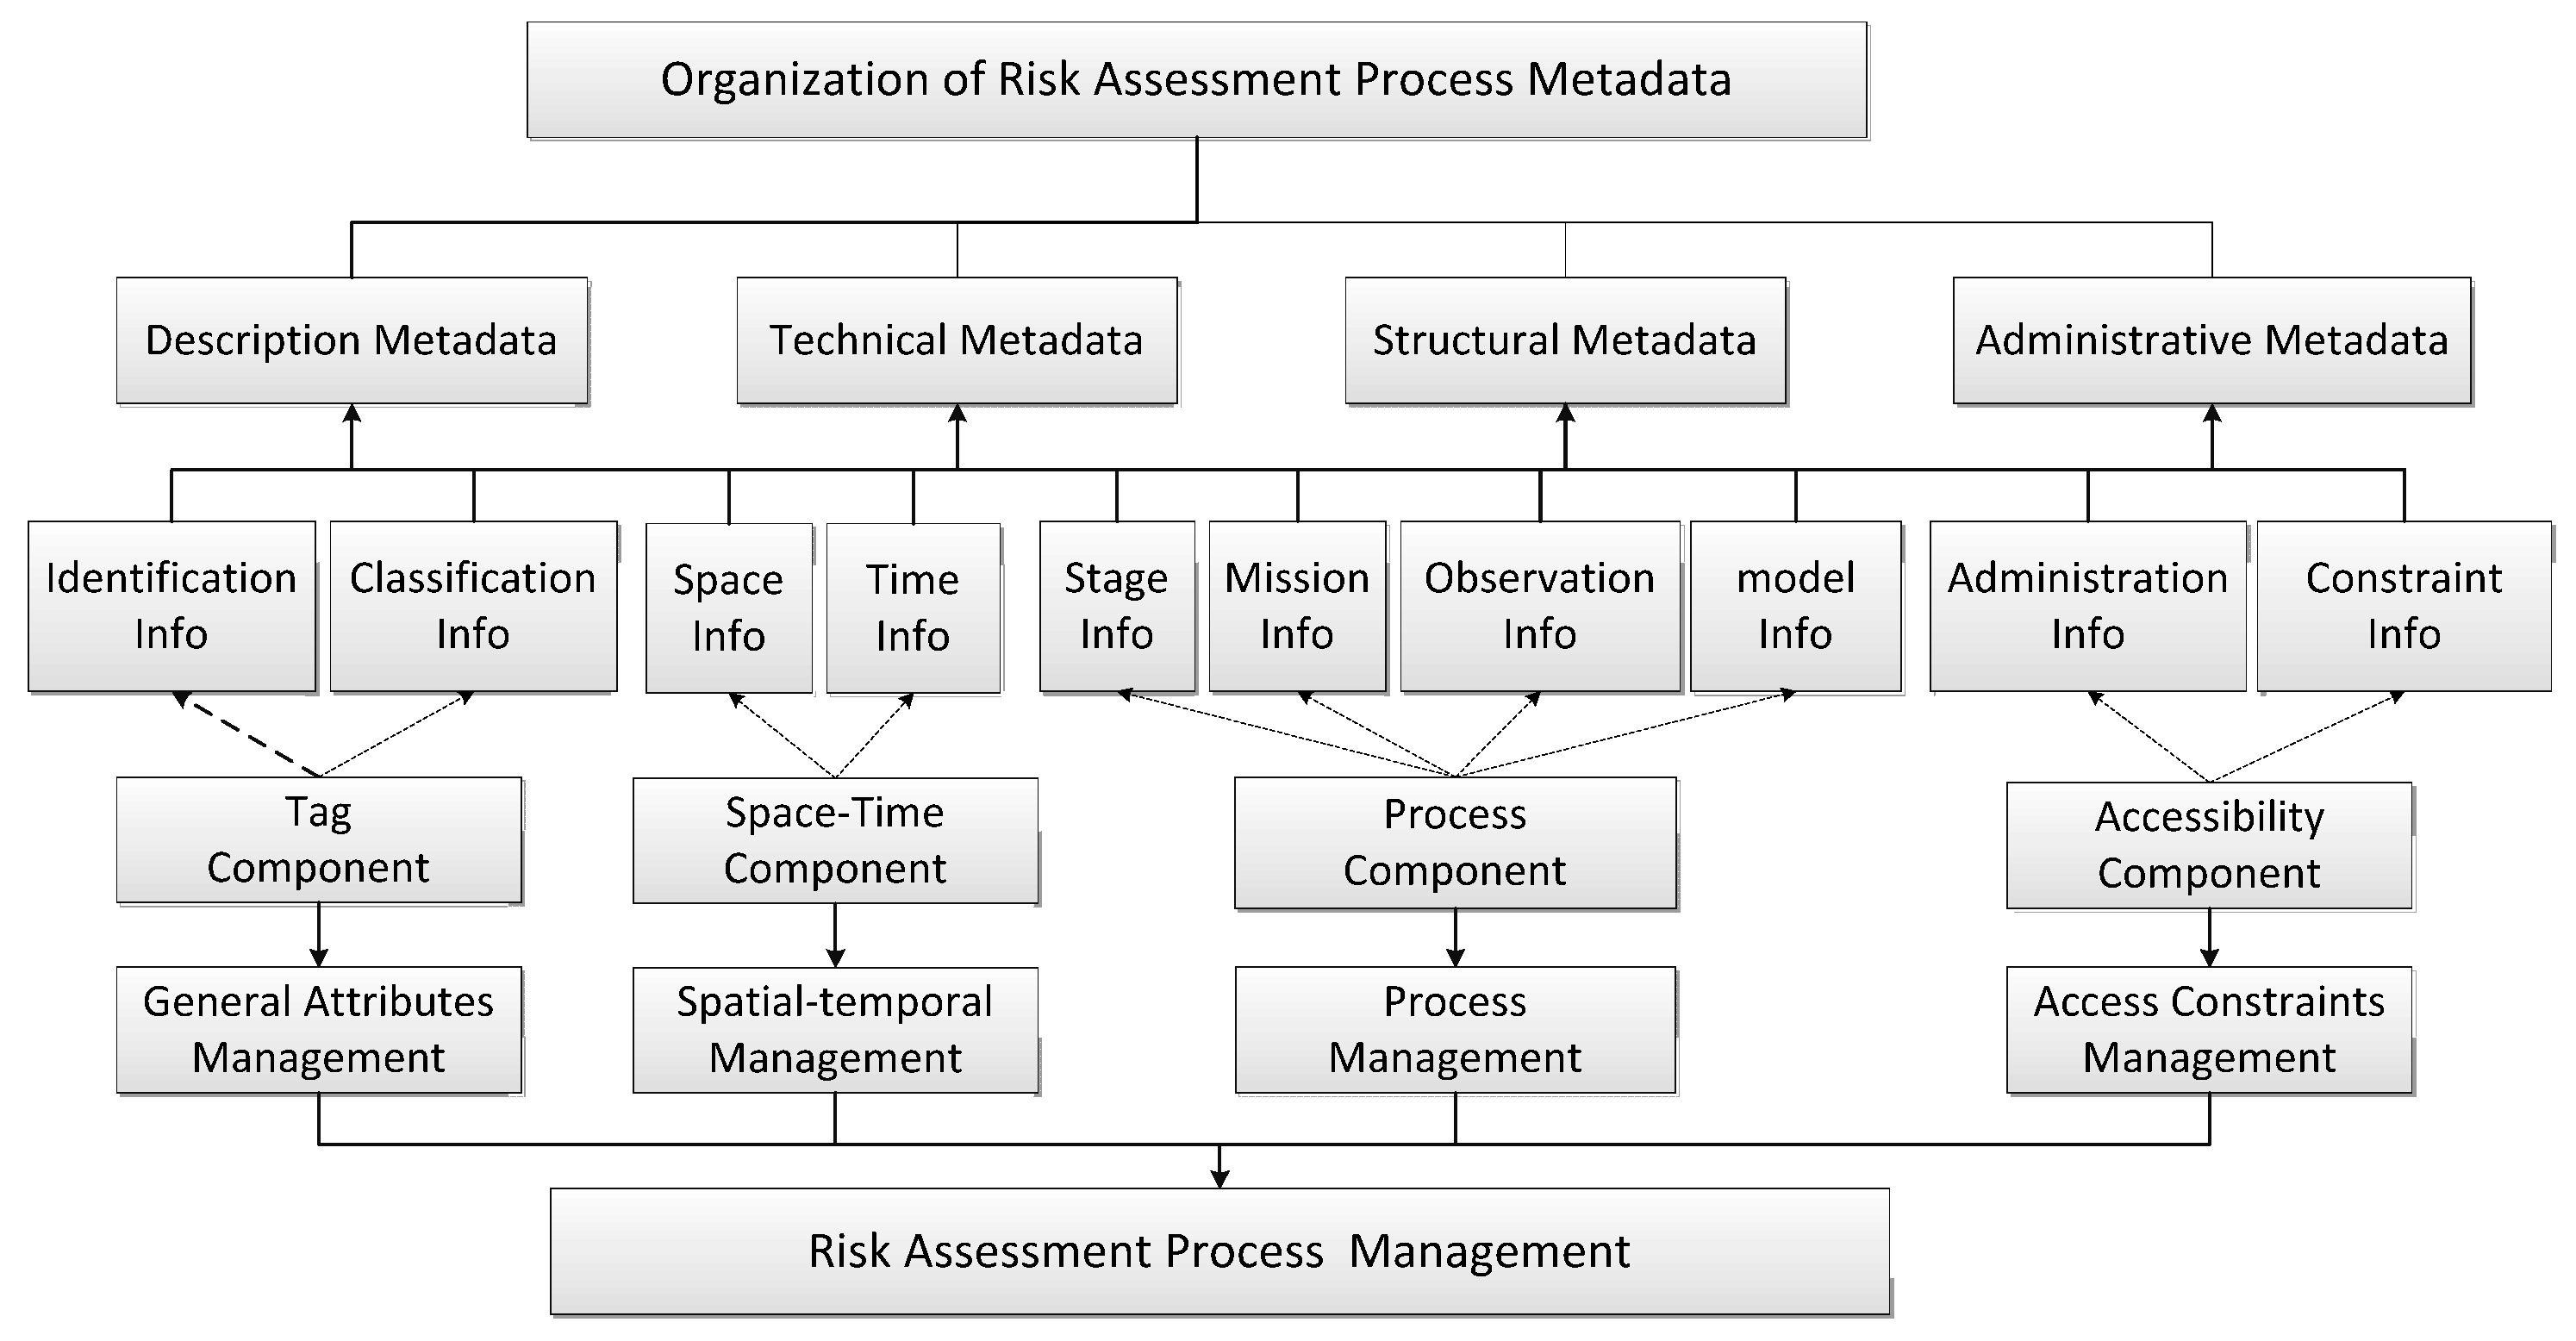
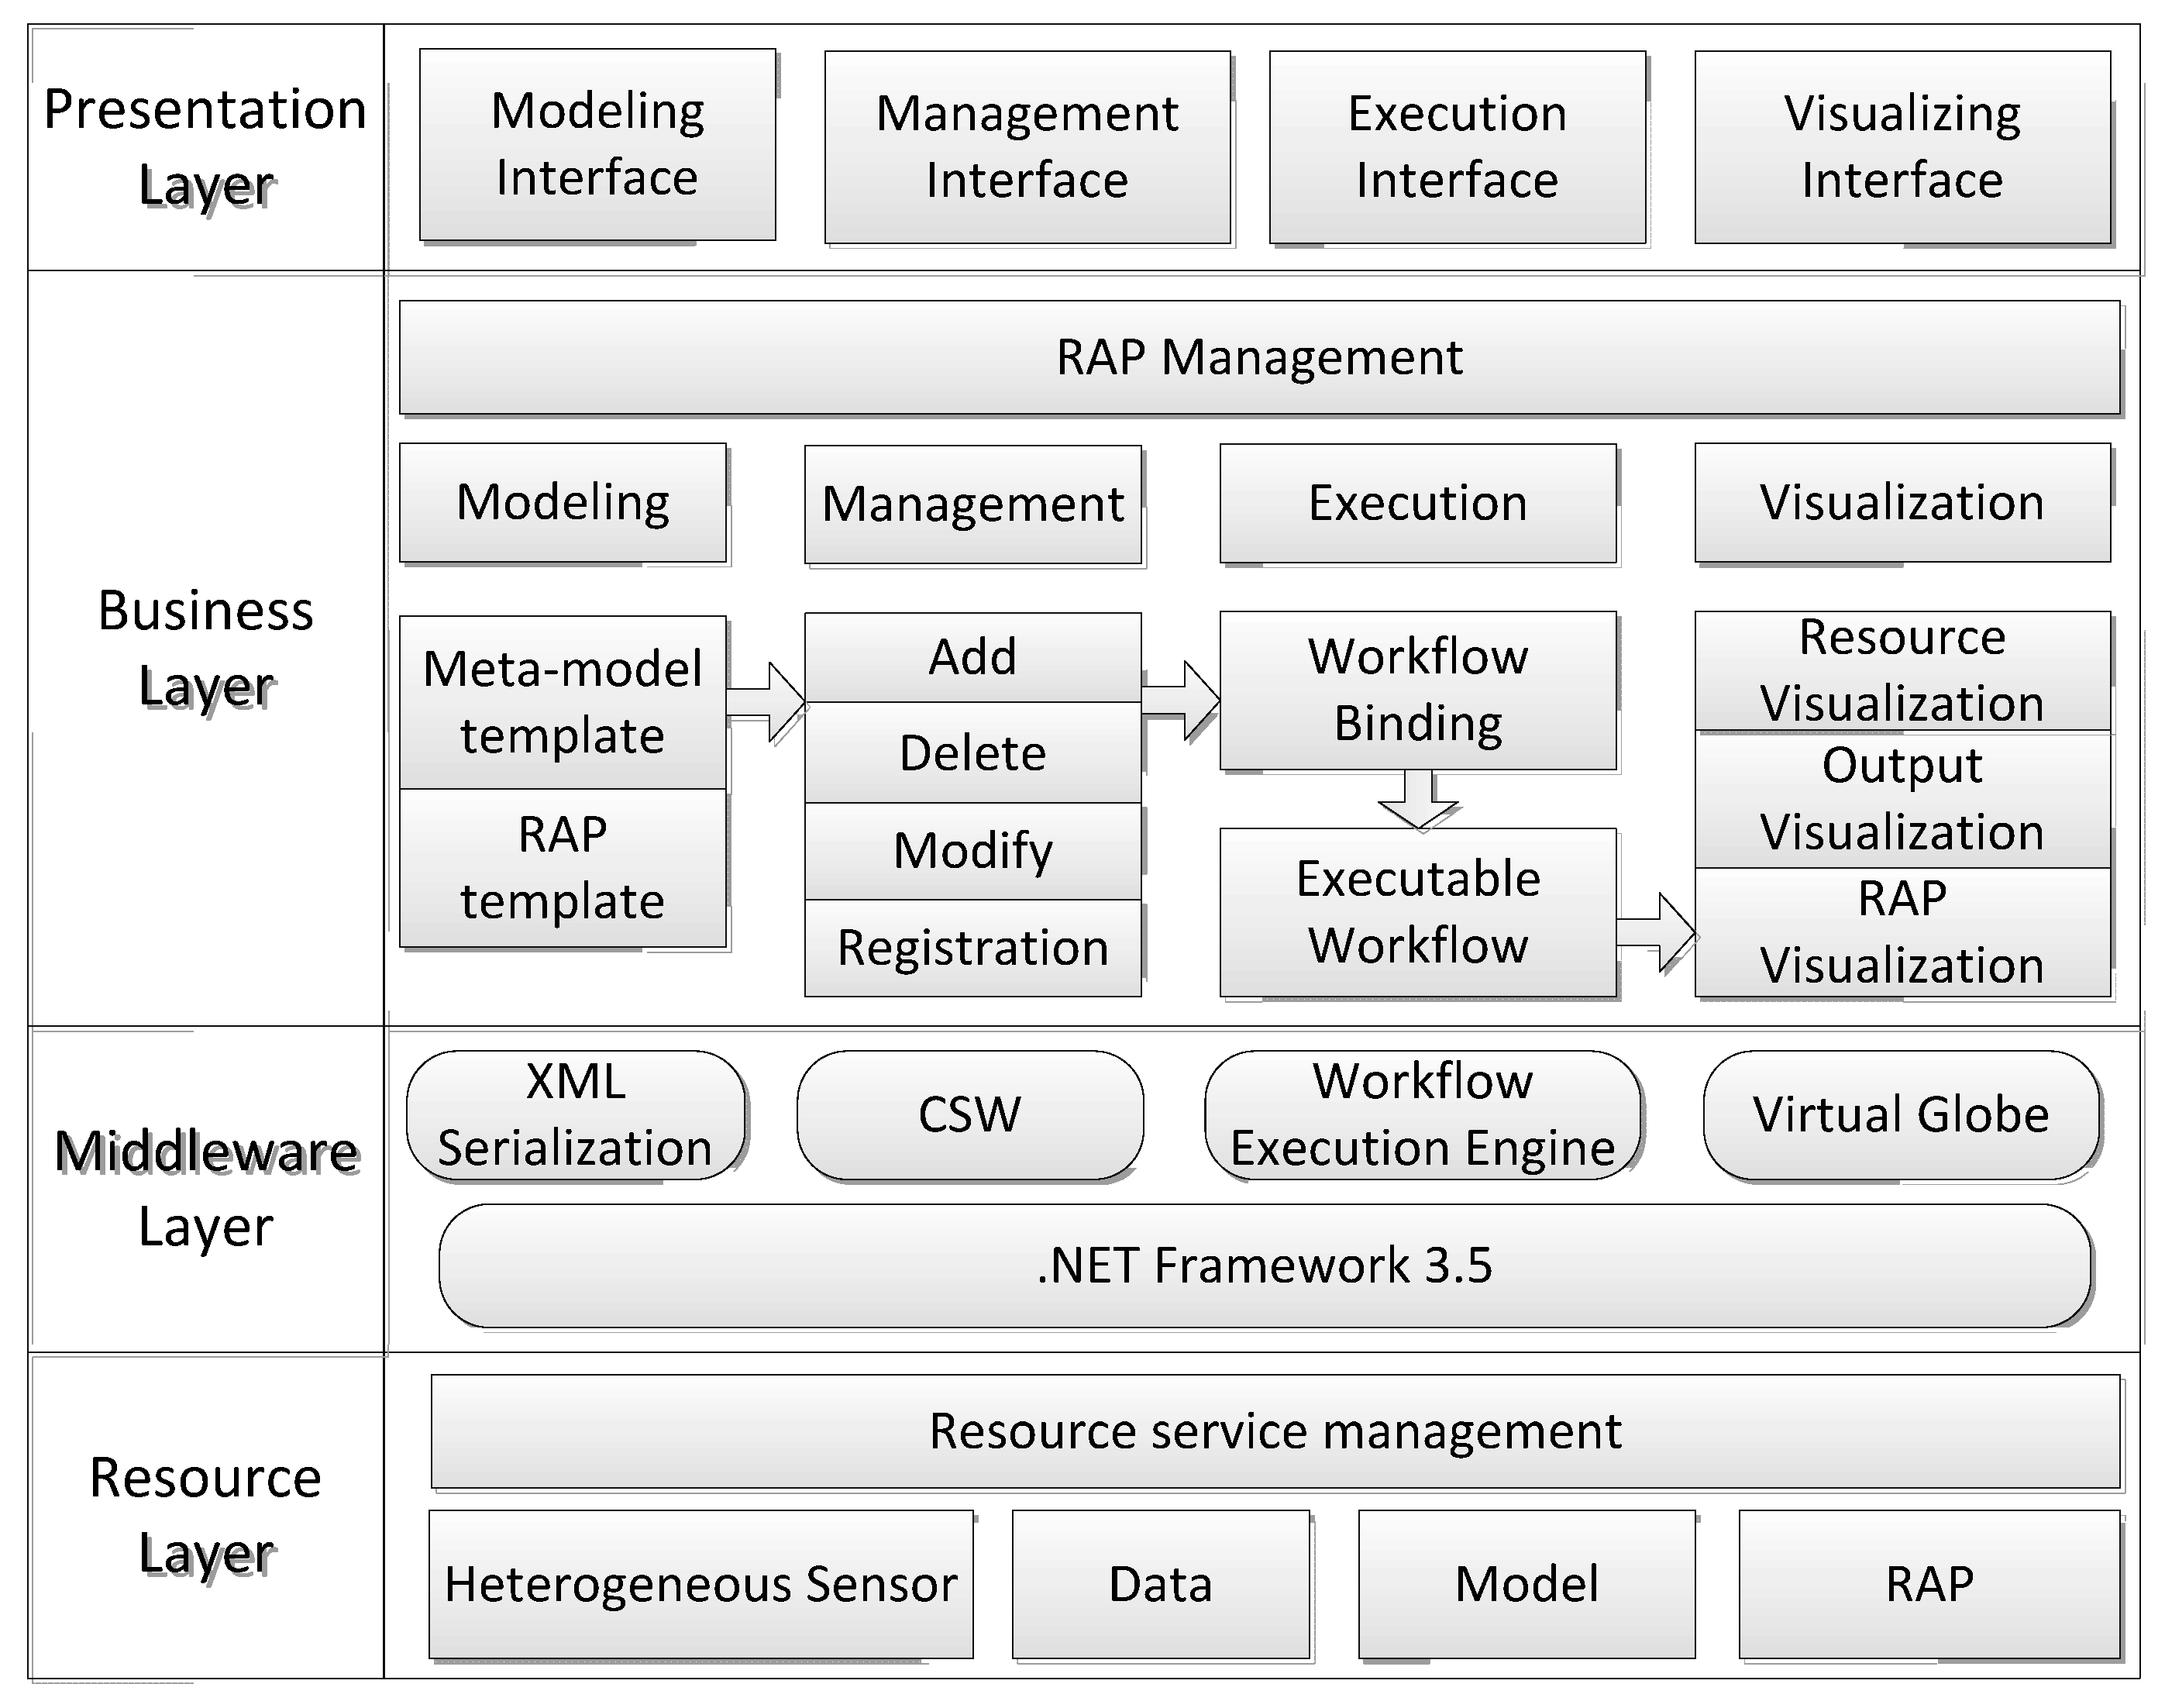
4.1. System Architecture and Components

A prototype system known Risk Assessment Process Management (RAPM) was designed to provide a common tool for the modeling, management, execution, and visualization of the RAP meta-model based on the proposed RAP modeling method. As shown in Figure 8, the architecture of the RAPM system is divided into four levels: resource, middleware, business, and presentation. The resource layer contains heterogeneous sensors, related data including geographic information data and feature data, evaluation models, and workflows. All resource services are stored in the model file in XML format to provide services to the upper layer. These services are registered in CSW and are managed by the registration center. The middleware layer contains XML serialization, CSW, the workflow execution engine, and a virtual globe. This layer is responsible for completing the mapping from resources services to specific functions. The business layer is the core of the system and provides a series of functions, including modeling, management, execution, and visualization, in addition to operations for achieving RAP management. The presentation layer provides a set of graphical user interfaces that can be employed to communicate and interoperate with the system and to conduct the business and operations defined in the business layer.
The system is composed of four main functions: modeling, management, execution, and visualization. The modeling module provides a visual interface and wizard tool for rapid modeling of the RAP based on specific information and the process meta-model templates. RAP modeling is shown in Figure 9. Through this interface, the user can supply RAP service information organized as description information of a process meta-model. After supplying the information, a description document of the RAP in XML encoding can be created by serialization XML schema technology. The management module provides functions including adding, deleting, modifying, and registering to manage a series of RAPs. The created RAP can be operated by the management interface and registered in the registration center. The execution module completes the mapping from workflow binding to an executable workflow. A concrete executable workflow can be achieved by executing the interface. The visualization module provides resource visualization, output visualization and RAP visualization. A series of resource services, the outputs from each stage, and the results of RAP can be visualized on virtual globes.

4.2. RAP Modeling for Gas Leakage

For the simulation of RAP modeling, we placed approximately 200 hypothetical gas pipeline pressure sensors in southern Taiyuan’s main urban area in China. In addition, we accessed data from approximately 20 meteorological stations and 6000 mobile base stations in main urban areas; the data were provided by the SOS. Real-time gas pipeline pressure data, meteorological data, and mobile base station data were acquired by a GetObservation request, and the observations were taken as the inputs to the observation component from the meta-model. Additionally, we integrated risk assessment models for gas leakage, and we provided a RAP service in the form of a process chain by SensorML. A 500 mm diameter medium pressure gas pipeline with a daily operating pressure of approximately 0.45 Mpa–0.5 Mpa was used as a main transportation gas pipeline. In this study, we simulated pressure sensor anomalies detection from 7:59 to 8:00 p.m. A change in the operating pressure indicated the occurrence of a gas leakage event. The gas temperature was 287 K in the pipeline, and the latest meteorological sensors provided a wind speed of 4 m/s at the time of the simulated gas leakage event. We determined a population density of approximately 2500 people per km near the gas leakage location based on real-time mobile base station data.

4.2.1. RAP Modeling Based on Observations

RAP modeling for gas leakage based on observations was conducted before the event. A RAP based on observations can quickly identify UHEs and can also determine the uncertain model parameters in the assessment process. The pressure sensor is described as the starting point of the RAP execution to indicate whether a disaster has occurred. Spatio-temporal information from the gas pipeline pressure sensor is automatically transmitted to the spatio-temporal properties of the meta-model to determine the approximate spatio-temporal extent of a UHE. Each time new data were entered, the start time and space data were the same, whereas the end time value was refreshed. Then, the RAP ID, name, description, and classification information were added, and administration and constraint information were input. The RAP meta-model was developed on the basis of these parameters. The results of the modeling were registered in the registration center after all of the information had been obtained. The registered meta-model can be modified and deleted by the management module in the future. Finally, the mission was input into a process chain based on the risk assessment requirements and the matching models, and model-related data, including address, input, output, parameters, process methods, and other information, were input in the model template dialog box. The output of each assessment stage was used as the input of the next stage throughout the entire RAP. However, the process chain could not be directly analyzed and executed by a driven execution engine; it must be instantiated to a specific instance of the process chain (i.e., all flows and nodes are mapped to specific implementation).

4.2.2. RAP Execution

RAP execution was conducted when the event occurred. The RAP is described only as an abstract process chain of risk assessment and cannot be executed. For a specific simulated UHE, it was necessary to instantiate an abstract RAP to achieve immediate risk assessment. The instantiation process achieves the specific risk assessment model binding and data services linking to form an executable chain service. The process chain instantiation is shown in Figure 10. The model information was bound into the executed model service. Service parameters were passed to the model service by the address, and the model service was then initiated. Finally, the RAP received the calculated results and entered the next sub-process. Additionally, SOS can provide real-time sensor monitoring data through the GetObservation Interface in data services linking. The service instantiation sequentially executed each sub-process until the entire RAP service implementation was completed. The implementation of sub-processes was monitored simultaneously.
The gas leakage event was detected through abnormality monitoring. The pressure sensor is composed of two types of sensors: gas pipeline pressure sensors and gas concentration sensors. When both sensor types simultaneously received abnormal values, we were able to identify the gas leakage event. We simulated the gas leakage as occurring from 7:59 to 8:00 p.m. on 21 May 2016. The gas pipeline pressure value was abnormal at 0.1 Mpa, and the gas concentration sensor was 10.12 Kap; the normal value range is 1.5 Kap–2.5 Kap. The temperature of the gas pipeline was 287 K, and leakage time was determined in 60 s according to the frequency of the sensor data reception. On the basis of the monitoring parameters such as pressure and gas density in addition to leakage time, the amount of leakage gas could be calculated by model binding of the small hole model or the fracture model in the sensing stage. The flow rate of the leaking gas, calculated to be 54.2 kg/s, was input in the next stage.
In this study, three secondary events of gas leakage, including gas diffusion, fire, and vapor cloud explosions, were discussed in the recognition stage. The risk region was recognized by the corresponding three models: Gaussian diffusion, fire, and vapor cloud explosion models, respectively. The wind speed was 4.0 m/s at the time of the gas leakage, and the direction of the meteorological monitoring data was required as model input parameters to help to determine the gas diffusion direction and the concentration near the gas leakage location. Additionally, we were able to output a sphere of fire and explosion based on the flow rate of the leaking gas in the preceding stage. The specific results of risk assessment in the recognition stage are shown in Figure 11.
In the analysis stage, the fatality rate caused by secondary events, including poisoning, thermal radiation flux, and shock waves, was analyzed and calculated on the basis of the risk scope of these events. The output formed the basis for the calculation of individual and social risks in the next stage.
Finally, the results of individual and social risk assessments were output in the evaluation stage. Individual risk was calculated to generate a contour surface map based on the possibility and fatality rate of secondary events. Social risk was calculated from individual risk and the real-time population density, which was determined to be 0.0025 persons per square meter. The assessment result of the number of deaths was calculated to be 25.97 persons. The frequency of the pipeline accident was 5.75 × 10⁻⁴ per year. The social risk criteria (F–N) curve is shown in Figure 12. The horizontal axis depicts the number of deaths, and the vertical axis depicts the frequency of the pipeline accident. We can specify the acceptable area as social risk criteria according to the actual needs. As shown in Figure 12, we determined that the generated social risk was not acceptable and that appropriate measures must be used to reduce the risk.
In the experimental scenario, we simulated a gas leakage event in the southern main urban area of Taiyuan, China, and implemented a RAP for gas leakage based on the four stages (sensing, recognition, analysis, and evaluation). We achieved complementarity between multi-source sensors and risk assessment models, determined the uncertain model parameters by sensors in different assessment stages, and immediately executed the entire RAP. The experimental results included the recognition of three potential secondary events, the analysis of the fatality rates of the three potential events, and the evaluation of individual risk and social risk in the area near the leaking pipeline. The results of social risk assessment indicated an unacceptable risk that required related measures to be taken immediately and potential sources of risk to be appropriately disposed.

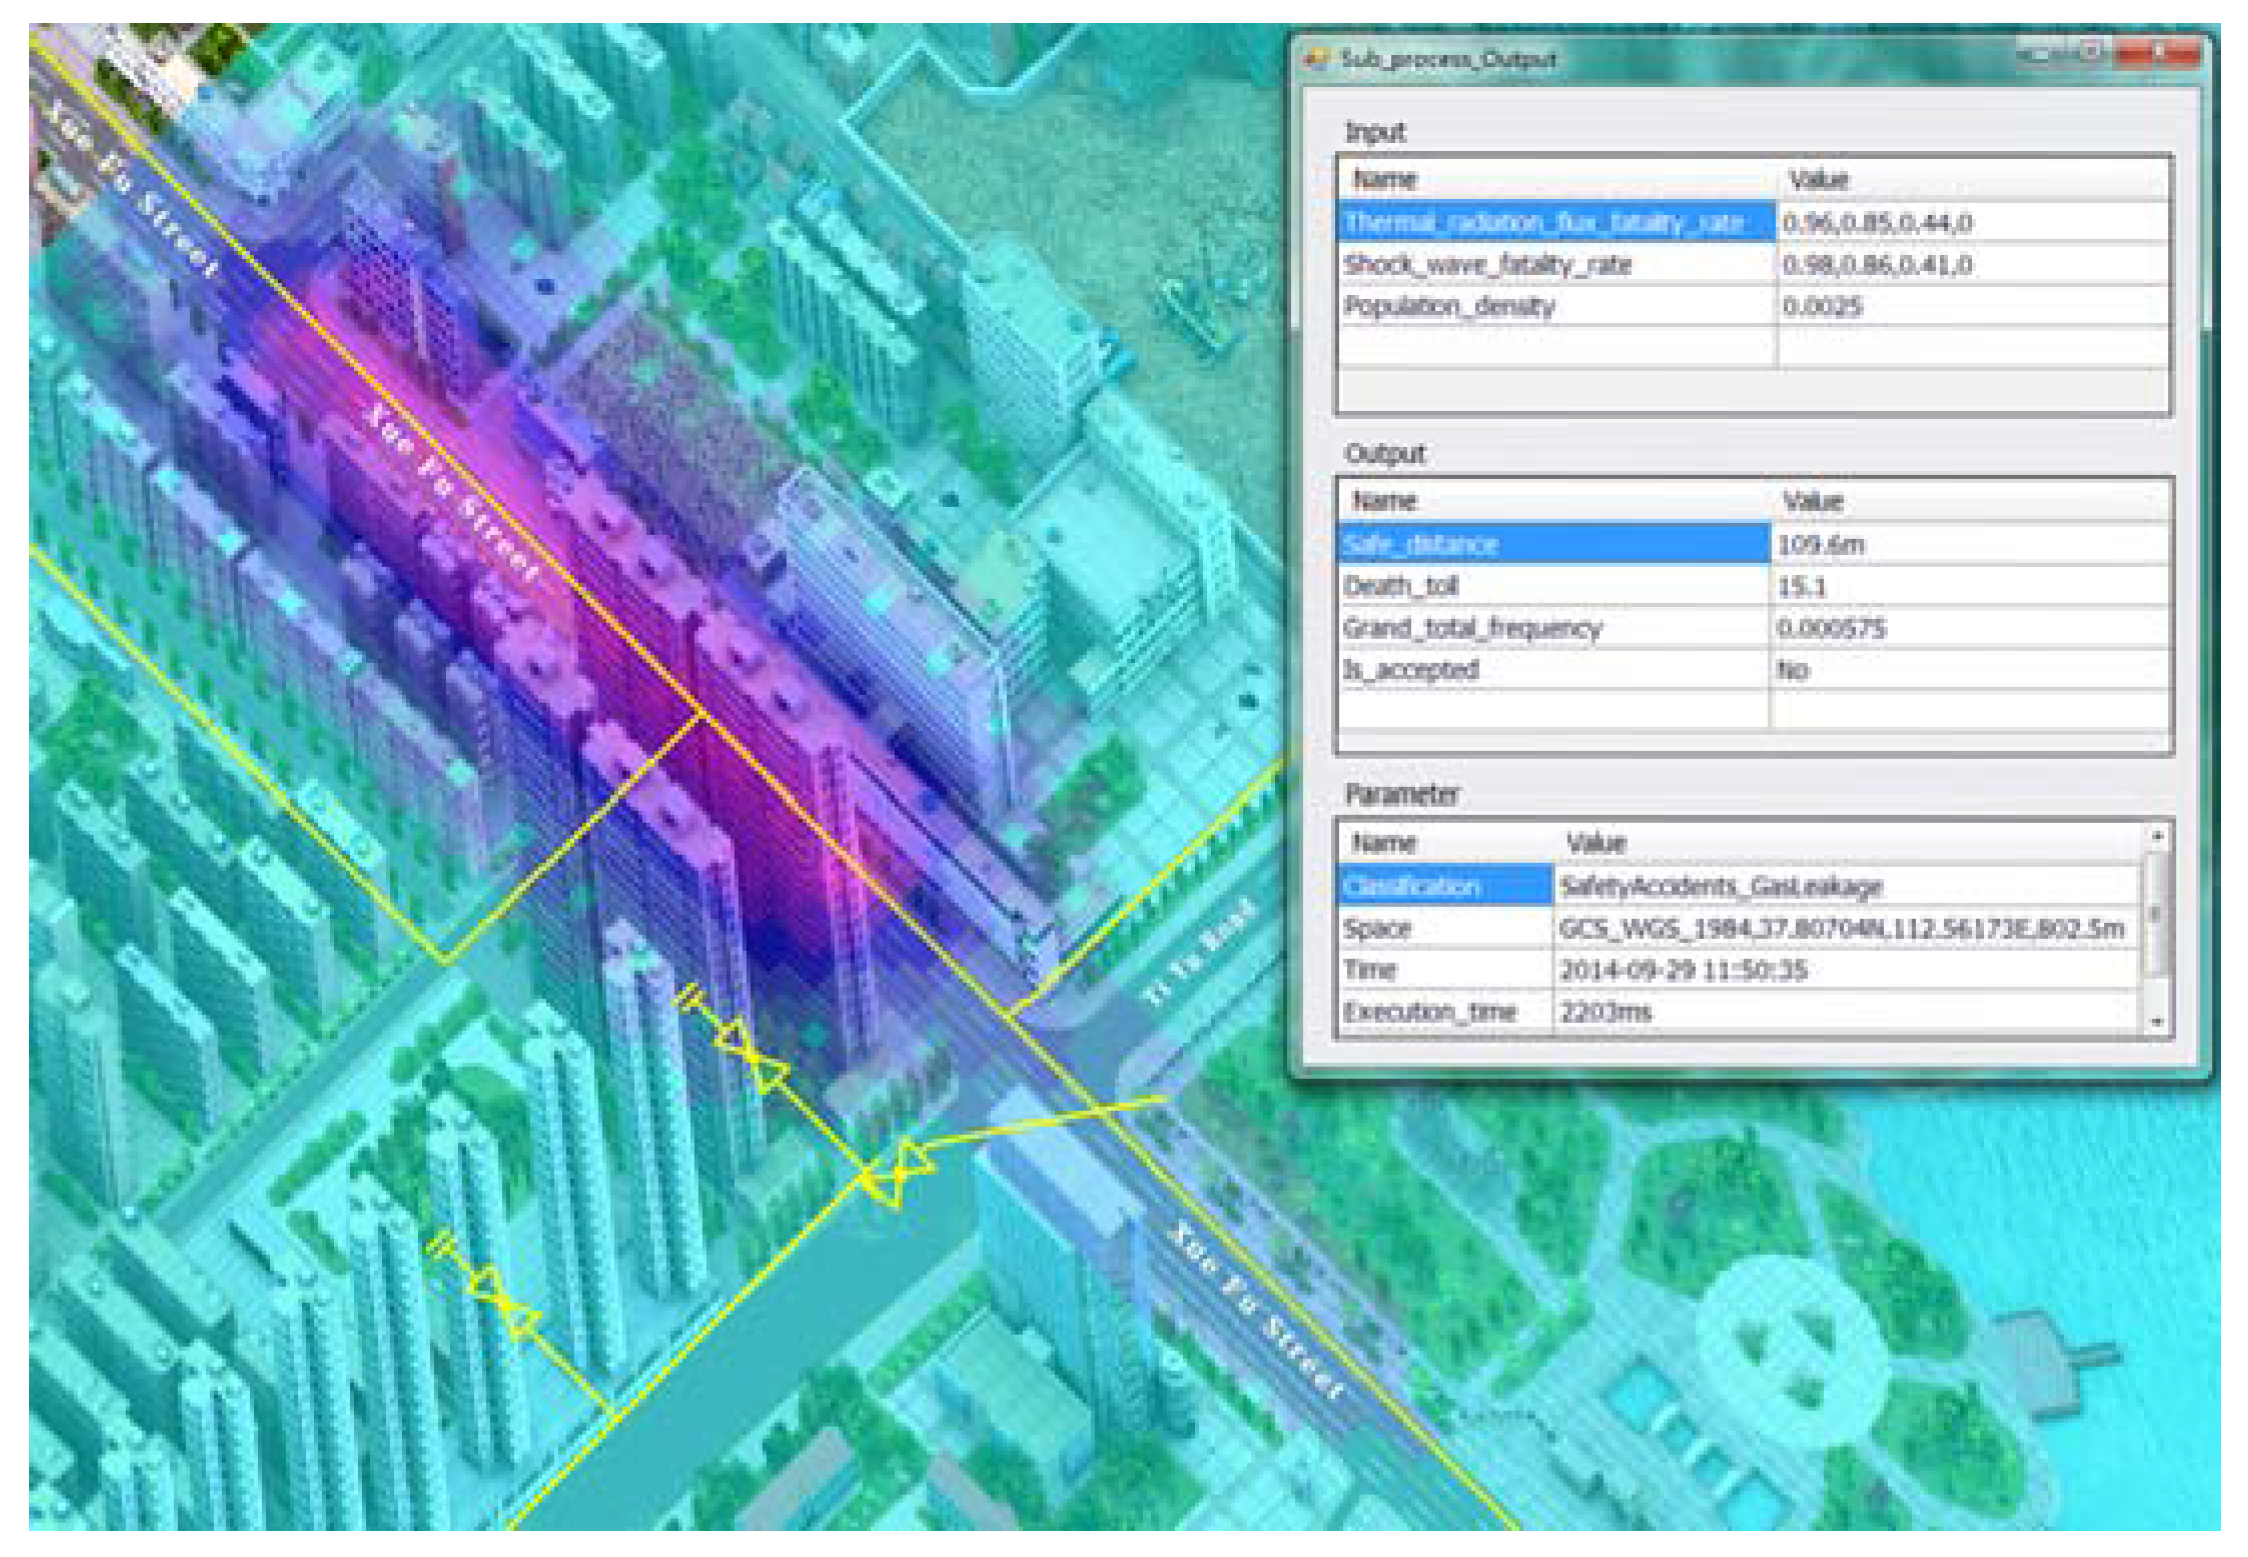
4.2.3. RAP Visualization

In this study, the output of each stage in an entire RAP was visualized by three-dimensional (3D) GIS technology and animation technology based on a virtual globe to help managers gain an intuitive understanding of UHE trend prediction. The virtual globe provided by the system supports both 2D and 3D graphic images. To highlight the results of risk assessment, we selected the 2D graphic images. The visualization module provided three types of visualizations of UHE monitoring and its RAP: (1) visualization of sensor information and its surrounding environment; (2) visualization of event information and secondary events; and (3) visualization of stage-based assessment results. The three types of visualizations were used in the entire RAP.
In the sensing stage, gas pipeline pressure sensor information (including type, value, space, time, and frequency) was visualized. When the gas leak occurred, the output of the stage evaluation was the mass of the leaked gas. Event information and event severity were visualized to reflect the mass of the leaked gas in a 3D scene. In the recognition stage, information on secondary event prediction, such as gas diffusion, fire, and vapor cloud explosions, was determined, as shown in Figure 13. The gas diffusion was visualized onto a 2D contour map, and explosions and fires were visualized into a dynamic 3D model based on particle system technology. The spatial scope of secondary events risk, as the output of the stage evaluation, was displayed on the map as features. In the analysis stage, the spatial distribution of the facility rate that corresponded to the three types of secondary events was visualized in the contour surface map. In the evaluation stage, the calculation results of individual and social risks were displayed with overlaid gas pipeline data and aerial image data. The evaluation of individual risk with a contour surface map is described in Figure 14.

5. Discussion

5.1. Risk Assessment Process Based on Sensor Web Environment

We developed an immediate RAP modeling method based on SWE. Compared with existing immediate RAP methods such as the GIS-based generic real-time risk assessment framework [7], which depends on a single sensing device, the proposed method in this paper is based on SWE, which achieves the integrated management of multi-source heterogeneous sensor data to make up the facility, meteorology, population density and other uncertain model parameters in the location of an UHE. Sensor observations and sensor processing workflow were bound as input parameters of sub-processes in all phases of the RAP and could determine some uncertain model parameters of a RAP. Gas pipeline pressure sensors determined the time, intensity and location of the simulated gas leak; those were the uncertain parameters from the small hole model. Meteorological sensors determined uncertain parameters (wind speed and direction) of the Gaussian diffusion model to calculate the direction and range of diffusion. Mobile base station data determined the population density for the social risk assessment model. In addition, they were useful for improving the execution efficiency of the RAP. Direct disaster-inducing factors from heterogeneous sensors were described to discover RAP services that were the basis of the RAP. They indicated whether the abnormal observed values would lead to a UHE. If so, physical impacts and spheres of influence would be recognized based on observations such as meteorological data in the recognition stage. Real-time population density could be provided to determine the social risk assessment model as input parameters in the evaluation stage. Heterogeneous sensor nodes played an important role in the entire RAP. Therefore, the RAP based on spatio-temporal observations could determine the uncertain model parameters in RAPs and achieve immediate RAPs. However, the uncertainties of sensor data and how they propagate in the execution of a RAP chain have not been adequately considered in this paper.

5.2. Risk Assessment Process Chains for Comprehensive Integration of Urban Information Resources

We developed an immediate RAP in the form of a process chain based on SensorML. Compared with traditional quantitative RAP methods, such as the ARAMIS method [6], which achieves only a delay RAP based on limited information and models, cannot provide immediate decision support for emergency responses. The method proposed in this paper achieved a RAP chain by integrating numerous urban information resources, including observation services, risk assessment models, and historical archive information, which were classified and managed to facilitate the efficient integration of information resources. These information resources were integrated into a RAP with four stages: sensing, recognition, analysis, and evaluation. These information resources are regularly described in a RAP according to the assessment mission requirement at different stages. An executable RAP was produced by the procedure, including abstract process information description, instantiation of the process, and process execution. For a variety of UHEs, we can monitor risk sources, quickly discover risk sources, immediately assess potential risks and their impact, and share the results of the risk assessment at each stage to provide decision-making support for decision-makers. However, due to the integration of observation services, models, and RAP services, the system’s computational complexity and storage resource requirements also increase. The RAP chain method was established as a static modeling method to be used before a UHE. However, the occurrence of a hazard event often tends to have particularities with accidental factors, which influence the efficiency and accuracy of the RAP chain. This is the greatest limitation of the RAP modeling method. In the future, we will focus on the dynamic modeling of a RAP for accidental factors during a UHE.

5.3. Expandability of the Risk Assessment Process

We developed an extensible meta-model architecture based on MOF and the integrated management of a variety of RAPs using a 10-tuple information description structure. Compared with traditional RAPs, which depend on restricted information and solve a single urban problem, the proposed approach has an expansion mechanism of the assessment resources and other UHE applications. The currently used RAPs are often based on limited information resources that cannot support information resource expansion mechanisms. On the basis of the RAP modeling experiment, a RAP meta-model was established that integrates a variety of information resources in a unified framework for the assessment and prediction mission of an urban gas leakage event. The general properties of these RAPs were organized by a 10-tuple information description structure that provided general characteristic information for risk assessment. Other service resources, including sensor observations and model services, can be bound by modifying the mission, observation, and model information from the 10-tuple information description structure. Thus, the information resources of a RAP are expandable.
Furthermore, the RAP modeling method can be extended to other applications. RAP meta-model description information is similar, except for the process information, which provides mission, observation, and model binding information. An additional UHE application is a RAP for floods. Observation information from 10-tuple information contains data on water levels, rainfall, and population density. Model information from 10-tuple information includes models for water level prediction, flood areas, and social risk assessment. The flood RAP includes water level prediction, flood forecasting, flood area recognition, analysis of fatalities, and social risk assessment according to the different requirements at different assessment stages. Therefore, the RAP method can be extended to other UHE applications, which requires further study.

6. Conclusions

For increasingly frequent UHEs, real-time monitoring and immediate RAP play increasingly important roles in the prevention and mitigation of hazards. In addition, the uncertain model parameters in a RAP are the main constraints of the efficiency of RAP execution. In this study, we proposed a RAP modeling method with a 10-tuple information description structure to abstract characteristic information of the RAP and to integrate the management of multiple RAPs. On the basis of four assessment stages, we achieved rapid aggregation of observation and model services, immediate execution of a RAP, and visualization of risk assessment results. Finally, gas leakage was simulated as an example to test the feasibility and scalability of the RAP modeling method. The results demonstrate that the RAP modeling method can achieve immediate risk assessment through the integrated management of numerous sensor observation and model services. At present, we can determine only some uncertain model parameters in a RAP by sensor observation. The spatial and temporal uncertainty of data and the spreading mechanism will be the focus of our future research. In addition, the four-layer architecture for the RAP meta-model and the 10-tuple information description has been verified with good scalability.
We are committed to establishing an immediately executable RAP and achieving the integration of numerous information services. However, the quality of service for RAPs has not been discussed in this paper. With the integrated management of millions of sensors and model services, the execution efficiency of a RAP chain will show an inevitable decline in the future. The effective connection of a large-scale sensor network and information services into the cloud is an additional topic for future research.

Acknowledgments

The work was supported by National Natural Science Foundation of China (NSFC) program (Grant No. 41601406), National High-tech R & D Program of China (863 Program) (Grant No. 2013AA01A6-08) and China Torch Program (Grant No. 2012GH722002).

Author Contributions

Chuanbo Hu designed the method and wrote the paper. Nengcheng Chen and Wei Wang designed the experiments. Changjiang Xiao and Shan Jia implemented the RAPM system.

Conflicts of Interest

The authors declare no conflict of interest.

Abbreviations

The following abbreviations are used in this manuscript:
UHEUrban Hazard Events
RAPRisk Assessment Process
MOFMeta Object Facility
OGCOpen Geospatial Consortium
SOSSensor Observation Service
WPSWeb Processing Service
WFSWeb Feature Service
WCSWeb Coverage Service
CSWCatalogue Services for Web
WMSWeb Map Service
IEMIntegrated Environmental Modeling
SDISpatial Data Infrastructure
MaaSModel as a Service
SensorMLSensor Model Language
RAPMRisk Assessment Process Management

References

  1. Gowland, R. The accidental risk assessment methodology for industries (ARAMIS)/layer of protection analysis (LOPA) methodology: A step forward towards convergent practices in risk assessment. J. Hazard. Mater. 2006, 130, 307–310. [Google Scholar] [CrossRef] [PubMed]
  2. Chen, N.; Du, W.; Song, F.; Chen, Z. FLCNDEMF: An Event Metamodel for Flood Process Information Management under the Sensor Web Environment. Remote Sens. 2015, 7, 7231–7256. [Google Scholar] [CrossRef]
  3. Purdy, G. ISO 31000: 2009—Setting a new standard for risk management. Risk Anal. 2010, 30, 881–886. [Google Scholar] [CrossRef] [PubMed]
  4. Luko, S.N. Risk management principles and guidelines. Qual. Eng. 2013, 25, 451–454. [Google Scholar] [CrossRef]
  5. Aven, T. On the new ISO guide on risk management terminology. Reliab. Eng. Syst. Saf. 2011, 96, 719–726. [Google Scholar] [CrossRef]
  6. Salvi, O.; Debray, B. A global view on ARAMIS, a risk assessment methodology for industries in the framework of the SEVESO II directive. J. Hazard. Mater. 2006, 130, 187–199. [Google Scholar] [CrossRef] [PubMed]
  7. Antonioni, G.; Spadoni, G.; Cozzani, V. A methodology for the quantitative risk assessment of major accidents triggered by seismic events. J. Hazard. Mater. 2007, 147, 48–59. [Google Scholar] [CrossRef] [PubMed]
  8. Jiang, J.; Wang, P.; Lung, W.S.; Guo, L.; Li, M. A GIS-based generic real-time risk assessment framework and decision tools for chemical spills in the river basin. J. Hazard. Mater. 2012, 227, 280–291. [Google Scholar] [CrossRef] [PubMed]
  9. Calkin, D.E.; Thompson, M.P.; Finney, M.A.; Hyde, K.D. A real-time risk assessment tool supporting wildland fire decisionmaking. J. For. 2011, 109, 274–280. [Google Scholar]
  10. D’Alessandro, A.; Ubertini, F.; Laflamme, S.; Materazzi, A.L. Towards smart concrete for smart cities: Recent results and future application of strain-sensing nanocomposites. J. Smart Cities 2015, 1, 1–12. [Google Scholar] [CrossRef]
  11. Komninos, N.; Bratsas, C.; Kakderi, C.; Tsarchopoulos, P. Smart City Ontologies: Improving the effectiveness of smart city applications. J. Smart Cities 2015, 1, 1–16. [Google Scholar] [CrossRef]
  12. Kakderi, C.; Komninos, N.; Tsarchopoulos, P. Smart cities and cloud computing: Lessons from the STORM CLOUDS experiment. J. Smart Cities 2016, 2, 4–13. [Google Scholar] [CrossRef]
  13. Chen, J.; Sheng, H.; Li, C.; Xiong, Z. PSTG-based multi-label optimization for multi-target tracking. Comput. Vis. Image Underst. 2016, 144, 217–227. [Google Scholar] [CrossRef]
  14. Panori, A.; González-Quel, A.; Tavares, M.; Simitopoulos, D.; Arroyo, J. Migration of applications to the Cloud: A user-driven approach. J. Smart Cities 2016, 2, 41–52. [Google Scholar] [CrossRef]
  15. Delin, K.A.; Jackson, S.P. Sensor web: A new instrument concept. In Proceedings of the SPIE 4284, Functional Integration of Opto-Electro-Mechanical Devices and Systems, San Jose, CA, USA, 15 May 2001; pp. 1–9.
  16. Botts, M.; Percivall, G.; Reed, C.; Davidson, J. OGC sensor web enablement: Overview and high level architecture. In International Conference on GeoSensor Networks; Springer: Berlin/Heidelberg, Germany, 2006; pp. 175–190. [Google Scholar]
  17. Chen, N.; Hu, C.; Chen, Y.; Wang, C.; Gong, J. Using SensorML to construct a geoprocessing e-Science workflow model under a sensor web environment. Comput. Geosci. 2012, 47, 119–129. [Google Scholar] [CrossRef]
  18. Wang, W.; Hu, C.; Chen, N.; Xiao, C.; Wang, C.; Chen, Z. Spatio-temporal enabled urban decision-making process modeling and visualization under the cyber-physical environment. Sci. China Inf. Sci. 2015, 58, 1–17. [Google Scholar] [CrossRef]
  19. Liu, Y.; Gupta, H.; Springer, E.; Wagener, T. Linking science with environmental decision making: Experiences from an integrated modeling approach to supporting sustainable water resources management. Environ. Model. Softw. 2008, 23, 846–858. [Google Scholar] [CrossRef]
  20. Aspinall, R.; Pearson, D. Integrated geographical assessment of environmental condition in water catchments: Linking landscape ecology, environmental modelling and GIS. J. Environ. Manag. 2000, 59, 299–319. [Google Scholar] [CrossRef]
  21. Bastin, L.; Cornford, D.; Jones, R. Managing uncertainty in integrated environmental modelling: The UncertWeb framework. Environ. Model. Softw. 2013, 39, 116–134. [Google Scholar] [CrossRef]
  22. Wang, X.; Chen, N.; Chen, Z.; Yang, X.; Li, J. Earth observation metadata ontology model for spatiotemporal-spectral semantic-enhanced satellite observation discovery: A case study of soil moisture monitoring. GISci. Remote Sens. 2016, 53, 22–44. [Google Scholar] [CrossRef]
  23. Geller, G.N.; Turner, W. The model web: A concept for ecological forecasting. In Proceedings of the IEEE International Geoscience and Remote Sensing Symposium, Barcelona, Spain, 23–28 July 2007; pp. 2469–2472.
  24. Nativi, S.; Mazzetti, P.; Geller, G.N. Environmental model access and interoperability: The GEO Model Web initiative. Environ. Model. Softw. 2013, 39, 214–228. [Google Scholar] [CrossRef]
  25. Dubois, G.; Skøien, J.O.; de Jesus, J.; Peedell, S.; Hartley, A.; Nativi, S.; Santoro, M.; Geller, G. eHabitat: A contribution to the model web for habitat assessments and ecological forecasting. In Proceedings of the 34th International Symposium on Remote Sensing of Environment, Sydney, Australia, 10–15 April 2011; pp. 1–4.
  26. Chen, N.; Wang, X.; Yang, X. A direct registry service method for sensors and algorithms based on the process model. Comput. Geosci. 2013, 56, 45–55. [Google Scholar] [CrossRef]
  27. Auynirundronkool, K.; Chen, N.; Peng, C.; Yang, C.; Gong, J.; Silapathong, C. Flood detection and mapping of the Thailand Central plain using RADARSAT and MODIS under a sensor web environment. Int. J. Appl. Earth Obs. 2012, 14, 245–255. [Google Scholar] [CrossRef]
  28. Chen, N.; Hu, C. A Sharable and interoperable meta-model for atmospheric satellite sensors and observations. IEEE J. Sel. Top. Appl. Earth Obs. Remote Sens. 2012, 5, 1519–1530. [Google Scholar] [CrossRef]
  29. Atkinson, C.; Kuhne, T. Model-driven development: A metamodeling foundation. IEEE Softw. 2003, 20, 36–41. [Google Scholar] [CrossRef]
  30. Jo, Y.D.; Crowl, D.A. Individual risk analysis of high-pressure natural gas pipelines. J. Loss Prev. Proc. 2008, 21, 589–595. [Google Scholar] [CrossRef]
  31. Si, H.; Ji, H.; Zeng, X. Quantitative risk assessment model of hazardous chemicals leakage and application. Saf. Sci. 2012, 50, 1452–1461. [Google Scholar] [CrossRef]
  32. Ma, L.; Li, Y.; Liang, L.; Li, M.; Cheng, L. A novel method of quantitative risk assessment based on grid difference of pipeline sections. Saf. Sci. 2013, 59, 219–226. [Google Scholar] [CrossRef]
  33. Dong, Y.; Gao, H.; Zhou, J.; Feng, Y. Evaluation of gas release rate through holes in pipelines. J. Loss Prev. Proc. 2002, 15, 423–428. [Google Scholar]
  34. Lines, I.G.; Deaves, D.M.; Atkins, W.S. Practical modelling of gas dispersion in low wind speed conditions, for application in risk assessment. J. Hazard. Mater. 1997, 54, 201–226. [Google Scholar] [CrossRef]
  35. Ma, L.; Cheng, L.; Li, M. Quantitative risk analysis of urban natural gas pipeline networks using geographical information systems. J. Loss Prev. Proc. 2013, 26, 1183–1192. [Google Scholar] [CrossRef]
  36. Jo, Y.D.; Ahn, B.J. A method of quantitative risk assessment for transmission pipeline carrying natural gas. J. Hazard. Mater. 2005, 123, 1–12. [Google Scholar] [CrossRef] [PubMed]
  37. Jonkman, S.N.; van Gelder, P.H.; Vrijling, J.K. An overview of quantitative risk measures for loss of life and economic damage. J. Hazard. Mater. 2003, 99, 1–30. [Google Scholar] [CrossRef]
Figure 1. Four-layer architecture based on the Meta Object Facility (MOF) for a risk assessment process (RAP) meta-model.
Ijgi 05 00203 g001
Figure 2. Relationships among a risk assessment process (RAP) metadata components and 10-tuple information description.
Ijgi 05 00203 g002
Figure 3. Unified modeling language (UML) diagram of RAP for gas leakage.
Ijgi 05 00203 g003
Figure 4. Information requirements in different stages of the risk assessment process (RAP).
Ijgi 05 00203 g004
Figure 5. Mapping from the risk assessment process (RAP) description to sensor model language (SensorML).
Ijgi 05 00203 g005
Figure 6. Relationships among specific missions, observations, and models.
Ijgi 05 00203 g006
Figure 7. Calculation principle of the negative pressure wave equation.
Ijgi 05 00203 g007
Figure 8. Architecture of the Risk Assessment Process Management (RAPM) system.
Ijgi 05 00203 g008
Figure 9. Example of the interface of risk assessment process (RAP) modeling.
Ijgi 05 00203 g009
Figure 10. Process chain instantiation.
Ijgi 05 00203 g010
Figure 11. Risk assessment sub-process in the recognition stage.
Ijgi 05 00203 g011
Figure 12. Social risk criteria frequency and number (F − N) curve.
Ijgi 05 00203 g012
Figure 13. Recognizing the scope of three secondary events caused by gas leakage: (a) gas diffusion range based on real-time wind speed; (b) fire range at different damage levels; and (c) vapor cloud explosion at different damage levels.
Ijgi 05 00203 g013
Figure 14. Evaluation of individual and social risk using a contour surface map.
Ijgi 05 00203 g014

