1. Introduction
With advances in technology, the physical size of movement sensors decreased while, simultaneously, the capabilities increased significantly. This enables drastically improved data collection in many application areas. For example, recording and analyzing movement in team sports, such as soccer, is becoming of interest. Actual video technology allows passive capturing of the movement of all players during entire matches at high temporal and geospatial frequencies. Further meta-data can be added to reflect situational descriptions and context information.
Recorded movement trajectories of soccer matches are multivariate data and characterized by strong interdependencies and implicitly include tactical movement patterns. Nowadays, professional soccer clubs are hiring video analysts to inspect previous matches with the purpose of detecting vulnerabilities and improving their own team’s behavior. Video analysts seek and identify key scenes, based on their experience. These key scenes are selected to be representative and characteristic of a team’s general behavior. According to a German video analyst, this analysis takes up to three working days [
1]. Additionally, video analysts help to prepare for upcoming matches by manually inspecting recent matches of the next opponent. The time needed for such analysis is dependent on the
a priori knowledge of the typical opponent’s strategies.
Fully-automated methods are no alternative for the analyst, as soccer players and matches differ highly. It is not possible to automatically derive meaningful rules or patterns by pure statistical analysis approaches. Movement patterns are usually very flexible and need verification by domain experts. However, verification at the end of the analysis is only half of the potential of user integration. Visual analytics follows a human-in-the-loop approach and enables the analyst to steer the analysis techniques and interact with the results. Consequently, domain knowledge is included better by visual analytics than by pure automated analysis techniques.
In previous work [
2], we have proposed an approach for automated identification of interesting situations, providing a baseline for further exploration and analysis. However, there is no explanation for which situational characteristics resulted in the automatic identification of possibly interesting situations. Consequently, the identified interesting situations have to be manually investigated, and the characteristics have to be derived manually. To provide additional insights for interesting game situations, we propose a visual analytics workflow for interactive feature visualization enabling experts to understand the characteristics of situations. Our system can be seen in
Figure 1. Experts can interactively re-rank derived features or select combinations of features, based on which the computation of interesting situations is refined and the visualization refreshed. Within this work, we contribute:
a visual analytics workflow to support experts in exploring interesting characteristics of game situations,
the incorporation of semantically-meaningful features describing situational meta information,
an interactive visualization that enables interactive re-ranking of features and the search for new game situations based on similarity search.
Furthermore, we show the usefulness of our approach in a two-stage qualitative user study. Our approach includes significant further development of the workflow proposed by Janetzko
et al. [
2]. This is why we first evaluate the applicability of the workflow presented by Janetzko
et al. [
2] and then show the effectiveness of our approach. We evaluate our approach with the help of two soccer experts. The first expert has been an active soccer player for 24 years and has been working as coach for 10 years being currently employed by the German soccer club FCBayern München. The second expert has been an active soccer player for 19 years and is currently serving as an official referee. The intended users of our visual analytics approach are professional video analysts. These analysts are parts of the coaching team and assist the coaches in preparing team presentations or computing statistics. Video analysts are used to computer programs helping in their daily tasks, although the support from these systems is usually limited. Integrating visual analytics techniques with soccer analysis is a novel, promising approach and will positively influence the work of professional soccer analysts.
Figure 1.
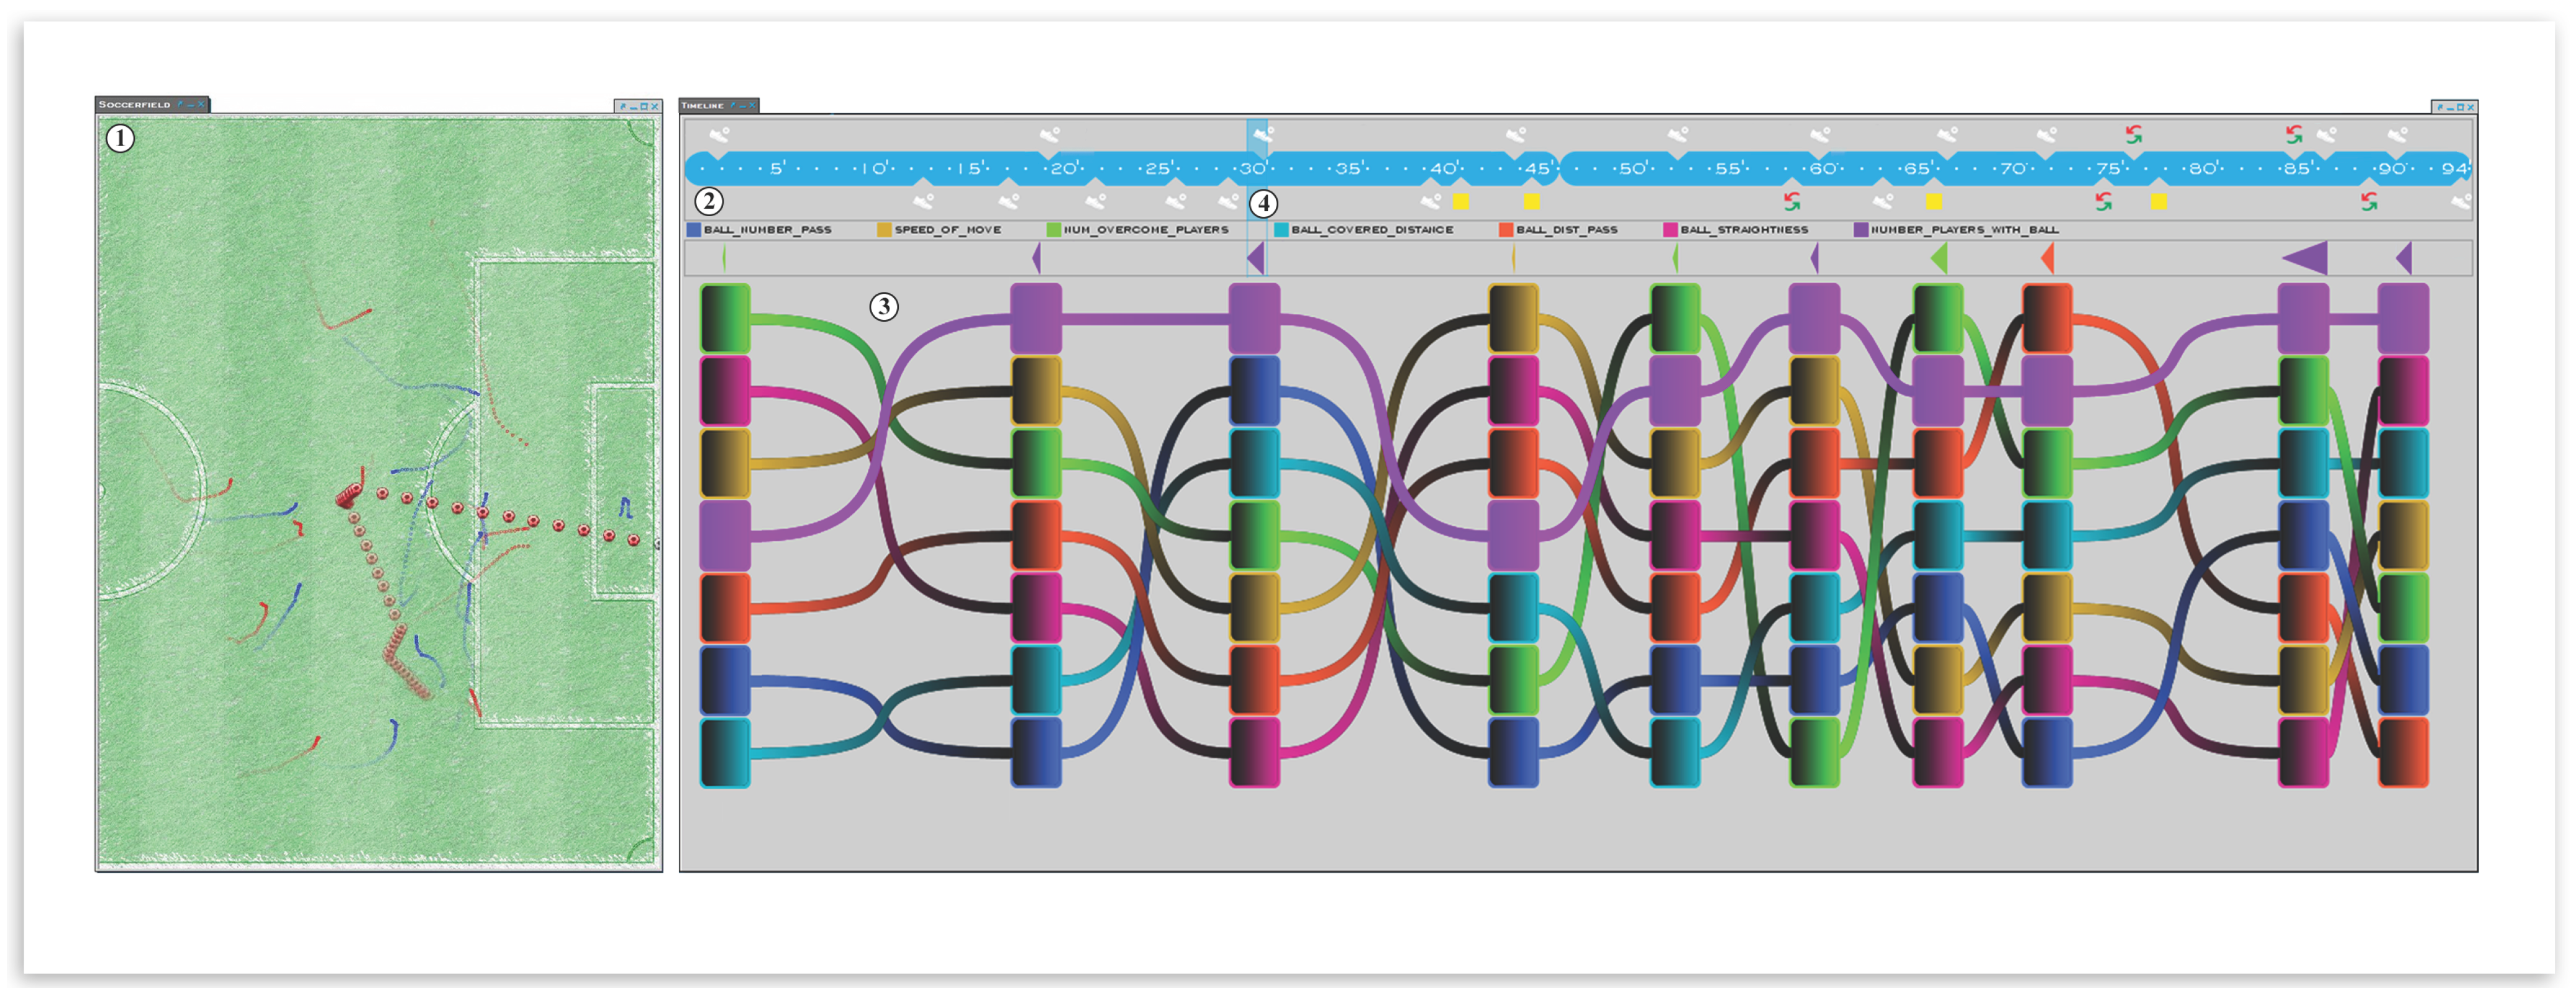
We display a teams’ situations of interest combined with their visualization of certain characteristics (features). On the left side is the soccer pitch (①), where the player and ball movement is displayed with the color of their teams. The timeline visualization (②) allows quick navigation and can be used to jump to any moment of a match. Semi-automatically-identified interesting moves and their characteristics are displayed in a flow-like visualization (③). For the currently-selected move (④), we immediately identify the highlighted purple-colored feature (the number of players that participated in an attack) as an outstanding semantic feature being almost always at the first or second ranked position.
Figure 1.
We display a teams’ situations of interest combined with their visualization of certain characteristics (features). On the left side is the soccer pitch (①), where the player and ball movement is displayed with the color of their teams. The timeline visualization (②) allows quick navigation and can be used to jump to any moment of a match. Semi-automatically-identified interesting moves and their characteristics are displayed in a flow-like visualization (③). For the currently-selected move (④), we immediately identify the highlighted purple-colored feature (the number of players that participated in an attack) as an outstanding semantic feature being almost always at the first or second ranked position.
The paper is organized as follows. First, we discuss related work in
Section 2. Then, we present our system with respect to our further developed workflow and derived design choices in
Section 3. In
Section 4, we demonstrate the applicability of our approach with the help of real-world examples, before showing the usefulness of our approach by a qualitative user study in
Section 4.3. We discuss the merits and limits of the presented approach and, furthermore, point out potential research directions for future work in
Section 5. Lastly, we conclude with a brief summary of the results in
Section 6.
2. Related Work
Our work relates and builds on work in sports analytics, feature-based analysis and visual analysis. We next detail selected works from these areas and delineate the contributions made here with respect to our previous work.
2.1. Knowledge Discovery for Sports Analysis
Recently, knowledge discovery methods have been applied to the analysis of large sports data. Classification approaches are often used where a classifier is trained to distinguish certain situations in a sports event. To that end, many methods of classification analysis are applicable, including decision trees, support vector machines or neural networks [
3,
4]. A recent work on analysis in sports is presented by Lucey
et al. [
5], where the authors developed a method to estimate the probability of a chance being successful in soccer. They discovered that besides the game phase (e.g., open-play, free kick), there are several factors that contribute to the probability of a chance, so-called strategic features. After the determination of such strategic features, which were identified by analyzing a whole season of player and ball tracking data, the features and a ten-second interval before the chance occurred are used to predict the outcome of the dedicated chance. It turned out that the classification error can be significantly decreased by involving features containing a semantic meaning. A recent approach was introduced by Rathod
et al. [
6], where the authors retrieve interesting events by a fuzzy inference system with an input of features and grass percentages, which are both extracted from key frames. Connecting semantically-valuable human expert knowledge to video content to automatically retrieve events with semantic information in sports is the topic of the proposed method by Xu
et al. [
7]. Besides a video broadcast, they use external sources, such as closed caption and webcast text, to detect interesting events and to gain the semantic information of these. Features extracted from audio sources, such as applause, are used by Xiong
et al. to retrieve and classify events of interest [
8]. A three-phase method consisting of background noise recognition, audio classification and post-processing results in two timestamps for the beginning and end of detected events. Their experimental results indicate a high classification accuracy of several sports and often a better result in comparison to other systems.
Besides approaches that are based mainly on an abstract data representation, also the visualization and visual analysis of sports feature data are of interest. One important work contributed by Perin
et al. introduces an interface to explore and analyze soccer data, as well as to communicate insights to others [
9]. The authors argue that a quantitative analysis with respect to the statistics of individual players or teams alone is not sufficient to understand a teams’ performance or the characteristic of a whole game or season. Their introduced system provides a series of connected visual representations of the whole game, as well as detailed game phases with the possibility to describe the events that occurred on a textual basis. By extracting phases and identifying groups of actions, they enable analysts to compare and visualize the phases and significant actions of a soccer game. An evaluation, consisting of different experiments, showed that experts are able to find new insights by comparing different phases and introducing and testing hypotheses of a soccer game using their introduced system.
Determining the efficiency of a team and its members, as well as the prediction of outcomes given a specific game context becomes valuable due to precise geo-spatial data and subtle analysis methods. Several methods have been applied to basketball, as well. Visualizing NBA players’ shooting habits is the goal of the method proposed by Miller
et al. [
10]. Their underlying data consist of the location of shot attempts and whether they were successful. As a basis, they model a player’s shooting attempt as a point process. This allows the application of stochastic processes to enable an estimation regarding the probability of a made shot for each spatial point, as well as for each individual player. As a result, their approach is able to compare NBA players’ shooting efficiency and to visualize the shooting habits, which is useful information for a defending player. A framework proposed by Dan Cervone
et al. allows the quantitative evaluation of the decisions a player made during a basketball match [
11]. By discretization of all possible actions a player possessing the ball has, at a specific point in time given the spatial configuration of players and the ball, the presented model computes a conditional expectation. This enables the comparison of players regarding decision making, as well as a semantical characterization of a basketball player. Similarly, a fine-grained spatial model presented by Yue
et al. is able to predict near-future events by learning semantically-meaningful representations [
12].
2.2. Features for Spatial Analysis and Feature Selection
The analysis of movement data is a task within geo-temporal data analysis. Movement happens within time and space and can be described in the first place by position as a function of time, giving rise to 2D or 3D trajectory data. Depending on the trajectory, the time stamps and potentially multivariate attributes recorded along the trajectory, numerous features can be derived pertaining to curvature, direction distribution, speed, acceleration,
etc. Excellent systematic overviews of the methods for the visual analysis of geospatial data analysis in general and for movement data in particular are presented in [
13] and in [
14], respectively. Methods from automatic data mining of trajectories, including classification and sequence analysis, are surveyed in [
15].
Being able to extract and compute many features for movement data does not imply that the relevant or interpretable features have been identified. Automatic methods for feature selection, such as the filter or wrapper approach [
16], automatically determine a subset of features for solving a given data analysis problem in an effective way. These methods usually rely on supervised data (e.g., to maximize the classification accuracy on training data) or on unsupervised heuristics (e.g., such as to minimize the correlations among the set of features). For example, a contribution by Ward Edwards presents methods for multi attribute utility measurement [
17], where a finite number of alternatives (features) are evaluated based on a finite number of criteria (feature value, minimum, maximum, distribution). So-called utility functions are used to determine whether a given value of an attribute is “better” than another value. Each method presented is based on the elicitation procedure of weights. The outcome is a ranked list of alternatives regarding an achieved rank.
While much work in feature selection is done automatically, increasingly also visual and interactive feature selection methods have come into consideration. The rank-by-feature framework [
18] suggested a set of comparative views to identify features of high descriptive power and allowed the user to interactively select features. The Dimstiller approach defines a workflow and appropriate views to help users in feature selection and dimensionality reduction [
19]. In [
20], an approach for the comparison of alternative high-dimensional feature spaces based on 2D projections allowed identifying similarities and differences in candidate features. Generally, an advantage of visual-interactive feature selection is that these methods may be adapted more easily to changing user tasks, as is typically the case for explorative problem solving, and for which typically, no single, static filter criterion or utility function will solve. Feature visualization may help to show the analyst why a specific feature is of relevance.
2.3. Visualization Approaches
In this paper, we present an approach to automatically determine interesting game situations. Each situation is time dependent and consists of a set of features that describe the situation with respect to different importance values. Landesberger
et al. [
21] present a visual analytics system for identifying interesting movement data. The basic idea was to consider movement features as a function of time and to apply a time series change point analysis to find situations that differ significantly from the previous movement behavior. The system allowed visually summarizing the found segments and to adapt user parameters to steer the identification. For the visualization of such high dimensional data, parallel coordinates [
22] are a prominent solution; each axis depicts one dimension, and values are distributed along the axis and connected between axes. We use a similar approach to parallel coordinates, but assign each axis to a specific time stamp and rank descriptive features along axes. Features can reoccur at another point in time, which leads to connections between features. A similar approach has been presented by Krstajic
et al. [
23]. The authors use an approach similar to Themeriver [
24], but discretize time (x-axis) and visualize news articles developments, instead of features, over time. The system allows the user to effectively recognize the temporal dynamics of news stories and their relationships. Several case studies of real news data illustrated the usefulness of the introduced system.
To design a visualization that enables the user to interpret rankings and to compare multiple heterogeneous attributes is challenging. A system called Line-Up is introduced by Gratzl
et al. [
25], where bar charts are used to derive a scalable and efficient visualization technique to interactively explore, analyze and compare multi-attribute rankings with different parameters. A technique to visualize sport ranking evolution is presented by Perin
et al. [
26], where a hybrid version of rank chart and slope graph visualizations positions the teams with respect to their performance and time during a season. The combination of these visualization techniques allows showing the magnitude of gaps between teams, as well as minimizing overlap, which improves the effectiveness of the visualization, as the authors conclude.
In this paper, we present a novel visual analytics approach as an improvement of existing work regarding the visualization of time-dependent events. An in-depth description of our design and interaction decisions to enhance the analysis for soccer experts is provided in
Section 3.
2.4. Feature-Based Soccer Analysis System and New Contributions
In recent work (Janetzko
et al. [
2]), we presented a system for the analysis of high-frequency position-based soccer data. Our presented system was able to provide single-player, multi-player and event-based analytical views for various levels of detail. We aimed at an analysis of similar phases. Therefore, the user was asked to first manually label interesting events on the provided timeline. Then, a classifier was trained in order to distinguish between potentially interesting and non-interesting events. This way, previously unnoticed events could be classified as potentially interesting and, thus, be suggested to the analyst for further exploration. With the use of KNIME [
27] and Weka [
28], we were able to automatically identify, based on user training, relevant events, such as “shot on goal”. In general, we used resulting classifiers to detect similar time intervals and, hence, validated newly-identified events.
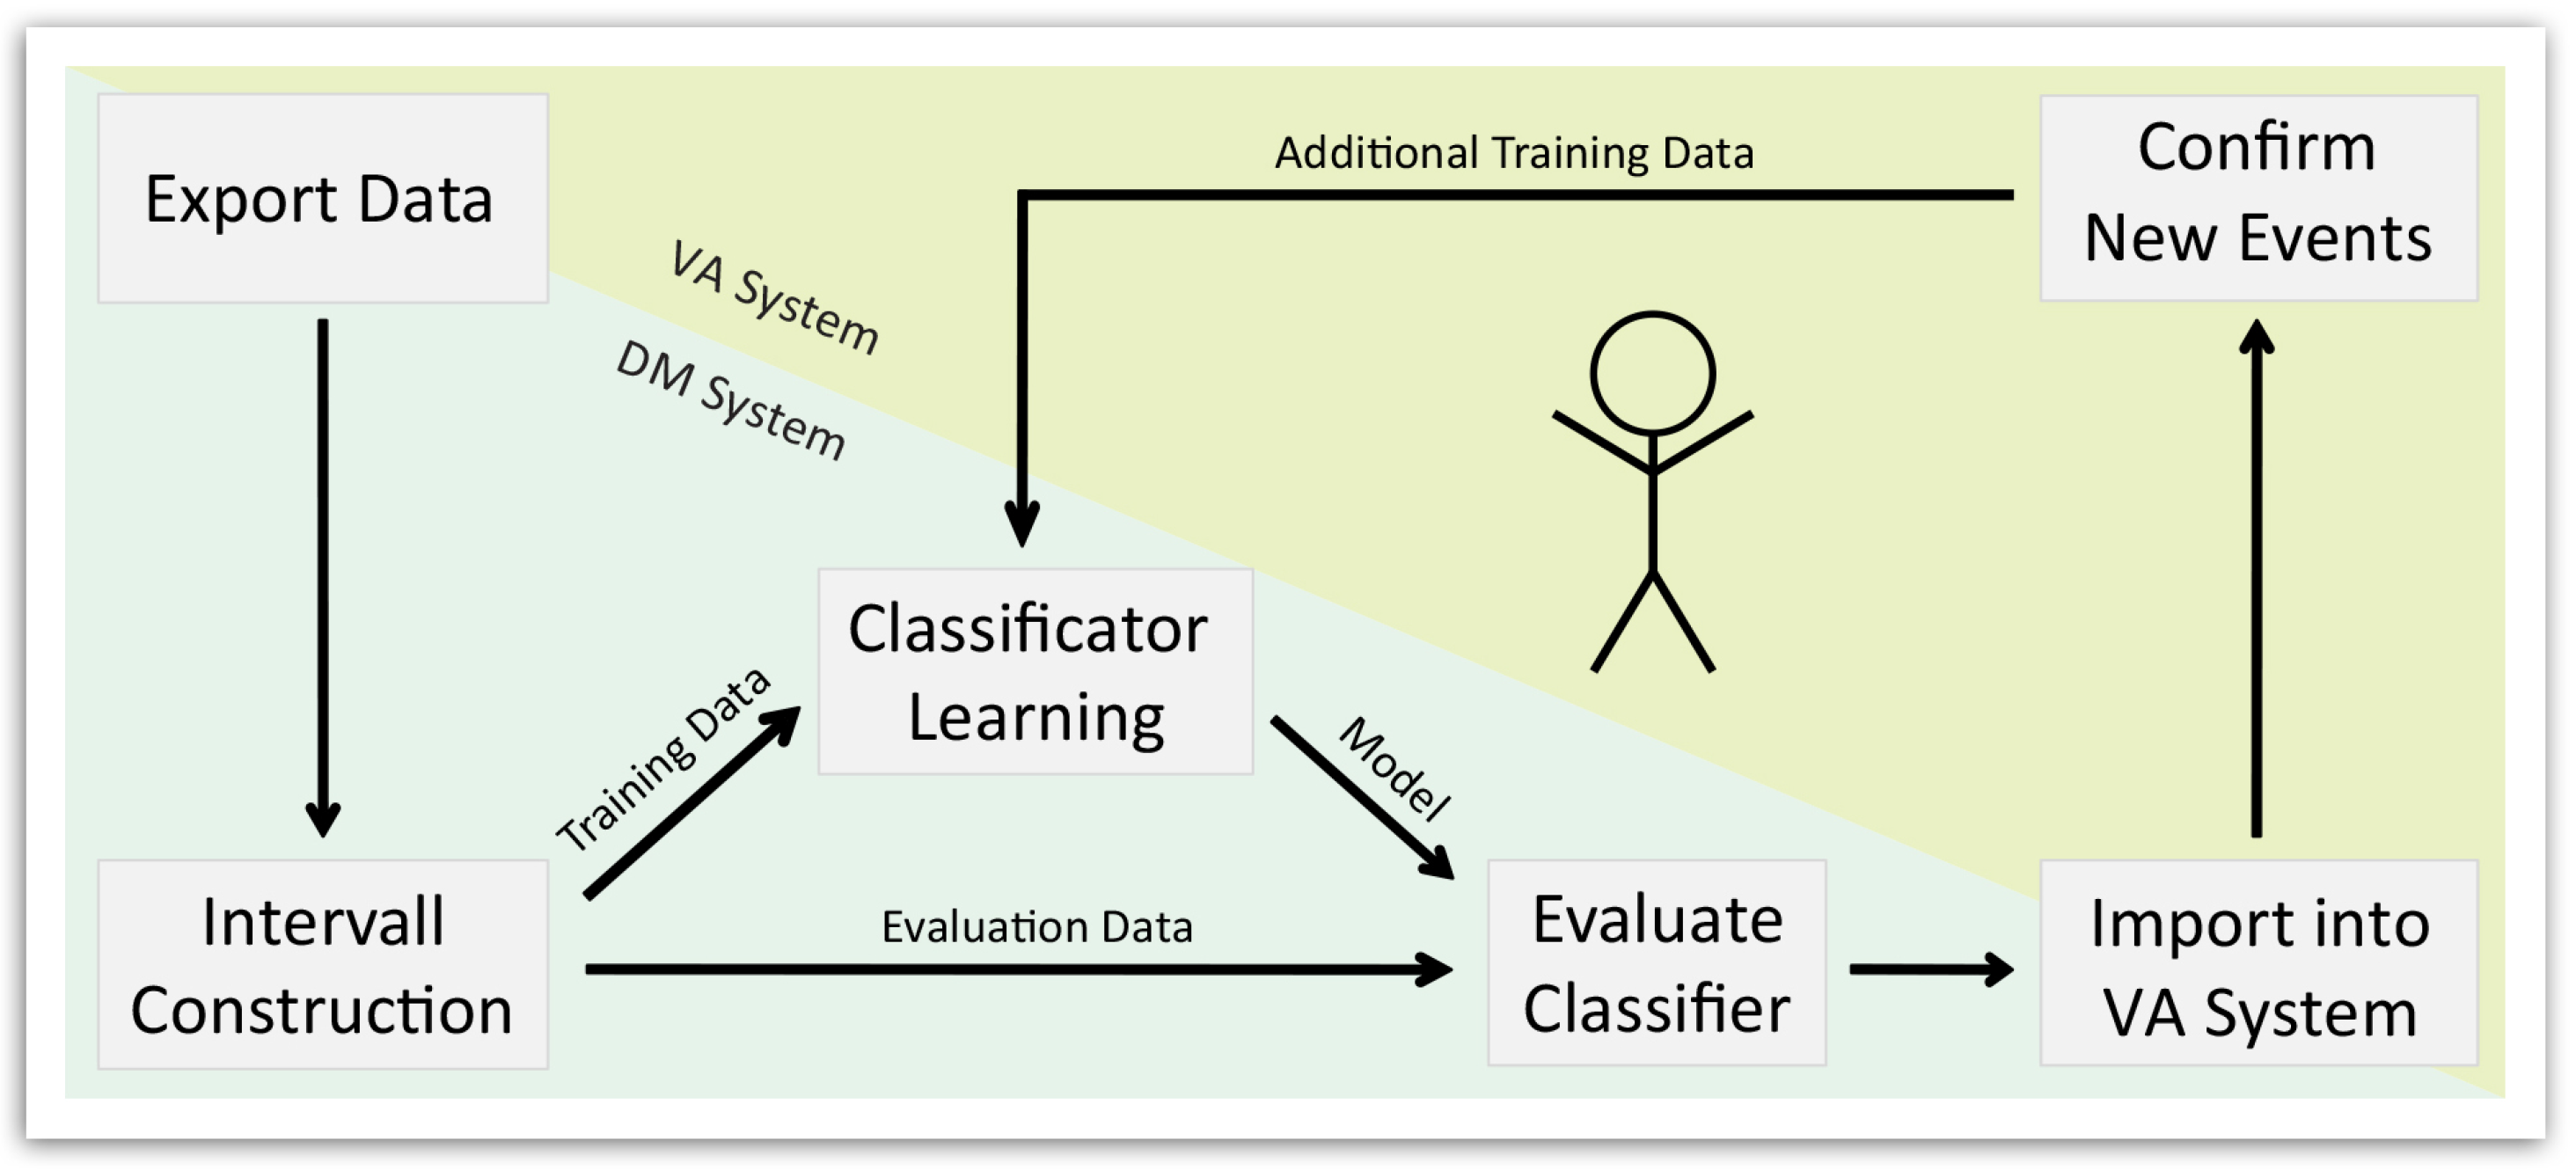
Figure 2 depicts the corresponding workflow. The proposed approach is based on various features of player trajectories that are not semantically interpretable. While testing, we were able to retrieve a satisfying amount of relevant suggestions; our overall recall with respect to the overall set of relevant events was in general limited. The visual representation used showed classified intervals, but did not include context and interaction information on the resulting game situations.
Figure 2.
Workflow proposed by Janetzko
et al. [
2] for the semi-automatic detection of interesting situations. Data get exported from the visual analytics into the data mining system for separation into interesting and uninteresting intervals. Classifiers are trained for separating these intervals and suggesting new events. When imported back into the visual analytics system, the user can confirm newly found situations and improve the classifiers.
In this work, we advance the basic approach of [
2] by introducing semantically-meaningful features, which allow an effective and interpretable exploration process, respectively. We provide a new workflow, as well as new facilities for interactive visual analysis of complex soccer team movement patterns in
Section 3.1. As the experimental results will show, we are able to improve the results of the classification accuracy and recall for interesting situations, as judged by experiments with a soccer domain expert. Furthermore, we now consider the nature of soccer more and derive complete game moves with individual lengths instead of two-, five- or ten-second intervals. Finally, we added versatile possibilities to achieve visual insight by interacting with and giving feedback to the system by improved visualizations and interaction capabilities.
3. New Workflow and Visual Designs for Soccer Analytics
Supporting the analyst in looking for key scenes with a visual analytics workflow is a challenge. The way a team plays differs from team to team and from match to match. Strengths and weaknesses may vary over time, as well. Defining general rules and guidelines identifying key scenes based on movement data is a complex task. In order to deal with this diversity of individual tactics, strengths and weaknesses, we need to learn from past performances. For example, deriving similarities of successful attacks helps to identify strengths. An analyst should consequently be able to suggest to the system one or more match scenes as a template to retrieve similar interesting situations. An additional desirable feature is the possibility to extend an analyst’s search by adding newly-found or classified interesting situations. We proposed the idea of such a system in our previous approach, described in
Section 2.4. Here, we enhance the accuracy, efficiency and usability of this approach and integrated it into a stand-alone visual analytics system without external requirements. However, similarity queries alone are not sufficient to support analysts to determine the most interesting situations and key scenes of a match. An analyst wants to see the point in time of an interesting situation and why the visual analytics system proposes the situation as an interesting one. We need possibilities for not only showing when something interesting happened, but also elaborate ways to visualize the what in selected scenes.
In this section, we propose a workflow based on our discussions with domain experts allowing analysis of soccer matches as described above. Additionally, we aim to support analysts to either confirm or reject hypotheses within our system. We aim to enable analysts to retrieve characteristics of suggested game moves. Moreover, we want to enhance our visual analytics system by offering useful interaction possibilities, where the analyst can bring in his or her own experience. We are illustrating our workflow in
Section 3.1. The resulting visual design addressing all of the proposed tasks is introduced in
Section 3.2.
3.1. Workflow
We propose a general workflow for visual analysis of soccer team sport. Two soccer experts were involved in the process of designing and evaluating the workflow, acting in the role of a liaison [
29]. One expert has been an active soccer player for 24 years and has been working as a coach for 10 years; he is currently employed by the German soccer club FC Bayern München. The other expert has been an active soccer player for 19 years and is currently serving as an official referee. We created this workflow by conducting several expert [
30] and focus group interviews [
31] with these experts, asking questions about what information a system needs to offer, how complex interactive visualizations are allowed to be and how fast information needs to be retrieved.
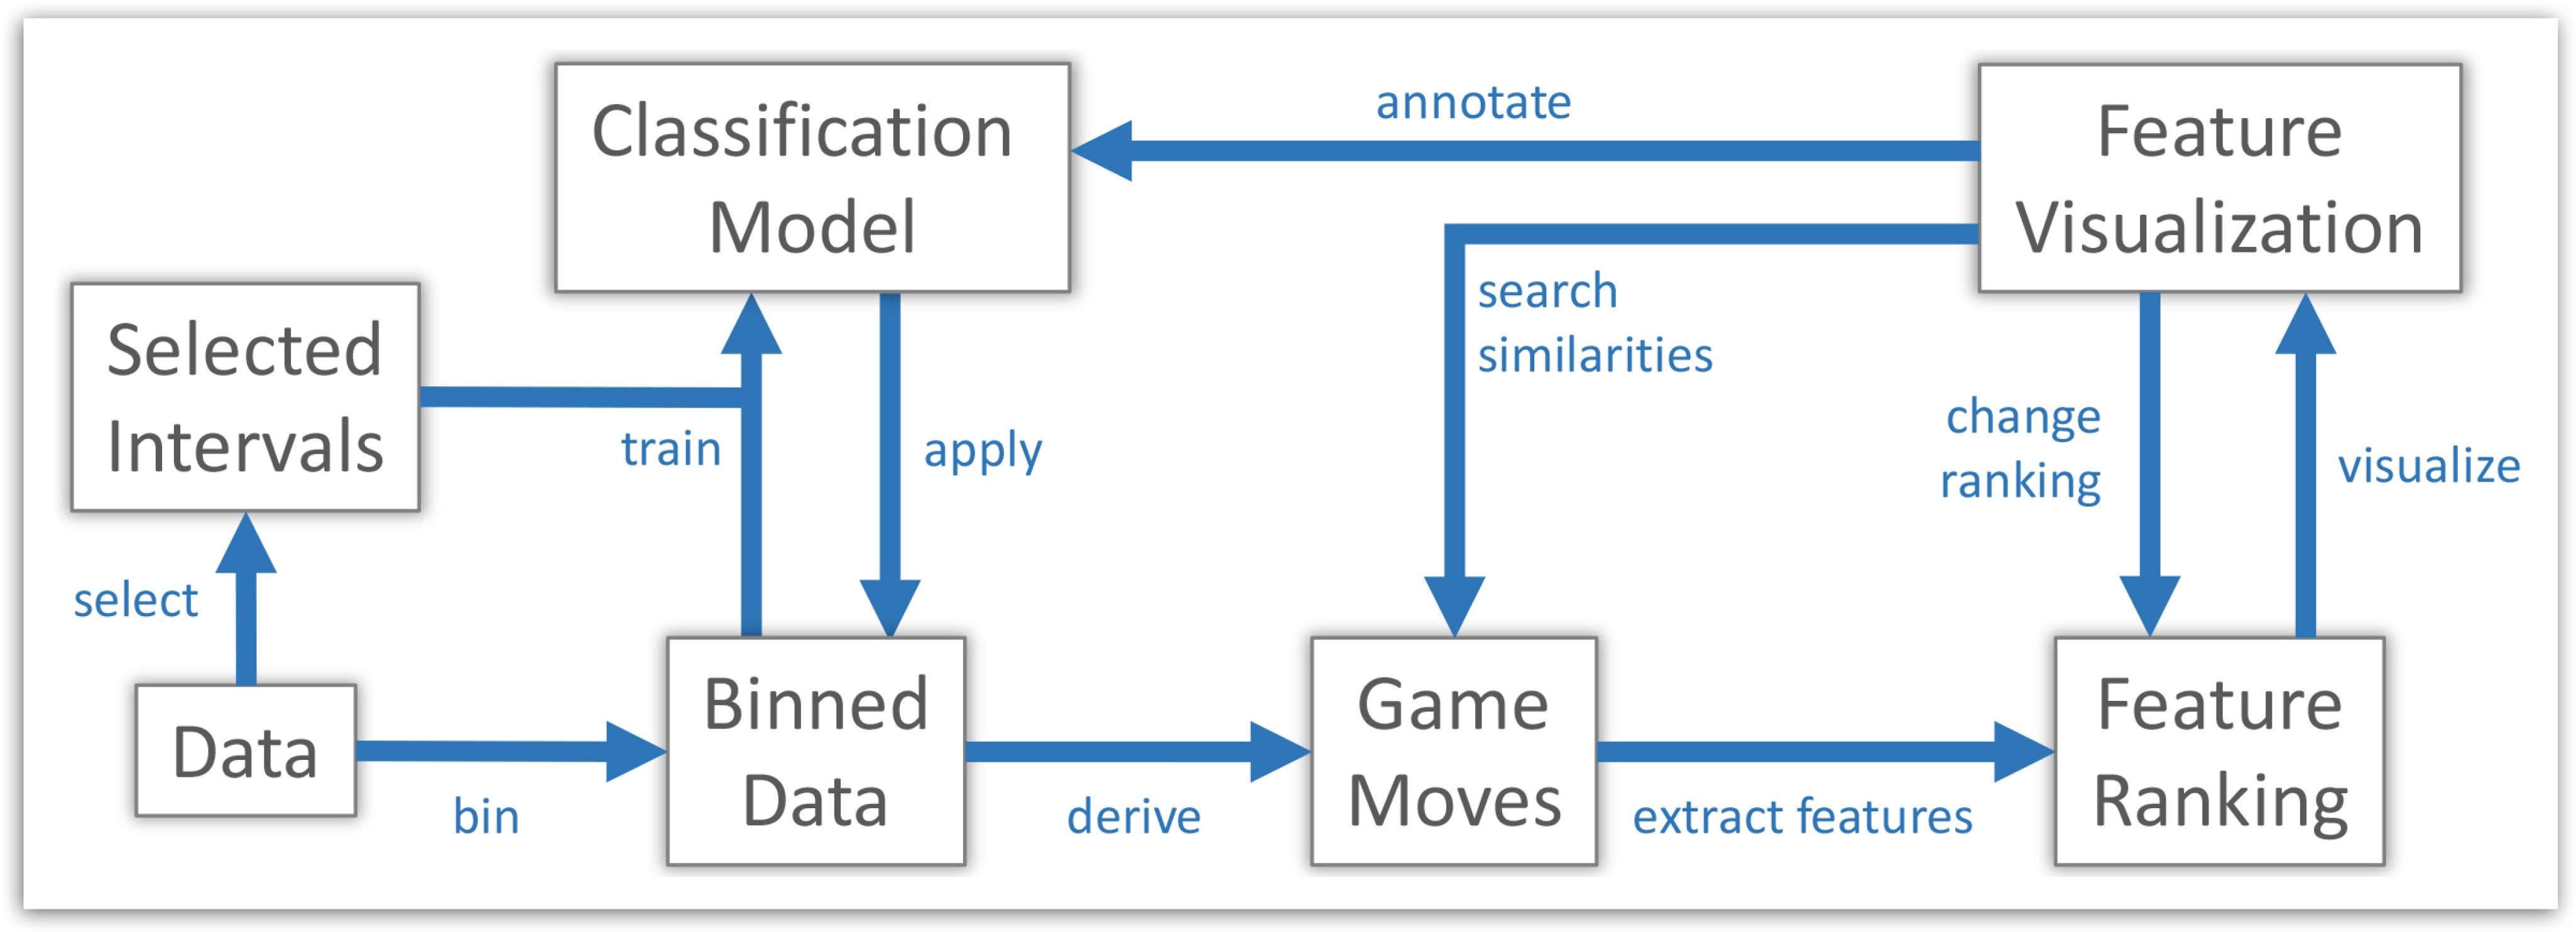
Figure 3 illustrates the overall workflow based on the derived requirements from our interviews with these subject matter experts. From a visual analytics perspective, our workflow allows analysts to integrate their expertise and tightly couples visualization and data mining techniques. We next describe each transition depicted in the workflow in detail.
Interval selection. Intervals represent a specific time period of interest, determined by either manual annotation or automatic detection. An interval determines corresponding actors’ behavior and surroundings by measurements which occur in that interval. These discriminative features include, for example, speed, acceleration or the amount of opposite players in a region around the actor. Based on analysis tasks and interests, the expert can both manually and automatically select game intervals. This way, the expert can, for example, use automatically-determined shots on goal events, which are in line with the selected interval, for further exploration. Our visual analytics system applies selected intervals as situational templates to train the classification model.
Figure 3.
Novel visual analytics workflow to support experts in identifying and exploring interesting situations in team sports. The user is supported in his or her sense-making process by the incorporation of semantically-meaningful features describing situational meta information. Interactive visualizations enable the user to give feedback to the system according to his or her experience.
Binning. In order to compute discriminative features, the input data are binned into fixed-size time frames; the duration of each time frame is set to two seconds. Binning allows us to smooth the noisy input data and to derive meaningful statistical measurements.
Training and applying the classification model. With the selection of interesting situations, interesting and uninteresting intervals are partitioned. As a result, multiple classifiers can be trained based on selected game situations. For example, a long distance pass to the forward line can be characterized as a game situation or an attack pattern. Several instances of classifiers are trained to be able to distinguish between various attack types. We apply logistic model tree (LMT), logistic base, functional tree (FT), decision stump and support vector machine. If a classifier returns false positive for a certain situation, the interval that contains the situation will be annotated as potentially interesting. To be able to train the mentioned classifiers, we firstly calculate necessary features of each player on the soccer pitch for each time step. Such player-dependent features were introduced in our previous work [
2]. Often, the features of a point in time are not sufficient to classify a similar situation. This is why we secondly divide the time series of each player’s features into multiple intervals of two seconds, as described above. In addition, we determine several statistical values per interval, such as minimum, maximum, average, median and standard deviation. We tried different interval sizes and derived via trial-and-error that a length of two seconds fits our model best. Furthermore, we use five different classifiers, for each player on the soccer pitch. All intervals that contain events annotated as interesting are considered for the classification of interesting intervals. A subset of these intervals (as a general rule, 33%) are then used for training the first class of each player. On the other hand, since there is a significant disproportion of interesting and uninteresting intervals, we consider only the intervals of one player to train his or her classifiers for the second (uninteresting) class. In order to classify interesting intervals of a player, we use his or her dedicated intervals as an input for each classifier trained with the data of the player himself or herself for uninteresting intervals and a global list containing all interesting intervals of all players. As a result of the classification, every interval annotated as uninteresting, but classified as interesting (false positive) is considered as a potentially interesting interval. To evaluate the classifiers, we consider whether all intervals annotated as interesting are found. This way, we found out that the mentioned classifiers derive the best results. This process enables the analyst to give feedback by accepting or rejecting a classified interval and by repeating the classification process by which the system adapts the analyst’s choices.
Deriving game moves. Game situations are described by moves that contain information of the involved actors, such as speed or acceleration. We use the term move with respect to a soccer game to describe an interval of arbitrary length, starting with the seizure of the ball and ending with a final turnover. The classification of interesting game situations returns a set of intervals that have a fixed length (e.g., two seconds) and contain the point in time where the classified event occurs. Thus, game moves are derived from previously-classified intervals and allow the expert to get an overview of the whole situation. A game move provides additional information for a specific situation and enables the expert to detect the origin. Based on the interesting intervals resulting from the classification, the game moves are derived by firstly determining the team possessing the ball at the point in time where the dedicated interesting interval starts. The ball possession, on the other hand, is obtained by taking manually-annotated events into account (e.g., pass, cross, foul, etc.). As a second step, the points in time of the start and end of a dedicated move are then iteratively calculated by identifying at which point in time the ball possession switches.
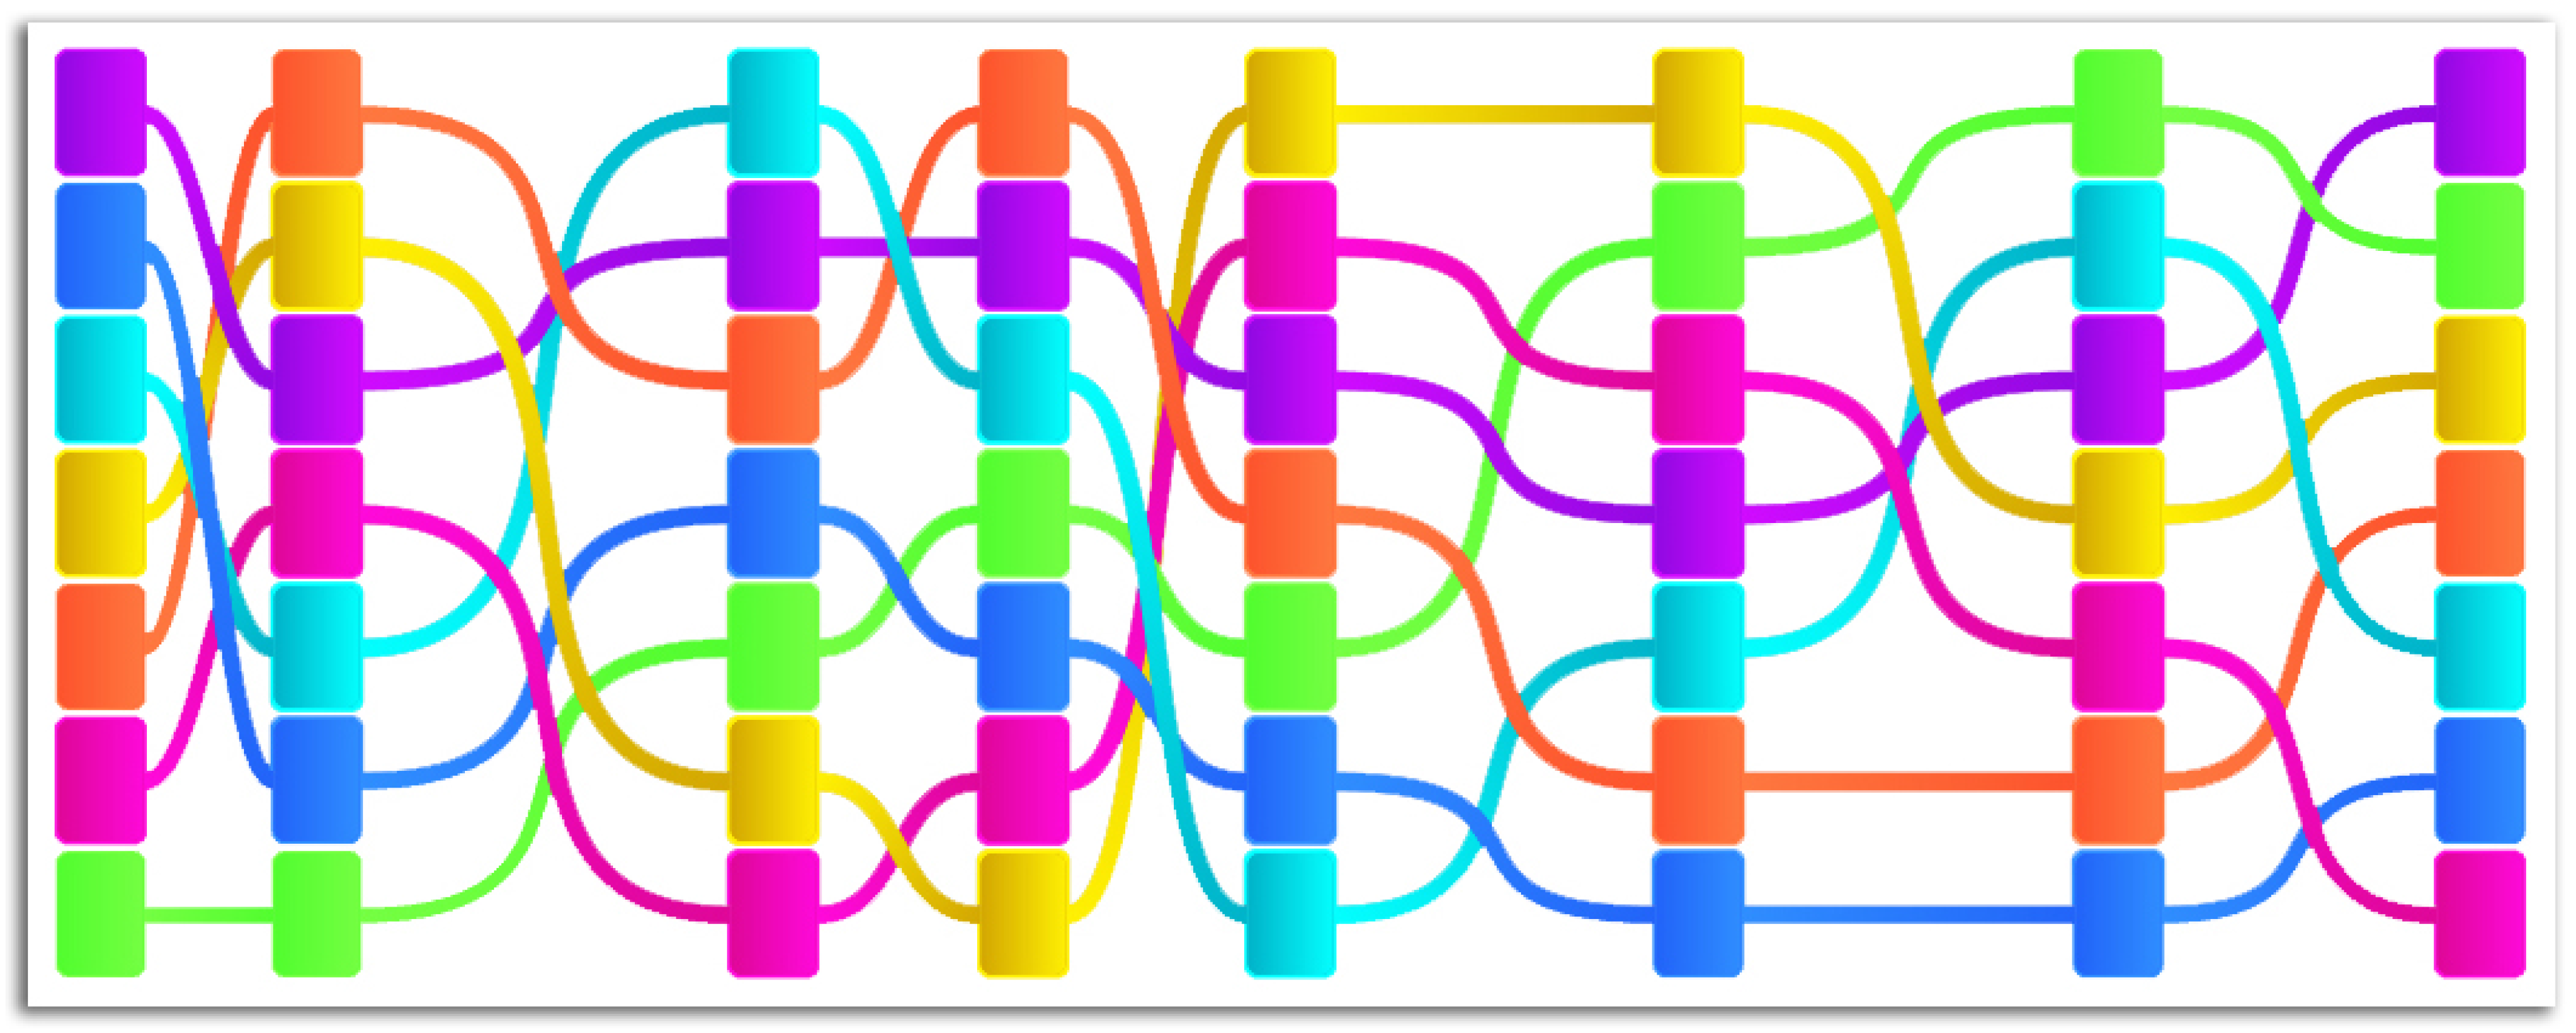
Feature extraction and ranking. Game situations are typically more complex due to interdependencies within and between the teams; the analysis takes much time and effort. Furthermore, experts differ in knowledge and experience, leading to distinguished and possibly controversial views on certain game situations. To help in this process, we need to reduce the complexity of which a situation consists. Therefore, we propose a method to automatically split an identified complex and barely interpretable move into several understandable parts that retrospectively fit into one another. These separated parts are, due to their nature, easier to interpret and allow experts to make statements regarding their insights. In this case, we represent a descriptive part of a move as a feature. These specific features are designed to be interpretable and, furthermore, to describe a specific perspective of a move. Such features can express, for example, whether a movement includes a fast counter attack or a slow build up play leading to a scoring chance. In order to enable a quick overview of such movements, extracted features are ranked per move according to the respective relevance. Descriptions and expert interpretations of the semantically-meaningful features are depicted in
Table 1.
A feature will be considered relevant if the value distribution in the situation is unusual compared to the default value distribution. We assume that global extreme values are representing rare instances of a feature. This ranking regarding the extreme values has the advantage that an expert can easily understand and interpret our ranking. We implemented several features that are useful for analysts. This includes, for example, features describing the pattern of fast counter attacks, power play situations or combination play.
Table 1.
Descriptions of the semantically-meaningful features introduced. The expert interpretation of a feature describes what kind of plays an extreme value of the dedicated feature indicates with respect to an expert’s interpretation of the dedicated feature.
Visualization. To enable a quick overview and to support the sense-making process of the expert, determined feature rankings are presented taking into account the humans’ pre-attentive cognition. We incorporate the following visual variables according to Bertin [
32]: color, position, brightness and shape. We will justify the resulting visualization design in
Section 3.2.
Ranking change. Since every video analyst has his or her own understanding regarding the importance of characteristics based on experience and other factors, it is necessary to individualize the way of ranking features. The ranking of features has a direct impact on the positioning and visualization of features. To enable experts to include their experience, they can directly interact with the visualization and change the ranking, leading to a re-computation of the proposed feature ranking and, thus, to the possible identification of different situations.
Similarity search. For further analyses, we support a search for similar moves according to user-selected features. Based on this set of interesting features, the system performs a similarity search on the game moves and adapts the ranking and the visualization. We propose a similarity search with various possibilities integrating the analyst’s notion of interestingness to automatically retrieve similar moves. As a criterion for similarity, we use the ranking, as well as multiple types of queries from which the analyst can choose. We implemented both an exact and an approximate search. The exact search allows finding moves with a similar ranking value and ranking position of the selected features. The approximate search is more flexible with respect to similarity in ranking. For refinement purposes, the analyst can specify a time span for searching similar moves. Furthermore, a similarity measure indicating how precise the results of a search are allows additional filtering. Technically, similar moves are determined by iteratively comparing the features the user selected (e.g., via rubber band selection) against all features of the same type of all of the other moves. In order to compare two moves, we introduce an error that indicates how similar two moves are. The error is simply based on the average difference regarding the scores of the selected features. If the error of the selected features in comparison to the features of another move is below a user-driven threshold, then the moves are treated as similar. In this way, the analyst is able to define the quality and quantity of the results. By linking the visualization for moves and move characteristics to this process, changing the threshold immediately results in an update of these visualizations.
3.2. Visual Design
In
Section 3.1, we proposed a general workflow for team sports visual analysis, which helps experts to understand certain game situations and, thus, enables them to gain insight into the data. The visualization is a very crucial part, as it is the interface between data mining and user expertise. Visualizations and their interactions need to be designed accordingly to support the analysts’ sense-making process. Summarized parts of our system can be seen in
Figure 1. In the following paragraphs, we will reason and describe the visual design in detail.
Time. A soccer match consists of more than ninety minutes of game play. These ninety minutes include numerous moves being composed of various events representing actions of both teams trying to realize the coaches’ tactics. We provide an intuitive visualization representing the temporal dimension, depicted in
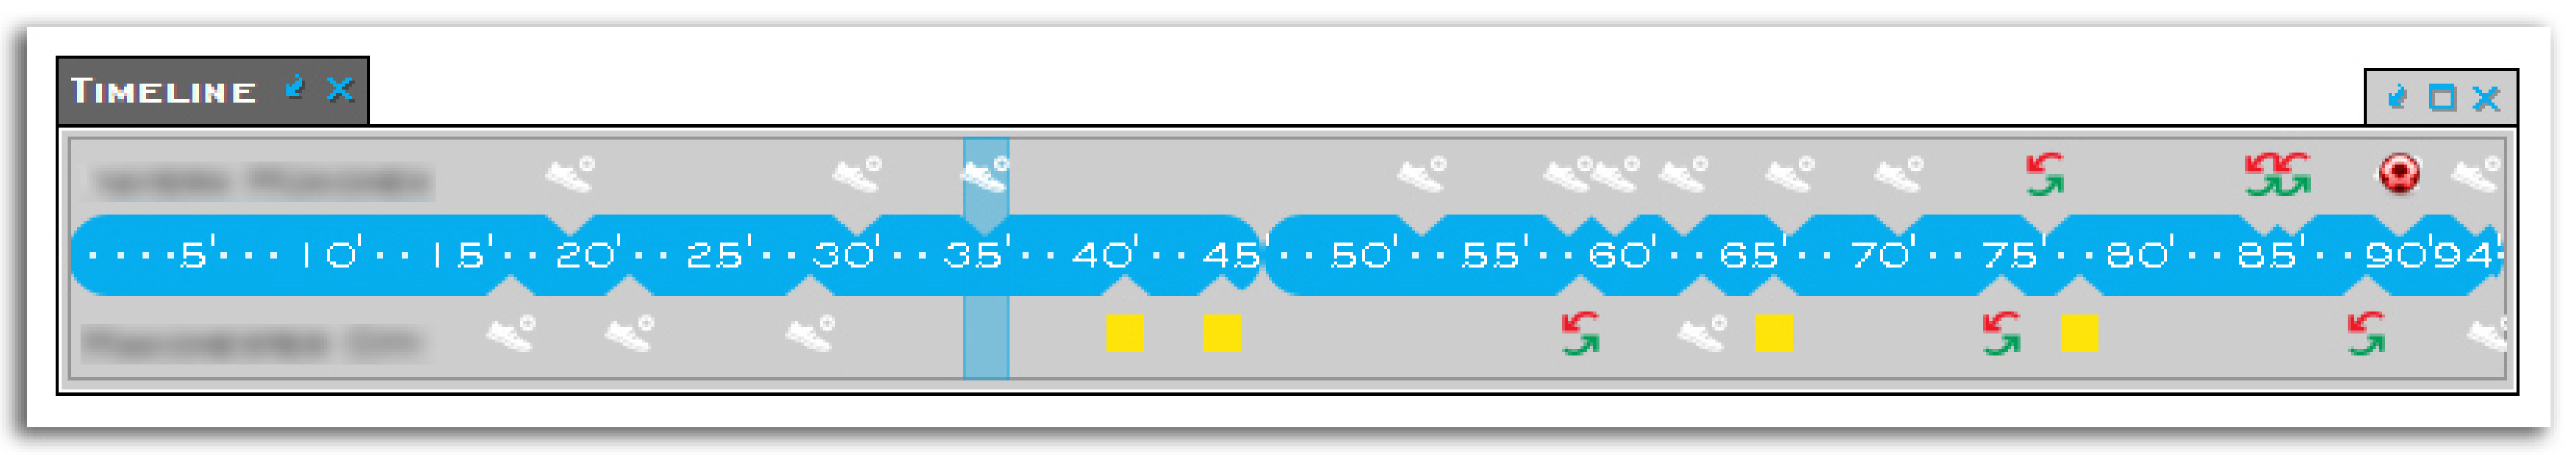
Figure 4. We designed the timeline as a time ruler reflecting that soccer experts are used as media controls with a time ruler in the reading direction. Our visualization helps to retrieve configurable events (e.g., fouls, goals, exchanges) that may be of general interest to the user. The timeline is additionally used for quick navigation, enabling one to jump to any moment of a match.
Figure 4.
Timeline allowing quick navigation to every moment of the game. User-selected events, like fouls, goals or exchanges, are displayed.
Figure 4.
Timeline allowing quick navigation to every moment of the game. User-selected events, like fouls, goals or exchanges, are displayed.
Moves. The visualization for moves is placed directly beneath the timeline. Each glyph represents a relevant move detected by the classification. Irrelevant moves are not being displayed. All found moves are placed horizontally using the visual variable position to represent their timestamp. The visualization is depicted in
Figure 5. The width of a glyph illustrates the duration of the respective move. We employ the visual variable color hue to encode the most characteristic semantically-meaningful feature. Descriptions and expert interpretations of the semantically-meaningful features are depicted in
Table 1. The shape of an isosceles triangle is used to indicate the development of a game move over time with its moment of escalation (e.g., shot on goal) at the base of the triangle. The width of the triangle represents the length of the dedicated game move. Characteristics of a game situation can be explored further by investigating the flow visualization described below.
Figure 5.
Different kinds of moves visually illustrated as glyphs with variable widths. We use the term move with respect to a soccer game to describe an interval of arbitrary length, starting with the seizure of the ball and ending with a final turnover. The color of a move represents its most characteristic semantically-meaningful feature (for the meaning of the color, see
Table 1). The width of a glyph illustrates the duration of the respective move. The shape of an isosceles triangle is used to indicate the development of a game move over time with its moment of escalation (e.g., shot on goal).
Move characteristics. To investigate semantically-meaningful features of a move and their development during a game, we developed a visualization integrating several interaction possibilities enabling one to highlight, to change the ranking of a feature or to search for similar moves. The design of our visualization needs to address these tasks incorporating state-of-the-art knowledge of visual variables and Gestalt laws [
33].
Our main priority is to visualize ranked features of moves, which are positioned according to their temporal occurrence. We display a top-down list below the corresponding move denoting the name of each ranked semantically-meaningful feature. We further improve the visualization by assigning the visual variable color to each feature. The color map is chosen to ensure that at least 12 features can be pre-attentively distinguished. Each feature is represented by a colored rectangle below the move to be able to correlate a move with its features quickly. The vertical position of the rectangle indicates its ranking such that the topmost ranked feature is represented by the topmost rectangle.
Analysts additionally want to find out how identified situations develop over time. In order to increase the visual salience of trends, we decided to make use of a well-known Gestalt law, namely the law of connection proposed by Palmer and Rock [
34]. The cognitive system tends to group elements together if they are connected by other elements. We follow this idea and enable a comparison of feature rankings between moves by adding a connector between each feature and its counterpart of neighboring moves. These connectors are ordered such that the connector of a higher ranked feature overlaps all lower ranked features to make more characteristic features more visible. The resulting design for our visualization can be seen in
Figure 6.
Furthermore, we are able to highlight a feature for all selected moves in order to allow trend estimation for the selected feature. When a user hovers over a feature, we emphasize this by decreasing the brightness of all other features. Details on demand, such as the actual score, are shown via tool tips invoked by hovering over a rectangle. In accordance with our proposed workflow, we enable the analyst to interactively change the ranking of the features based on his or her experience. Therefore, interacting via drag and drop with the feature visualization will result in an adapted formula, and the visual changes are self-explanatory to the user. Our visual analytics system incorporates the change and adapts the ranking algorithm and the visualizations to the preferences of the user.
Figure 6.
Game situations are typically more complex due to interdependencies within and between the teams. We automatically split identified complex and hardly interpretable moves into several understandable parts and visualize these. In this case, we represent a descriptive part of a move as a feature. Features are visualized as rectangles and ranked such that the topmost ranked feature is represented by the topmost rectangle.
Based on the feature ranking, an analyst subsequently may want to search for similar situations based on a selection of features and their values. Any subset of features can be selected (either by clicking or via a rubber band selection) to perform similarity search queries as described in
Section 3.1. The introduced interactions are depicted in
Figure 7 and
Figure 8. In each step, the expert can go backwards and reiterate with an adjusted set of moves and parameters.
Figure 7.
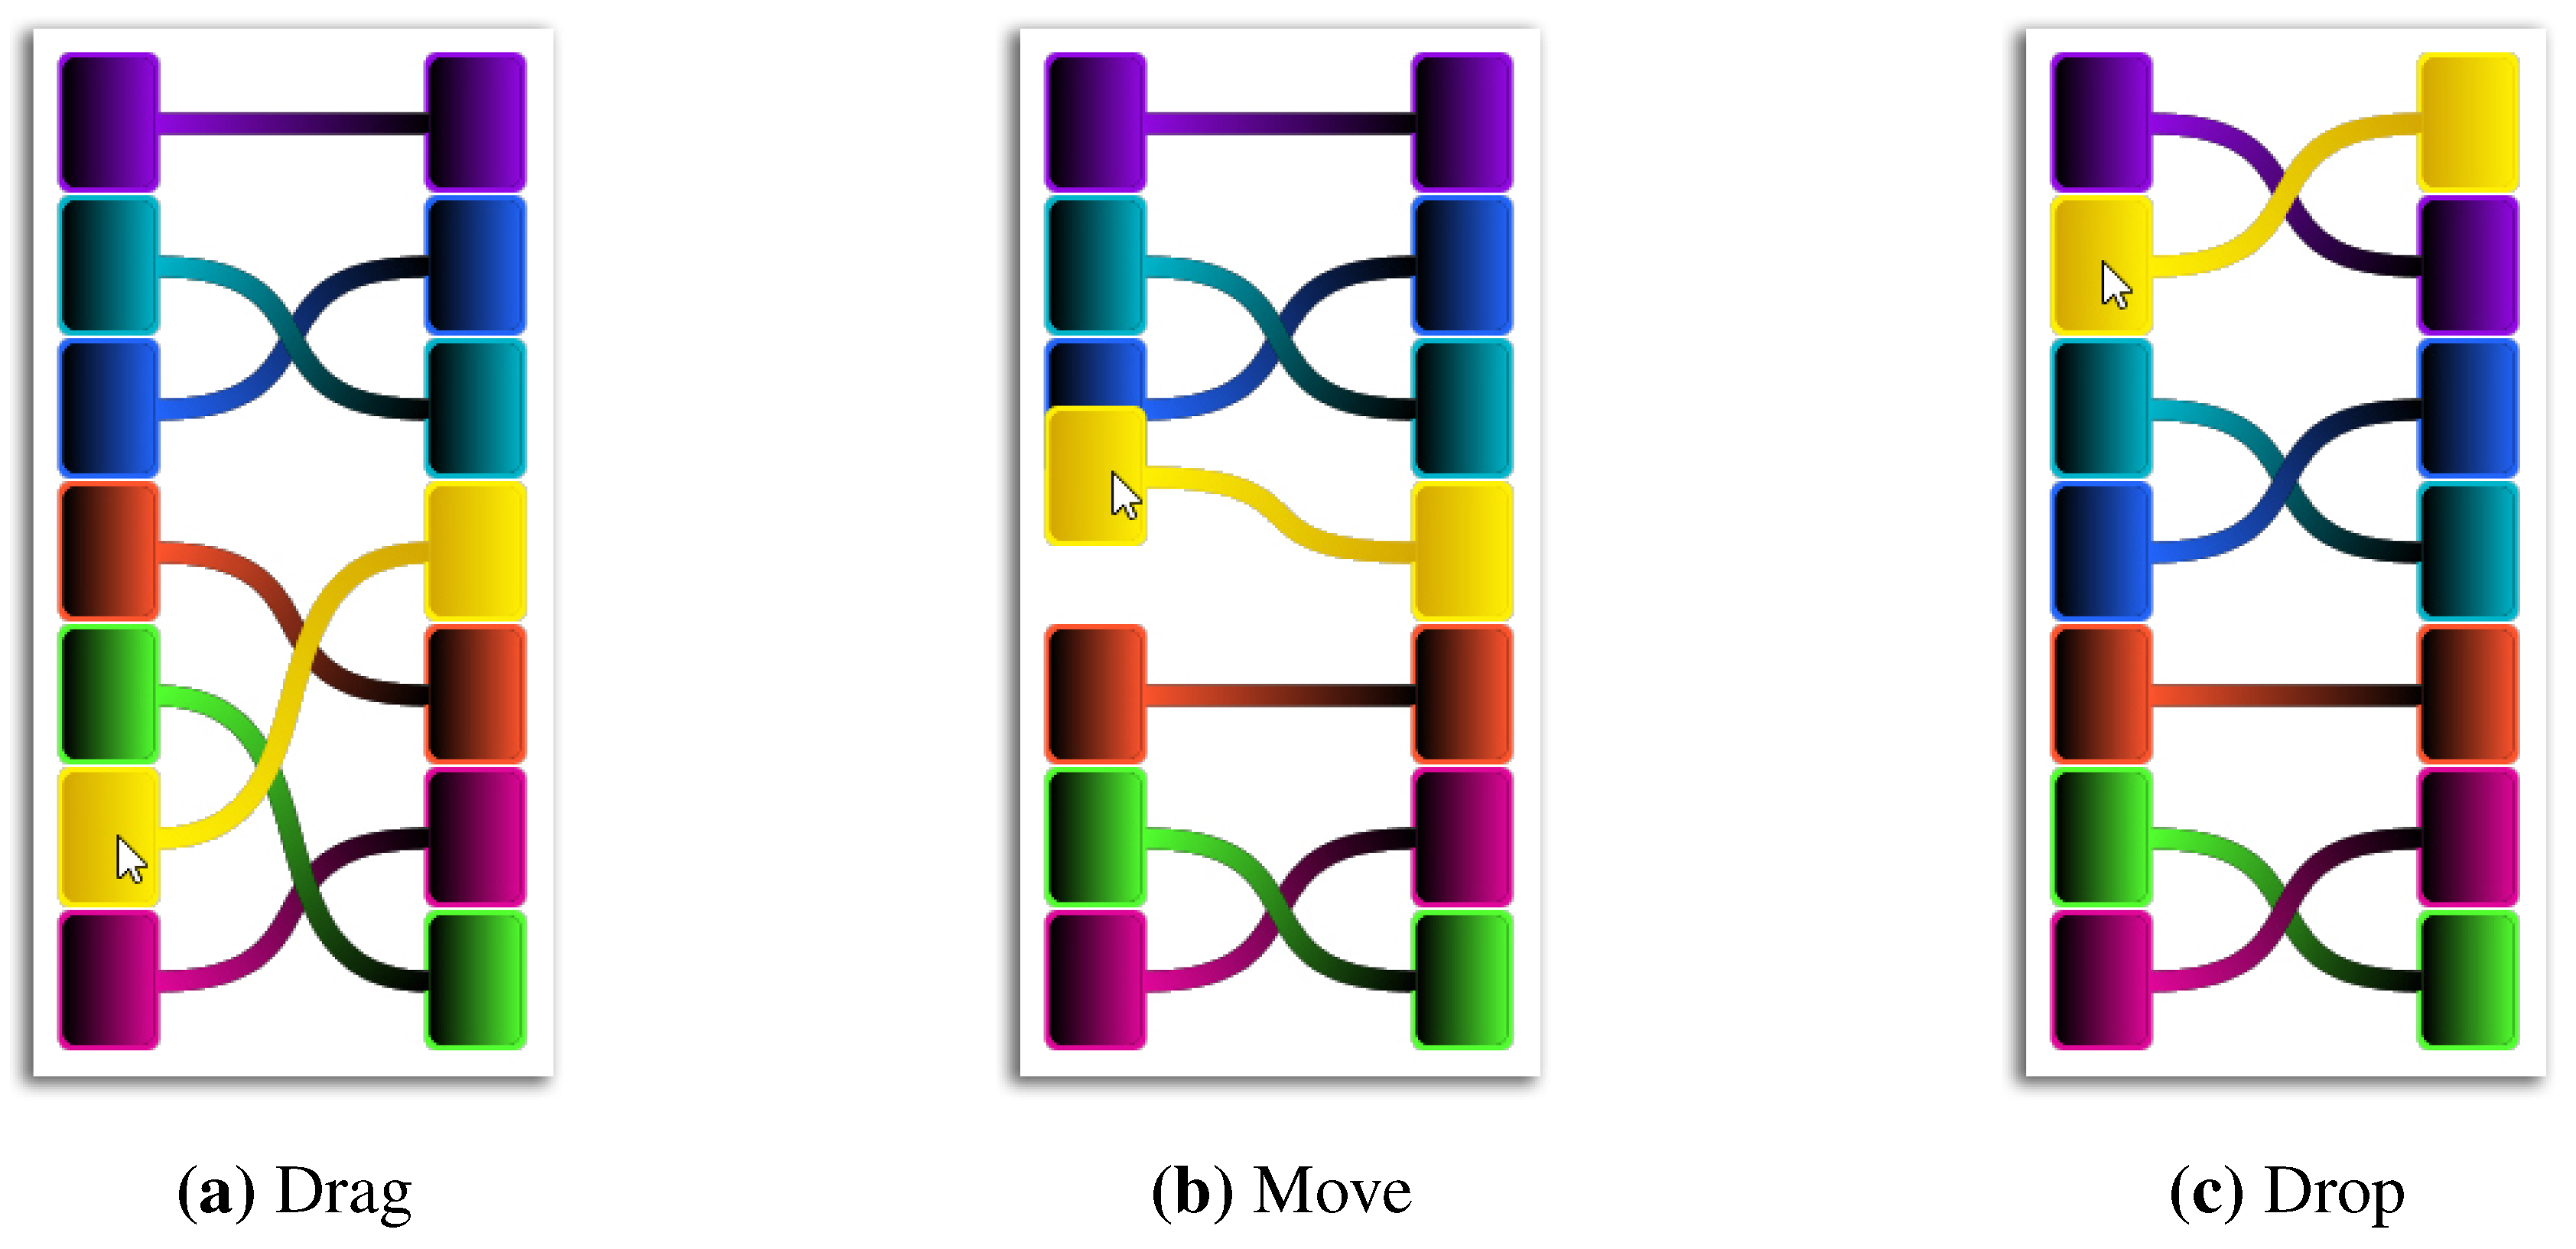
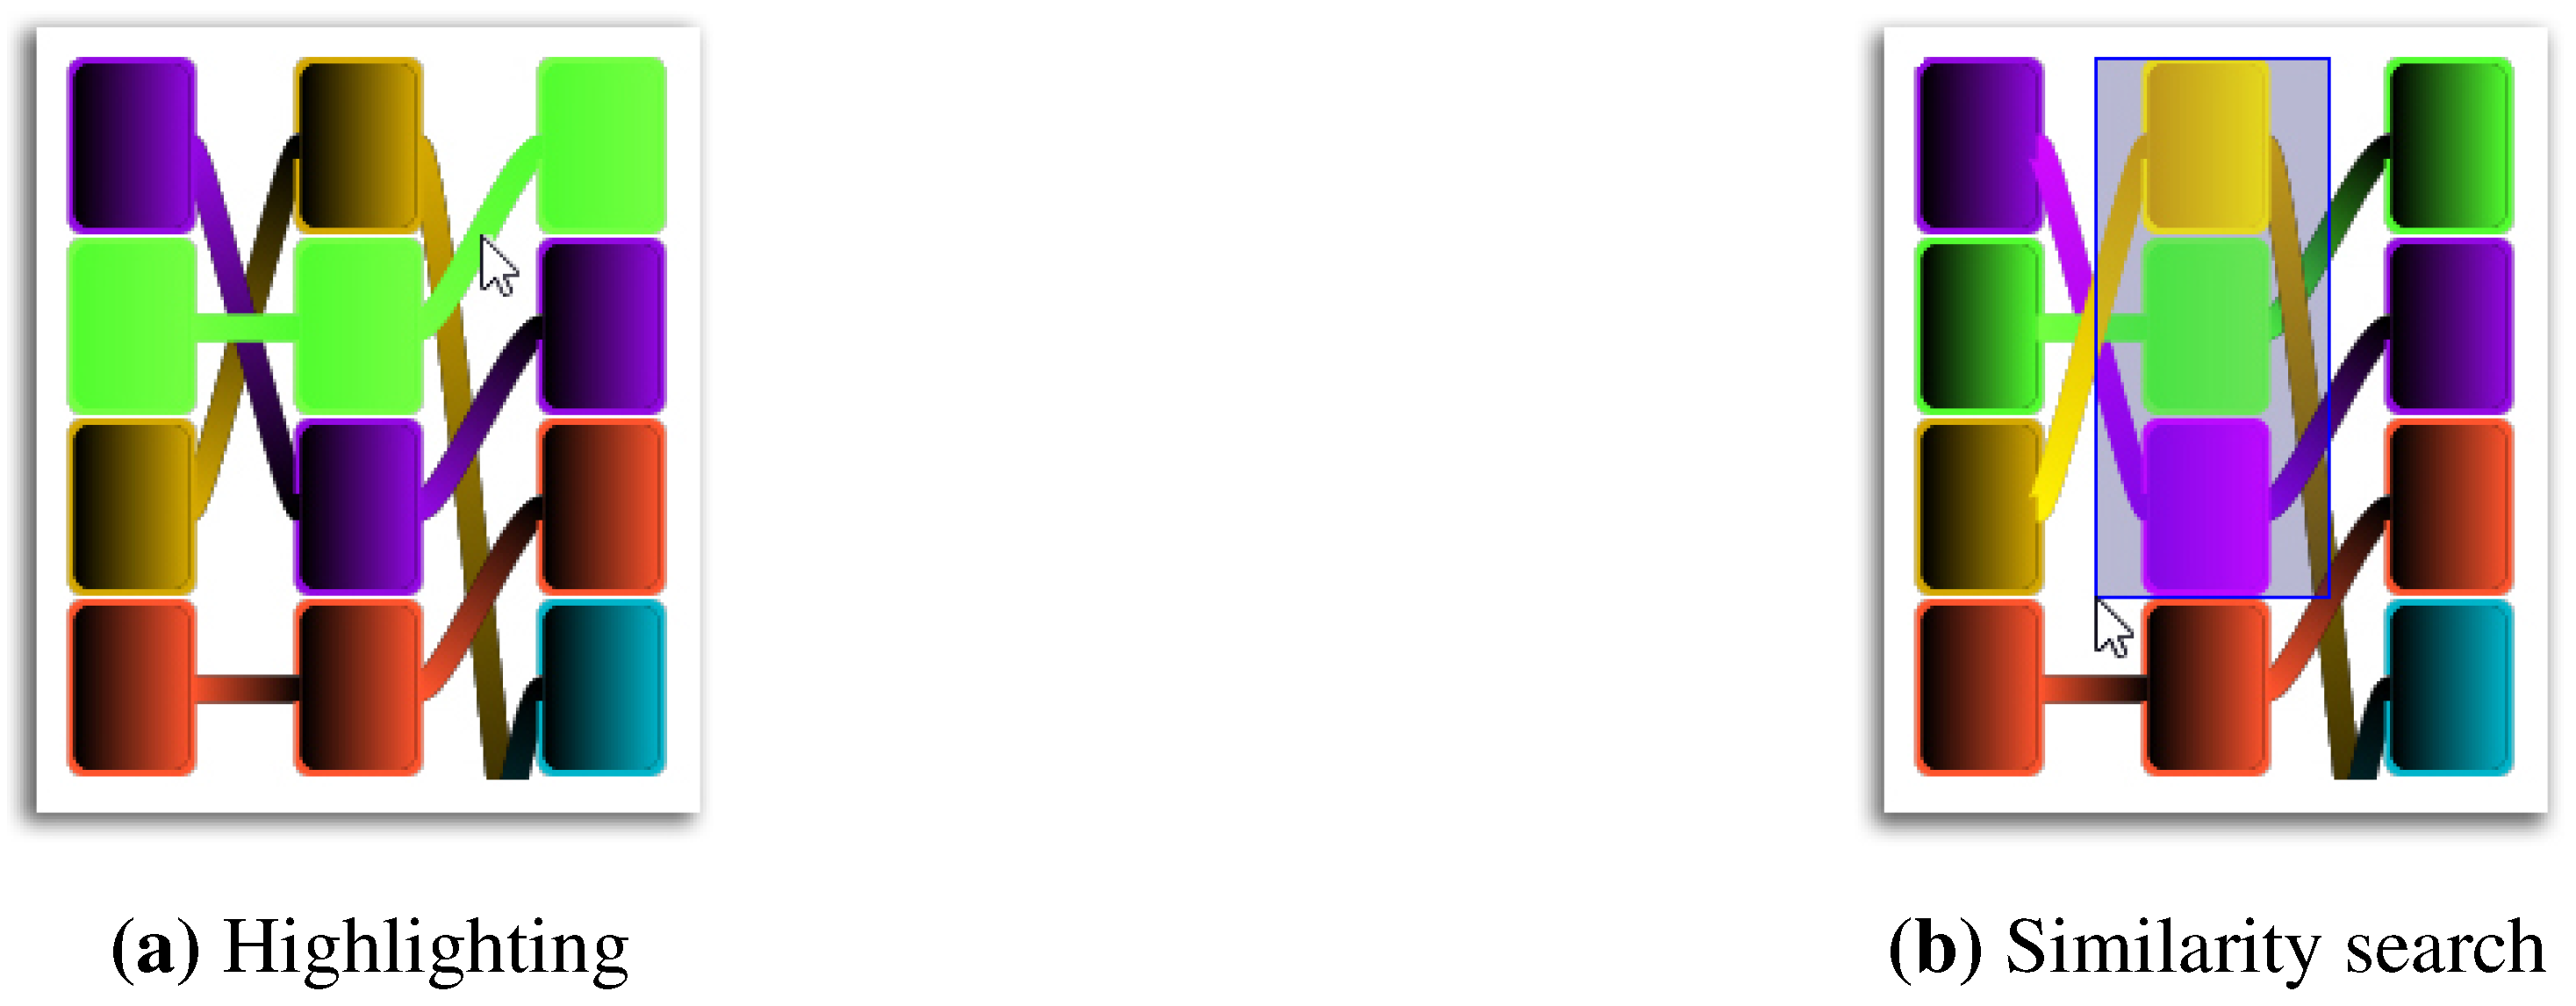
To enable an experience-based change of the features’ ranking, a drag and drop mechanism is introduced. The analyst is able to choose a feature (a), move it to a new position (b) and drop it (c). As a result, the system incorporates the change and adapts the ranking algorithm and the visualizations to his or her preferences.
Figure 7.
To enable an experience-based change of the features’ ranking, a drag and drop mechanism is introduced. The analyst is able to choose a feature (a), move it to a new position (b) and drop it (c). As a result, the system incorporates the change and adapts the ranking algorithm and the visualizations to his or her preferences.
Figure 8.
Through the adjusted visualization, we are able to make trend estimations via highlighting. An example where we highlight the green-colored feature (the number of overcome players) can be seen in (a). On further exploration, one may decide to automatically search for moves with specific similar characteristics, as shown in (b).
4. Application and Evaluation of Our System
In this section, we demonstrate the applicability of our workflow by presenting an analytical example use case. The use case presents several analyses and findings in which a domain expert gains knowledge about the teams within a match. We analyze characteristics of detected relevant moves of one team to identify commonalities and to detect tactical patterns of single matches. We next describe the used dataset and an analysis use case to demonstrate the typical applicability of our approach. We then present the results of evaluation sessions done together with domain experts from soccer training.
4.1. Soccer Match Dataset Used
The data analyzed in the application and evaluation of our system were provided within a collaboration with the sports analytics provider Prozone (
http://www.prozonesports.com/). The dataset consists of 66 professional soccer matches. For each of the 22 players timestamped in a match, two-dimensional position data are available with a temporal resolution of 100 milliseconds. Furthermore, the data include manually-annotated events (e.g., fouls, passes, crosses) containing information about position, time and event-specific information, such as the involved player. These events are less frequent and lack accuracy as they are manually tagged. We designed this use case to show how our system can help analysts in analyzing and understanding the offensive and defensive qualities of their and other teams. Our use case reflects selected important aspects for a successful match preparation and aims at improving a teams’ performance.
4.2. Analysis Scope: Characteristics of Offensive Attacks
An important task for an analyst during match preparation is to understand how an opposite team plays their attacks. There exists a variety of possible formations and tactical approaches a coach can choose from to build up a match plan. This plan depends on the available players and their individual skills. A match plan can change when it is unsuccessful or injured players need to be replaced. Therefore, it is of high value for analysts to identify the match plan of an opposite team.
The analysis process can be described as follows. We start by loading a match dataset into our system and, according to our proposed workflow, displaying one teams’ situations of interest combined with their visualization of certain characteristics (features) as described below. The resulting visualization can be seen in
Figure 1. We investigate our visualization of move characteristics to explore the way the team of interest is playing their offensive attacks. The features are ranked according to how characteristic they are in this situation, as described in
Section 3.2. We immediately identify the purple-colored feature (the number of players that participated in an attack) as an outstanding semantic feature being almost always at the first or second ranked position. Other features, like the yellow-colored one (speed of the move) or the red-colored one (pass distance of a ball), are sometimes relevant, but not all of the time, depending on the context. Therefore, we inspected the movement of the players and the ball on the field by displaying their trajectories. We find that in the majority of the moves, up to ten individual actors from the analyzed team were in possession of the ball, confirming our hypothesis from the move characteristics visualization. Using the similarity search to dig deeper for this pattern, we find that this particular team is in many situations trying to organize their attacks via a structured and rather calm build up play. Speed is an important factor when the team is able to start a counter attack in an unorganized phase of the opponent. An analyst could now use the derived knowledge to manually predict the future tactical behavior of this team. The analyst may now inform the coach that the team players should focus on pressing to prevent the opposite team from fulfilling their match plan early on. An example for a team that instead of ball possession and combination play is concentrating on fast counter attacks can be seen in
Figure 9. From inspecting the move visualization, we can strengthen our hypothesis, as we see that the green feature (the amount of overcome players), the yellow feature (the speed of the move) and the magenta feature (the straightness of the ball) are very prominent. These are characteristics indicating that this team allows its opponent to control the game and focuses on defending, as well as quick and straight counter attacks, where many players of the opposite team are played off.
Figure 9.
Derived moves from initial classification below the timeline. One can observe that this team seems to be focusing on fast and straight counter attacks, since the green feature (the amount of overcome players), the yellow feature (the speed of the move) and the magenta feature (the straightness of the ball) are very prominent.
4.3. Expert Evaluation
Our workflow presented in
Section 3.1 significantly extends the work of Janetzko
et al. [
2]. The workflow described here is comprised of two parts: (1) the semi-automated identification of interesting situations; and (2) the interactive visualization of situational features. After we designed the semi-automated identification of interesting situations, we did a quantitative and qualitative pre-study for evaluating and getting expert feedback. The findings of this pre-study lead to the development of the interactive visualization of situational features, which is evaluated in a qualitative expert study to show the correctness and effectiveness of our workflow.
The two soccer experts introduced in
Section 3.1 were involved in both the pre-study and the expert study. The setup of our studies consisted of a workstation, with a 24-inch full HD monitor with mouse and keyboard. The program was executed in full-screen mode. Experts were asked to express
ad hoc comments (the thinking aloud method [
35,
36]), and their interactions were recorded for subsequent analysis. We took notes of comments and additionally recorded our own impressions during the session.
4.3.1. Detecting Semantically-Meaningful Events
At first, we performed a pre-study with both experts to test and get initial feedback about our detection of interesting events. To assess the quality of our approach in a quantitative way, we created a ground truth dataset by inviting an additional expert. The invited expert was not participating in the rest of the evaluation. His task was to watch and annotate “dangerous” situations in a video recording of a professional league soccer match. These include all situations that, according to expert opinion, may lead to a goal, a penalty, foul or other relevant match events; hence, we consider these interesting. During the study, we used an anonymized version of this match as our ground truth dataset for our quantitative evaluation. Several other anonymized matches from different leagues were used for qualitative evaluation tasks. The analyzed matches had been anonymized to prevent the experts from personal bias and using possible background knowledge while interacting with the system. In the end, our ground truth dataset contained 35 annotated “dangerous” situations. Each situation represents one move with variable length and characteristics, as described in
Section 3. A move can represent both a fast counter attack and a slower, more structured build up play. The lower number of annotated moves, in comparison to other sports, can be explained by the more defensive behavior of teams in soccer. Soccer teams nowadays act even more defensive than 40 years ago [
37]. A recent analysis of Premier League soccer matches [
38] ranked all teams with respect to the average amount of shots per match. The top ten teams range from 10.6 to 17.4 shots per match. Other sports, like American football (125 offensive moves per match in the NFL), basketball (80 offensive moves/shots per match) or ice hockey (27.6 to 34.1 shots per match in the NHL) are way more offensive [
39]. According to these numbers, the 35 annotated dangerous moves that were of particular interest to our expert can be considered realistic.
At the beginning of the study, we explained to the experts the function of the overall system and how to semi-automatically identify interesting situations. We explained the main components of our system, including the main soccer pitch visualization, on which several visualizations for the representation of player or ball movements can be added. After this, we instructed the experts how to start the detection of semantically-meaningful events and what parameters, such as the type of event for a search template, could be chosen. Our two experts acting as analysts then got a basic task to familiarize themselves with the system. The task consisted of searching for “dangerous” situations, starting with the “shot” event as the first training data. The classification was not just applied to the 35 dangerous moves. Instead, each classification was applied to the complete input match according to the training and application of the classification model described in
Section 3. Furthermore, we did some experiments with the application of trained classifiers on different matches. Our system presents after classification a timeline, soccer pitch and a visualization pointing to several moments of the game being of potential interest. The experts were able to inspect every found suggestion and to interact with them to either confirm or reject them. After inspecting every suggestion, the experts were able to repeat the classification to retrieve new suggestions adjusted to his or her personal preferences. After completing this task, the experts were free to follow their own exploration paths.
Both experts were very able to solve the problem given and followed their own useful exploration paths. This is additionally indicated by the results of the analysis of our ground truth dataset (as expert annotated, see above) shown in
Table 2. Our ground truth dataset contains 35 annotated “dangerous” situations from which our experts eventually were able to detect 29 using our system. It is very interesting to see how the classification process developed through the integration of the analysts’ feedback. The confirmed moves of every classification step were added as additional training data. Rejected game moves often represented set plays, like free kicks or corner kicks into the penalty area. Our experts argued here that they want to treat set plays differently, because of their specific character.
Table 2.
Accumulated results of the quantitative evaluation of our ground truth dataset. Although the overall precision slightly decreases, the benefits from integrating the user into the machine learning process are clearly visible.
Table 2.
Accumulated results of the quantitative evaluation of our ground truth dataset. Although the overall precision slightly decreases, the benefits from integrating the user into the machine learning process are clearly visible.
| | Precision | Recall | F-Measure |
|---|
| First Classification | 61.53% (8 of 13) | 22.85% (8 of 35) | 33% |
Second Classification
(First round of user feedback) | 58.82% (20 of 34) | 57.14% (20 of 35) | 57% |
Third Classification
(Second round of user feedback) | 55.76% (29 of 52) | 82.85% (29 of 35) | 66% |
The identified situations across all analysis tasks consisted of all kinds of moves, always dependent on the type of situations in the search template of the classifiers. All confirmed situations were of high interest to the expert and either relevant for urgent tactic discussions in the half-time break or future match preparation tasks. An example situation can be seen in
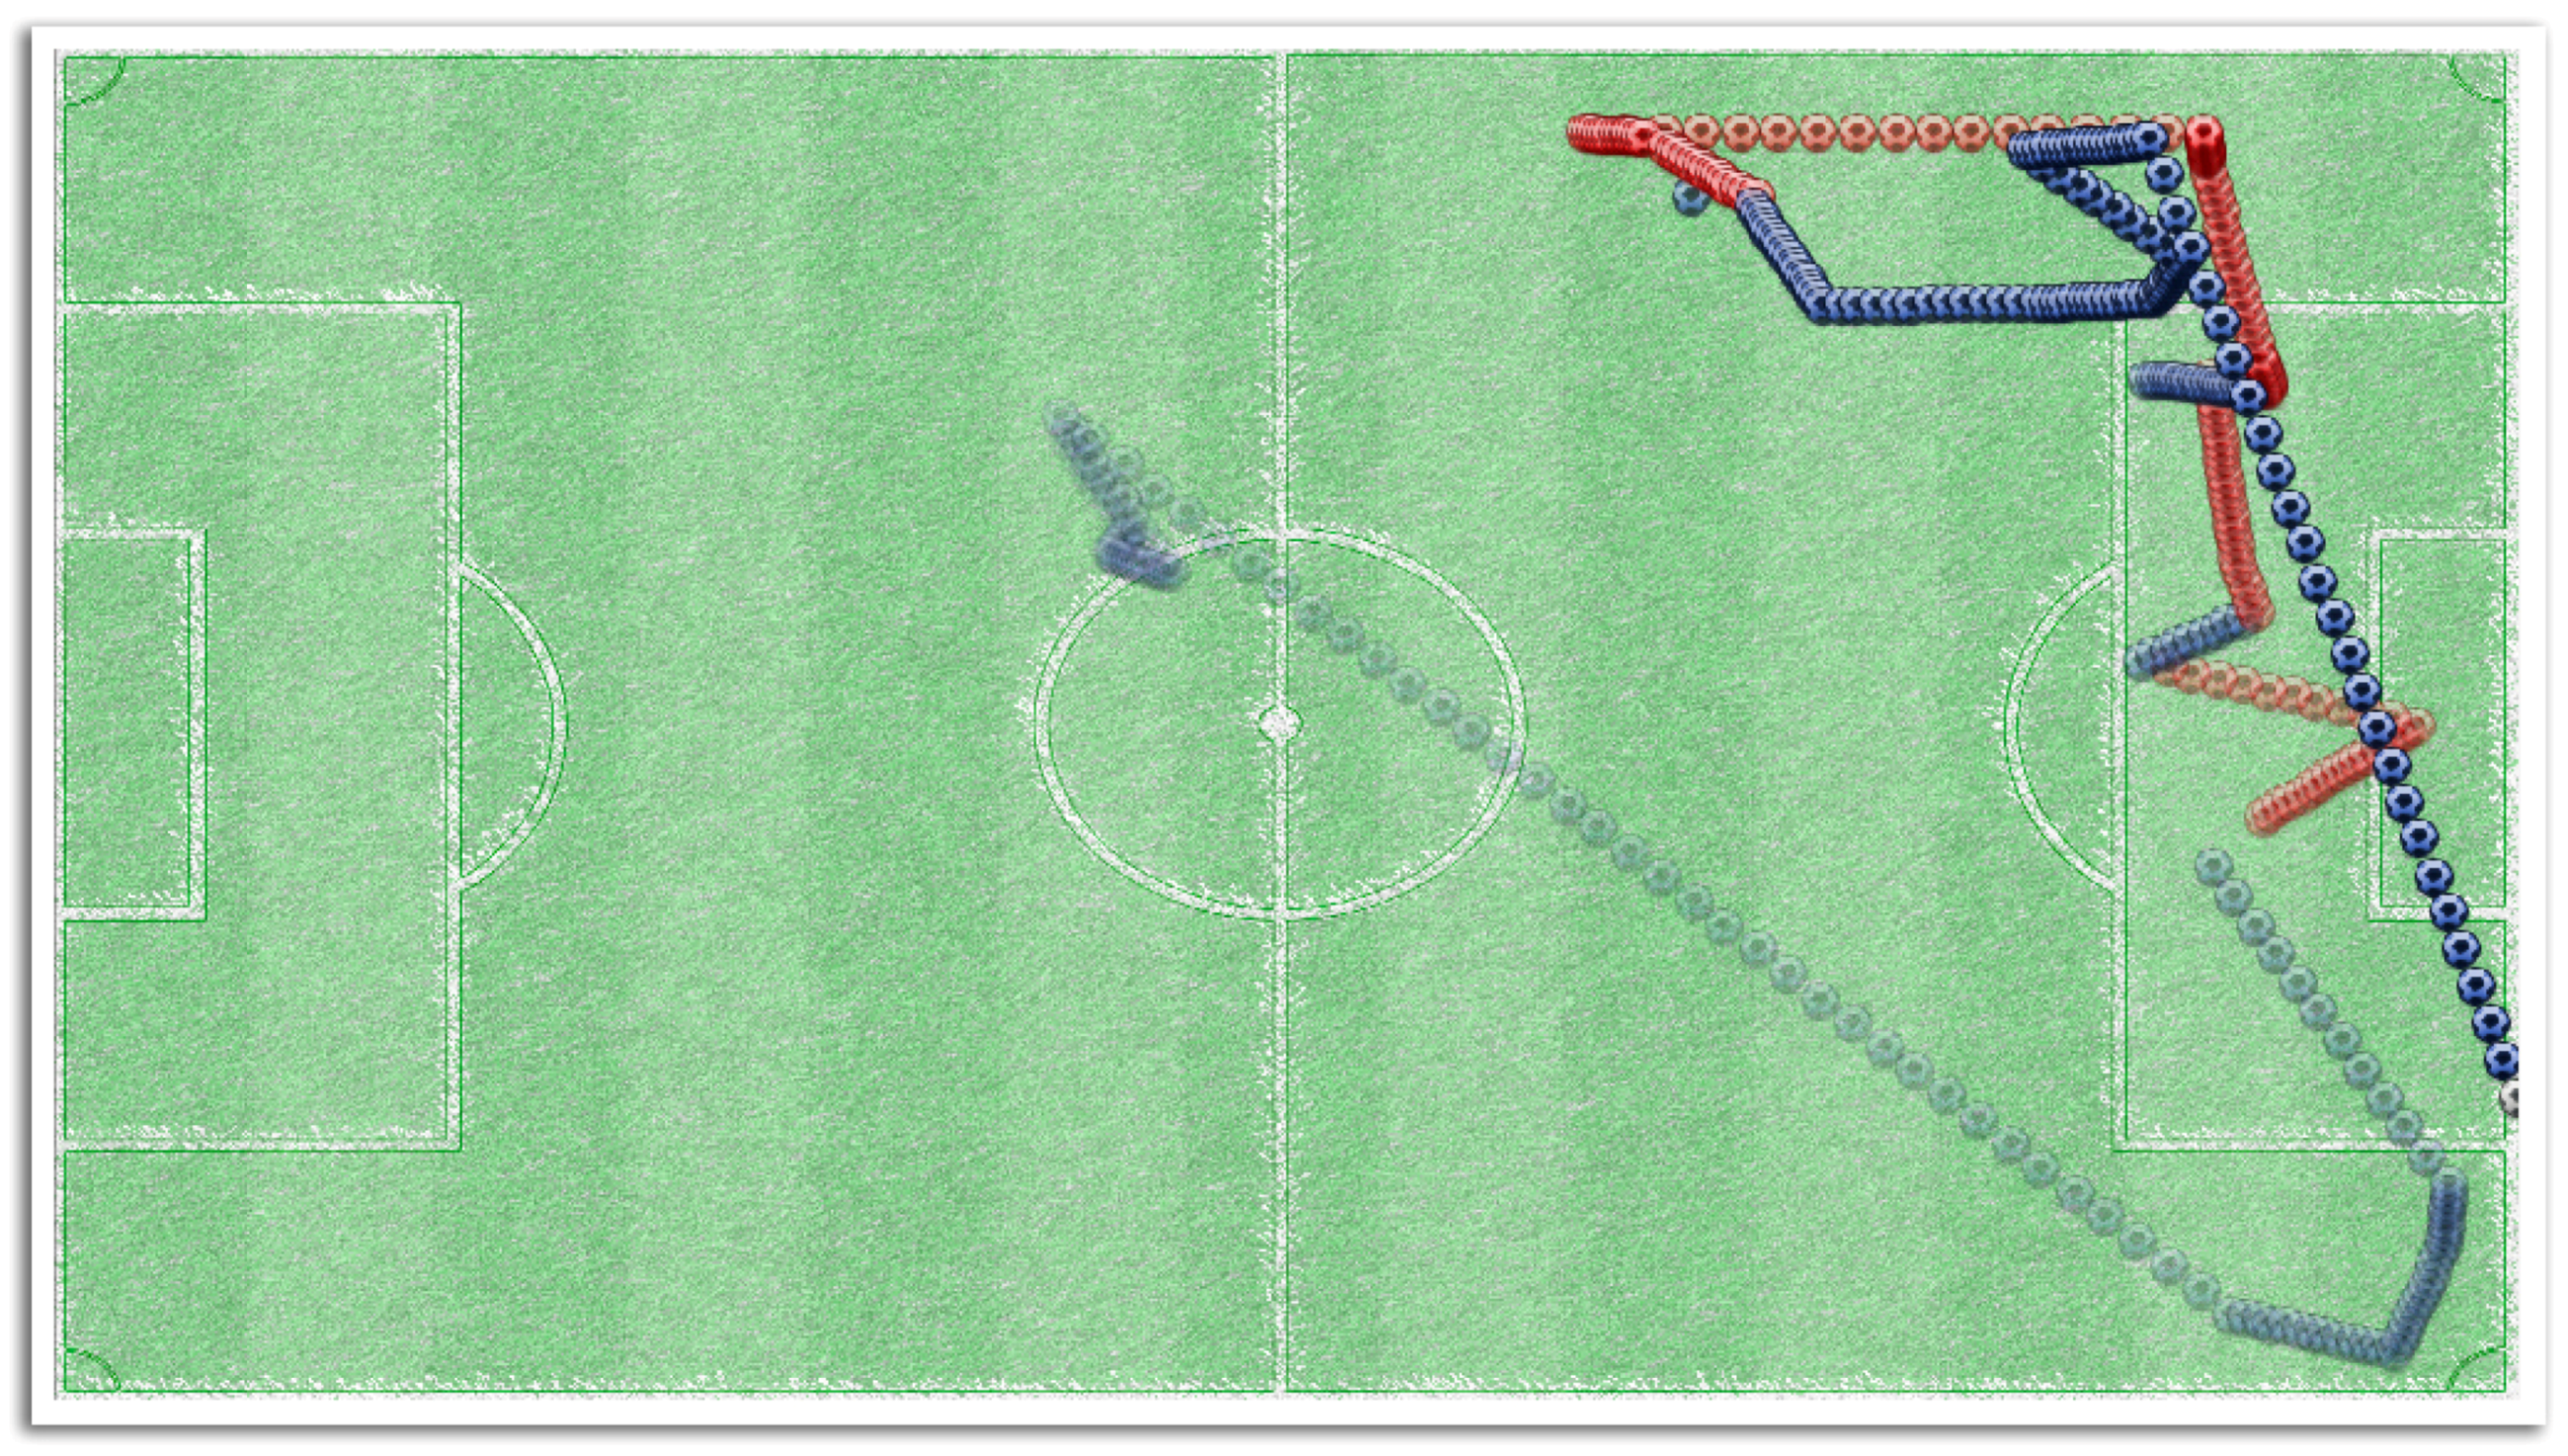
Figure 10.
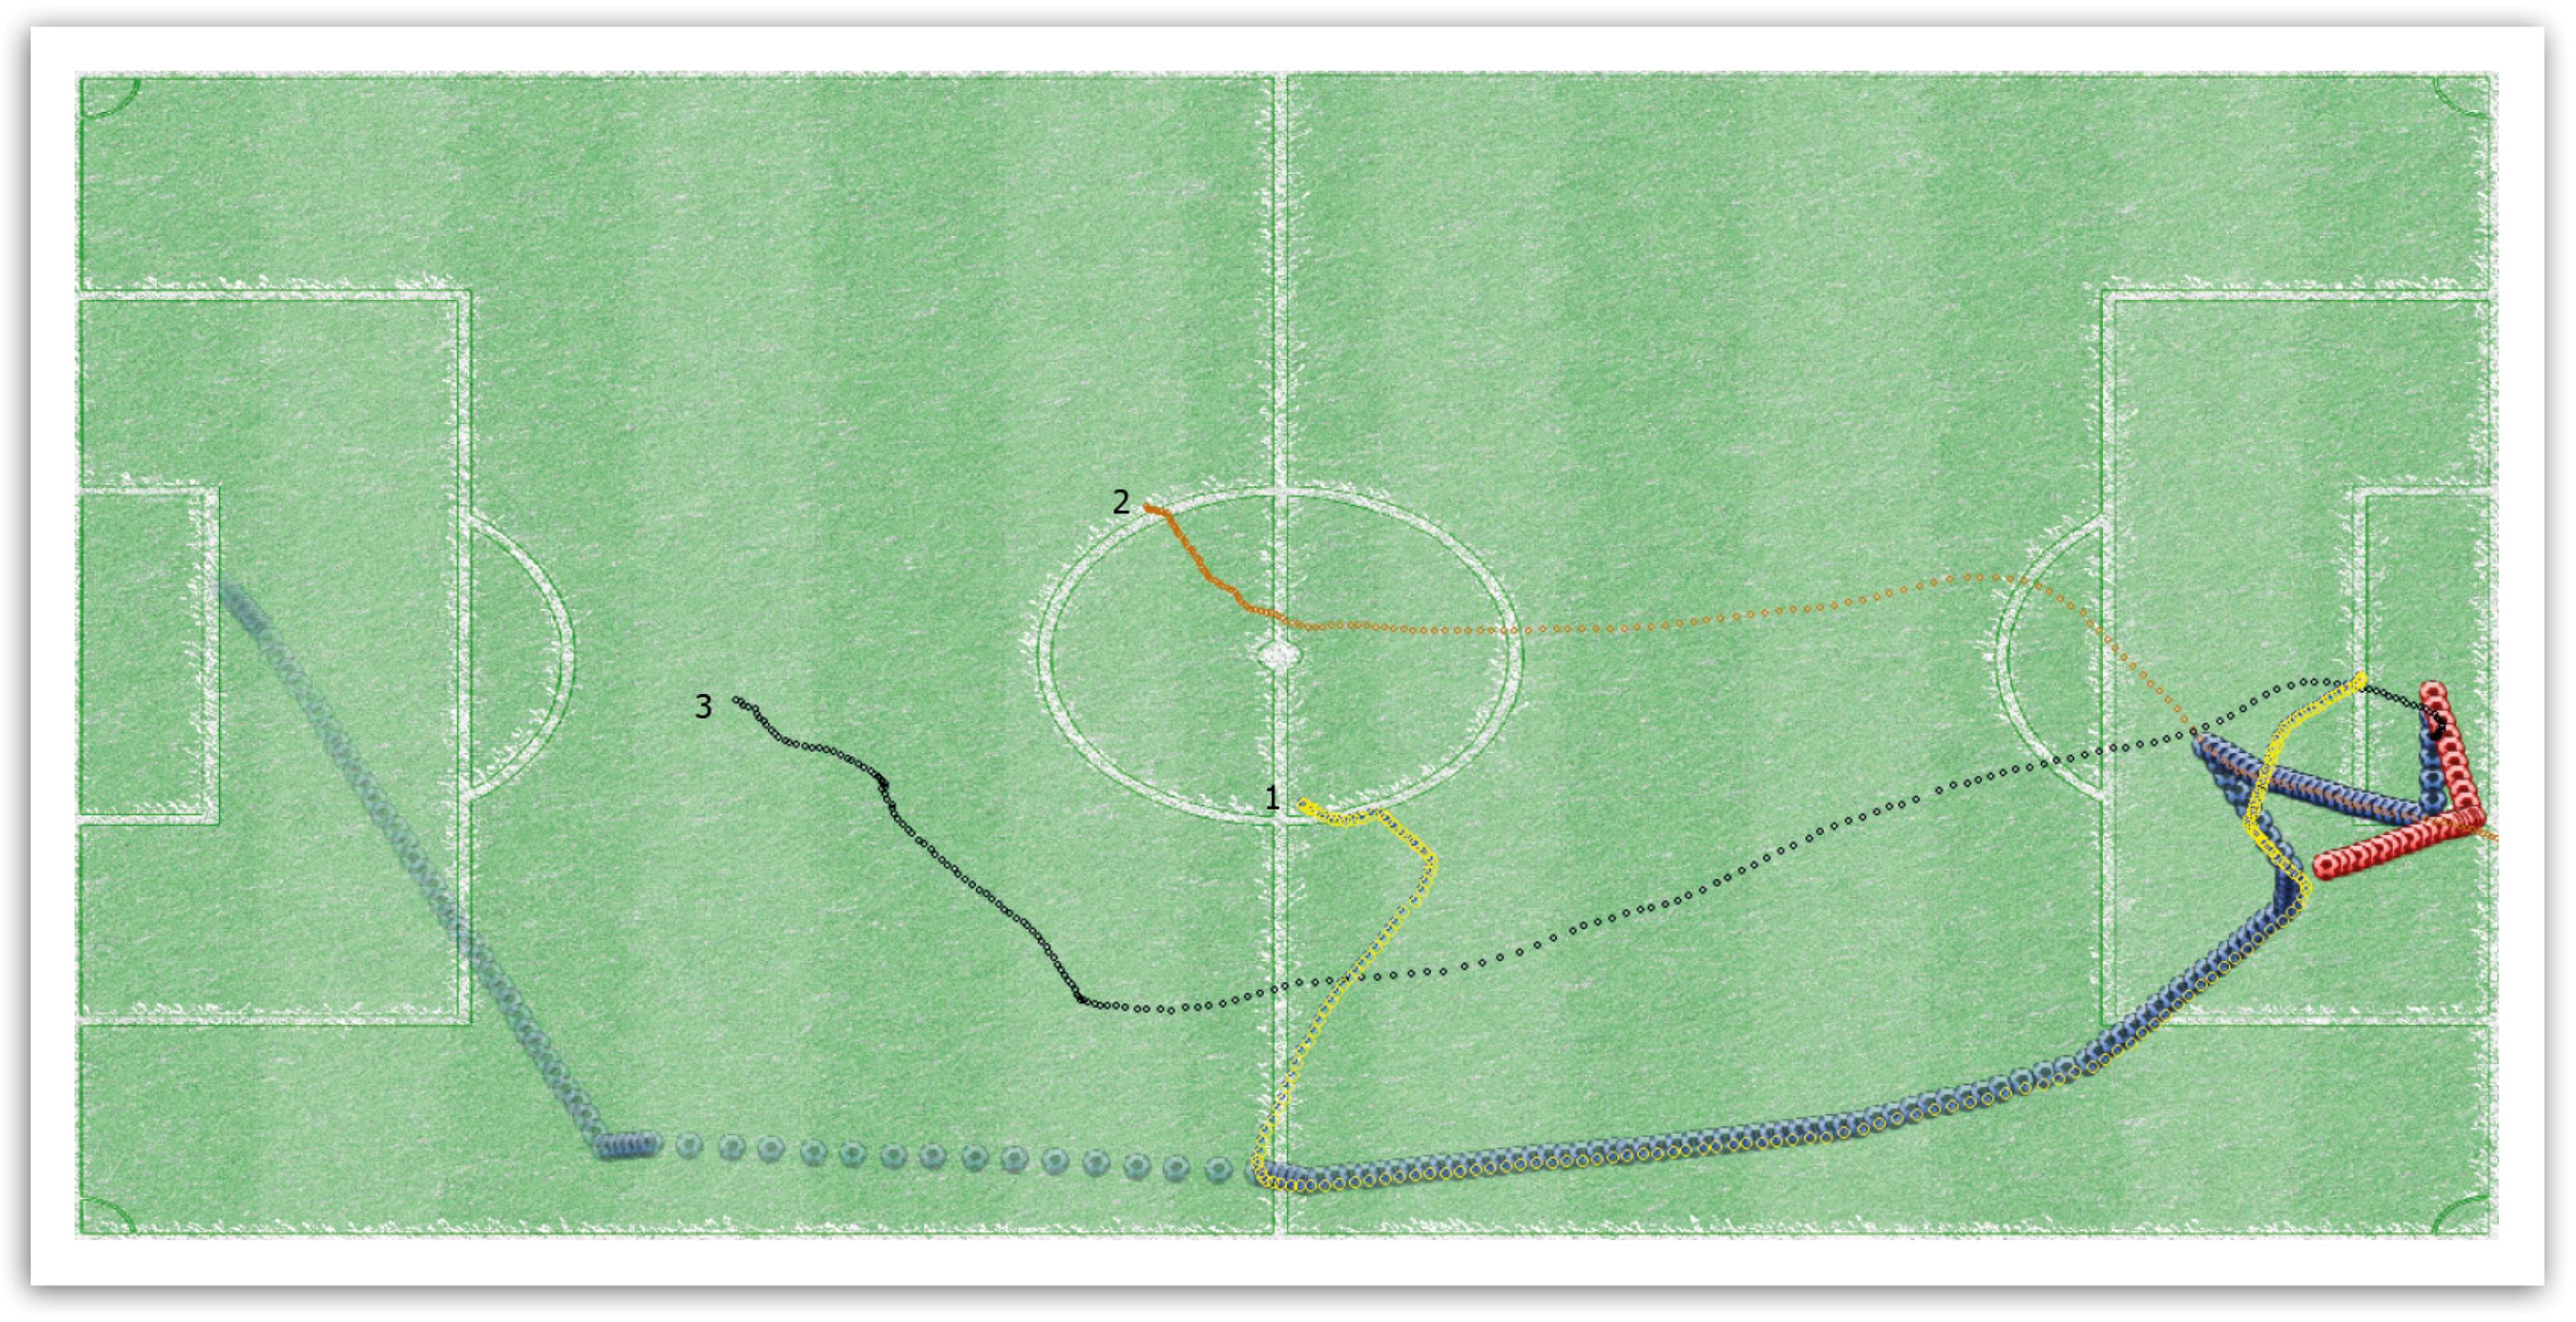
There we can see a fast counter attack of the blue team, starting at the goalkeeper. Upon closer inspection, it became clear to us that especially three players and their team play were responsible for a quick and almost successful counter attack. The moving directions of these three players are depicted in
Figure 10. The game move begins when the right forward, labeled as 1, quickly moves from the center to the flank and gets in possession of the ball. Afterwards, the right forward dribbles into the penalty area of the opposite red team, almost through the whole opposing half of the pitch. Just before the six-yard box, he makes a pass to his strike partner, the left forward, whose moving direction in
Figure 10 is labeled as 2. The left forward then makes a cross over with the right forward to successfully confuse the opposing team. Afterwards, the left forward dribbles onto the baseline and tries to pass to the left offensive midfielder, labeled as 3, who would have been in position to shoot on the goal. This pass however gets intercepted by a player of the red team, and the move ends. This counter attack was carried out with high speed and lasted no longer than 19 seconds. This found game move is, according to our expert, because of its dangerousness, of high relevance to the coach. If the coach of the red team would have known about this attack pattern, he could have prepared his defenders for the fast team play of these three offensive players.
Figure 10.
Annotated and former unknown detected fast attack over the right flank by the blue team. Remarkable is the interaction between the three participating offensive players, here displayed by their visualized trajectories. Each trajectory is labeled by a number and colored separately. The color of the ball represents which team was at which moment in possession of the ball.
We consider the results of this study as an indicator that our classification approach is able to retrieve suggestions for almost every kind of search task, as long as there exist sample situations to learn from of the different classifiers used.
While interacting with the system, the two experts identified the following shortcoming. Coaches want to define and validate their intuition or experience-based hypotheses with the system. To support this even more, we need possibilities for not only showing when something interesting happened, but to display what has happened. Until this point, we only gave time indications for situations of interest. The user then had to repeatedly manually inspect the animation of a scene to see what was tracked and, thereby, recognize the type of situation. This should be addressed by combining the search for specific kinds of situations and the visual representation of their characteristics to enable quick overviews and trend estimations by the analyst.
4.3.2. Understanding Characteristics of Collective Team Movement
With our extension proposed in
Section 3.1, we address the aforementioned shortcoming and present our solution by displaying more background information to improve an analysts understanding of why a certain game move was interesting. This background information would give the analyst a clue of what to pay particular attention to when inspecting found moves.
The evaluation was performed as follows. We started by repeating and explaining the workflow, pointing out where our extension about move characteristics is integrated. The experts both remembered how the system is used and were able to retrieve suggestions for interesting situations by fulfilling simple classification tasks. We then discussed the designed set of semantically-meaningful features and whether the experts consider them appropriate for the context of displaying a situation’s characteristics. Both experts stated that they consider our approach of reducing a situation’s complexity by splitting it up into various semantically-meaningful features as correct and valuable. Furthermore, the experts agreed on the developed features as suitable for the given tasks. While discussing, the experts gave several suggestions for additional, more in-depth, move-related features, like the average amount of touches of the ball a player has until he passes it. According to our experts, this would be a nice addition due to the fact that some coaches consider a minimal amount of touches of a ball to be increasing the move’s overall chance of success.
Afterwards, the experts were given some tasks to test the capabilities of our designed system and its various interaction possibilities. As in
Section 4.3.1, an anonymized and previously unknown match was loaded, and some suggestions for interesting situations were retrieved via classification. One task was to explore the top characteristics of a team during offensive attacks while making use of the different ways to give feedback to the system. While they were doing this, they were motivated to inform us whether they confirmed the visualized characteristics with respect to their own experience. This task was well solved for each expert and resulted in fruitful dialogs where the experts analyzed and explained the moves. In general, the experts agreed on every displayed move characteristic. One expert mentioned an improvement possibility, whereby we could additionally display a characteristic’s influence on the outcome of a situation by adjusting the height of a ranked element in the flow visualization. After finishing with all tasks, the experts could again freely use the system to explore. There, the experts especially liked to make use of the similarity search to derive moves with similar characteristics as given query moves. An example move the experts found very interesting can be seen in
Figure 11 and
Figure 12. This example was identified via the similarity search by using a situation that was highly characteristic for noticeable disorganization.
We concluded the evaluation with a structured interview regarding the understanding and usefulness of the visualization. Specifically, we asked for the expected impact that our suggested workflow will have on the work of a professional soccer analyst and how the various interaction possibilities (re-ranking, highlighting, similarity search) were appreciated. Eventually, we asked about suggestions for improvement. The experts approved of our workflow as very helpful for detecting, exploring, analyzing and comparing interesting game situations. They mentioned the usefulness of our system for the prediction of the opposite team’s behavior. According to our experts, professional video analysts would make extensive use of a system designed with respect to our workflow. While getting used to such a system, an expert would make more and more use of it as his or her trust in the results increases. The experts did understand and approved of the way we visualize characteristic features of movements. Visual highlighting to analyze the development of a single characteristic was mentioned as a valuable extension. The experts appreciated the connectors between single features helping them with this task. The similarity search was often used during analysis, to explore whether a found pattern is occurring frequently during a match. To this end, the experts liked that they were able to define how similar another move relatively has to be with respect to the base move and take that as a suggestion to explore and compare with other match situations. The possibility to change a features ranking according to an analyst’s experience was very welcome. One expert declared that the possibility to reset some decisions from time to time would be helpful.
Figure 11.
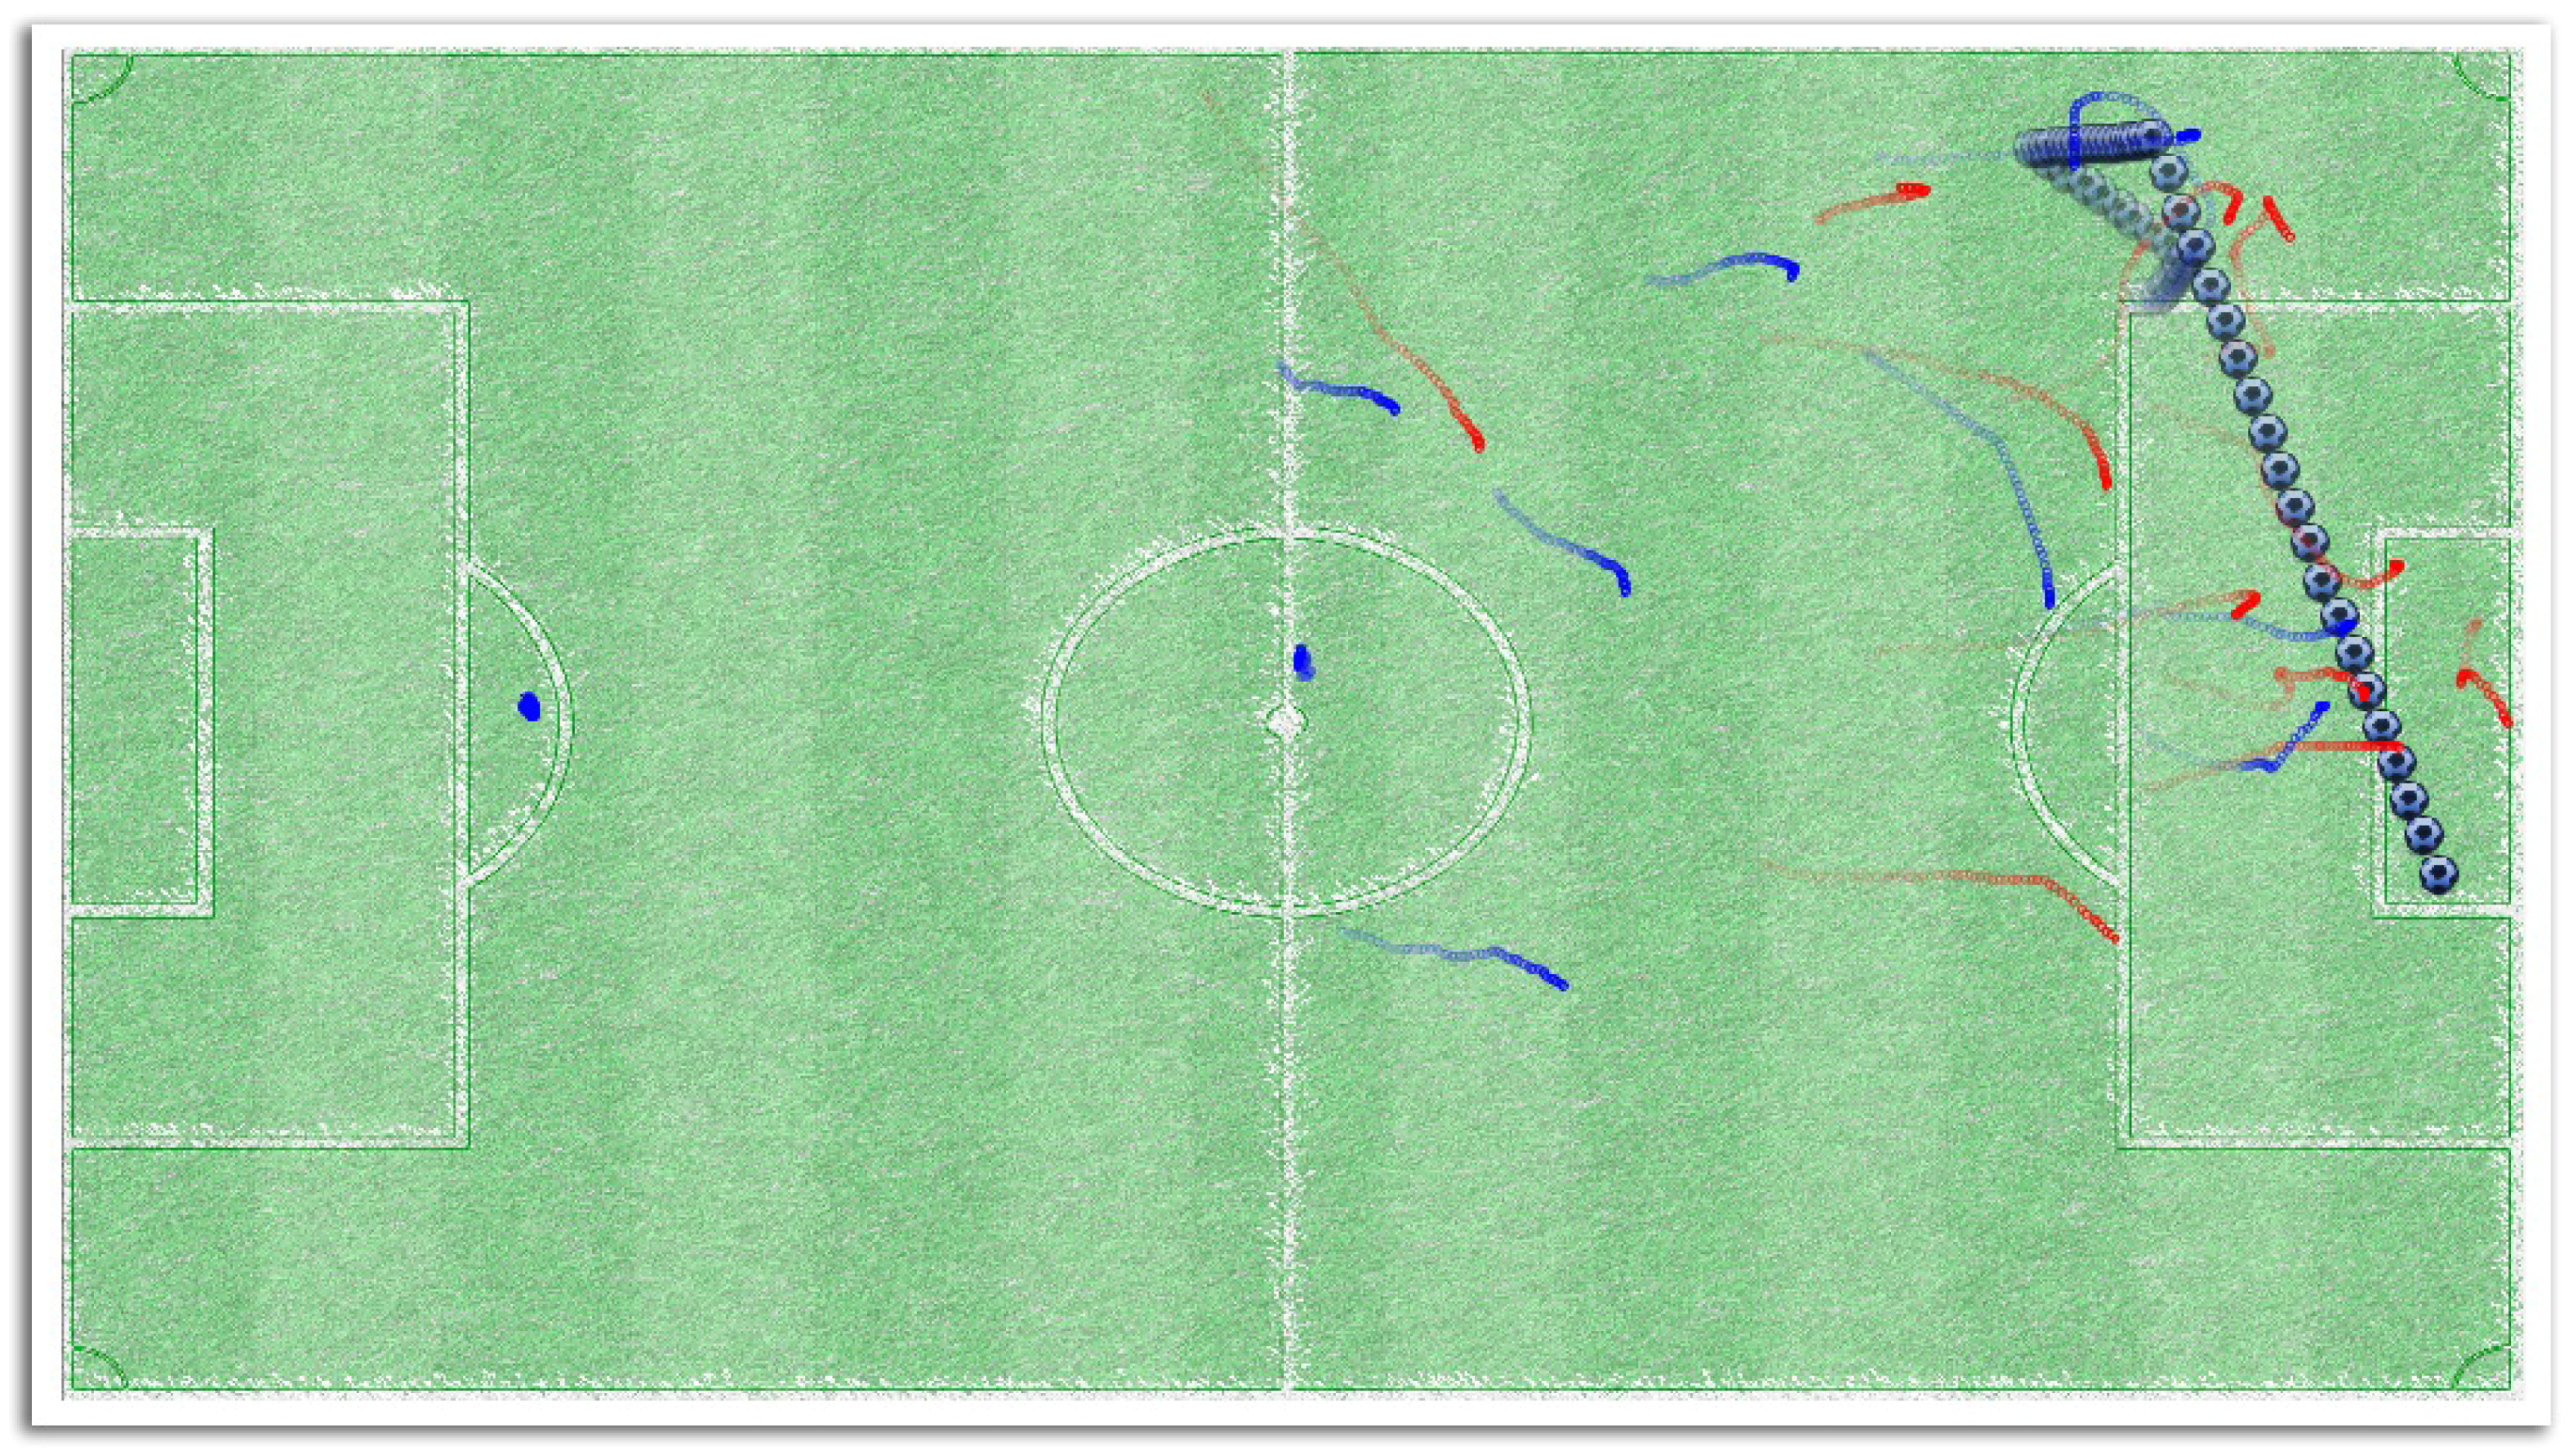
This visualization shows us the trajectory of the ball over a move. The color of the ball represents which team was in possession of the ball. The more transparent the ball is, the more movement happened in the beginning of the move. This move was detected by searching for similar moves where the semantically-meaningful feature straightness was very low. Disorganization is characteristic. Although the red team gets possession of the ball several times, it is not able to clear the situation. This serves as a strong indicator for a coach to take action.
Figure 11.
This visualization shows us the trajectory of the ball over a move. The color of the ball represents which team was in possession of the ball. The more transparent the ball is, the more movement happened in the beginning of the move. This move was detected by searching for similar moves where the semantically-meaningful feature straightness was very low. Disorganization is characteristic. Although the red team gets possession of the ball several times, it is not able to clear the situation. This serves as a strong indicator for a coach to take action.
Figure 12.
Same move as in
Figure 11. Depicted is the cross that led to the annotation as a possible suggestion for the analysis. Furthermore, we can see the movement of the players of both teams. The color of a player represents his or her team.
Figure 12.
Same move as in
Figure 11. Depicted is the cross that led to the annotation as a possible suggestion for the analysis. Furthermore, we can see the movement of the players of both teams. The color of a player represents his or her team.
5. Discussion
In this section, we discuss our proposed methods with respect to the advantages, limitations and applicability of our approach to other domains. Furthermore, we will outline future work based on the feedback of our domain experts.
According to the expert evaluation, the semi-automatic analysis is of great help, in particular when there is no time for a fully-manual analysis. Furthermore, the presented system allows analyzing more matches in less time, as compared to manual video analysis. The data of opposing teams could be obtained beforehand to search for significant patterns and to uncover vulnerabilities. Current developments in soccer analysis and coaching show that coaches prefer to make a decision on the basis of facts instead of pure intuition. The experts furthermore state that the designed semantically-meaningful features are representing all essential characteristics of game situations. They approve of our workflow as appropriate for the detection and analysis of interesting moves. Our research is seen as an important step to efficiently break a soccer match down into analyzable and understandable parts of information. According to our experts, the flow visualization of move characteristics is easily understandable and allows insights into the potentially complex interdependencies and patterns of which a match scene consists. One expert wishes to additionally use the size of the elements in the flow visualization to represent the influence of a characteristic on the outcome of a situation. Highlighting was seen as a valuable addition to analyze feature trends. The experts liked the possibility to change the ranking according to their experience. Both experts especially mentioned the usefulness of the similarity search for the work of the analysts. In the interview, both experts declared their motivation to make use of a system designed with respect to our proposed workflow.
We motivated our research by a tedious manual analysis process that was very exhaustive and expensive. We proposed a visual analytics system allowing one to find interesting situations more quickly. In our expert studies, we were able to detect the most interesting situations in sessions of two to three hours. According to the subject matter experts, our visual analytics approach helped them with investigating a previously unknown match and revealing interesting insights.
One of our experts asked for the possibility to draw and annotate situations directly in the visualization. He argued that as a coach, one needs to communicate and give feedback to his players regarding certain match situations. Several other suggestions for improvement, for example a magnifying glass to zoom in or the possibility to prioritize found new game moves based on their relevance for either half-time break of the follow-up analysis, were expressed and are planned to be integrated in the future.
We designed our system to be modular regarding the data mining and ranking capabilities and scalable in the number of moves analyzed. According to our use cases and expert feedback, we believe that the methods applied are appropriate. In our application domain, the maximal number of color-wise distinguishable features is sufficient. More features tend to overwhelm the analysts, and it seems to be more important that the shown features are semantically meaningful than showing more features. This is supported by Miller’s law [
40], which argues that the number of objects an average human can hold in working memory is seven plus or minus two. The amount of moves visualized together with their features is limited by the screen width. From our studies and experiments, analyzing twenty moves in combination with the semantically-meaningful features seems to fulfill the analysts’ needs.
We believe that our proposed workflow is generalizable and applicable to domains other than soccer. Other team sports, such as basketball, handball, ice hockey, or American football, have similar properties. They consist of two teams moving in a limited area and different kinds of interesting events potentially described by meaningful features. Furthermore, one might apply, extend and evaluate our proposed workflow in the research field of collective behavior, including animal movement. Analyzing groups of moving animals, for instance flocks of birds, is to some extent similar to team sports. However, animal movement is not restricted by game rules or pitch limits. Consequently, we are interested in finding commonalities and differences in both domains.
Currently, the feature ranking module is straight forward and based on extreme values of feature distributions. Although extreme values did work in our application scenario, there might be cases when more sophisticated rankings are required. The challenge will be to calculate the feature ranking with sophisticated methods, but still retaining an inspectable and interpretable ranking. Nevertheless, we want to extend our ranking method by several additional statistical measures according to the analyst’s needs.
Further future work includes transferring our methods from single to multi-match analyses. For example, we would enable soccer analysts to investigate how offensive situations are developing over a whole season or during tournaments. Our experts consider such long-term analyses to be very valuable and important. Our semantically-meaningful features have been designed and evaluated in close contact with domain experts. We plan to continue this design process, to model and to represent even more sophisticated features of interest. We furthermore see a possible future extension for our well-received similarity search. It may be beneficial, as well, to search for dissimilar situations. This may support the discovery (serenity search) by helping the analyst to see more new and former unknown situations to stimulate reasoning. We can in addition speculate about the potential by expected future methods of sensor technology regarding physiological measurements of an actor’s performance, as well as live commentary and social media integration. Eventually, we will integrate the expert’s feedback collected during our evaluation in order to improve our visual analytics approach supporting coaches in validating hypotheses.
6. Conclusion
We presented a visual analytics workflow to support experts in detecting and exploring interesting characteristics of game situations. We were able to reduce the complexity and the amount of time an expert needs to retrieve and analyze the most important moments of a match. Additionally, we provided insight into which situational characteristic a game situation consists of by introducing, ranking and visualizing semantically-meaningful features. The resulting visualizations were designed with respect to the human cognitive system. Interactions, such as drag and drop for re-ranking, rubber band selections for similarity search and mouse highlighting, have been developed to provide possibilities to give feedback and to support humans’ overall sense-making process. Our approach was evaluated extensively by subject matter experts, and we have discussed a range of possible extensions and interesting future work opportunities.


