1. Introduction
Major events, like music festivals or football games, attract tens of thousands of people. Unfortunately, accidents can happen every time despite high security preparation, and the consequences are often crucial due to the high number of visitors. In recent literature, crowd simulations that can be used for security issues during major events are typically not based on real-time sensed information but rely on empiric or physical heuristics. An overview of current methods and approaches for such crowd simulations (e.g., evacuations) is provided by [
1]. Compared to that,
in situ information has been a crucial part of navigation approaches in the field of robotics [
2]. A recent study by Hillen
et al. is focusing on fusing real-time
in situ and remote measurements to create a more realistic estimation of people movement using agent-based modeling [
3]. Except for extracting only position information from optical remote sensing data as conducted by Hillen
et al. [
3], studies in the field of crowd monitoring present promising results in estimating crowd density and dynamics [
4,
5]. The derived information can be utilized for a routing approach for major events.
However, event organizers and security authorities usually have very limited near real-time information about the location of visitors at the event site, despite the high penetration rate of smartphones in the general public [
6]. Terrestrial sensors, like security cameras, are often only available at the most important spots and only have a limited field of view. Recent airborne monitoring technology is able to provide additional high-resolution imagery in real time [
7]. Due to their mobility and large field of view, even large event sites can be captured in a couple of minutes. The increasing ground resolution of the captured images (e.g., 9 cm; see
Figure 1) allows for efficient detection of objects like cars and persons [
8].
In this paper, real-time aerial images are combined with smartphone movement data and integrated into a routing tool for major events. It is designed to be used by the official authorities (i.e., police or ambulance) as well as the visitors themselves. It can be of great use for open-air music festivals, where large groups could gather spontaneously in less monitored locations, or for events in city centers (e.g., fairs), as they often take place in multiple locations. In the case of music festivals, for example, the motion of the crowd directly in front of a concert stage is hardly predictable during a live performance. Although the number of people in the crowd might be below the area’s maximum capacity, the number of persons per square meter (crowd density) can quickly reach a critical level and lead to dangerous situations. If the crowd density rises above a certain threshold, the situation can become life-threatening and the authorities must intervene. But even in less dramatic scenarios, the perception of each person in these situations might be different. A person’s physical condition, hydration level, degree of intoxication, or even the weather conditions at an event could all be factors that influence a person’s desire to leave a crowded area in the fastest way possible. We assume that the fastest way is synonymous with the route with the lowest crowd density.
For these critical and non-critical situations, we propose a routing concept based on fusing 9-cm optical aerial images with movement data from smartphone users in near-real time. The major aim is to provide an up-to-date crowd density map with a least-cost routing functionality for the event visitor as well as for rescue forces and security authorities.
2. Methods
In this section, the automatic patch-based crowd density estimation and the extraction of movement trajectories from mobile smartphone sensor data are described. Furthermore, it is shown how these two types of sensor data are combined to derive a cost layer for least-cost routing purposes.
2.1. Crowd Density from Aerial Images
In the following, the process to automatically compute a density map of a crowd from aerial images (“crowd detector”) is described. This map is then input to a location-based individual routing application using a raster-based least-cost path calculation.
Before focusing on the computation of the crowd density map, we describe the necessary features of the aerial camera system. The routing system should work at large festivals with an event area of several square kilometers. Despite this large area, the density map must cover all crowded places and must be updated regularly. One major requirement for the generation of an up-to-date routing recommendation is the timely delivery of the density map to the server. To achieve this, a processing system with aerial cameras and an integrated data link must transmit the images to the receiving station on the ground. The processing includes a georeferencing and orthorectification step, which is not mandatory for the crowd detection itself, but for the fusion of image and trajectory data (
Section 2.3). The authors of [
9] describe a system with an on-board orthophoto generation and a bidirectional air-to-ground data transmission. Their system works well with the routing system presented in this paper, although the installation of the processing system could be located on the ground as well.
The aforementioned requirements of large coverage and short update intervals of the density map lead to a trade-off between the field of view of the cameras and the spatial resolution. Hence, in this study, we use the method described by Kurz
et al. [
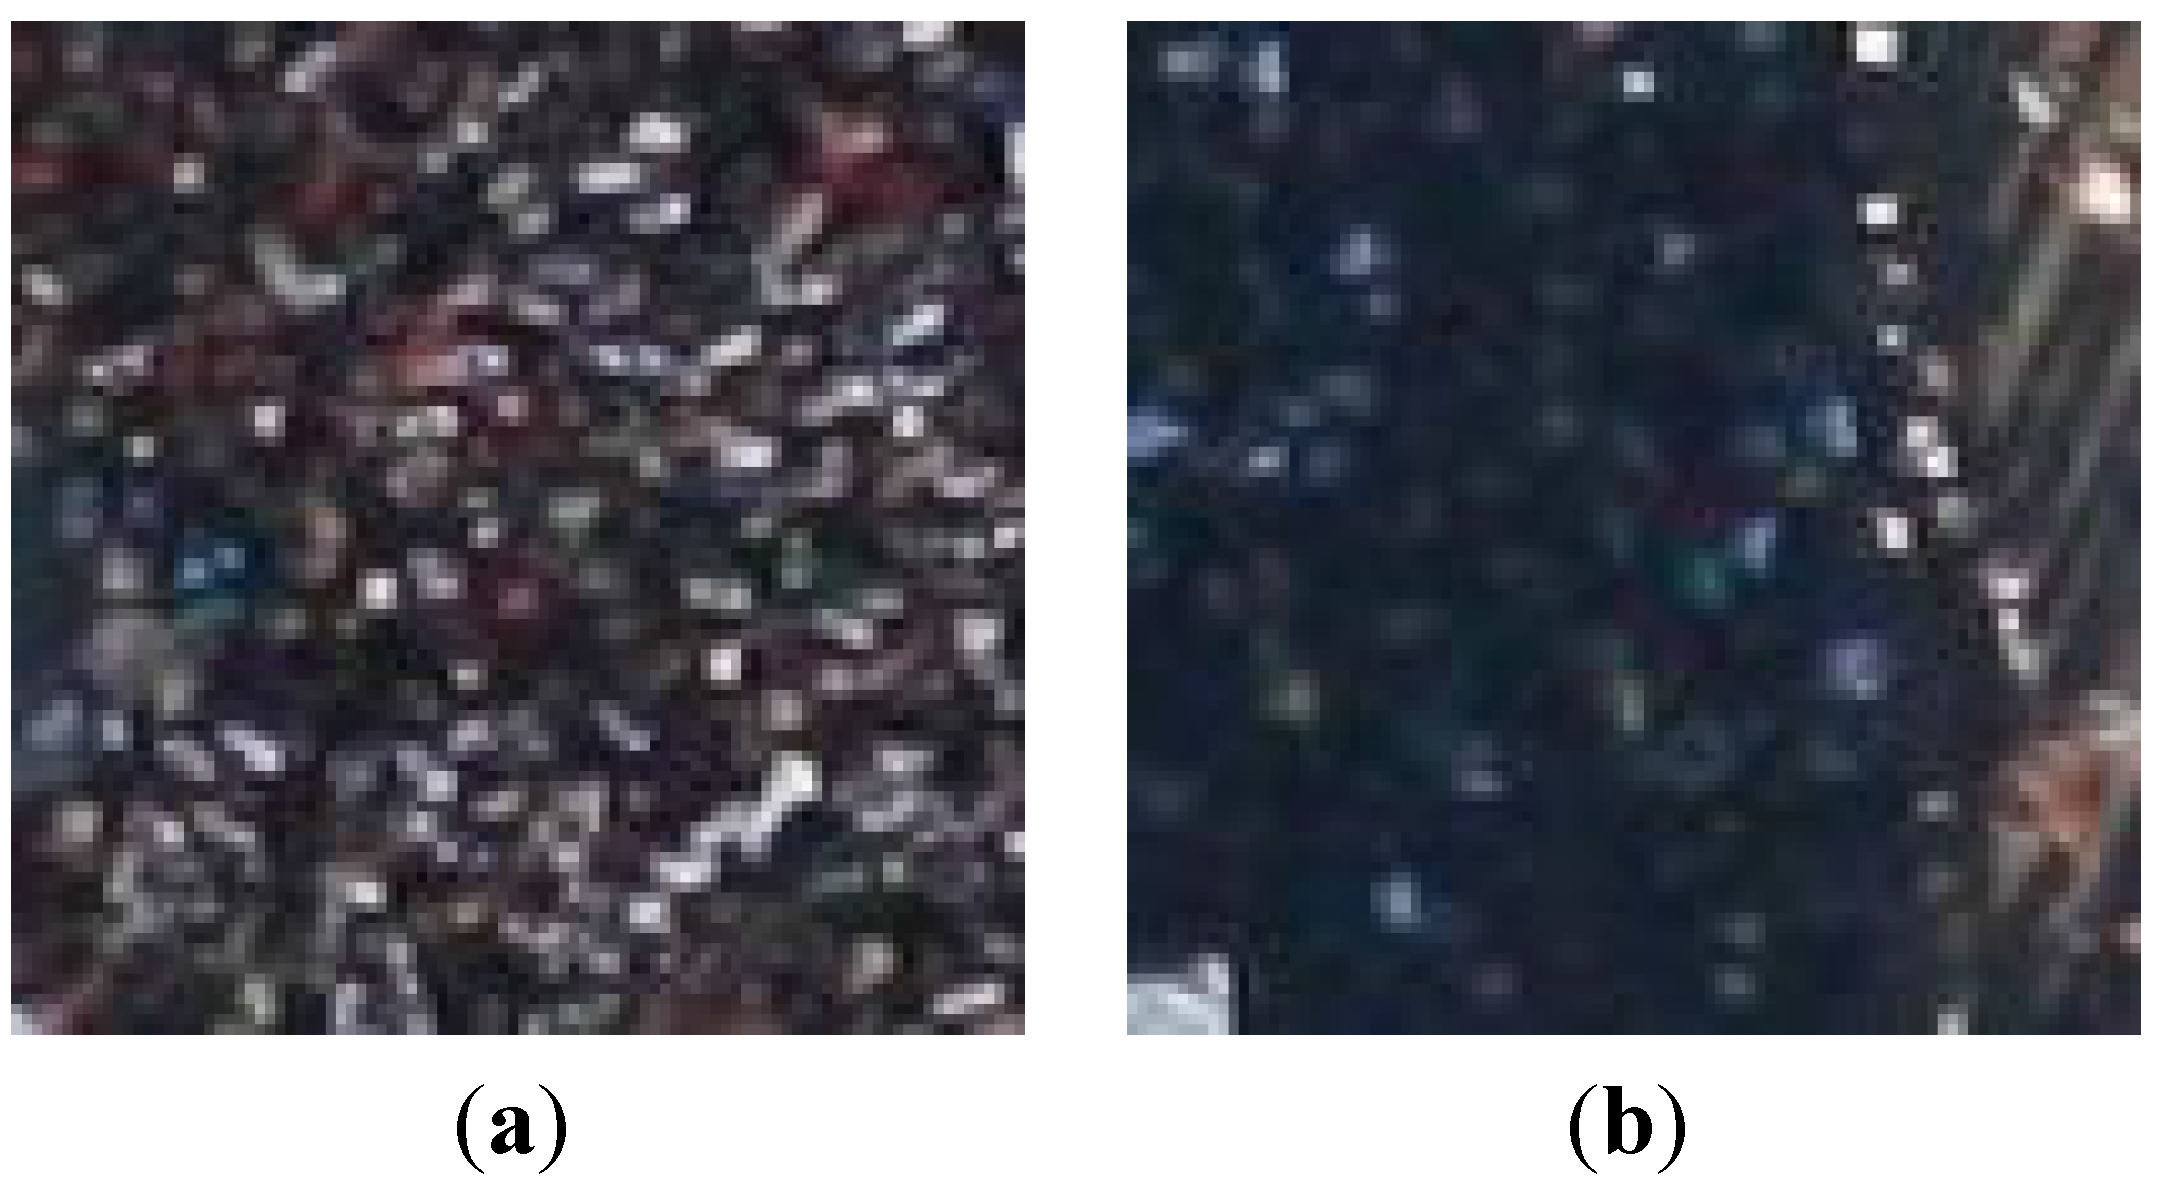
10], which is able to detect crowds in aerial images with a resolution of approximately 9 cm. At this resolution, a single person appears as a small blob of roughly 5 × 5 pixels. In very crowded scenes these blobs are hardly discernible due to occlusion and changing lighting conditions. In this case, they instead form a heterogeneous texture without any orientation or regular pattern structure (
Figure 1a). Moreover, the appearance of these textures distinctly changes depending on background pixels and lighting conditions (
Figure 1b).
To overcome these problems we use the crowd detection tool chain proposed by Meynberg
et al. [
10]. The approach convolves image patches of a constant size with a Gabor filter bank and uses a concatenation of filter responses as the input feature vector for a support vector machine (SVM). Readers are referred to [
10] for development details. In the context of this paper, we use the term “crowd texture” to describe an image region where persons stand very close to each other and form one coherent structure. The term “crowd patch” is defined as a patch containing this crowd texture. We now summarize the main processing steps of their method, which estimates the person density in aerial images for which no further
a priori knowledge is required.
Figure 1.
Example of two 100 × 100 pixel image patches containing human crowds (9-cm resolution). The major challenges are varying lighting conditions, varying backgrounds, and mutual occlusions. (a) High crowd density, many occlusions; (b) low contrast.
Figure 1.
Example of two 100 × 100 pixel image patches containing human crowds (9-cm resolution). The major challenges are varying lighting conditions, varying backgrounds, and mutual occlusions. (a) High crowd density, many occlusions; (b) low contrast.
2.1.1. Detecting Interest Points
The purpose of this step is two-fold. First, it detects corners and saves the coordinates as possible locations of a person, which are the basis for the density estimation described in
Section 2.1.4, and second, it significantly reduces the search space for the filtering in
Section 2.1.2. The search space reduction is motivated by the fact that during a flight campaign a large number of images are being taken, each image having a resolution of around 18 megapixels. With the original images as the input, the outputs of this step are possible pixel locations where a high number of people are located. Because of the computationally expensive feature extraction and classification steps, the search space should be limited to image regions where a high number of people is likely to occur. In 9-cm resolution aerial images, one person appears like a small blob or corner with a size of roughly 5 × 5 pixels. Therefore, a corner detector by Rosten and Drummond [
11] is first applied to the whole image, which reduces the locations of possible crowd textures from theoretically all pixel positions to only those positions that are detected as a corner, and hence have the necessary condition to be considered for further processing. In this way, the number of filter operations that are performed according to
Section 2.1.2 can be reduced by a factor of 1000 (depending on image content) to allow for usage in time-critical scenarios.
2.1.2. Finding a Feature Vector Representation for Crowd Image Patches
The input of this step is an array of all possible pixel locations of crowd textures and the output is a set of feature vectors that discriminate well between image patches with crowds and image patches without crowds. In the following, we describe how such a feature vector is created. Every image patch
is convolved with a bank of Gabor filters. These filters are particularly appropriate for texture representation, first introduced by Manjunath and Ma [
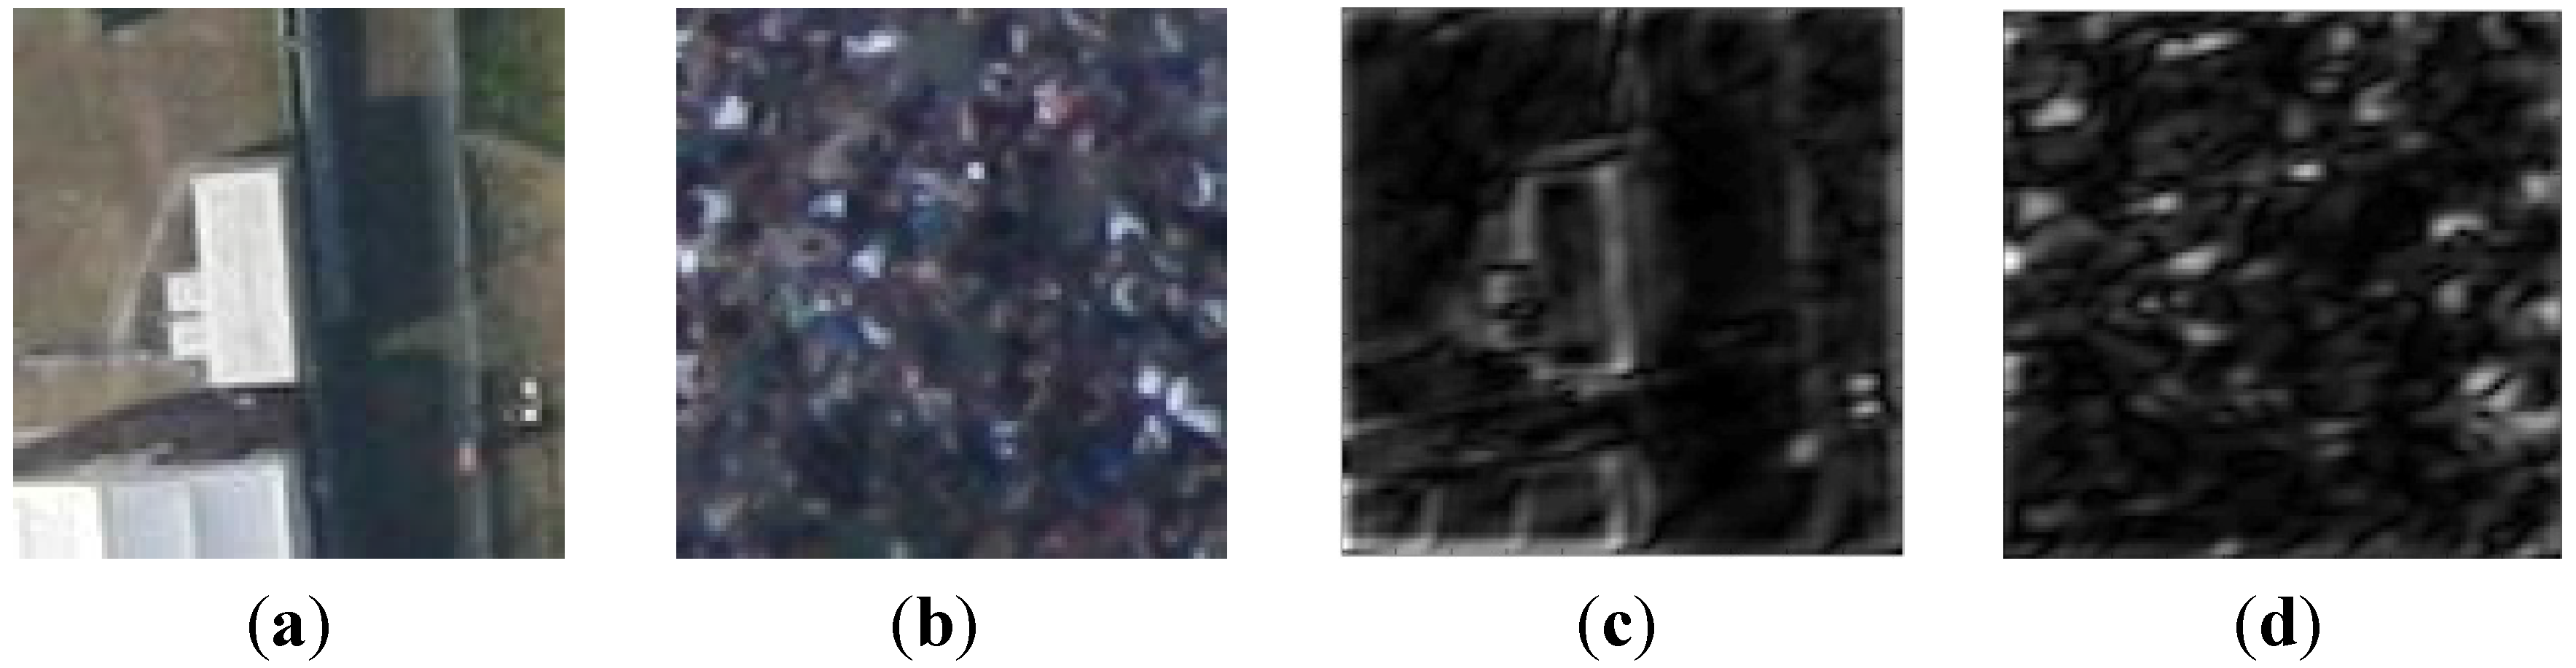
12], as they encode both orientation and scale of edges in a low-dimensional feature vector. Image patches with regular building structures (
Figure 2a) result in a strong response at certain orientation angles (
Figure 2c). On the contrary, a crowd patch (
Figure 2b) gives a high response in every direction (
Figure 2d), because the persons do not form any regular pattern. In this way, it is possible to construct effective, discriminating feature vectors for the binary classification task that follows.
Figure 2.
Two original images (a) and (b) with their respective response images (c) and (d) after convolving both with a Gabor filter. Subfigure (c) shows the response of the regular structure in the original image (a), while (d) shows the response of the unstructured crowd in the original image (b).
Let
be an image patch at a candidate pixel position (x,y). Its Gabor wavelet transform is thus defined as
where
is one Gabor filter function where s and k determine the scale and the orientation angle of the filter, respectively. Next, for each combination
the mean
and variance
are computed and stacked into the final feature vector
:
with
being the number of orientations and
being the number of scales of the filter bank.
2.1.3. Classification with Non-Linear Support Vector Machine
The set of all feature vectors
is then passed as a matrix to an SVM with a radial basis function kernel. Its return value is a vector of scores that determines if an image patch has been classified as a crowd patch or not.
2.1.4. Crowd Detection: From Binary Classification to Continuous Density Estimation
Now the list of possible person locations (
Section 2.1.1) and the classification result (
Section 2.1.3) are combined. From now on, only those possible person locations that lie within a positively classified image patch are considered and are used to compute a probability density function with a Gaussian kernel over the image domain. In this way, the crowd density estimation can be expressed as an intensity value. This value can be assigned to every pixel of the original image and not only to a finite and very sparse set of detected corners. To this end, the assigned value is not calibrated with a verified crowd density that can hardly be measured in a real-world scenario; however, it is still sufficient to serve as a two-dimensional cost function in this context.
2.2. Movement Trajectories from Smartphone Data
The preliminary step for working with smartphone sensor data is the implementation of an app to record specific internal sensor data via the Android API [
13]. For this work, the current geographic location of the smartphone user and the corresponding movement direction along with the estimated movement speed are derived from different smartphone sensors like the acceleration sensor, compass, and GPS/GNSS (Global Navigation Satellite System). Based on previous investigations, we claim that the position accuracy of GPS/GNSS is sufficient especially for events in rural areas but also for events in small and medium-sized cities [
3]. In
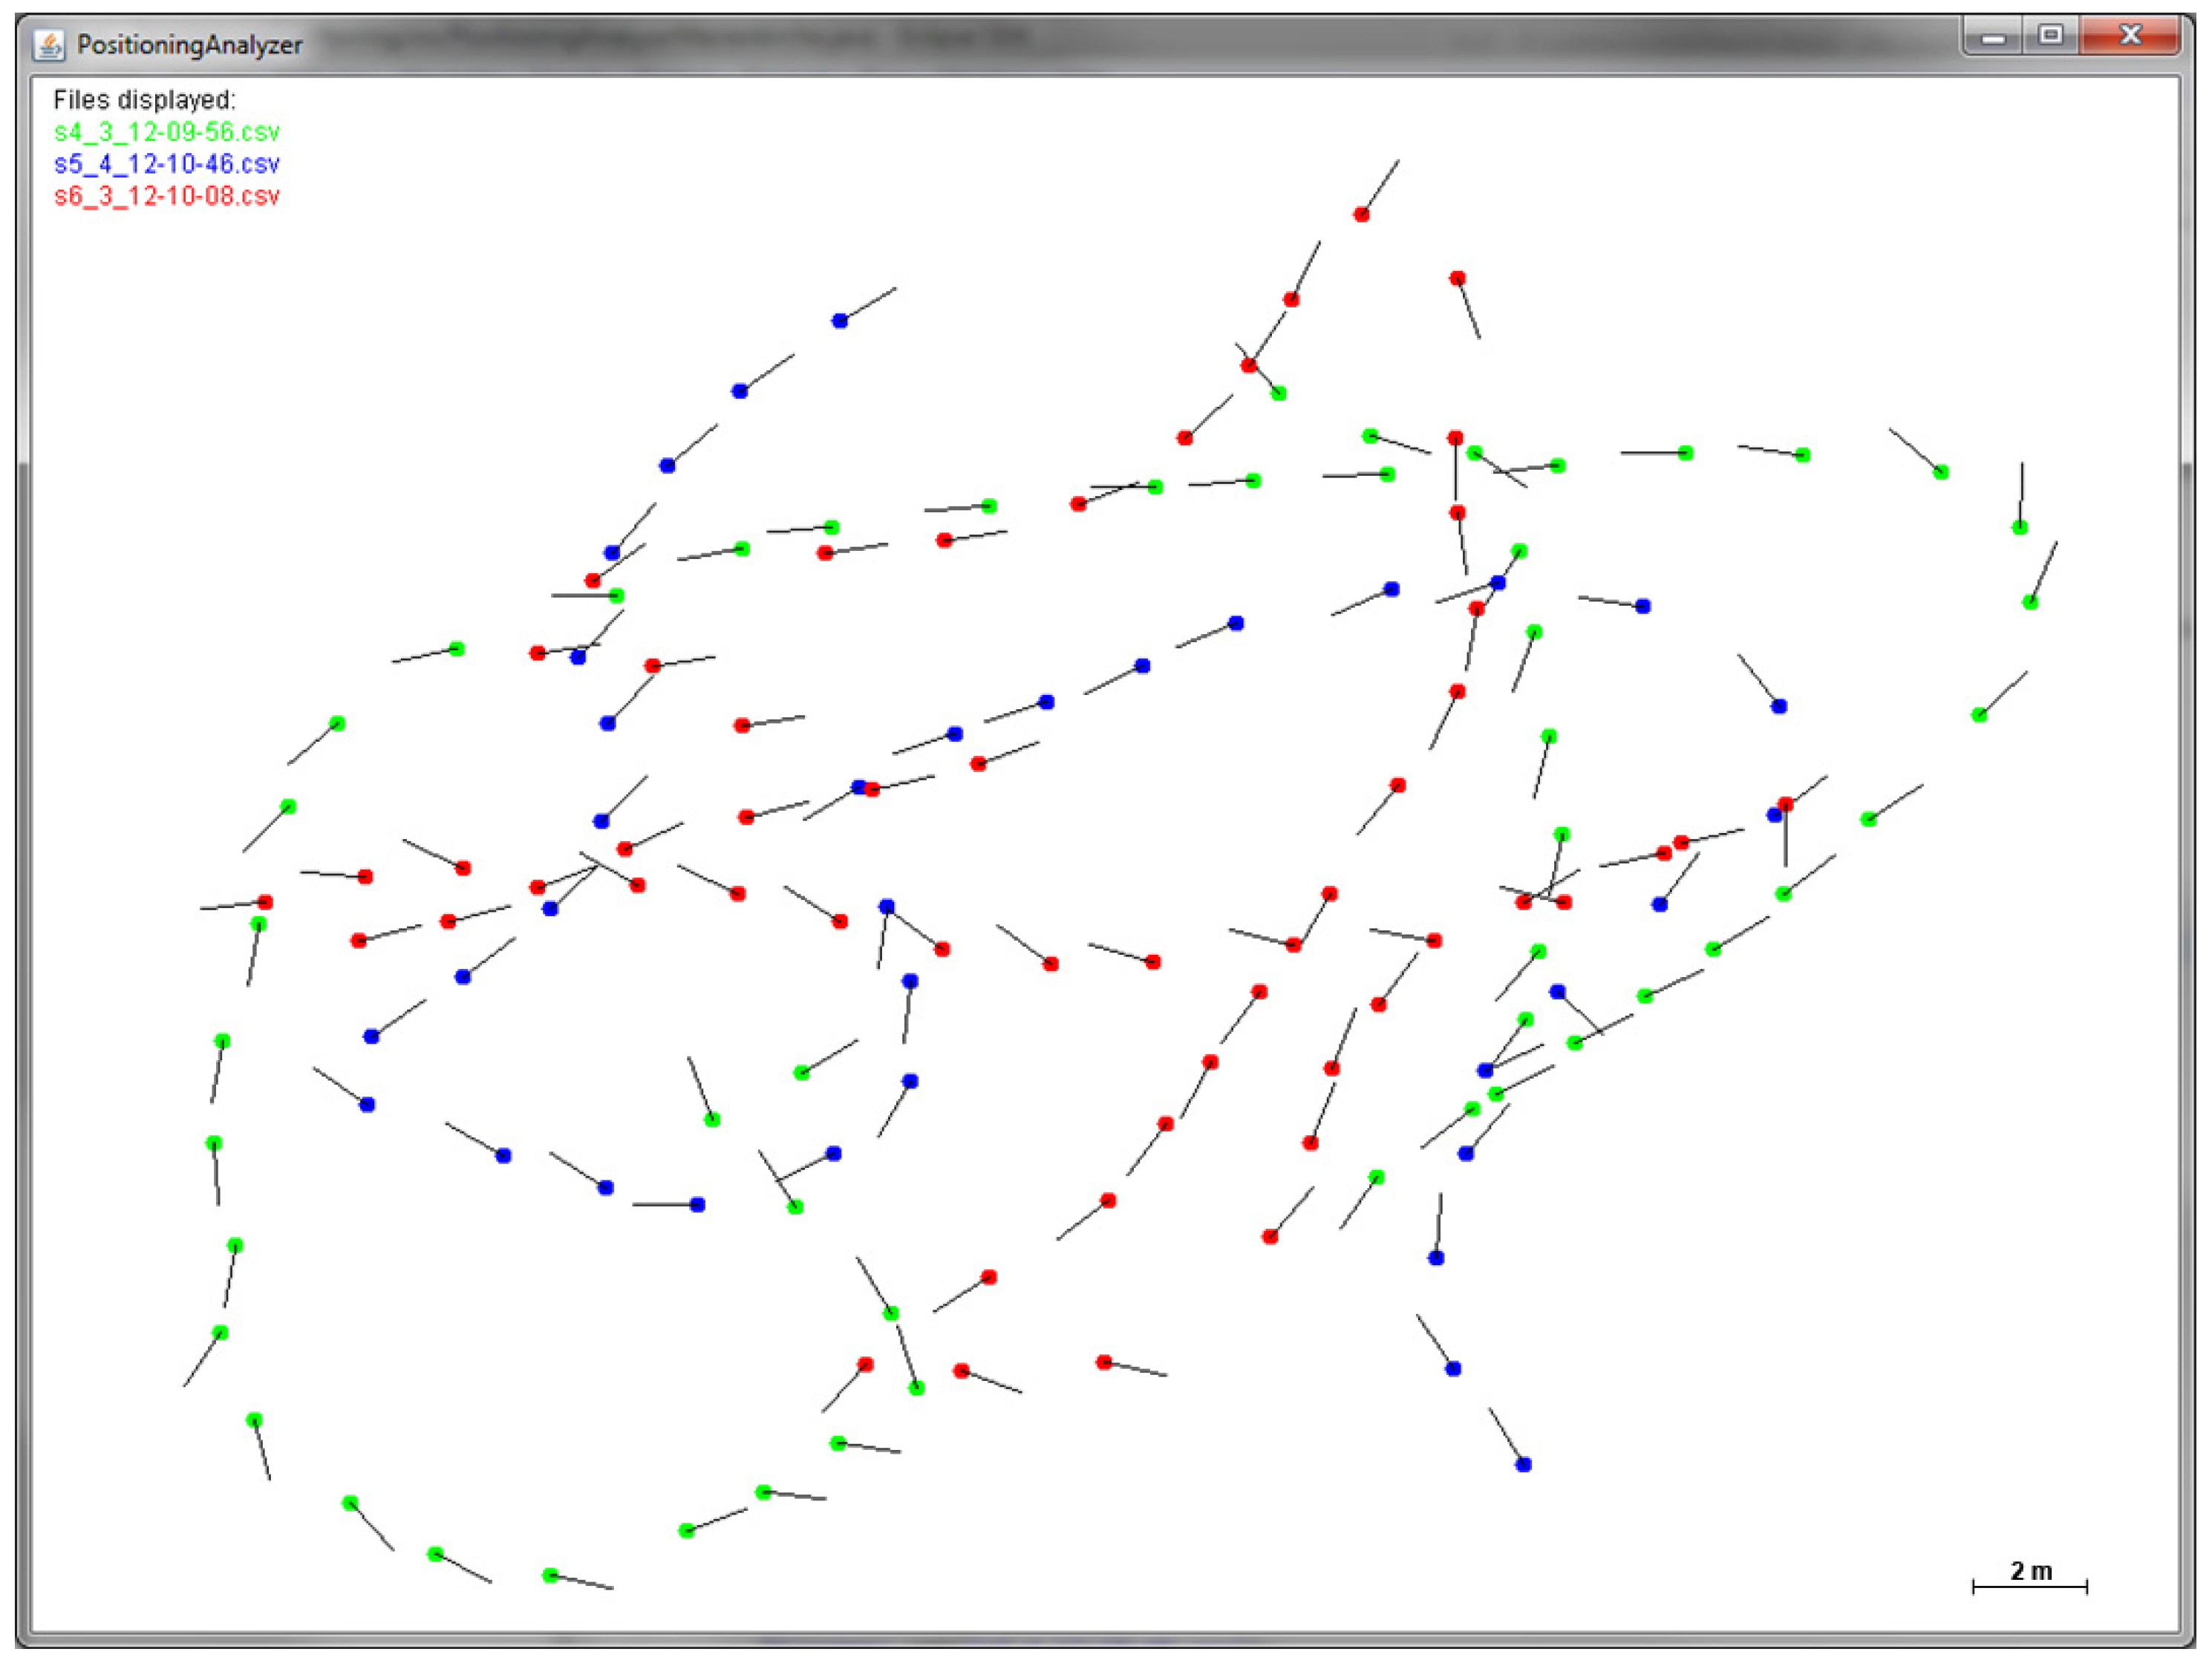
Figure 3 an exemplary dataset of recorded smartphone movement data (geographic location plus corresponding moving direction) of three different smartphone users is visualized.
Figure 3.
Visualization of movement data from three different smartphone users (green, blue, and red) derived from the internal sensor data via the Android API. The dots symbolize the GPS/GNSS location of the smartphone user. The lines point towards the corresponding movement direction of the user.
Figure 3.
Visualization of movement data from three different smartphone users (green, blue, and red) derived from the internal sensor data via the Android API. The dots symbolize the GPS/GNSS location of the smartphone user. The lines point towards the corresponding movement direction of the user.
The movement speed of the user at the specific geographic location is used to re-evaluate the image-based crowd density estimation. We assume that high movement speed is an indicator for a low crowd density whereas a slow movement speed suggests a high crowd density. Rastogi
et al. conducted a comprehensive comparison of pedestrian walking speeds based on literature from 1967 to 2007 [
14]. The values of average speed for adults vary from 1.32 m/s to 1.51 m/s. Furthermore, every study revealed significantly lower walking speeds for elderly people (generally over an age of 65 [
15]) with 0.97 m/s to 1.34 m/s. In addition, [
16] found that pedestrians in groups tend to be slower (1.54 m/s alone compared to 1.41 m/s in groups for younger pedestrians). Thus, varying circumstances have to be considered regarding the analysis of movement speed. It is especially important for major events that it is determined whether the user is only moving slowly because of a specific reason (e.g., to look for shirts at the merchandising booth or to buy something to drink), or if the user actually has to move slowly because of high crowd density. This might result in the misinterpretation of high crowd density for less crowded regions.
The smartphone app transfers the raw movement data into a spatial PostgreSQL/PostGIS database on a web server using a mobile Internet connection. Afterwards, the dataset is integrated in a GeoServer in order to be accessible via Web Map Service (WMS) and Web Feature Service (WFS) interfaces by the Open Geospatial Consortium (OGC). Thus, the data can be integrated in any processing chain or application over the Web. Above that, the data can be directly processed in the database or can be integrated in OGC Web Processing Service (WPS) processes, which is of high importance regarding the following conversion from movement speed to crowd density information.
2.3. Information Fusion
The image-based crowd density estimation and the density information derived from smartphone movement data are afterwards combined to create a cost layer for the least-cost navigation. For this purpose, the geographic information system GRASS GIS [
17] is used. GRASS GIS is highly suitable for this work as it is a) raster-based and b) supported by the Python implementation of the OGC WPS standard named pyWPS [
18]. This allows for future Web-based real-time processing of the aerial image and smartphone data.
The density layer derived from the aerial image data serves as a base layer for the raster-based least-cost routing process. For this purpose, the layer is reclassified to a range between 0.43 (no density) and 7.1 (high density). Fruin identified these values of (a) 0.43 people per m
2 (p/m
2) and (b) 7.1 p/m
2 as the crowd densities with (a) a normal walking speed and (b) no movement at all [
19]. Above that, Fruin investigated a reduced walking speed at 2.0 p/m
2, involuntary contact between people at 3.57 p/m
2, and potential dangerous crowd forces starting at 5.55 p/m
2, which are important thresholds for further evaluation of the crowd density information [
19]. Weidmann investigated the relation between the local speed and the local density of people as well and formalized it as:
where
is the speed at a certain density,
is the maximum speed at full freedom (1.34 m/s),
is an empirically derived fit parameter (1.913 p/m
2),
is the crowd density in p/m
2, and
is the crowd density at which no movement is possible anymore (5.4 p/m
2) [
20]. Wirz
et al. conducted an empirical study based on smartphone measurements to verify this relation [
21]. Based on Equation (3), the crowd density can be estimated from the smartphone data using
for each local speed
recorded with the smartphone. This smartphone-based density information is imported into GRASS GIS as well and is converted from vector to raster format in order to be combinable with the information derived from the image data. For this, the point (now the respective pixel) of the smartphone measurement is expanded so that it delivers information for the area surrounding the smartphone user as well. Thus, the people density calculated with Equation (4) is adopted for the local neighborhood of the test person as well. This is more realistic instead of using only the point measurement for the density enhancement. Otherwise, the density at the pixels next to the measurement would be totally different.
Based on the complemented density information, a least-cost layer can be calculated using the GRASS GIS function r.cost. The initial point for this calculation is the current geographic location of the user. The cumulative cost of moving from this point to each cell is calculated and stored in the resulting cost layer. Finally, the least-cost path between an arbitrary point and the current location of the user can be calculated using the function r.drain.
3. Application Scenarios
In the following, two test scenarios are outlined in which our real-time routing approach is beneficial. The first scenario describes a tool to escape from emergency situations, whereas the second scenario presents a generic decision support application that can be used in multiple situations. The “give and take” principle is essential for all applications, meaning that both the event attendee and the organizer have to deliver information to receive a result. This concretely means for our scenarios that the event attendee has to send information about their current location and speed via smartphone and the organizer has to provide an aerial imaging system covering the event area. Only if information from both sides is available can the results be provided as desired. This means that on the one hand the user can fetch an overview map of the current crowd distribution and use the least-cost routing, and on the other hand the organizer can guarantee a high security standard and use the routing app for the event’s security and rescue forces.
3.1. The Fastest Way Out of a Crowd
One application in which the real-time navigation can be used is during music festivals. The crowd in front of the music stages is often very dense. Combined with extreme weather conditions (e.g., high temperatures) and physical fatigue, this might result in dangerous situations. In such crowds there is no chance to get a full overview of the situation and to find the best way out, especially for persons with a low body height. Due to the lack of orientation, the person might go towards an even denser region within the crowd, not knowing that a free space might be very close by.
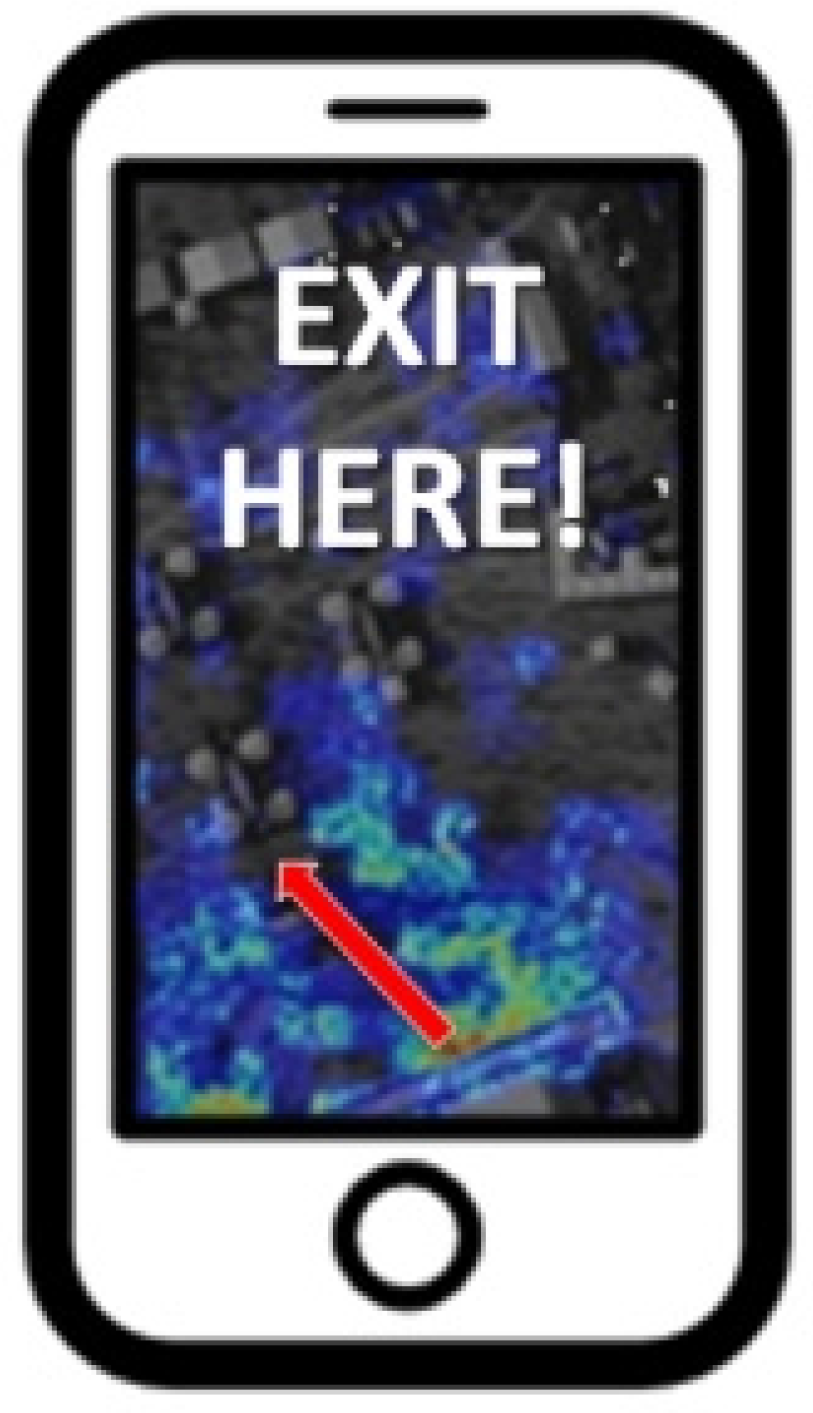
Our routing approach can be integrated in an emergency app provided by the event organizer. The guests have to provide their current location and speed measured with their smartphone. In exchange for that, they are able to view an overview map with the current crowd distribution in the event area and are able to use the described emergency navigation (
Figure 4). Additionally, the security and rescue forces of the event could directly receive the location of the visitor when the app is used. Thus, help can be on-site much earlier. The overview map has to be provided by the organizer by recording aerial imagery during the event (e.g., with helicopters, drones, or similar). It may even be possible for typical SLR cameras to be installed in high positions to cover special regions, like the space in front of the music stages, for example.
Figure 4.
Schematic representation of an emergency smartphone app. The crowd density is visualized in the background. The fastest escape route is emphasized with a red arrow.
Figure 4.
Schematic representation of an emergency smartphone app. The crowd density is visualized in the background. The fastest escape route is emphasized with a red arrow.
3.2. The Fastest Way towards a Point-of-Interest (POI)
The real-time routing approach can be adapted to any event that has appropriate image data available for the event site. In the following, this assumption is stressed for the example of football games. In this particular use case, dense crowds are gathering in short time frames (i.e., before or after the game as well as during the half-time break). A concrete example for this is reported by officials of the Borussia Park in Mönchengladbach (Germany). After the football games, the main way towards the parking spaces is commonly blocked by the police to escort the fans of the opposing team to their buses. In the meantime, many people have to wait while more and more people are streaming out of the stadium towards the parking spaces. The organizers try to avoid complications by opening gates that allow people to go the longer way around the stadium on the other side. In this situation, this way would be much faster compared to waiting in the dense crowd. However, the people that are streaming out of the stadium are often not aware of (i) the blockade by the police and (ii) the option to use an alternative way.
Our routing approach could help to ease this situation by informing and navigating some visitors to the alternative route.
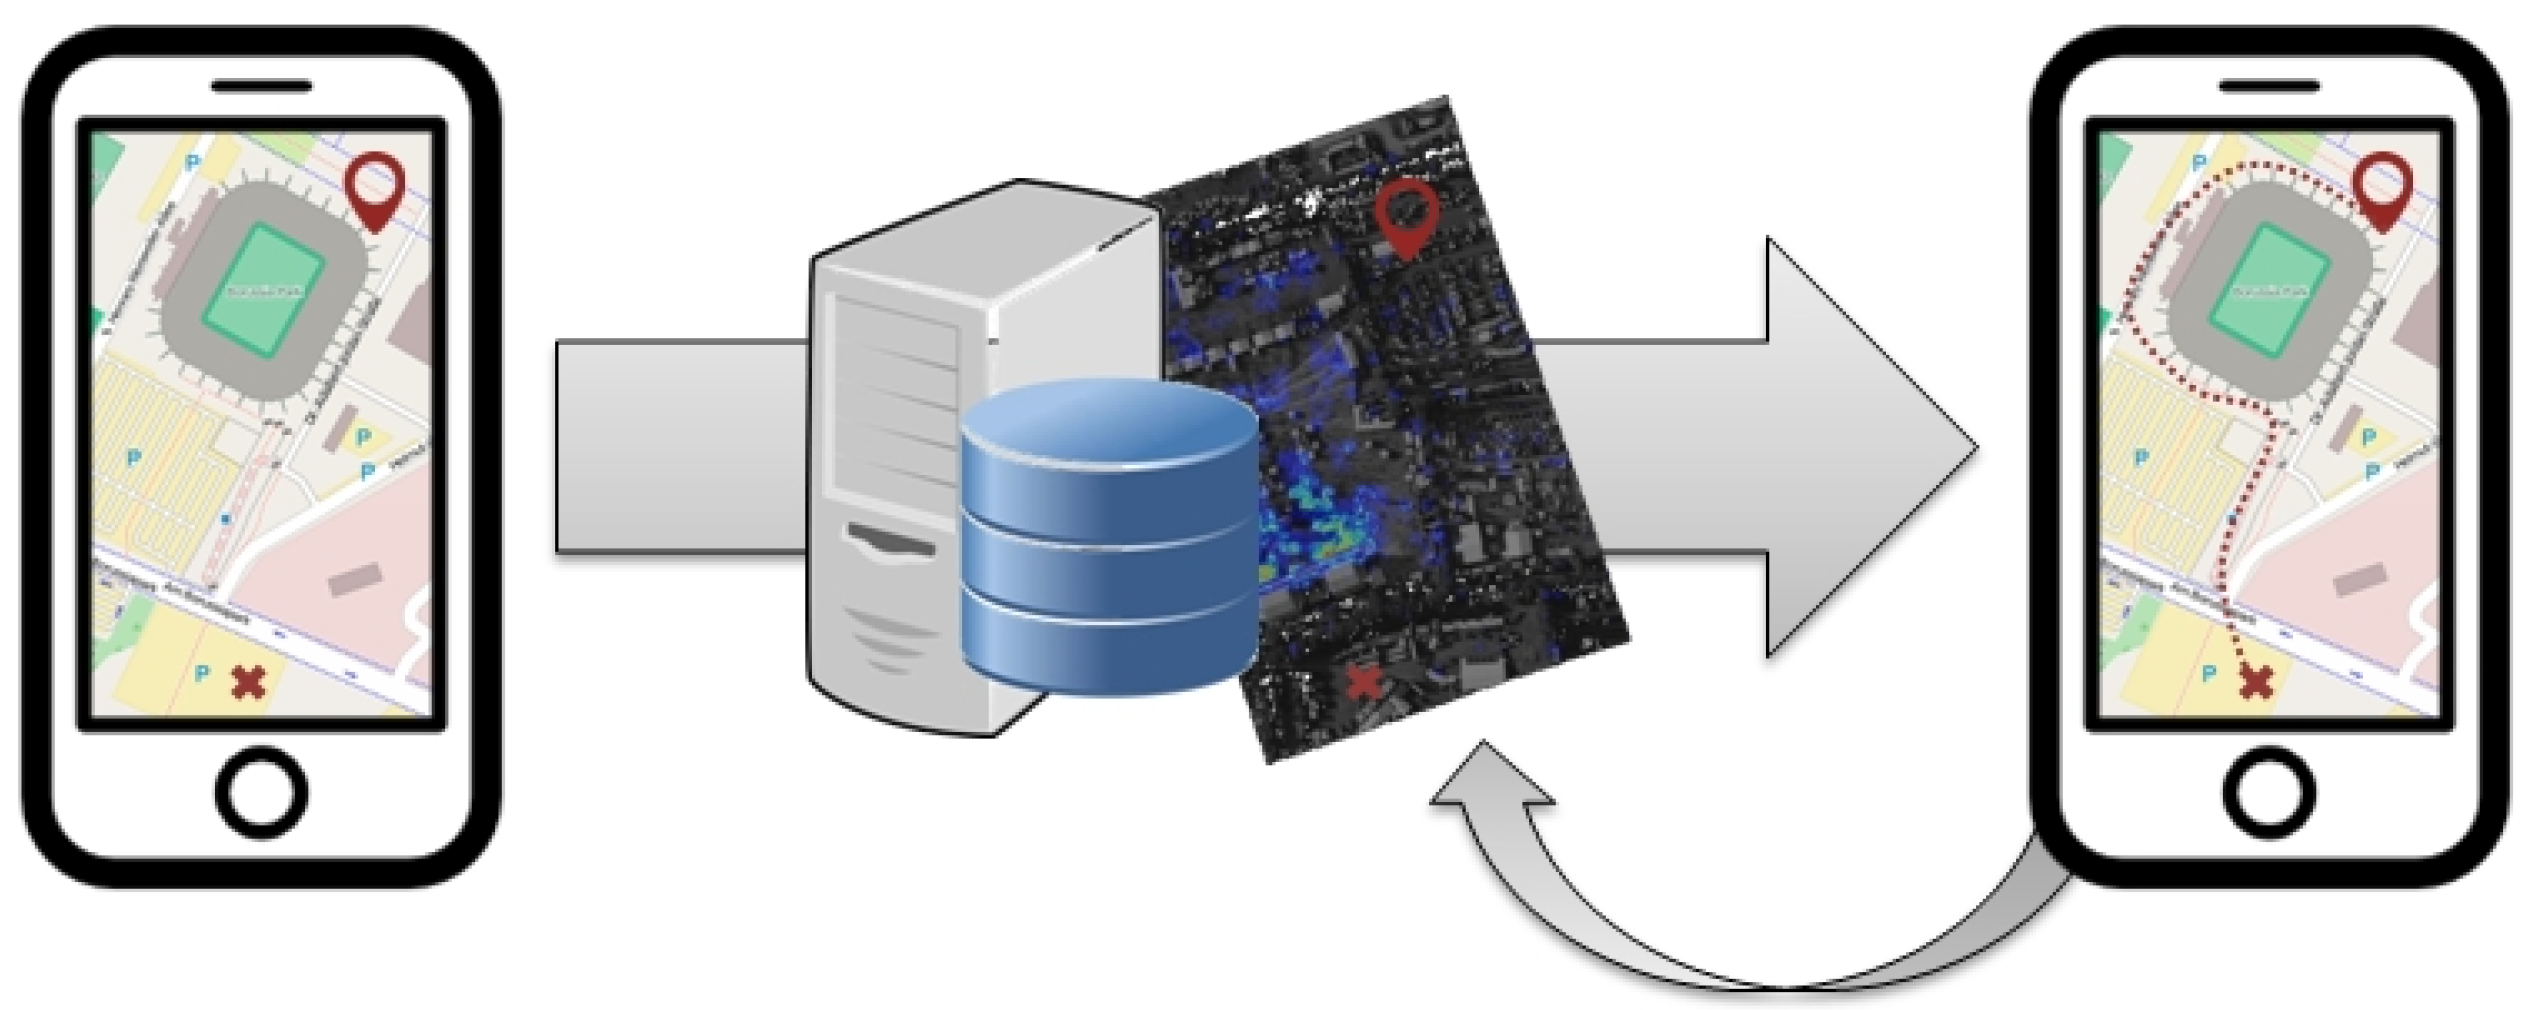
Figure 5 illustrates the generic workflow in which the user has to provide their current location along with the target of routing. This information is sent to a web server where the actual calculation for the least-cost route is executed. The resulting route is afterwards visualized on the smartphone of the user, who constantly reports (automatically in the background of the app) his location and speed. For this example, it is essential to integrate the smartphone data of as many users as possible to avoid potential jams caused by the system itself. As soon as the alternative route is crowded as well, the system carefully has to decide which direction to choose. If the main way is open again and the crowd dissolves, the navigation system routes people along the typical way. Thus, potential mass panics or at least a tremendous gathering of people can be avoided.
In general, real-time navigation based on our routing approach could be used during any major event; for example to reach the nearest refreshment shop during a musical festival or city event. Even navigation through the city streets to a specific parking garage with an emphasis on avoiding large crowds (e.g., in front of stages or booths) can be useful. In any case, the advantages are on both sides, for the event organizers and the guests. The guests utilize the tool to avoid stress, overexcitement, and anger on the one hand, while on the other hand the organizers can ensure security during the event and are able to increase the event’s attraction by providing a modern smartphone navigation app. In addition, security and rescue forces are able to utilize the app for their efforts and could reach the location of an emergency earlier.
Figure 5.
Conceptual design of a smartphone app for least-cost routing during or after a major event (in this case a football game).
Figure 5.
Conceptual design of a smartphone app for least-cost routing during or after a major event (in this case a football game).
4. Prototype Implementation
A prototype implementation based on non-real time data is conducted as a generic proof of concept for the integration of the two data sources: remote sensing and smartphone data. The test data for the prototype are recorded during the music festival Wacken in 2013 (
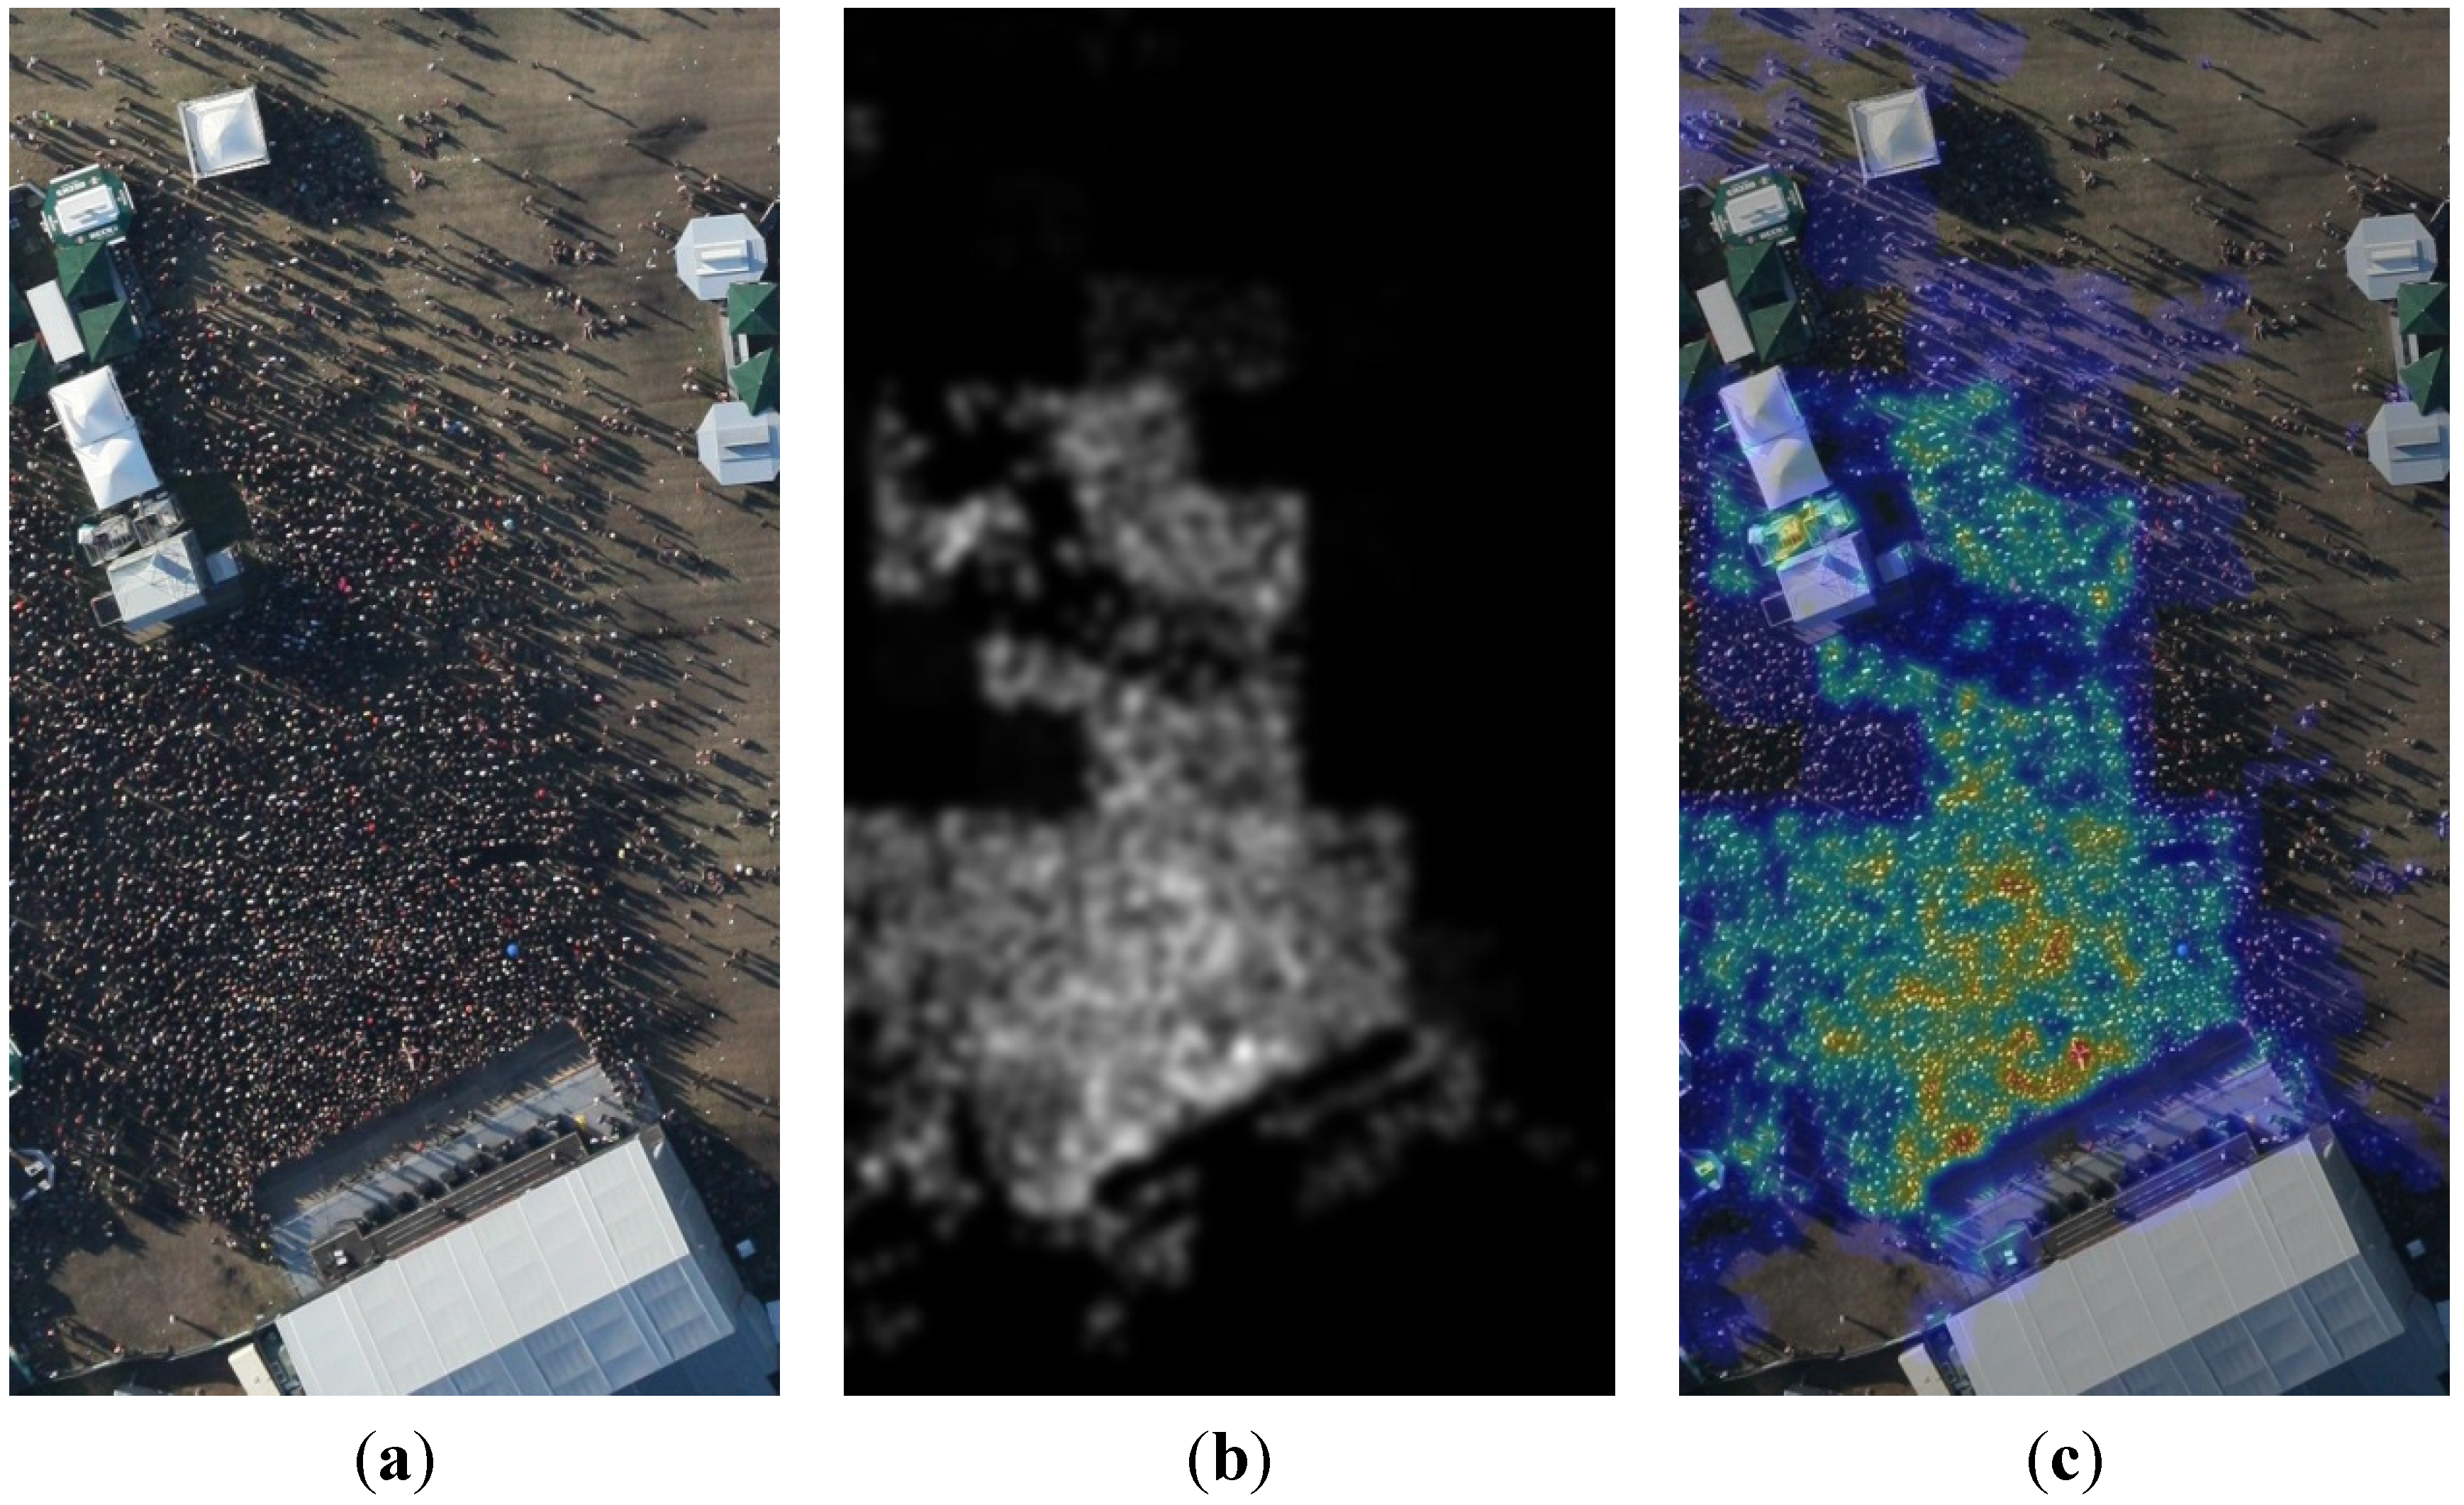
Figure 6a). One can clearly see the dense crowd standing in front of the stages. First, the crowd density is estimated using a fast multi-core C++ implementation. Consecutively, the smartphone data has to be recorded and transferred to the web server for analysis. This allows for a future real-time implementation of the concept. Finally, the calculation of the least-cost path is performed, combining both data sources in GRASS GIS.
4.1. Crowd Density Estimation in Aerial Images—Implementation Details
The density estimation step requires panchromatic aerial images with a spatial resolution of ca. 9–20 cm. Because the fusion with location data requires georeferenced and orthorectified images, a real-time orthorectification module processes every aerial image before the crowd density estimation starts. In this time-critical scenario we choose a fast GPU-supported orthorectification and georeferencing implementation [
9], which processes a typical 18-Mpix image in under 200 ms. It uses an interior parameter set determined prior to a flight campaign by a self-calibrating bundle adjustment. The system is equipped with an IGI AEROcontrol GPS/IMU unit [
22], which records the external orientation parameters for every image with a sufficient angular accuracy. In this way, no ground control points are needed, which is an important fact in this real-time scenario. Moreover, the projection step uses a digital elevation model of the Shuttle Radar Topographic Mission (SRTM) to derive the 3D world coordinates from the image coordinates. It has a resolution of 25 m and a 16-bit quantization.
The actual crowd-density estimation, consisting of the four steps described in
Section 2.1, takes the orthorectified image as an input (
Figure 6a), computes filter responses of patches at promising locations, and classifies the filter responses into the two classes “crowd” and “no-crowd.” Based on supervised learning, the classification step with an SVM needs initial training. To this end, the SVM is trained with roughly 10,000 image patches; each has a size of 64 by 64 pixels. Concretely, for training, one patch is convolved with 24 Gabor filters, consisting of S = 4 scales and K = 6 orientations (see
Section 2.1.2 for details). Each filter has a width of 48 pixels. The resulting 24 mean values and 24 variances of each filter response are then used as the final 48-dimensional feature vector, representing one image patch and being the input for the training of the SVM. Of course the computationally intense training can be done offline.
Figure 6.
Image (a) shows a subset of an unprocessed aerial image from a music festival with a dense crowd standing in front of a stage. Image (b) is the computed crowd density layer as a gray value image (black = low density, white = high density). For illustration purposes we created a composite image (c), where the density is laid onto the original image (blue = low density, red = high density).
During the event, under real-time conditions, the filtering is performed in parallel on several patches using C++ with OpenMP. The efficient libSVM library is then able to produce the results almost immediately. Finally, the succeeding Gaussian filtering (
Section 2.1.4) produces a grey-value 8-bit image of the same size as the original input image, where an intensity value of zero corresponds to a very low crowd density and a value of 255 corresponds to the highest measured crowd density (
Figure 6b).
Figure 6c illustrates the calculated density information from low (blue) to high (red) with the orthorectified image in the background. This image serves as the interface with the GRASS GIS system and provides the basis for the least-cost routing.
4.2. Calculating the Least-Cost Path using GRASS GIS
The density layer and the smartphone information are imported into GRASS GIS to perform the least-cost calculation. In a first step, a cumulative cost layer is created based on the current location of the user using
r.cost. For testing purposes, a position in front of the stages in a highly crowded area is assumed. The cumulative costs can then be used to navigate to a defined point or to navigate towards a less dense area out of the crowd. For the latter case, a point within a less dense area has to be identified using, for example, a nearest point functionality. If the destination of the routing is known, the least-cost path can be calculated using
r.drain. An exemplary result can be seen in the left image of
Figure 7.
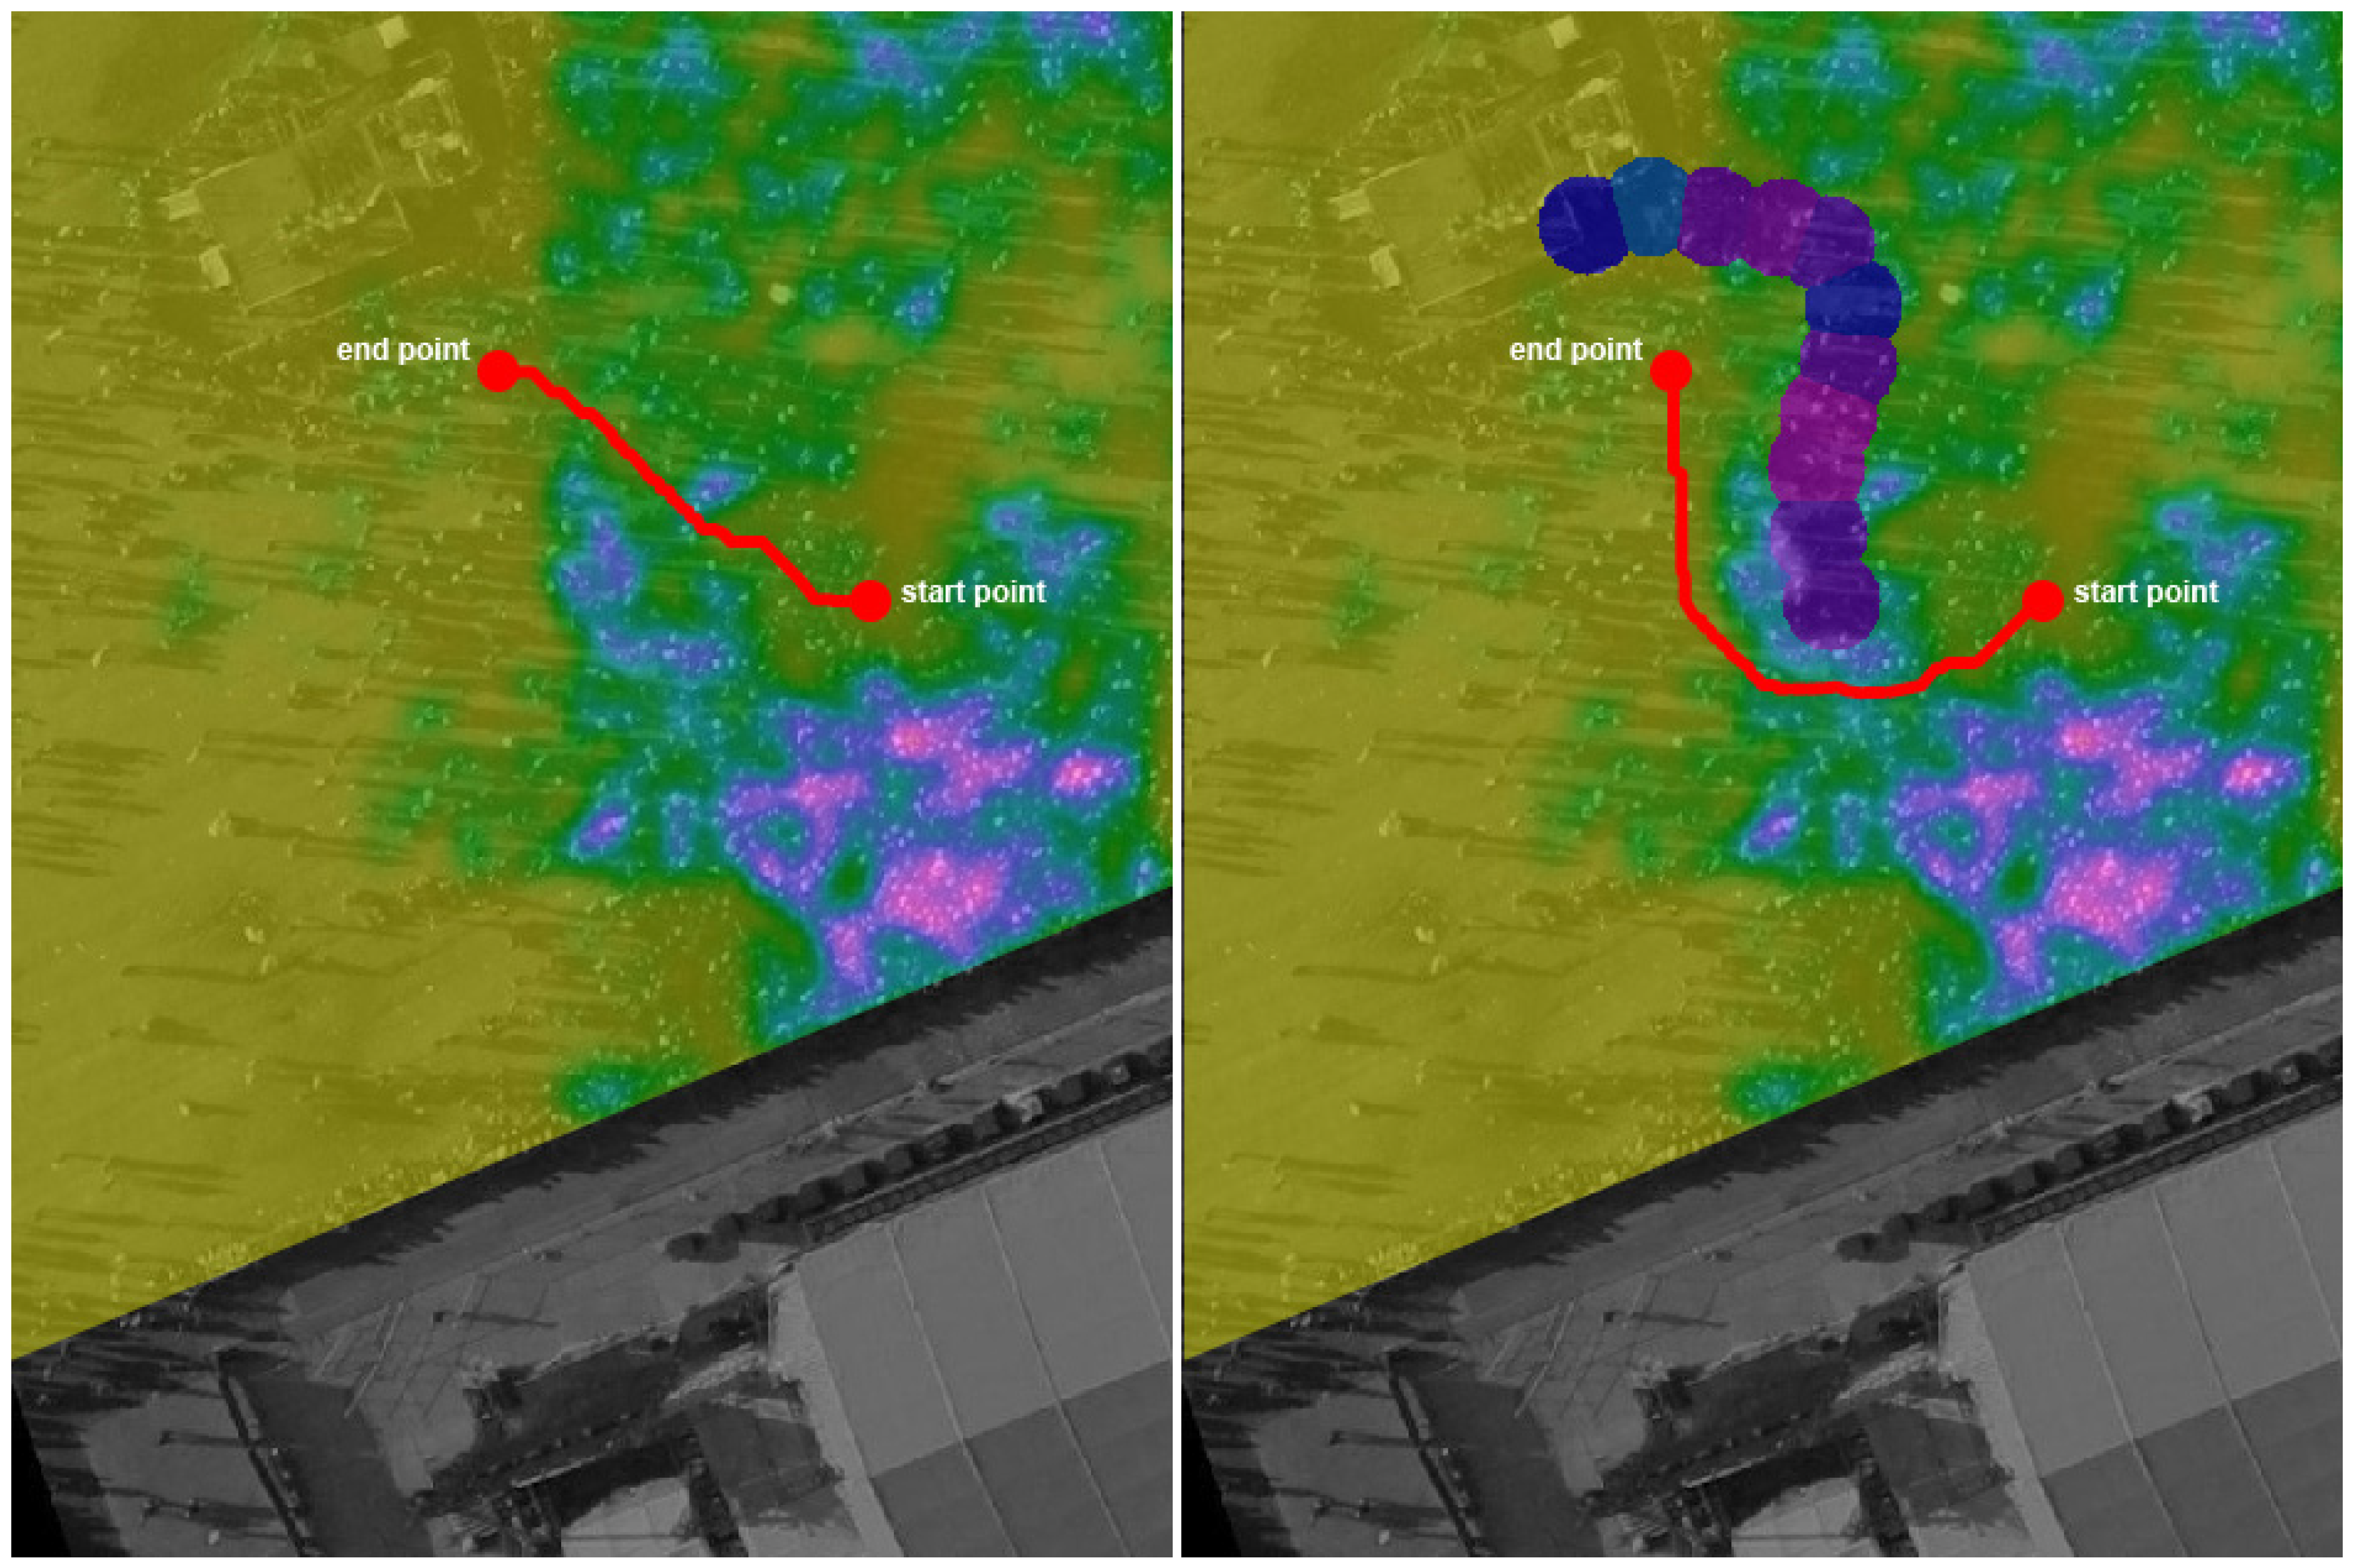
Figure 7.
Resulting least-cost paths (red line) based on the original cost layer derived from the aerial image only (left) and with the additional cost information (circles) derived from smartphone sensor data (right). The background consists of the two cost layers over the corresponding aerial image scene. One main stage of the music festival is located in the lower right of both images.
Afterwards, the costs derived from the smartphone data are fused with the cost layer derived from the aerial images. As the aerial information might be obsolete, the smartphone data indicate a high crowd density where the original path (left image in
Figure 7) is located. Thus, an updated least-cost path is calculated based on the new cost information (see right image in
Figure 7). It can be seen that the route for the user has changed significantly compared to the result shown in the left image because of the added cost information derived from smartphone movement data. Instead of moving away from the dense crowd, which is the typical behavior (e.g., in a stress situation), the new calculation suggests that the user move sideways straight through a medium-density crowd to reach a free space much faster.
5. Conclusions and Outlook
In this paper, we proposed a least-cost navigation based on the fusion of real-time aerial image data and smartphone sensor data. The image data are used to estimate an extensive crowd density map. For this purpose, a patch-based approach with a Gabor filter bank for texture classification in combination with an interest point detector and a smoothing function is applied. The GPS/GNSS location information and the current movement speed of a user are gathered with a smartphone app. Thereafter, the in situ crowd density is estimated based on the smartphone information and allows for enhancement of the overall density information. Finally, a least-cost routing is performed based on the composed density information using GRASS GIS.
Two possible applications for the integration of our navigation approach are presented. The emergency application can support people who want to quickly escape from a dense crowd (e.g., during a music festival). Above that, the routing approach in general can help in various situations, for example after a football game where certain routes are blocked by the police.
To exploit the real benefit of the least-cost approach, it is necessary that it can be conducted in real time. This means that as a first step, the information from both data sources (image and smartphone) has to be accessible in real time. This can be achieved via existing standards of the OGC like the WMS, the WFS, or the Web Coverage Service (WCS). Furthermore, the processing of the data and the calculation of the cost layer as well as the least-cost path estimation have to be available in real time. Using GRASS GIS, all processing steps presented in this paper can be integrated in a web-based infrastructure to enable the actual real-time usage as a navigation application.
Overall, it can be stated that the advantages of our approach are twofold, both for the event organizers and the event attendee. The guests can use the tool to avoid stress, overexcitement, or anger, whereas the organizers can raise the security level of the event and increase its attraction at the same time by providing a modern smartphone navigation app. In addition, security and rescue forces are able to utilize the app for their efforts and could reach the location of an emergency faster.
Future work will be the real-time implementation of our routing approach by bringing together aerial imagery and smartphone movement data in real time during a major event. In addition, the transition from routing to navigation according to the presented application scenarios has to be the subject of future research.


